
COMMISSION STAFF WORKING DOCUMENT Assessment … · COMMISSION STAFF WORKING DOCUMENT Assessment of...
46
EN EN EUROPEAN COMMISSION Brussels, 29.5.2013 SWD(2013) 375 final COMMISSION STAFF WORKING DOCUMENT Assessment of the 2013 national reform programme and stability programme for SLOVAKIA Accompanying the document Recommendation for a COUNCIL RECOMMENDATION on Slovakia’s 2013 national reform programme and delivering a Council Opinion on Slovakia’s stability programme for 2012-2016 {COM(2013) 375 final}
Transcript of COMMISSION STAFF WORKING DOCUMENT Assessment … · COMMISSION STAFF WORKING DOCUMENT Assessment of...

EN EN
EUROPEAN COMMISSION
Brussels, 29.5.2013 SWD(2013) 375 final
COMMISSION STAFF WORKING DOCUMENT
Assessment of the 2013 national reform programme and stability programme for SLOVAKIA
Accompanying the document
Recommendation for a COUNCIL RECOMMENDATION
on Slovakia’s 2013 national reform programme and delivering a Council Opinion on Slovakia’s stability programme for 2012-2016
{COM(2013) 375 final}
2
CONTENTS
Executive summary .................................................................................................................... 3
1. Introduction.................................................................................................................. 5
2. Economic developments and challenges...................................................................... 6
2.1. Recent economic developments and outlook............................................................... 6
2.2. Challenges .................................................................................................................... 7
3. Assessment of policy agenda ....................................................................................... 9
3.1. Fiscal policy and taxation............................................................................................. 9
3.2. Financial sector .......................................................................................................... 20
3.3. Labour market, education and social policies ............................................................ 21
3.4. Structural measures promoting growth and competitiveness..................................... 25
3.5. Modernisation of public administration ..................................................................... 29
4. Overview table ........................................................................................................... 32
5. Annex ......................................................................................................................... 35

3
EXECUTIVE SUMMARY
Economic Outlook
After holding up well in 2012, the global downturn started to take its toll on the Slovak economy in 2013. After experiencing one of the strongest post-crisis recoveries in the EU, growth slowed to 2% in 2012, held up by net exports. According to the Commission's spring 2013 forecast, GDP is expected to decelerate to 1% in 2013 before rebounding to 2.8% in 2014. The situation in the labour market is not set to improve, however, with unemployment expected to stay above 14% in 2013 and 2014. Inflation, which rose to 3.7% in 2012, is set to stabilise at close to 2% in 2013 and 2014, mainly on the back of lower domestic demand.
Slovakia's general government deficit is projected to improve, while the public debt remains on the rise. According to the Commission's forecast, the deficit is forecast to decline to 3% of GDP in 2013 from 4.3% of GDP in 2012. In 2014, the deficit would increase slightly to 3.1 % of GDP despite a pick-up in economic activity. The structural budget deficit is projected to fall from 4.1% of GDP in 2012 to 3% in 2013 and 2.4% in 2014. In 2010-2013 the adjusted annual average fiscal effort is estimated to have reached 1.4% of GDP a year (above the 1% of GDP recommended under the EDP). Slovakia confirmed its medium-term objective at -0.5% of GDP in structural terms. The government debt is forecast to remain below the 60% reference value, reaching 54.6% in 2013 and 56.7% in 2014.
Key Issues
Slovakia is at a crossroads. For well over a decade, its growth rates were amongst the highest in the EU and it experienced one of the speediest recoveries from the financial crisis. But with real GDP growth rate expected to remain below the pre-crisis levels and persistently high unemployment, it must strengthen domestic production and diversify sources of growth, whilst building on progress made in terms of structural reforms and public finances.
In the last year, Slovakia has made progress on fiscal and structural policies. The budget deficit is on a downward path after the adoption of a sizeable consolidation package. There was a major pension reform to increase the statutory retirement age in line with life expectancy. An action plan to combat tax fraud was also adopted. Reforms to boost employment and growth have been launched but remain at an initial stage, particularly those that tackle public administration reform, vocational education and public employment services.
Despite the progress made, more needs to be done in the medium to long term to bolster growth potential and ensure that public finances are sustainably managed. Further progress is needed on labour market, energy and public administration. The efficient use of EU structural funds will be crucial in financing key reforms to increase growth potential in many areas.

4
• Public finances: Considerable progress was made in recent years in terms of fiscal consolidation, though some measures are temporary or one-off and will need to be replaced. Much can be gained by broadening the tax base, improving tax collection and making expenditure more efficient, especially healthcare expenditure. Despite the positive effects of the recently adopted pension reform, there is still a gap between revenue and future age-related spending. Building on the recent adoption of an action plan to reduce tax fraud, efforts need to continue in this area and be underpinned by a comprehensive tax compliance strategy going beyond VAT. An expenditure review could reduce inefficiencies and reallocate spending to areas with greater growth potential.
• Labour market: The steep increase in unemployment in the wake of the crisis (14% in 2012) requires action to strengthen education and ensure that unemployed people – especially young unemployed people (34% in 2012) – are helped back to work. Long-term unemployment is amongst the highest in the EU at 9.4% of the labour force, while employment rates for low-skilled workers are among the lowest. Despite some recent improvements in the design of the Slovak tax and benefits system, the tax wedge for the unemployed taking up a low-paid job remains large. The shortage of good quality, affordable early childhood education and care is an obstacle to female participation in the labour market (which stood at 57.3% in 2012). The integration of the Roma population into the labour market is very limited (the Roma unemployment rate is between 2 and 8 times higher than the non-Roma unemployment rate) and the participation of Roma children in early childhood education and care is very low (77.5% compared to an EU average of 92.5%).
• Public administration: Several measures were adopted to make public procurement and the judiciary more transparent. Nevertheless, experience with implementing EU structural funds suggests that there are still problems in this area. Weaknesses also persist in the functioning of public institutions, law enforcement and the business environment. Better use could be made of EU funds available to finance educational reforms and improve the quality of the science and technological base.
• Energy: Effective competition and the transparency of price-setting mechanisms in regulated industries could be improved, notably in the energy sector, where consumers’ switching rates are low and unregulated electricity prices for medium-sized industrial consumers were the fifth highest in the EU in 2011. This is cause for concern given the high energy intensity of the economy.

5
1. INTRODUCTION
In May 2012, the Commission proposed a set of country-specific recommendations (CSRs) on economic and structural reform policies for Slovakia. On the basis of these recommendations, the Council of the European Union adopted seven CSRs in the form of a Council Recommendation. These CSRs concerned public finances, taxation, the labour market, education, vulnerable groups and public administration. This Staff Working Document (SWD) assesses the state of implementation of these recommendations.
The SWD assesses policy measures in light of the findings of the Commission’s 2013 Annual Growth Survey (AGS)1 and the second annual Alert Mechanism Report (AMR)2, which were published in November 2012. The AGS sets out the Commission’s proposals for building the necessary common understanding about the priorities for action at national and EU level in 2013. It identifies five priorities to guide Member States towards renewed growth: implementing differentiated, growth-friendly fiscal consolidation policies; restoring normal lending to the economy; promoting growth and competitiveness for today and tomorrow; tackling unemployment and the social consequences of the crisis; and modernising public administration. The AMR was used to determine whether macroeconomic imbalances exist or risked emerging in Member States. It found positive signs that macroeconomic imbalances in Europe were being corrected. To ensure that a complete and durable rebalancing is achieved, 14 Member States were selected for a review of developments in accumulating and unwinding imbalances.3
Against the background of the 2012 Council Recommendation, the AGS and the AMR, Slovakia presented updates of its national reform programme on 24 April 2013 and of its stability programme on 30 April 2013. These programmes provide detailed information on progress made since July 2012 and on the government’s future plans. They also provide the basis for the assessment in this SWD.
The programmes submitted were the subject of a consultation process, which was publicly accessible. The preparation of the national reform programme involved the Council for Solidarity and Development, which encompasses a broad range of stakeholders. The stability programme is sent for information to the Parliament, while the economic parliamentary committee discusses the national reform programme.
Overall assessment
The analysis in this SWD leads to the conclusion that Slovakia has made some progress on measures taken to address the CSRs of the Council Recommendation.
1 COM(2012) 750 final. 2 COM(2012) 751 final. 3 The conclusions of these reviews were published on 10 April 2013. See COM(2013) 199 final.
6
Regarding fiscal consolidation, taxation and the long-term sustainability of public finances, a sizeable consolidation package, an action plan to combat tax fraud and an important reform to reduce the long-term financing gap of the pension system have been adopted during the last 12 months.
Progress has also been achieved in implementing the CSRs on labour market policies, education and the public administration. The youth action plan has been launched, amendments to the acts on vocational education and training (VET) and higher education (HE) have been adopted in 2012 and a reform of public administration was recently launched. Only limited progress has been made on implementing the 2012 CSR on marginalised Roma communities.
Despite the progress made, more needs to be done in all of these areas and the challenges identified in July 2012 remain. In the short term, the main challenge is to ensure that the fiscal consolidation strategy is sustainable while implementing measures for a return to growth and job creation, in particular by improving public administration, public employment services and the capacity to efficiently use EU funds. In the medium term, continuing efforts to improve the quality of education, institutions and the business and regulatory environment and to improve tax compliance and broaden the tax base will be instrumental in fostering and sustaining economic and employment growth.
Slovakia’s policy agenda is relevant and addresses most of challenges identified in last year’s Staff Working Document. The two documents are fully aligned with each other. The national reform programme reiterates the commitments made by the authorities to tackle the problems in the labour market and to improve the education system and the business environment, with a special focus on public administration. In the stability programme, Slovakia confirms its commitment to meeting the requirements under the Excessive Deficit Procedure, improving tax collection and continuing consolidation over the programme period so as to converge towards the medium-term objective in line with the Stability and Growth Pact. Sometimes, however, the measures planned do not address the challenges in a comprehensive way.
2. ECONOMIC DEVELOPMENTS AND CHALLENGES
2.1. Recent economic developments and outlook
Recent economic developments
After holding up well in 2012, in early 2013 the Slovak economy started to feel the toll of the protracted global economic uncertainty and a weaker external environment. Having experienced one of the strongest post-crisis recoveries in the EU, the Slovak economy maintained momentum in 2012, with real GDP growing by 2 %. The situation in the labour market, however, did not improve. The unemployment rate increased to 14 %, partly reflecting GDP growth below the level historically associated with falling unemployment. Economic growth was entirely driven by net exports, boosted by a major increase in production in the automotive industry. Import growth remained subdued as domestic demand

7
contracted. Private consumption and household real disposable income continued to decline in real terms. After a spike in 2011, investment also dropped. Production declined by around 10 percentage points (pps) in the construction sector, with companies putting investment decisions on hold because of the uncertain economic outlook.
Economic outlook
According to the Commission’s 2013 spring forecast, economic activity will remain weak in 2013 but should pick up in 2014. With no further expansion of car production planned for 2013, export growth is expected to decelerate in the first half of the year yet to continue to support growth in 2013 as a whole. After a negative contribution to real GDP growth in 2012, domestic demand is expected to remain subdued in 2013 and to contribute significantly to growth only in 2014. GDP growth is hence forecast to decelerate to 1 % in 2013, and there are downside risks given weak external demand and the reliance of the economy on a few cyclically-sensitive sectors. With external demand expected to pick up in the second half of the year, consumer confidence and domestic demand growth are forecast to gradually strengthen in 2014, underpinning a rebound in GDP growth to 2.8 %. This scenario builds on the assumption that the relatively high profitability of Slovak corporates and the growing size of manufacturing clusters will help attract fresh investment.
The unemployment rate is set to remain above 14 % up to the forecast horizon, some 4 pps above its pre-crisis level. With a large and increasing pool of resources sitting idle, household real disposable income is expected to stagnate in 2013. Households are nonetheless expected to offset a further drop in consumption by drawing on their savings. In line with developments in the labour market, unit labour cost growth is expected to remain low. Inflation is therefore set to stabilise at close to 2 % due to low domestic demand pressures and imported inflation, as well as the fading out of base effects from previous price shocks.
The macroeconomic scenario underlying the SP and NRP is plausible. It projects a pick-up in economic activity from 1.2 % in 2013 to 2.9 % in 2014. This is comparable with the Commission’s spring forecast, which projects real GDP growth of 1.0 % and 2.8 % in respective years. While the two forecasts differ in terms of composition of growth in 2013 (i.e. the Commission forecast projects a larger contribution from net exports), both expect a balanced contribution of domestic demand and net exports to growth in 2014. The macroeconomic scenario of the SP/NRP does not include estimates of the macroeconomic impact of structural reforms.
2.2. Challenges
Slovakia continues to face significant structural challenges and challenges with regard to public finances. The overriding challenge is to strengthen its domestic production base and progressively diversify sources of growth, whilst consolidating the progress made so far on structural reforms and public finances. This challenge, highlighted in the 2012 SWD for Slovakia, remains critical.

8
The public finance situation has improved but there are still concerns about the sustainability of the adjustment in the medium term. Some of the measures adopted to consolidate public finances, though serving the immediate purpose of reducing the budget deficit, are temporary or one-off and will need to be progressively replaced with more structural measures. In addition, the progress on improving pension sustainability will need to be followed up and complemented with healthcare reform to bring public finances on a sustainable footing.
Given the need to support continuing economic convergence through expenditure in key areas such as education, innovation and transport infrastructure, a key challenge is to acquire additional resources by broadening the tax base and limiting the scope for tax fraud and evasion. To maximise the positive structural impact, greater recourse to taxes that are less detrimental to growth, such as property and environmental taxation, is needed. Building on the recent adoption of an action plan to reduce tax fraud, efforts need to continue in this area and be underpinned by a comprehensive tax compliance strategy going beyond VAT fraud. Additional cuts in capital expenditure would be detrimental to Slovakia’s infrastructure, undermining the economy’s long-term growth prospects. An expenditure review could help reduce inefficiencies and reallocate spending to areas with greater growth potential.
As high unemployment persists amid clouded labour market prospects, the risk that the recent cyclical surge in unemployment becomes a structural one is sharply increasing, with young people among those most affected. School-to-job transition is weak and the education system does not respond readily to labour market needs. Long-term unemployment remains among the highest in the EU, partly reflecting large regional disparities. Public employment services do not have sufficient capacity to provide personalised services to jobseekers and to assess the effectiveness of active labour market policies (ALMPs). Employment of the low-skilled also remains among the lowest in the EU. Despite some recent improvements in the design of the Slovak tax and benefits system, the tax wedge for the unemployed taking up a low-paid job remains large. The persistent shortage of good quality, affordable early childhood education and care is an obstacle to female participation in the labour market. Despite the projected increase in retirement age, more remains to be done to increase the employability of older workers and access to lifelong learning is insufficient. The integration of the Roma population into the labour market is very limited. The participation of Roma children in early childhood education and care is very low.
A further key challenge in terms of supporting growth and competitiveness in the medium term relates to strengthening institutions, human capital, innovative capacity and the business environment. Despite the recent adoption of several measures to make public procurement and the judiciary more transparent, experience of implementing EU structural funds suggests that there are still problems in this area. Weaknesses also persist in the functioning of public institutions, law enforcement and the business environment. The political cycle has a high impact on staff turnover in public administration, capacities for evidence-based policy-making are not sufficiently developed, there is no clear framework

9
regulating lobbying activities, perceived judicial independence is low and judicial and enforcement proceedings are long. With regard to human capital, the per capita funding of education favours quantity over quality and the proportion of funding allocated to teaching activities (teachers, material, and equipment) is low by international comparison. Better use could be made of EU funds available to finance educational reforms and improve the quality of the science and technological base. Effective competition and the transparency of price-setting mechanisms in regulated industries could be improved, notably in the energy sector where consumers’ switching rates are low and unregulated electricity prices for medium-sized industrial consumers are among the highest in the EU. This is cause for concern given the high energy intensity of the economy. It also suggests that gains from improvements in energy efficiency would be considerable.
3. ASSESSMENT OF POLICY AGENDA
3.1. Fiscal policy and taxation
Budgetary developments and debt dynamics
Slovakia’s fiscal targets meet its obligations under the Pact. The stability programme defines the general goal of the government’s fiscal policy as achieving a fiscal position that ensures long-term sustainability of public finances. To achieve this goal, the government confirms the target of reducing the headline deficit below the 3 % of GDP reference value in 2013, as recommended by the Council on 2 December 2009 under the Excessive Deficit Procedure (EDP). After 2013, the stability programme envisages further reductions in the deficit consistent with reaching its medium-term objective (MTO) confirmed at 0.5 % of GDP in cyclically adjusted terms net of one-off and temporary measures. The MTO reflects the objectives of the Pact. It is to be reached by 2018, outside the programme period.4
The government’s deficit target for 2012 was overachieved. The general government outturn in 2012, a deficit of 4.3 % of GDP, was some 0.3 percentage point lower than envisaged in the 2012 stability programme. It resulted from the combination of revenue measures adopted by the government in the course of the year as well as a lower-than-budgeted drawdown of EU funds, non-budgeted revenue, lower investment by local governments and savings on social insurance expenditure. One-off measures that improved the revenue outturn included a one-off bank levy, special levy on high-profit enterprises operating in a regulated environment and the opening of the statutory fully funded pension pillar, which enabled pension savers to move their savings to the public pension scheme. The resulting net savings more than offset the deficit-increasing impact of substantial revenue shortfalls (especially for VAT) and a higher-than-budgeted assumption of past hospital debts.
The programme envisages further reduction of the headline deficit to 2.9 % of GDP in 2013. This is to be achieved mainly through a combination of temporary and permanent
4 The programme also presents a table with the convergence path towards the MTO.

10
revenue measures (expected to induce an increase in the revenue ratio by 1 pp to 34.1 % of GDP) as well as some expenditure cuts (expenditure is to decline by 0.4 pp to 37 % of GDP).5 Measures with a one-off effect constitute almost a third of all planned revenue measures. These include enabling pension savers to move their assets from the statutory fully funded pillar to the public pension scheme, extra dividends from state-owned companies, the sale of part of the emergency oil stocks (on the revenue side), and the sale of the frequency band freed up by eliminating analogue broadcasting (which is accounted for as an expenditure reducing measure). Furthermore, substantial reductions in expenditure would come from local governments and budgetary entities not under the direct control of central government. The Commission’s spring forecast projects a slightly higher general government deficit of 3.0 % of GDP in 2013, partly because some envisaged savings were deemed not to be fully attainable.
The budgetary targets in 2014 and beyond are not sufficiently underpinned by specified measures. The government plans further consolidation after 2013, with a view to progressively lowering the headline deficit, to reach 1.3 % of GDP in 2016. Compared to the 2012 stability programme, these targets are slightly less ambitious and they rely on expenditure restraint, with the expenditure-to-GDP ratio projected to decline faster (by some 3 pps) between 2013 and 2016 than the revenue-to-GDP ratio (set to fall by 2.4 pps). The adjustment appears to be back-loaded. The programme intends to reach the 2014 headline deficit target through a combination of actions, including an additional sale of emergency oil stocks, a freeze in public wages at the 2013 level and a reduction in subsidies — mainly those granted by local authorities to local public transport. The one-off additional sale of the emergency fuel stock would constitute the major part of the consolidation. Moreover, additional and as yet unspecified measures would still be necessary to reach the target. Under the assumption of unchanged policies, the Commission projects the headline deficit to increase slightly in 2014 to 3.1 % of GDP despite the pick-up in economic activity, as several revenue measures adopted to achieve the 2013 target expire in 2014. The assumed achievement of budgetary targets in the outer years of the programme is not supported by specified and quantified measures. In addition, the currently on-going process of unification of healthcare insurance providers might induce arbitrage between the private health insurance companies and the state, with a possible negative impact on public finances during the programme period.6
Some projected expenditure developments may not be sustainable in the medium to long run. The programme projects a decline in the public investment ratio from 1.9 % of GDP in 2012 to 0.6 % of GDP in 2016, a very low level especially for a catching-up economy. An
5 On the revenue side, the consolidation package includes a hike in the corporate income tax rate from 19 % to 23 %, a new 25 % tax bracket in the personal income tax system, adjustments in the taxation of self-employed and atypical work contracts, a broadening of the bases for social contributions, and increases in administration fees. Expenditure savings are envisaged in the wage bill for public employees, goods and services and general government investment. 6 As the decisions underlying the unification of healthcare insurers into a one public insurer could be taken in 2013, the operation could have a budgetary impact already in 2013.

11
initial planned increase in expenditure on research, development and innovation in 2013 is followed by a decline in later years. In addition, expenditure cuts carried out in the past on goods and services and the public wage bill and planned also for 2013 and 2014 may not be sustainable, as they can impair the efficient functioning of the public sector. A more targeted cost reduction, prioritising growth-enhancing expenditure and supported by an expenditure review would be beneficial.
Meeting the fiscal obligations under the EU surveillance framework appears to be within reach. For the period 2010-2013 the adjusted annual average fiscal effort7 is estimated to have reached 1.4 % of GDP annually, compared to a recommended average fiscal effort of at least 1 % of GDP, implying that effective action has been taken in response to the 2009 EDP recommendation. For the years following the expected date of correction of the excessive deficit, the projected improvement in the (recalculated) structural balance8 appears to be ensuring sufficient progress on the adjustment path towards the MTO in 2014 and 2015 (0.6 pps and 0.7 pps of GDP, respectively), but it would be insufficient in 2016 (0.3 pps of GDP). According to the information provided in the programme, the growth rate of government expenditure, net of discretionary revenue measures, in the years between 2014 and 2016 is expected to contribute to an annual structural adjustment towards the MTO by 0.5 % of GDP. This is because the growth rate of this expenditure is set at (in 2014 and 2015) or below (in 2016) 1.5 %, the lower rate under the expenditure benchmark. Following an overall assessment of Slovakia’s budgetary plans, with the structural balance as a reference, including an analysis of expenditure net of discretionary revenue measures, the adjustment path towards the MTO over the programme period seems to be appropriate. However, based on the recalculated change in the structural balance, Slovakia would not carry out sufficient structural effort in 2017.
7 Adjusted for developments in potential output and revenue windfalls or shortfalls. 8 The cyclically adjusted balance net of one-off and temporary measures, recalculated by the Commission services on the basis of the information provided in the programme, using the commonly agreed methodology.

12
Box 1. Main measures
Main budgetary measures Revenue Expenditure 2013
• Unification of and increase in the assessment bases for social contributions (0.2 % of GDP)
• Introduction of social contributions for contracts ‘by agreement’ — revenue effect (0.2 % GDP)
• Increase in taxation of self-employed (e.g. limiting lump-sum deductions) (0.1 % of GDP)
• Changes in the fully funded pillar (e.g. reduction of the contribution rate from 9 % to 4 % and reintroduction of voluntary participation) (1.0 % of GDP)
• Increase in the bank levy (0.1 % of GDP) • Introduction of a special levy on high-
profit enterprises operating in a regulated environment (0.1 % of GDP)
• Changes in the income taxes (e.g. increase in CIT from 19 % to 23 %, the introduction of a 25 % tax bracket for PIT) (0.5 % of GDP)
• Sale of free frequencies (0.1 % of GDP) • Sale of emergency oil stocks (0.3 % of
GDP)
• Savings on goods and services and other current and capital transfers in the state budget (-0.5 % of GDP)
• Savings of the local governments and other general government units outside the central government (-0.7 % of GDP)
• Increase in the expenditure on the healthcare system (0.2 % of GDP)
• Reduction in the wage bill in the state budget (-0.1 % of GDP)
• Increase in the wages in the primary and secondary schools (0.1 % of GDP)
2014 • Sale of emergency oil stocks (0.2 % of
GDP) • Reduction in the public wage bill (-0.1 %
of GDP) • Reduction in subsidies (-0.1 % of GDP) • Increase in capital expenditure by local
governments (0.1 % of GDP) Note: The budgetary impact in the table is the impact reported in the programme, i.e. by the national
authorities. A positive sign means that revenue/expenditure increases as a consequence of the measure. The degree of detail reflects the information made available in the stability programme and, where available, in a multiannual budget.
•
According to the programme, the public debt ratio is projected to stabilise at the end of the programme period. After increasing to 56.7 % of GDP in 2015, the debt-to-GDP ratio is to decline to close to 56 % of GDP by 2016. Persistent general government deficits are the main driving force behind the projected increase. In view of the limited capacity of the Slovak financial sector to absorb sovereign bonds, Slovakia has issued several bonds abroad since

13
2012, thus diversifying the investor base and issuance currencies.9 To maintain unimpeded access to international markets, Slovakia will need to continue implementing prudent fiscal policies. Since the debt-to-GDP ratio is expected to remain below the reference rate of 60 % of GDP over the programme period, the debt reduction benchmark is not applicable. Medium-term debt projections (see Graph below Table V in annex) indicate that full implementation of the programme would imply increasing debt until 2015, although remaining below the 60 % of GDP reference value, followed by a slight decrease towards 2020.
Box 2. Excessive deficit procedure for Slovakia On 2 December 2009 the Council adopted a decision stating that Slovakia had an excessive deficit under Article 126(6) of the Treaty on the Functioning of the European Union (TFEU). At the same time, the Council recommended under Article 126(7) TFEU that the excessive deficit be corrected by 2013. In particular, Slovakia was recommended to implement deficit reducing measures in 2010 as planned in the budget for 2010-2012, ensure an average annual deficit effort of 1 % of GDP over the period 2010-2013, and specify the necessary measures for correcting the excessive deficit by 2013, cyclical conditions permitting. It was also recommended to accelerate the reduction of the deficit if economic or budgetary conditions turned out better than expected. In addition, to limit risks to this adjustment, Slovakia was recommended to strengthen the enforceability of its medium-term budgetary framework and improve the monitoring of budget execution throughout the year, in particular to avoid expenditure overruns compared to budget plans.
An overview of the current state of the excessive deficit procedures is available on: http://ec.europa.eu/economy_finance/economic_governance/sgp/deficit/index_en.htm (please refer to country sections at the bottom of the page).
Long-term sustainability
The long-term sustainability of public finances has improved. Slovakia does not appear to face a risk of fiscal stress in the short term. Nonetheless, the country is at medium sustainability risk in a medium-term and long-term perspective, conditional upon full implementation of the planned ambitious fiscal consolidation and on maintaining the primary balance well beyond 2014 at the level expected to be reached in that year. The risks would be much higher if the structural primary balance were to revert to more negative values observed in the past, such as the average for the period 1998-2012. The focus should therefore be on resolutely and swiftly continuing to implement measures which improve sustainability. In addition, further containing age-related expenditure growth, including through further adjustments to the pension system, remains a priority so as to contribute to the sustainability of public finances in the long term.
9 According to the ARDAL (The Debt Management Agency), the currency volatility is fully hedged.

14
However, the sustainability gap remains large. The long-term sustainability gap (S2) of 4.9 % of GDP remains well above the EU average of 3 % of GDP. In addition to the initial budgetary position in 2014, the sustainability gap largely reflects the contribution from the projected long-term cost of ageing (3.5 pps). Pension expenditure would contribute 1.5 pps, and health care spending 2 pps to the sustainability gap.
Major changes to the pension system were adopted in 2012 but while significantly reducing pension costs these do not fully ensure its sustainability in the longer term. The most important changes in the public pension pillar are linking of the statutory retirement age to life expectancy from 2017 and a switch to inflation-based indexation starting from 2018.10 Redistribution in the system was increased and rules regulating early retirement have become stricter. The generous pension regimes for special categories such as the armed forces and police were also curbed, although not as much as initially proposed. The recommendation to include a sustainability factor in the pension formula was not adopted. The measures should reduce the projected increase in pension expenditures in the 2010-2060 period by half, to 2.6 percentage points of GDP,11 significantly improving the sustainability of the public pension pillar. However, given rapid population ageing, the public pension pillar is projected to remain in deficit.12 This would warrant swifter phasing-in of the pension reform. In addition, with the exception of low earners, the changes in the calculation and indexation of pensions adopted as part of the 2012 reform are likely to reduce the replacement rate in the long run, undermining the adequacy of retirement income.
The fully funded statutory pension pillar was downsized. Pension savers were allowed to opt in or out of this pillar.13 Moreover, the contribution rate was reduced from 9 % to 4 % of the base until 2016 (and the funds rerouted towards the public scheme) although there will be a gradual increase in the contribution rate back to 6 % by 2024. In addition, voluntary participation was reintroduced for new labour market entrants, who can decide whether to participate in the funded pillar until the age of 35. These measures have a positive short-term impact on the accounts of the general government. The reverse is true in the long term, because the pension liabilities of the state increase. Nevertheless, the measures taken in the first pillar more than compensate for this impact within the projection period. However, in
10 Between 2013 and2017, the weight of inflation in the indexation formula will increase annually by 10 pps from 50 %, while the weight of wages will be reduced. During this transition period, all pensions will be indexed by a fixed nominal amount. The price index mirroring the consumption basket of pensioners will be used to index pensions from 2018. 11 On 6 March 2013, the Ageing Working Group approved the recalculated pension costs reflecting the most recent changes in the Slovak pension system. The Economic Policy Committee endorsed them on 16 April 2013. These projections are the basis of the discussion in this text. 12 An additional factor improving long-term sustainability will be the increased ceiling of the assessment base for pension contributions, which will not be reflected in the calculation of pension rights. 13 Social Insurance Agency data show that about 89 500 people left the fully funded pillar between September 2012 and January 2013, the period during which it was temporarily opened, while 14 700 joined it. Although more people than expected (60 000) opted out, the volume of assets transferred was as expected (EUR 280 million).

15
light of past experience, these changes are likely to impact negatively on the size and scope of the fully funded pillar.14
Healthcare expenditure is projected to increase significantly in the long term. Although expenditure on healthcare remains below the EU average (6.2 % of GDP as against 7.1 % in 2010, respectively), it is projected to increase by 3 pps of GDP by 2060, reaching 9.2 % of GDP. While starting from a lower base, this would be the second highest increase among the Member States.15 In addition, public expenditure on healthcare as a percentage of the overall general government spending amounted to 16 % in 2010, above the EU average of 14.7 % and some 6 pps higher than in 2000. The rapid expansion in healthcare expenditure that has taken place in recent years has not been mirrored by improvements in health outcomes,16 while the rise in out-of-pocket spending on healthcare raises concerns about access to care.
Measures were taken to curb expenditure on pharmaceuticals, but the authorities could usefully consider whether further efficiency gains can be achieved. Slovakia introduced the requirement that the active component be prescribed alongside the brand name to encourage the prescription of generic medicines. Prices of medicines use the average of the three lowest prices in the EU as a reference and clearer rules on coverage of medicine prices by public insurance have been introduced. These measures are expected to have helped to keep the rapid growth of expenditure on pharmaceuticals in check. An evaluation would be useful to determine whether there is scope for further reducing spending on pharmaceuticals.
Repeated debt build-up points to existing inefficiencies in hospitals. Slovakia’s system of healthcare provision is centred on hospitals and is characterised by a high number of facilities17 and acute care beds18 and a high average length of inpatient stays.19 Remuneration of hospitals is on a per-diem basis rather than by diagnosis-related groups (DRGs), possibly leading to a high number of in-patient cases. These inefficiencies are aggravated by weak accounting mechanisms, a lack of effective monitoring of hospital activity and an ineffective incentive structure. Labour costs represent a large part of the cost structure of hospitals.20 Public expenditure on hospitals, both as a share of GDP and as a share of the overall public healthcare budget, is one of the lowest in the EU.21 However, the low efficiency of the system coupled with the limited financial resources and the pressure of an ageing population all point to the need for a substantial hospital reform, including streamlining the hospital network,
14 Voluntary participation may lead to substantially lower participation by new labour market entrants. Experience from the first time that voluntary participation was introduced, between 2008 and 2011, suggests that only about 10-15 % of a given age cohort could join the fully funded pillar. 15 See 2012 Ageing Report. 16 The number of avoidable deaths, or the amenable mortality rate, ranks among the highest in the EU. 17 There are more than 120 hospitals and a large number of university hospitals. 18 4.8 per 1000 inhabitants vs EU average of 3.7 in 2010. 19 6.7 days vs EU average of 5.9 days. 20 In some cases, as documented by the Ministry of Healthcare, wages may account for more than 85% of total costs. 21 Public expenditure on hospitals amounts to 1.9% of GDP, compared the EU average of 3% of GDP, and represents 33% of public current health expenditure (EU average: 47.3%).

16
changing costing and remuneration, improving control and monitoring and promoting better management practices.
The authorities envisage taking additional measures in the health care system. The National Reform Programme envisages improving information systems, strengthening hospital management, implementing centralised procurement and introducing DRGS, which would lead to substantial efficiency gains. The government also plans to unify all health insurers into one public health insurance provider, with a view to addressing the comparatively high administrative costs in the healthcare system.22 The impact of this operation on public finances, if pursued, should be carefully considered. Overall, the implementation of the government’s plans on health care reform appears to be still at an initial stage.
Increasing the efficiency of the healthcare system will require well-designed incentive structures and an action plan for reform. It is essential that the measures envisaged by the authorities are complemented by the introduction of effective incentive structures and control mechanisms in hospitals. A clearly defined timed action plan would help ensure stepwise monitoring and control of the reform process.
Fiscal framework
Slovakia has taken substantive steps to strengthen its fiscal framework. The first of the 2012 Council Recommendations called on the authorities to accelerate the establishment of the Fiscal Council and adopt rules on expenditure ceilings. The Commission concludes that Slovakia has made substantial progress on measures to address the first part of the recommendation. The Fiscal Council,23 which was established by a constitutional law on 1 March 2012, was set up in the second half of the year in line with the CSR.24
However, the rules on expenditure ceilings have not yet been adopted. While Slovakia sets multiannual budgetary objectives, these are not binding, except for the first year. This weakens the overall set-up of the fiscal framework and could be remedied by adopting binding multiannual expenditure ceilings. There is a legislative proposal to amend the Budgetary Rules Act to determine the procedures for setting such ceilings for general government, excluding local government, but its adoption has been postponed to September 2013. Member States are encouraged to ensure that any adopted expenditure rule is consistent with the expenditure benchmark set in the revised Stability and Growth Pact, in terms of
22 Slovakia's expenditure on healthcare-related administration and insurance is above the EU average (0.3 % of GDP compared to 0.2 %). 23 Officially called the Council for Budgetary Responsibility. Its main responsibilities include (i) issuing an annual report on the long-term sustainability of public finances, (ii) assessing adherence to fiscal rules, (iii) giving opinions on legislative proposals as necessary, and (iv) drafting documents related to the monitoring and assessment of budgetary developments as deemed necessary. 24 The Parliament appointed three Board members in July. By the end of 2012 the Bureau of the Council was set up and staff hired. The Council has already published several reports including an assessment of the 2013-15 budget proposal and a report on the long-term sustainability of public finances.

17
definition and coverage. The authorities plan to adopt legislation addressing the requirements of the Fiscal Compact25 that was ratified by the Parliament in December 2012.
Tax system
Improving the efficiency of the taxation system and increasing reliance on sources of taxation that are less detrimental to growth remains an important task given the need to finance the convergence process. In 2012, a Council Recommendation on taxation called on Slovakia to improve the efficiency of tax collection, in particular VAT, reduce distortions in the taxation of labour across different types of employment; link real estate taxation to the market value of property; and make greater use of environmental taxation. Some progress has been achieved towards addressing the CSR.
In 2012, Slovakia adopted important measures reducing the large differences in taxation among different types of employment and simplified the rules on social contributions. These measures are described in more detail in Box 3. The large discrepancies between various employment types were thus reduced (see chart below) partly addressing the 2012 CSR. The latest changes may reduce the tax burden on dependent work and the future risk of inadequately low pensions for the self-employed and those who only work by agreement.26 Nevertheless, no review was carried out to evaluate the deductibility rules that apply to those that do not opt for lump-sum deductions. This remains an important drawback of the taxation system for self-employed persons, as their declared costs for tax purposes constitute 80-90 % of the declared revenue.27 Thus while the self-employed represented 15 % of total employment in 2012, they generated less than 6 % of the overall personal income tax collected. An additional weakness is low monitoring of these taxpayers, as the tax office focuses on VAT liabilities.28 Given the low tax revenue from this group of taxpayers, ceteris paribus the authorities need to tax other activities more (e.g. the income of dependent workers, corporates, consumption, etc.) to cover the revenue gap.
Graph 1: Tax wedge before the reform Graph 2 Tax wedge after the reform
25 Title III of the Treaty on Stability, Coordination and Governance in the Economic and Monetary Union. 26 Work by agreement is an atypical working contract that was given favourable tax treatment and was intended mainly for seasonal and student jobs. The recent changes limited its use and reduced the tax advantages. 27 The figure includes those who use lump-sum deductions and is based on aggregated data from the tax declaration form type B. 28 In 2012, the tax administration authority carried out 16 053 controls out of which more than three quarters focused on VAT, about 10 % on corporate income tax (CIT) and 9 % on personal income tax (PIT). Breaches of the rules were found in 65 % of controls on CIT and PIT and in around 38 % of cases for VAT.

18
The number of contract agreements plunged after the reform. Partly in reaction to the adopted measures, the number of contract agreements fell by half from almost 650 000 in December 2012 to less than 300 000 in January 2013.29 To stem the outflow of workers to the grey economy and increase the demand for low-skilled labour, especially at the lower end of the income distribution, the government could consider reducing the tax wedge for low-paid workers regardless of the type of employment, as suggested in the 2012 CSRs. The government has so far not acted on this recommendation and no measures are envisaged in the NRP.
Box 3 — Changes to the taxation of employment
In 2012, the Council recommended that Slovakia ‘reduce distortion in taxation of labour across different employment types, also by limiting tax deductions’. The government adopted a set of measures that markedly reduce these large discrepancies between various employment types. The following measures were adopted for various employment types.
• In the case of the self-employed, the assessment base for calculating social contributions was adjusted by increasing its minimum level.30 It will gradually be broadened over the 2013-15 period by reducing an arbitrary coefficient that previously lowered the base.31 The possibility of deducting 40 % of expenses without any bookkeeping to reduce the tax base was limited in nominal terms to EUR 5 040 per year or EUR 420 per month.32
• Social contributions were increased significantly for workers by agreement who have a regular income, to match those of dependent workers. Those with an irregular income will pay somewhat
29 The Social Insurance Agency has statistics on the number of contracts but not on the number of people who ‘work by agreement’. A person can have more than one agreement contract. 30 About 86 % of self-employed people pay social contributions from the minimum assessment base. 31 The current coefficient of 2 (2.14 for healthcare contributions) will decrease to 1.486 in 2015. 32 The self-employed will no longer be able to apply these deductions to rental income.

19
lower rates. Students (within certain limits), invalidity and regular pensioners were granted exceptions.
• A new 25 % tax bracket was introduced for dependent work. It will apply to those whose tax base exceeds 176.8 times the subsistence minimum (for 2013 it amounts to EUR 34 402).
The differing rules for the assessment bases of social contributions were unified and the ceiling was raised for all employment types.33
In mid-2012 the government approved an action plan to fight tax fraud. This three-phase plan sets out precise measures and the timeline for implementing them, with a particular focus on VAT. A company cannot be registered if the founder has outstanding tax liabilities; people deemed by the tax authorities to pose a high-risk of non-compliance must pay a deposit when they register for VAT refunds and when re-exporting; and all payments above EUR 5 000 must be made electronically. These measures can contribute to fighting tax fraud. Nevertheless, no tangible impact has been observed so far, as VAT collection subsequently dropped by some 10 % in cash terms. The authorities intend to continue efforts in this area, mainly by tackling transfer pricing and introducing compulsory reporting of large international transactions by financial institutions.
The toolkit for addressing tax fraud includes improving the current poor IT infrastructure,34 broadening the competences of the authorities and ensuring judicial follow-up. Good IT infrastructure is essential, as a system that works well can enable the tax authority to collect data for required analyses, minimise the need for manual tasks,35 easily access the data of other (state) institutions and carry out cross-checks. The UNITAS project could partly improve this, but so far it has not been successfully implemented. The authorities’ powers to prevent tax fraud and recover unpaid taxes appear to be limited.36 Although the number of people convicted of tax crimes has increased in recent year, the rate of rejected tax investigations remains high. In 2011, investigators rejected about 65 % of all notifications by the tax authority, in most instances without thoroughly analysing the case. This leads to low levels of tax-related prosecutions and subsequent convictions.37
33 Previously, the maximum base varied as follows: (i) 1.5 times the average wage (AW) from two years before for guarantee and sickness insurance, (ii) 3 times the AW for health insurance, (iii) 4 times the AW for old-age, invalidity, unemployment insurance and reserve fund contributions and (iv) no ceiling for accident insurance. The ceiling was increased to 5 times the AW. 34 While not directly related to tax IT infrastructure, the government passed a law to create a central register of physical persons, which may improve interconnectivity between various databases in the future, thus potentially giving the tax authority quicker access to a broader set of data. 35 For example, the Slovak tax authorities state that the deadlines for filing and payment of VAT are monitored manually through browsing a set of reports and summaries. Another example is manual calculation for offsetting tax credit entitlements (e.g. VAT refunds) against other outstanding tax debts. 36 For example, the tax authority cannot suspend the deadline for a VAT refund if it suspects fraud. Assets are manually identified during the process of tax recovery. This may require the tax recovery officers to send a letter to a registrar of assets. 37 From 2003 to 2011 the number of convictions was on average 27 % of all annual prosecutions.

20
No progress has been achieved in reforming property taxation. To date, the government has not taken measures to reform the taxation of residential real estate to reflect the market value of property, in contrast with the Council’s recommendation in 2012. The measures planned to improve the situation include obtaining a more detailed description of property on its registration in the land register (including the price) and/or a more detailed tax declaration form for real estate to include property characteristics.
There is scope for accommodating some environmental concerns in the taxation system. In 2012, Slovakia changed the car registration fees for new cars. The new fee structure reflects car engine power. Although this measure does have environmental aspects, environmental taxation as such could be improved by introducing an annual car tax directly linked to CO2 emissions. As pointed out in the NRP, due to its geographical location, Slovakia has limited scope to significantly increase taxes on fossil fuels and energy independently from neighbouring countries. According to the SP, the introduction of a carbon tax could have a negative impact especially on lower-income households and it would be detrimental to the competitiveness of Slovak businesses. While competitiveness and distributional concerns must be carefully weighed when designing environmental taxes, Slovakia’s implicit tax rate on energy remains among the lowest in the EU, suggesting that there is still room to broaden the tax base in this direction. The Slovak authorities could, for instance, reconsider the application of certain exemptions provided in the Energy Tax Directive. Taxes on pollution are negligible and could also be increased.38
3.2. Financial sector
The largely foreign-owned financial sector proved resilient during the crisis. The stability of the banking sector is expected to continue to be supported by declining yet relatively healthy profitability, high deposit-to-loan ratios and a negligible share of loans in foreign currencies. Efforts to ensure strong coordination between home and parent banks remain critically important. Despite the overall resilience of the sector, ease of access to financing was negatively affected in 2012 by both the cyclical downturn and the increase in credit risk. While the number of loans to non-financial firms39 increased at a moderate pace from 2010 to 2011, in 2012 it declined by 3.6 %. The stock exchange and venture capital market also remain underdeveloped and no substantial progress was made in 2012. Equity financing is very limited, providing small and medium-sized enterprises (SMEs) and start-ups with very few alternatives to traditional bank loans. As a part of the JEREMIE initiative, the Slovak Guarantee and Development Fund implemented the first loss guarantee in 2012.40 The risk capital instrument should be launched later in 2013, after the evaluation of received offers is completed.
38 The landfill charge for waste is especially low compared to other Member States. Progressively increasing the charge would help to divert waste from landfill, which still accounts for 75 % of municipal waste treatment. 39 National Bank of Slovakia — Statistics on loans granted between January and December 2012. 40 The first guarantee agreements were signed in April 2013, allowing the participating banks to provide up to EUR 170 million in new loans to SMEs.

21
3.3. Labour market, education and social policies
Labour market
The unemployment rate remains high at 14 % and gives reason for concern. The number of unemployed persons went up from 260 000 in 2008 to 380 000 in 2012, an increase of nearly 50 %. While the persistence of high unemployment to a large extent is due to the slow pace of the post-crisis recovery, some long-standing structural challenges exacerbate the situation. About 60 % of the unemployed are low skilled and two thirds are long-term unemployed, partly reflecting persisting regional disparities and skills mismatches. Youth unemployment also remains among the highest in the EU. The employment rate of older women and low-skilled workers, including Roma, is among the lowest in the EU.
To date, labour market services and active labour market policies (ALMP) have not proved sufficiently effective. In response to the 2012 Council Recommendation, Slovakia is reforming ALMPs. A reform is in force since May 2013, improves the targeting and efficiency of such policies but its implementation is constrained by a lack of resources. While it aims to increase the provision of personalised services and to improve evaluation of ALMPs, it is not clear how the public employment services will be able to fulfil the new tasks with the existing capacity.41 Many of the labour offices remain understaffed and there is no regular comprehensive analysis of ALMPs based on harmonised data collection.
Regional disparities in employment are very large, mirroring differentials in economic development. The share of ALMP participants among job seekers is significantly lower in regions with higher unemployment rates.42 Workers appear reluctant to move from areas with high unemployment to those where there are vacancies (in particular, urban areas). Part of the reason for the current mismatch is the underdeveloped rental housing market and the lack of affordable housing in economically dynamic regions. Three activation policies currently aim to increase regional mobility.43 However, so far they have not significantly reduced unemployment.
Graph 3: Nominal GDP per capita by region (Euro)
Graph 4: Registered unemployment rate by region (% of labour force)
41 The caseload, estimated in terms of the number of registered jobseekers per front line staff, has more than doubled since 2006. Few resources are dedicated to placement and ALMP-related services in Slovakia (around 50 %). In Luxembourg and Norway it is 80 % (Duell, 2010), OECD 2012 Economic survey. 42 While 12 % of unemployed people on average were participating in 2010, this figure reached 25 % in Bratislava and 10 % in eastern regions (OECD Economic Surveys, 2012). 43 Three ALMP measures supporting internal mobility that will remain legally claimable in the amended Act on Employment Services are contributions (i) for commuting to work; (ii) for moving to work; and (iii) to compensate operational costs of a sheltered workshop/workplace or transportation of employees.

22
Source: Commission Source: Commission
Despite relatively low expenditure in unemployment and social assistance, the existing array of social and activation policies suffers from considerable complexity and the existence of disincentives. Unemployment benefits only last for six months. After that, the unemployed can request social assistance and receive limited individual support but are not obliged to register with the labour office. They may therefore be uninformed about vacancies, activation or training opportunities, and may progressively become detached from the labour market. While a comprehensive reform is planned for 2014, some changes aimed at eliminating the misuse of social assistance entered into force in January 2013 and go in the right direction. By contrast, the tax and benefits system continues to provide insufficient incentives for the longer-term unemployed to take up low-paid jobs because social benefits are withdrawn rather quickly and not through a more gradual phasing out.44 Existing activation measures for long-term unemployed are not sufficiently effective.45 At the same time, social security contributions paid by an employer hiring a low-paid worker have remained high at around 35 % of the gross wage. Although the reformed system of ALMP envisages a hiring subsidy in the form of a contribution to employment of disadvantaged jobseekers and a contribution to support local and regional employment, the support is not focused solely on the long-term unemployed. Insufficient progress has therefore been made in reducing the tax wedge for the low-skilled unemployed.
Despite some improvements, the situation of young people remains difficult. Long-term unemployment among the young (15-24) is almost three times higher than the EU average (18.1 % vs 6.4 % across the EU in 2011). The graduate practice scheme for unemployed graduates under 26 is being reformed to improve targeting and effectiveness. In autumn 2012,
44 For people moving from inactivity with an activation allowance to minimum wage work, the marginal effective tax rate, which measures the part of a person’s income that goes on taxes, exceeds 60 %. It reaches 80 % for a single parent with 2 children. 45 According to a recent evaluation of activation strategies in Slovakia, the probability that jobseekers participating in activation works will not find employment in labour market is 80 %.

23
two projects (worth EUR 70 million) co-financed by the European Social Fund were launched in the framework of the Youth Action Plan. They aim to create 13 000 jobs mainly for young people. Through the Youth Employment Initiative, the ESF will reinforce its action targeted at young people not in employment, education or training.46 The implementation of a Youth Guarantee would help to set a more coherent framework to address youth employment.47
The recently adopted Labour Code entered into force on 1 January 2013. It introduced an increase in employment protection for regular and temporary contracts and a new definition of dependent work to minimise the use of other forms of work as disguised employment (see also section 3.1).48 Although the labour market remains flexible, the recent reform might increase labour costs and discourage employers from hiring at a time when the economy is slowing down and the labour market remains sluggish. It is too early to assess the impact of the labour code reform on employment, but it is important that it is regularly monitored and independently evaluated.
Women face barriers to entering or staying in the labour market. The gender employment gap for young women (20-29) is almost double the EU average and the impact of parenthood on female employment remains among the highest in the EU. There are not enough good quality, affordable early childhood education and care services, which also contribute to supporting children’s development. In particular, facilities for children under three are insufficient due to a lack of resources at local level and to shortcomings in legislative provisions.49 Maternity leave and parental leave can be very long, making it more difficult for mothers to smoothly re-enter the labour market.50 Slovakia is among the Member States with the highest gender pay gap but has no policies in place to tackle this problem. Insufficient progress has been made in acting on the 2012 Council Recommendation on the availability of childcare facilities.
Policies promoting access to lifelong learning and increasing the employability of older workers also appear insufficiently developed. Participation in lifelong learning remains among the lowest in the EU and contributes to the persistence of skills mismatches. Given the projected increase in the retirement age, promoting longer working lives will be important, also with a view to ensuring pension adequacy.
46 Calls have been recently launched for the allocation of EUR 220 million from the European Regional Development Fund to support job creation for youth in small and medium-sized enterprises Council). 47 Council Recommendation of 22 April 2013 on establishing a Youth Guarantee (2013/C 120/01) to ensure that all young people under the age of 25 years receive a good-quality offer of employment, continued education, an apprenticeship or a traineeship within four months of becoming unemployed or leaving formal education. 48 The new law reintroduced the possibility of benefiting of both a notice period of up to 3 months (depending on job tenure) and a severance payment of up to 4 months (depending on job tenure) in case of lay-off. The maximum duration of consecutive fixed-term contracts was also reduced to 2 years. Night work was prolonged by 1 hour (now it is between 10pm and 6am). The trade unions regain more negotiation and decision-making powers and must no longer prove that they represent at least 30 % of employees. 49 Only 3 % of children under three were enrolled in formal and pre-school care facilities (compared to 29.2 % in the EU in 2011). 50 The current entitlement for postnatal leave is up to three years. This can be spread over five years with the employer’s agreement.

24
Education
High youth unemployment partly reflects the low quality of the education and training systems and their limited relevance to labour market needs. Relatively low public expenditure in education and the low attractiveness of the teaching profession exacerbate this problem.51 Recently adopted and proposed reforms go in the right direction. Notably, the NRP sets the objective of gradually increasing public expenditure on education to 6 % of GDP by 2020 while increasing efficiency by adjusting the number of schools and teachers to demographic developments. However, much of the planned increase in education is likely to be outside the current government’s mandate. The NRP also announces several measures for teachers. Improved initial training of teachers and continuous monitoring of the recently introduced career system for teachers could contribute to improving the quality of educational outcomes, which strongly depends on the role of teachers, by increasing the attractiveness of the profession and encouraging teachers to participate in in-service training. It will be essential to ensure that the courses offered respond to the needs of teachers and that the status of teachers and the overall system of incentives for them are sufficient to make the teaching profession attractive to graduates.
Higher education reform was adopted in December 2012. It aims to improve internal quality assurance systems and the quality of part-time studies and teaching. It also contains incentives to increase the internationalisation of higher education institutions. However, there are not enough professionally oriented bachelor degrees. A comprehensive new law on higher education institutions is under consideration, as is a revised funding mechanism that would link the financing of education more closely to the overall quality of education. A revised law on vocational education and training (VET) was adopted in 2012. It creates a more flexible and closer link between VET institutions and the labour market.52 Pilot projects creating new apprenticeships in companies have been introduced. The authorities are working on further developing work-based learning in VET and reinforcing the involvement of social partners.
Social policies
Despite a relatively low number of people at risk of poverty or social exclusion, around 10 % of the population suffered from severe material deprivation in 2011. Children are much more at risk than the overall population, with a risk-of-poverty rate of 21.2 % compared to 13 % for the overall population. Yet Slovakia did not use the 2012 allocation of funds (EUR 5 million) from the EU programme for food for the most deprived because it was unable to coordinate the delivery of assistance. The situation of those with the lowest incomes has
51 The latest available data confirms that public education expenditure, as a proportion of GDP, and teachers’ relative wages, remains among the lowest in the EU. In addition, funding mechanisms favour quantity more than quality and are insufficiently adapted to local needs. Public and private returns on education in Slovakia are, however, relatively high by OECD standards, especially because the chance of finding a job increases with the level of qualification. 52 Companies operating in sectors such as information technology and the automotive sector report difficulties in hiring skilled workers.

25
also been negatively impacted by rising out-of-pocket spending on healthcare,53 which may have adversely affected their access to healthcare. A strategy for de-institutionalisation of social services54 was adopted in December 2011, but the implementation of the pilot national projects has been considerably delayed.
Insufficient progress was made in acting on the Council Recommendation concerning the marginalised Roma community. Education measures were announced, but have not been adopted yet. Employment measures, on the other hand, have yet to be drafted. Even if access to pre-school education is legally guaranteed for all, participation in early childhood education is low compared to the EU average (77.5 % vs 92.5 %), and minorities from disadvantaged areas are mostly concerned. At the same level of education, the Roma unemployment rate is between two and eight times higher than the non-Roma unemployment rate in the same area.55 Anti-segregation education policies and anti-discriminatory employment policies are inadequately implemented.56 The numerous projects funded through the Structural Funds brought no significant improvements due to inefficient coordination, weak capacity in the line ministries and among project promoters (e.g. remote municipalities) and insufficient involvement of Roma stakeholders in designing and implementing projects. No relevant social considerations are currently being taken into account in public procurement contracts in Slovakia (for example through contract performance clauses).
3.4. Structural measures promoting growth and competitiveness
As a small open economy with relatively high profitability and productivity growth, Slovakia is in a favourable competitive position. Manufacturing plays a very important role, accounting for 26 % of total value added compared to the EU average of 15.5 %. The country’s industrial base is, however, specialised in a few capital-intensive, cyclically sensitive sectors. While technology imports have been a source of major productivity gains in the past ten years, the marked specialisation of the economy makes it highly dependent on external demand and vulnerable to global sector-specific developments. In the long term, the contribution of foreign direct investment to growth is bound to diminish, while labour costs and productivity are expected to converge with EU levels. Due to weaknesses in institutions, education and the innovation system, the innovation capacity of domestic firms remains limited.
Research, development and innovation policies
So far, progress towards developing an effective policy framework supporting research, development and innovation has been limited. Policy documents and measures adopted
53 It increased by 15.3 % between 2000 and 2010 (OECD Health Data 2012). 54 Deinstitutionalisation is the process of replacing long-stay care homes for children or adults with less isolated community or family-based services that respect the right to live on your own and to be included in the community. 55 Economic Survey, OECD, 2012. 56 Prešov Regional Appeal Court’s decision of 30 October 2012 on the illegal segregation of Roma pupils at elementary school from kindergarten pupils in Šarišské Michaľany.

26
since 2007 have identified existing weaknesses. But ‘knowledge triangle’ policies remain beset by governance problems and fragmented responsibility. The lack of excellence in research and the quality of tertiary education remain major weaknesses as demonstrated for example by the low number of frequently quoted scientific publications. The generation of intellectual assets and patent revenues is low by international comparison. Collaboration between companies and domestic research centres is limited, resulting in a low proportion of innovative enterprises. Against this background, an important priority is to finalise and implement the research, development and innovation strategy for smart specialisation.57
In 2012, several measures were announced to improve collaboration between the public and private sector but they have been implemented only partially, due in part to insufficient and ineffective use of funding. The R&D Operational Programme provided 81 % of R&D funds, whereas innovation policy measures were almost completely funded by the Competitiveness and Growth Operational Programme. Most financial assistance was provided through grants. Although planned for several years, more sophisticated funding mechanisms such as support for clusters and innovation vouchers have not yet been put into operation. Although the Slovak Government’s Council for Science, Technology and Innovation was recently established, an effective governing structure is not in place yet.
Business environment
Despite some recent improvements, Slovakia’s regulatory policy environment scores poorly as regards administrative capacity and the administrative burden on start-ups. A comprehensive strategy to improve the business environment was adopted in 2011 and an update with new measures was approved by the Government in 2013. While 54 measures have been implemented since 2011, the goal of reducing the administrative burden on businesses by 2012 has not been reached. On the other hand, the time needed to start up a business was reduced to two days for a trade licence and three days for company registration by the court. With some notable exceptions, overall analytical capacity at central government level remains rather limited. Impact assessments are often carried out only formally and tend to focus only on the impact on the state budget. To address this problem, analytical units are being further developed in key ministries. The indicators measuring various aspects of entrepreneurship are well below the EU average, suggesting that school education does not sufficiently encourage a sense of business initiative. Slovakia has a relatively low score for ease of paying taxes in international comparisons.
Network industries
There is room for improvement in the market functioning of network industries, notably in the energy sector. Competition in the energy sector has improved in recent years, with retail consumers gradually starting to benefit from liberalisation of the market. On the other hand, consumers’ switching rates remain low and electricity prices for medium-sized industrial consumers are among the highest in the EU (see Box 2 for a discussion of the 57 The strategy should provide a coherent framework to prioritise EU funds on a limited set of areas with genuine growth potential in the next programming period.. It should also address issues related to governance arrangements, involvement of stakeholders and monitoring mechanism.

27
energy market).58 Following the adoption of the Postal Service Act, the postal market has been fully liberalised since 2012. However, the letter mail market is dominated by the incumbent and there is still only limited competition. Professional services are subject to entry and conduct regulations but there are no quotas or economic need tests. Slovakia is also lagging behind when it comes to the award of spectrum to operators for the rollout of mobile broadband. This delay compounds the problem of low broadband coverage and the take up of broadband is also among the lowest in the EU (19 % of the population in January 2013, 9 pps below the EU average).
Box 4 — Energy market in Slovakia
Due to partial liberalisation of the sector, the number of retailers in both the electricity and gas market has risen in recent years. However, the regional market share of incumbents remains high, especially in the household segments.
In the Slovak Republic, the Regulatory Office for Network Industries (RONI) sets a price cap on end-user gas and electricity prices for households and small industrial consumers.59 The price cap on electricity and gas prices for small industrial consumers was reintroduced in 2012, in contrast with the Commission Communication ‘Making the internal energy market work’ (COM(2012) 663) and its country specific annex. On the other hand, prices for medium and large industrial consumers remain unregulated.
Electricity retail is dominated by three regional companies which also operate distribution networks through their legally unbundled subsidiaries. In 2011, switching rates were still low (1.6 % for industrial users and 0.8 % for households), pointing to a non-dynamic market. Retail activities in the gas sector are concentrated, with one company covering more than 75 % of the market. In 2011, only 0.21 % of gas consumers switched operator although the rate was 10.1 % among large industrial users60
Due to effective market coupling, Slovakia has the same wholesale electricity prices as the Czech Republic. However, the unregulated end-user prices for medium-sized industrial consumers in Slovakia were the fifth highest in the EU in 2011.61 On average they were around 21 % higher than those for their Czech competitors in the past four years. This appears to be due less to end-price regulation, taxes or generation prices, than to the high network costs, which are among the highest in the EU.62 Unlike energy costs, which decreased, network costs increased between 2009 and 2012.63
58 Data refer to the consumption band for light industry (Band IC: 500 MWh < Consumption < 2 000 MWh). Although it is generally used for cross-country comparison, it covers only a small share of Slovak electricity users due to the structure of the Slovak industry. 59 ‘Small industrial consumers’ refers to those consuming less than 30 MWh electricity and 100 MWh gas. The calculation takes into account the value of the regulated asset base, operational costs, depreciations and adequate profit. 60 Staff working document ‘Energy Markets in the European Union in 2011’ (SWD(2012)368)) using data from the CEER database. 61 Eurostat. 62 Cross-country comparisons of network costs are difficult to make as different countries might include different elements in the network costs. In particular, support for renewables and/or cogeneration can be reported either under network costs or under taxes and levies. In the case of Slovakia and the Czech Republic, however,

28
The high level of transmission and distribution tariffs, which form part of the network costs, may reflect the size of the country, its topography, the volume of electricity transported, or the recent re-evaluation of assets by the Slovak transmission system operator and of the three distribution system operators.64 The increase in network costs has also been affected by increasing support for renewable energies and for combined heat and power generation, and by environmentally harmful subsidies for domestically produced lignite.65
Differences in network costs may also reflect a lack of transparency in the tariff setting mechanism applied by the RONI. In addition, there appears to be no sound economic analysis underpinning the regulatory regime and this weakens the RONI’s accountability. As a consequence, the overall regulatory framework is viewed as scarcely predictable, with adverse consequences for tariffs, longer-term investment and multi annual contracts for customers. As regards infrastructure, there is still no comprehensive roll-out plan for smart meters; unplanned flows of electricity originating from the Austrian and German grids limit cross-border transmission capacity and are a source of concern for the security of Slovakia’s network. The construction of new electricity lines and interconnections would be needed to address these issues.
Retail prices of gas are below the EU average for households while they are slightly above the EU average for industry.66 As in other Eastern European countries, wholesale gas prices are higher than prices in north-west Europe where access to multiple sources of gas and competitive trading has led to price decreases. There are still no gas interconnections on the north-south axis. The main gas company in Slovakia imports gas from Russia predominantly with long-term contracts and maintains a high market share in both wholesale and retail markets. This share has been declining mainly in the non-regulated segments. Under the European Energy Programme for Recovery, the EU is co-financing the Hungary-Slovakia gas interconnector, which is currently in the implementation phase.
Energy efficiency and climate change
Despite notable progress, more ambitious efforts are required to improve the energy efficiency of the economy. In line with the Directive on Energy Efficiency 2012/27/EU, Slovak authorities have notified the energy efficiency target with final energy savings of 23 % (3.12 Mtoe), or primary energy savings of 20 % (4.07 Mtoe) in 2020. The authorities have
renewable energy support schemes are included in network costs and have similar shares. According to data provided by Eurostat, Slovakia’s network costs for industrial consumers are 40 % higher than in the Czech Republic, while they are broadly comparable for households. Network charges for households are nonetheless among the highest in the EU in both countries. 63 The network costs between 2009 and 2012 increased by around 18%. Energy & supply costs decreased between 2009 and 2012 by around 28%. Source: Eurostat. 64 Re-evaluation of assets increases the value of assets entering the regulated asset base that is then used for tariff calculation. If the money is not reinvested this approach leads to higher tariffs without real cost increases for transmission and distribution operators. 65 All these elements are part of network costs in Slovakia. Support for renewable energy and CHP has been the fastest growing sub-component of network costs, according to the RONI. It rose from 0.12 EUR/MWh in 2009 to 11.95 EUR/MWh in 2012. In 2012 it represented about 9.3 % of the final electricity price for households. Support for domestic lignite represented around 1.5 % of the final electricity price for households. For industrial consumers these shares are not available. RONI Annual Report 2011. 66 Comparison of consumption bands D2 (5.56 MWh-55.6 MWh) for households and I3 (2.77 GWh-27.8 GWh) for industrial consumers in 2011.

29
also adopted an energy efficiency action plan to tackle the economy’s carbon and energy intensity. Several positive measures were taken, such as the implementation of the SLOVSEFF programme and the introduction of the energy saving awareness campaign and the energy auditing scheme in industry. Structural funds were used to support sustainable energy investments in SMEs and the public sector. However, Slovakia has not yet complied with the obligations on public procurement stemming from the Energy Services Directive.67 Economic activities that have a negative impact on the environment, such as mining, also continue to be subsidised.68 EU Structural funds for energy saving projects channelled through grants may have led to distortion of competition, crowding out private investment and commercially based financing products. On the other hand, the use of financial instruments, including revolving funds and guarantee schemes, is not sufficiently developed.
Regarding renewables, Slovakia is on track to meet its 2020 targets. The proportion of renewable energy sources increased from 6.2 % in 2005 to 9.7 % in 2011. The support framework, in the form of feed-in tariffs, was changed in 2011 and 2012. While Slovakia needs to speed up renewably energy development, the cost-effectiveness and transparency of the renewables promotion mechanism, including the feed-in tariff system, should be reviewed. In addition, it is important to further simplify administrative procedures and to reinforce the electricity infrastructure where necessary.
Transport infrastructure
The lack of adequate infrastructure remains an obstacle to growth in the eastern regions. Slovakia’s specialisation in export-oriented manufacturing places increasing demands on the quality of transport infrastructure. There has been a delay in completing a long- and medium-term transport master plan to identify key priorities consistent with EU transport policy, in particular the Trans-European Transport Network (TEN-T) and to provide a strong basis for programming of EU funds.69 The very high unit costs of new or renovated infrastructure also reflect weak planning, poor design and inefficiencies in public procurement.70 Compared to neighbouring Member States, Slovakia’s railway infrastructure is underdeveloped. This, together with the high density of the rail network, may lead to greater investment needs in the future. In terms of rail passenger and freight transport, the market has been liberalised but the market shares of new entrants are low, partly reflecting high infrastructure access charges.
3.5. Modernisation of public administration
The public administration continues to suffer from weaknesses that reduce its effectiveness. The 2011 Worldwide Government Effectiveness indicator ranked Slovakia
67 The requirement to include a minimum of two options from the ‘list of eligible energy efficient public procurement measures’ in Annex VI of the ESD has not been met. 68 Fiscal Policy Institute (2011), A subsidy of one miner constitutes twofold of his gross wage. 69 After the delay, the first phase of the transport plan should be ready in June 2013. 70 This was already communicated to the Slovak authorities in the Position of the Commission Services on the development of the Partnership Agreement and programmes in Slovakia for the period 2014-2020.

30
19th among the EU Member States. High staff turnover linked to the political cycle undermines its independence and weak analytical capacities impair the evaluation and implementation of public policies. In 2012, the government adopted an important reform of the public administration with implementing measures spanning over several years. The main objective of the initial phase of the reform is to streamline the organisational structure of local- and district-level state administration. Ministries and central government bodies are expected to undergo functional audits to identify duplication and optimise internal processes. At a later stage, the reform envisages the modernisation of human resources management. Improving the quality of public service will be crucial for the reform to be fully and successfully implemented and the challenges identified in this area with the 2012 CSR remain. In its current stage the reform does not sufficiently focus on weaknesses at the level of the central administration and a modern system of human resources management is yet to be developed. Finally, whereas the availability of e-government services for businesses is close to the EU average, e-government services for citizens are not significantly developed.71
Current international indicators suggest that Slovakia ranks low in terms of perceived corruption.72 Concerns also exist with regard to the capacity of judicial authorities to investigate and prosecute corruption offences.73 Despite greater transparency, irregularities in public procurement procedures have also persisted. The average and median number of bids are among the lowest in the EU, indicating a very low overall level of public procurement competition. In 2013, Slovakia significantly amended the Public Procurement Act to streamline lengthy tender procedures, improve transparency requirements and enhance competition.74 In addition to the amendment, the government also decided to substantially strengthen the Public Procurement Office. Progress has hence been made in addressing the 2012 CSR on public procurement. The effective application of the new procurement rules, however, could be facilitated by further developing the skills of officials in charge of drafting terms of references, and of evaluating and selecting bids.
Judicial and enforcement proceedings for civil and commercial cases remain long and perceived judicial independence is the lowest in the EU.75 The relatively high number of pending litigious civil and commercial cases and their sub-optimal rate of resolution results in delays impairing access to effective legal recourse. Insolvency proceedings take twice as long as the EU average. Alternative dispute resolution systems remain underutilised. Digital infrastructure for the electronic communication and information exchange between courts and
71 Other areas where there is room for improvement are government-to-government transactions and the inter-operability of databases among various public institutions. 72 Transparency International ranked Slovakia 62nd in its global corruption perception index. 73 OECD Report on implementing the OECD Anti-Bribery Convention in the Slovak Republic, June 2012. 74 The new law provides for a central electronic market place that is obligatory for below-threshold off-the-shelf procurement. The use of non-competitive amendments to the existing contracts has further been restricted. The concept of ‘abnormally low tenders’, which can be excluded from procurement, was defined in more detail. A new appeal body, with a majority of external members, will decide on appeals against decisions by the Public Procurement Office (‘Office’). 75 Based on the 2010 data in the EU Justice Scoreboard.

31
their environment require further investment and reforms.76 With regard to competition law, various court panels deal with appeals by different parties in the same case against the competition authority’s decisions. They are often not used to dealing with competition law cases and have limited awareness of the principles of EU competition law. This may result in inconsistent court rulings and undermines the judiciary’s effective enforcement of competition rules. Following preparatory work in 2013, the NRP announces a legislative proposal in 2014 on the new Code of Civil Procedure. The NRP further proposes amendments to the Rules of Enforcement and the introduction of an insolvency register. In 2012, several reforms came into effect on the recruitment and evaluation of judges and prosecutors, the functioning of the courts and the Judicial Council. Although some progress was made with regard to the judiciary, the 2012 recommendation remains largely valid.
76 Idem.

32
4. OVERVIEW TABLE
2012 commitments Summary assessment
Country-specific recommendations (CSRs)
CSR 1: Take additional measures in 2012 and specify the necessary measures in 2013, to correct the excessive deficit in a sustainable manner and ensure the structural adjustment effort specified in the Council recommendations under EDP. Implement targeted spending cuts, while safeguarding growth-enhancing expenditure, and step up efforts to improve the efficiency of public spending. Thereafter, ensure an adequate structural adjustment effort to make sufficient progress towards the MTO, including meeting the expenditure benchmark. Accelerate the setting up of the Fiscal Council and adopt rules on expenditure ceilings.
Slovakia is expected to make progress in terms of fiscal consolidation but at this stage it is premature to comment on the EDP. Limited progress has been made on safeguarding growth-enhancing expenditure, making public spending more efficient and laying down an adequate structural adjustment towards the medium-term objective. The Fiscal Council has been set-up. The original plan to adopt rules on expenditure ceilings has been postponed to the first quarter of 2013. No information on current progress towards reaching this goal is available.
CSR 2: Increase tax compliance, in particular by improving the efficiency of VAT collection; reduce distortions in taxation of labour across different employment types, also by limiting tax deductions; link real estate taxation to the market value of property; make greater use of environmental taxation.
Progress has been made on reducing distortions in the taxation of labour across different employment types. However, no review of tax deductions has been carried out. The legislative changes adopted to fight VAT evasion go in the right direction and can help make VAT collection more efficient. Nevertheless, there continued to be shortfalls in VAT revenue in 2012 and the challenge in this area remains. No progress has been made on real estate and environmental taxation.
CSR 3: Further adjust the pay-as-you-go pension pillar, mainly by changing the indexation mechanism, introducing a direct link between the statutory retirement age and life expectancy and introducing a sustainability factor in the pension calculation formula reflecting demographic change. Ensure the stability and viability also of the fully funded pillar.
A comprehensive pension reform has been adopted. Within the pay-as-you-go pillar, the indexation mechanism was changed and the link between the statutory retirement age and life expectancy introduced. The sustainability factor in the pension calculation has not been introduced. Repetitive opening of the fully funded pillar, the reintroduction of voluntary participation and several other changes undermined the stability of its set-up. After the Ageing Working Group reviews and recalculates the S2 indicator, it will assess the impact of the changes adopted on the long-term sustainability of public finances. Preliminary estimates show that they have improved the long-term sustainability of public finances but the long-term financing gap remains high compared to that of other Member States.
CSR4: Enhance the administrative capacity of public employment services with a view to improving the targeting, design and evaluation of active labour market policies to ensure more individualised employment services for the young, the long-term unemployed, older workers and women. Ensure the provision of childcare facilities. Reduce the tax wedge for low-paid workers and adapt the benefit system.
Slovakia has only partially implemented this CSR: The ALMP reform entered into force in May 2013 and is expected to improve the targeting and design of activation policies and introduced obligatory evaluation by public employment services. However, despite additional responsibilities and increased needs for analytical capacity, public employment services have not been strengthened. No sufficient progress made on ensuring the provision of childcare facilities and reducing the tax wedge.

33
CSR 5: Adopt and implement the youth action plan, in particular as regards the quality and labour market relevance of education and vocational training, including through the introduction of an apprenticeship scheme
This CSR was only partially implemented. The youth action plan was adopted in October 2012. In the area of employment, a limited number of actions were taken (e.g. two national projects co-financed by the structural funds, supporting job creation for young people); a more systematic approach to supporting people seeking a job for the first time is lacking. The VET reform adopted in September 2012 is in line with the CSR.
CSR 6: Take active measures to improve access to and quality of schooling and pre-school education of vulnerable groups, including Roma. Ensure labour market reintegration of adults through activation measures and targeted employment services, second-chance education and short-cycle vocational training
Slovakia implemented this CSR to a limited extent. A Roma reform has been publicly announced. It includes measures addressing the part of the CSR that deals with education. However, this has not been followed up by the required legislative acts or by the allocation of additional resources. Slovakia launched a number of projects supporting social inclusion. They are relevant but their sustainability and scale is inadequate given the magnitude of the problems.
CSR 7: Strengthen the quality of the public service, including by improving management of human resources and strengthening analytical capacities.
Slovakia implemented the CSR to a limited extent. A comprehensive reform to make local administration more efficient was launched this year. However, a strategic policy framework to improve the quality, human resource management practices and analytical capacities of central administration is still lacking. No measures were adopted to mitigate the impact of the political cycle on staffing decisions, nor were mechanisms to reduce corruption put in place. The improvement of analytical capacities does not seem to be supported by sufficient budget allocations.
Europe 2020 (national targets and progress)
Employment rate target: 72%
Employment rate only marginally increased to 65.2 % in 2012. The unemployment rate reached 14 % in 2012 and continued rising. Long-term and youth unemployment remains among the highest in the EU, and the labour market has been marked by educational, geographical, and skills mismatches. Employment rate of Roma is below 30 %.
R&D intensity target: 1.2%
The Slovak R&D intensity (0.68% of GDP) is one of the lowest in Europe and Slovakia is not on track to reach its national R&D intensity target of 1.2%. While the overall R&D intensity was in 2011 just above its 2000 level (0.65%), there has been since 2000 a strong decrease in business R&D intensity (from 0.43 % of GDP in 2000 to 0.25% in 2011), compensated by the strong increase in recent years of the public sector R&D intensity (from 0.22 % of GDP in 2000 to 0.42% in 2011).
Greenhouse gas (GHG) emissions target: +13 % (compared to 2005 emissions); ETS emissions are not
The change in non-ETS greenhouse gas emissions between 2005 and 2011 was -2 %. According to the

34
covered by this national target latest available projections, the target would be achieved by a wide margin as total change over 2005-20 would reach -24 %.
Renewable energy target: 14% Share of renewable energy in all modes of transport: 10%
Share of total renewable energy in gross final energy consumption was 9.7 % in 2011 and 0.4 % in the transport sector.77
Indicative national energy efficiency target for 2020: 3.12 Mtoe of final energy savings for the 2014-2020 period.
Slovakia has set an indicative national energy efficiency target in accordance with Articles 3 and 24 of the Energy Efficiency Directive (2012/27/EU). It has also expressed it, as required, in terms of an absolute level of primary and final energy consumption in 2020 and has provided information on the basis on which this data has been calculated. Reaching the target in 2020 implies achieving a level of 16.2 Mtoe primary consumption and 10.39 Mtoe final energy consumption.
Early school leaving target: 6%
The rate increased from 5% in 2011 to 5.3% in 2012, Slovakia being the second-best EU performer. National target is 6%, taking into account increasing proportion of Roma children at high risk of drop-out. Further measures to support their educational achievements are needed to stop the negative progression.
Tertiary education target: 40% Despite limited progress in 2012 (from 23.4% in 2011 to 23.7% in 2012), there has been a 60% increase since 2006.
Risk of poverty or social exclusion target: 17.2%
People at-risk-of-poverty or social exclusion decreased slightly by 6 000 to 1 112 000 in 2011. The achievement of the target to lift 170 000 out of the risk of poverty or social exclusion by 2020 is not realistic given the deteriorating conditions in the labour market and the negative impact of the crisis on disposable income of households. The risk of social exclusion remains significant in particular among children, Roma (above 90 %), low-skilled, single parents with dependent children.
77 Source: Eurostat. April 2013. For 2011, only formally reported biofuels compliant with Art. 17 and 18 of Directive 2009/28/EC are included.
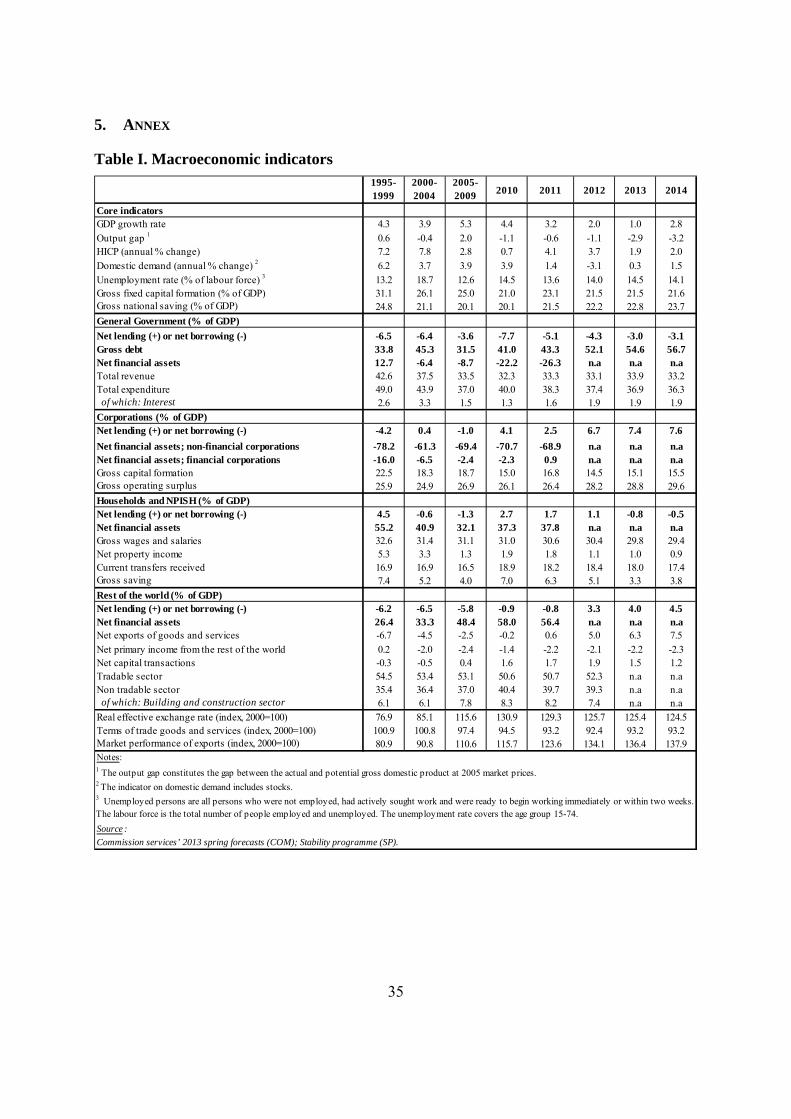
35
5. ANNEX
Table I. Macroeconomic indicators 1995-1999
2000-2004
2005-2009 2010 2011 2012 2013 2014
Core indicatorsGDP growth rate 4.3 3.9 5.3 4.4 3.2 2.0 1.0 2.8Output gap 1 0.6 -0.4 2.0 -1.1 -0.6 -1.1 -2.9 -3.2HICP (annual % change) 7.2 7.8 2.8 0.7 4.1 3.7 1.9 2.0Domestic demand (annual % change) 2 6.2 3.7 3.9 3.9 1.4 -3.1 0.3 1.5Unemployment rate (% of labour force) 3 13.2 18.7 12.6 14.5 13.6 14.0 14.5 14.1Gross fixed capital formation (% of GDP) 31.1 26.1 25.0 21.0 23.1 21.5 21.5 21.6Gross national saving (% of GDP) 24.8 21.1 20.1 20.1 21.5 22.2 22.8 23.7General Government (% of GDP)Net lending (+) or net borrowing (-) -6.5 -6.4 -3.6 -7.7 -5.1 -4.3 -3.0 -3.1Gross debt 33.8 45.3 31.5 41.0 43.3 52.1 54.6 56.7Net financial assets 12.7 -6.4 -8.7 -22.2 -26.3 n.a n.a n.aTotal revenue 42.6 37.5 33.5 32.3 33.3 33.1 33.9 33.2Total expenditure 49.0 43.9 37.0 40.0 38.3 37.4 36.9 36.3 of which: Interest 2.6 3.3 1.5 1.3 1.6 1.9 1.9 1.9Corporations (% of GDP)Net lending (+) or net borrowing (-) -4.2 0.4 -1.0 4.1 2.5 6.7 7.4 7.6Net financial assets; non-financial corporations -78.2 -61.3 -69.4 -70.7 -68.9 n.a n.a n.aNet financial assets; financial corporations -16.0 -6.5 -2.4 -2.3 0.9 n.a n.a n.aGross capital formation 22.5 18.3 18.7 15.0 16.8 14.5 15.1 15.5Gross operating surplus 25.9 24.9 26.9 26.1 26.4 28.2 28.8 29.6Households and NPISH (% of GDP)Net lending (+) or net borrowing (-) 4.5 -0.6 -1.3 2.7 1.7 1.1 -0.8 -0.5Net financial assets 55.2 40.9 32.1 37.3 37.8 n.a n.a n.aGross wages and salaries 32.6 31.4 31.1 31.0 30.6 30.4 29.8 29.4Net property income 5.3 3.3 1.3 1.9 1.8 1.1 1.0 0.9Current transfers received 16.9 16.9 16.5 18.9 18.2 18.4 18.0 17.4Gross saving 7.4 5.2 4.0 7.0 6.3 5.1 3.3 3.8Rest of the world (% of GDP)Net lending (+) or net borrowing (-) -6.2 -6.5 -5.8 -0.9 -0.8 3.3 4.0 4.5Net financial assets 26.4 33.3 48.4 58.0 56.4 n.a n.a n.aNet exports of goods and services -6.7 -4.5 -2.5 -0.2 0.6 5.0 6.3 7.5Net primary income from the rest of the world 0.2 -2.0 -2.4 -1.4 -2.2 -2.1 -2.2 -2.3Net capital transactions -0.3 -0.5 0.4 1.6 1.7 1.9 1.5 1.2Tradable sector 54.5 53.4 53.1 50.6 50.7 52.3 n.a n.aNon tradable sector 35.4 36.4 37.0 40.4 39.7 39.3 n.a n.a of which: Building and construction sector 6.1 6.1 7.8 8.3 8.2 7.4 n.a n.aReal effective exchange rate (index, 2000=100) 76.9 85.1 115.6 130.9 129.3 125.7 125.4 124.5Terms of trade goods and services (index, 2000=100) 100.9 100.8 97.4 94.5 93.2 92.4 93.2 93.2Market performance of exports (index, 2000=100) 80.9 90.8 110.6 115.7 123.6 134.1 136.4 137.9
Commission services’ 2013 spring forecasts (COM); Stability programme (SP).
Notes:1 The output gap constitutes the gap between the actual and potential gross domestic product at 2005 market prices.2 The indicator on domestic demand includes stocks.3 Unemployed persons are all persons who were not employed, had actively sought work and were ready to begin working immediately or within two weeks. The labour force is the total number of people employed and unemployed. The unemployment rate covers the age group 15-74.Source :

36
Table II. Comparison of macroeconomic developments and forecasts 2015 2016
COM SP COM SP COM SP SP SPReal GDP (% change) 2.0 2.0 1.0 1.2 2.8 2.9 3.3 3.6Private consumption (% change) -0.6 -0.6 0.0 -0.1 0.9 1.5 2.6 3.2Gross fixed capital formation (% change) -3.7 -3.7 1.4 2.3 3.0 3.3 2.4 2.0Exports of goods and services (% change) 8.6 8.6 3.0 3.3 6.2 4.9 4.8 4.7Imports of goods and services (% change) 2.8 2.8 2.4 3.5 5.1 4.1 4.0 4.3Contributions to real GDP growth:- Final domestic demand -1.5 -1.3 0.2 0.3 1.4 1.3 1.9 2.2- Change in inventories -1.6 -2.2 0.1 0.6 0.0 0.3 0.1 0.2- Net exports 5.2 5.5 0.7 0.2 1.4 1.3 1.3 1.1Output gap1 -1.1 -1.0 -2.9 -2.3 -3.2 -1.9 -0.9 0.5Employment (% change) 0.1 0.1 0.0 -0.5 0.5 0.5 0.7 0.8Unemployment rate (%) 14.0 14.0 14.5 14.3 14.1 13.8 13.0 12.1Labour productivity (% change) 2.0 2.1 0.9 1.7 2.3 2.3 2.6 2.8HICP inflation (%) 3.7 3.7 1.9 2.4 2.0 2.5 2.5 2.4GDP deflator (% change) 1.4 1.4 2.5 1.9 2.0 2.0 2.1 2.0Comp. of employees (per head, % change) 2.0 2.0 1.7 2.6 3.0 3.5 4.4 4.7Net lending/borrowing vis-à-vis the rest of the world (% of GDP)
3.3 2.4 4.0 1.9 4.5 2.4 3.1 3.7
1In percent of potential GDP, with potential GDP growth recalculated by Commission services on the basis of the programme scenario using the commonly agreed methodology.
Source :
Note:
Commission services’ 2013 spring forecasts (COM); Stability programme (SP).
2012 2013 2014

37
Table III. Composition of the budgetary adjustment
2012 2015 2016Change:
2012-2016
COM COM SP COM1 SP SP SP SP
Revenue6 33.1 33.9 34.1 33.2 31.8 30.6 31.7 -1.4of which:- Taxes on production and imports 9.9 9.8 9.8 9.6 9.3 8.8 8.7 -1.2- Current taxes on income, wealth, etc. 5.6 5.9 5.9 5.9 5.9 6.0 6.1 0.5- Social contributions 12.7 13.6 13.4 13.1 12.8 12.7 12.7 0.0- Other (residual) 5.0 4.6 5.0 4.6 3.8 3.1 4.2 -0.8Expenditure6 37.4 36.9 37.0 36.3 35.2 33.8 34.1 -3.3of which:- Primary expenditure 35.6 35.0 35.1 34.4 33.3 31.9 32.0 -3.6
of which:Compensation of employees 7.0 6.6 6.4 6.5 6.2 5.9 5.6 -1.4Intermediate consumption 4.3 4.0 4.0 3.9 4.1 3.7 5.3 1.0Social payments 18.6 18.3 18.4 18.0 17.9 17.6 17.4 -1.2Subsidies 1.4 1.2 1.2 1.3 1.1 1.1 1.0 -0.4Gross fixed capital formation 1.9 1.6 1.7 1.6 1.3 0.7 0.6 -1.3Other (residual) 2.4 3.3 3.4 3.1 2.7 2.8 2.1 -0.3
- Interest expenditure 1.9 1.9 1.9 1.9 1.9 1.9 2.1 0.2General government balance (GGB) -4.3 -3.0 -2.9 -3.1 -2.6 -2.0 -1.3 3.0Primary balance -2.5 -1.1 -1.0 -1.2 -0.7 -0.1 0.8 3.3One-off and other temporary measures 0.2 0.9 0.8 0.4 0.4 0.0 0.0 -0.2GGB excl. one-offs -4.5 -3.9 -3.7 -3.5 -3.0 -2.0 -1.3 3.2Output gap2 -1.1 -2.9 -2.3 -3.2 -1.9 -0.9 0.5 1.6Cyclically-adjusted balance2 -4.0 -2.1 -2.1 -2.0 -2.0 -1.7 -1.5 2.5Structural balance (SB)3 -4.1 -3.0 -2.9 -2.4 -2.4 -1.7 -1.5 2.7Change in SB 1.1 1.2 1.2 0.5 0.6 0.7 0.3 -Two year average change in SB 1.5 1.1 1.1 0.8 0.9 0.6 0.5 -Structural primary balance3 -2.3 -1.1 -1.0 -0.5 -0.5 0.2 0.6 2.9Change in structural primary balance 1.2 1.2 0.5 0.6 0.7 0.5 -Expenditure benchmarkApplicable reference rate4 1.83 1.83 1.83 1.50 1.50 1.50 1.50 -Deviation5 (% GDP) -1.9 -1.7 -3.2 0.1 0.0 0.0 -0.7 -Two-year average deviation (% GDP) -2.4 -1.8 -2.0 -0.8 -1.6 0.0 -0.4 -
6The revenue and expenditure figures are based on the General Government Budget Framework for 2014-2016, which assumes some expenditure-reducing measures (e.g. reduction of subsidies, a freeze of the wages for most employees financed from the central government budget) and revenue-increasing measures (e.g. a sale of emergency oil stocks) for 2014-2016. These measures, however, do not ensure achievement of the general government balance targets presented in this table.
4 Reference medium-term rate of potential GDP growth. The (standard) reference rate applies from year t+1, if the country has reached its MTO in year t. A lower rate applies as long as the country is adjusting towards its MTO, including in year t.The reference rates applicable to 2014 onwards have been updated in 2013. 5 Deviation of the growth rate of public expenditure net of discretionary revenue measures and revenue increases mandated by law from the applicable reference rate. The expenditure aggregate used for the expenditure benchmark is obtained following the commonly agreed methodology. A positive sign implies that expenditure growth exceeds the applicable reference rate.
2Output gap (in % of potential GDP) and cyclically-adjusted balance according to the programme as recalculated by Commission services on the basis of the programme scenario using the commonly agreed methodology.3Structural (primary) balance = cyclically-adjusted (primary) balance excluding one-off and other temporary measures.
Notes:1On a no-policy-change basis.
2014(% of GDP)
2013
Source :Stability programme (SP); Commission services’ 2013 spring forecasts (COM); Commission services’ calculations.

38
Table IV. Debt dynamics
Average 2015 2016
2007-2011 COM SP COM SP SP SP
Gross debt ratio1 35.5 52.1 54.6 54.8 56.7 56.3 56.7 55.9Change in the ratio 2.5 8.8 2.5 2.7 2.1 1.5 0.4 -0.8Contributions 2 :
1. Primary balance 3.5 2.5 1.1 1.0 1.2 1.5 1.2 0.32. “Snow-ball” effect -0.1 0.4 0.2 0.3 -0.6 -0.8 -0.9 -0.9
Of which:Interest expenditure 1.4 1.9 1.9 1.9 1.9 1.8 2.0 2.1Growth effect -1.1 -0.8 -0.5 -0.6 -1.5 -1.5 -1.8 -1.9Inflation effect -0.3 -0.6 -1.3 -0.9 -1.0 -1.1 -1.1 -1.0
3. Stock-flow adjustment -0.9 5.9 1.2 1.3 1.5 0.8 0.1 -0.2Of which:Cash/accruals diff. 0.5 0.5 0.4 0.2Acc. financial assets 0.8 1.0 1.0 0.7
Privatisation 0.0 0.0 0.0 0.0Val. effect & residual 0.1 0.0 -0.1 -0.1
2015 2016COM /
SP3 SP4 COM / SP3 SP4 SP SP
n.r. n.r. n.r. n.r. n.r. n.r. n.r.n.r. n.r. n.r. n.r. n.r. n.r. n.r.
n.r. n.r. n.r. n.r. n.r. n.r. n.r.
8Defines the remaining annual structural adjustment over the transition period which ensures that - if followed – Member State will comply with the debt reduction benchmark at the end of the transition period, assuming that COM (SP) budgetary projections for the previous years are achieved.
Source :
Stability programme (SP); Commission services’ spring 2013 forecasts (COM); Commission services’ calculations.
7Applicable only during the transition period of three years from the correction of the excessive deficit for EDP that were ongoing in November 2011.
Gap to the debt benchmark5,6
Structural adjustment7
To be compared to:
Required adjustment8
Notes:1End of period.2The snow-ball effect captures the impact of interest expenditure on accumulated debt, as well as the impact of real GDP growth and inflation on the debt ratio (through the denominator). The stock-flow adjustment includes differences in cash and accrual accounting, accumulation of financial assets and valuation and other residual effects. 3 Assessment of the consolidation path set in SP assuming growth follows the COM forecasts.4Assessment of the consolidation path set in the SP assuming growth follows the SP projections.5Not relevant for Member Sates that were subject to an EDP procedure in November 2011 and for a period of three years following the correction of the excessive deficit.6Shows the difference between the debt-to-GDP ratio and the debt benchmark. If positive, projected gross debt-to-GDP ratio does not comply with the debt reduction benchmark.
(% of GDP) 20122013 2014
20122013 2014

39
Table V. Sustainability indicators
No-policy change scenario
Programme (SCP) scenario
No-policy change scenario
Programme (SCP) scenario
S2 4.9 3.9 3.0 1.3of which:
Initial budgetary position (IBP) 1.5 0.4 0.8 -0.9Long-term cost of ageing (CoA) 3.5 3.5 2.2 2.2of which:
Pensions 1.5 1.5 1.0 1.1Health care 2.0 2.0 0.9 0.8Long-term care 0.2 0.2 0.6 0.6Others -0.3 -0.3 -0.4 -0.3
S1 (required adjustment)* 0.6 -0.7 2.2 0.5of which:
Initial budgetary position (IBP) 0.3 -0.9 0.0 -1.8Debt requirement (DR) -0.2 -0.3 1.9 1.9Long-term cost of ageing (CoA) 0.5 0.5 0.3 0.4
S0 (risk for fiscal stress)**Debt, % of GDP (2012)Age-related expenditure, % of GDP (2012) 17.7 25.8
Note: The 'No-policy change' scenario depicts the sustainability gap under the assumption that the budgetary position evolves according to the Commissions' spring 2013 forecast until 2014. The 'Programme (SCP)' scenario depicts the sustainability gap under the assumption that the budgetary plans in the programme are fully implemented.* The required adjustment of the primary balance until 2020 to reach a public debt of 60% of GDP by 2030. ** The critical threshold for the S0 indicator is 0.44.
Source : Commission services; 2013 stability programme.
SK EU27
0.33 :52.1 87.0

40
0 10 20 30 40 50 60 70 80
1990
1992
1994
1996
1998
2000
2002
2004
2006
2008
2010
2012
2014
2016
2018
2020
2022
2024
2026
2028
2030
CO
M no-policy change scenario
CO
M + Shock ( -1p.p. in the short-term
/long-term interest rate on m
aturing and new debt from
2015)
CO
M + Shock (+1p.p. in the short-term
/long-term interest rate on m
aturing and new debt from
2015)
CO
M consolidation scenario (0.5%
per year on SB) in order to achieve MTO
CO
M consolidation scenario (1%
per year on SB) in order to achieve MTO
SCP
scenario
(% of G
DP)
Gross debt as %
of GD
P -SK -M
edium term
debt projections

41
Table VI. Taxation indicators
2002 2006 2008 2009 2010 2011
Total tax revenues (incl. actual compulsory social contributions, % of GDP) 33.0 29.3 29.3 28.9 28.1 28.5
Breakdown by economic function (% of GDP)1
Consumption 11.0 11.2 10.5 10.4 10.1 10.5 of which: - VAT 7.0 7.5 6.9 6.7 6.3 6.8 - excise duties on tobacco and alcohol 1.1 0.9 0.9 1.1 1.3 1.3 - energy 1.9 2.0 1.8 1.7 1.6 1.6 - other (residual) 1.1 0.8 0.9 0.8 0.8 0.8 Labour employed 14.6 11.2 12.1 12.2 12.2 11.9 Labour non-employed 0.6 0.8 0.7 0.7 0.5 0.7 Capital and business income 6.1 5.5 5.5 5.0 4.6 4.8 Stocks of capital/wealth 0.8 0.7 0.6 0.6 0.6 0.6
p.m. Environmental taxes2 2.2 2.3 2.0 2.0 1.9 1.8
VAT efficiency3
Actual VAT revenues as % of theoretical revenues at standard rate 42.8 57.3 53.7 47.6 46.7 49.7
2 This category comprises taxes on energy, transport and pollution and resources included in taxes on consumption and capital.3 The VAT efficiency is measured via the VAT revenue ratio. The VAT revenue ratio is defined as the ratio between the actual VAT revenue collected and the revenue that would theoretically be raised if VAT was applied at the standard rate to all final consumption. A low ratio can indicate a reduction of the tax base due to large exemptions or the application of reduced rates to a wide range of goods and services ('policy gap') or a failure to collect all tax due to e.g. fraud ('collection gap'). See European Commission (2012), Tax reforms in EU Member States, European Economy 6/2012 and Taxation Papers 34/2012 for a more detailed explanation.
Source: Commission
Note: 1 Tax revenues are broken down by economic function, i.e. according to whether taxes are raised on consumption, labour or capital. See European Commission (2013) Taxation trends in the European Union, for a more detailed explanation.

42
Table VII. Financial market indicators
2008 2009 2010 2011 2012
Total assets of the banking sector (% of GDP) 101.7 89.5 88.2 83.9 82.5Share of assets of the five largest banks (% of total assets) 71.6 72.1 72.0 72.2 …Foreign ownership of banking system (% of total assets) 92.8 96.1 … … …Financial soundness indicators: - non-performing loans (% of total loans)1) 3.2 5.3 5.8 5.6 5.0 - capital adequacy ratio (%) 1) 11.1 12.6 12.7 13.4 15.8 - return on equity (%) 1), 2) 15.4 6.7 12.6 14.5 11.2Bank loans to the private sector (year-on-year % change) 16.7 1.1 5.3 9.3 3.8Lending for house purchase (year-on-year % change) 26.1 10.9 14.8 13.7 11.1Loan to deposit ratio 81.5 87.0 90.7 90.3 87.2CB liquidity as % of liabilities 0.0 4.3 2.0 2.9 3.9Banks' exposure to countries receiving official financial assistance (% of GDP) … … … … …Private debt (% of GDP) 47.3 48.9 49.5 50.5 49.7
Gross external debt (% of GDP)3)
- Public 11.3 12.4 15.0 17.0 23.4 - Private 26.3 27.3 27.7 28.0 28.4Long term interest rates spread versus Bund (basis points)* 0.7 1.5 1.1 1.8 3.1
Credit default swap spreads for sovereign securities (5-year)* 145.5 106.9 77.8 134.9 192.4
* Measured in basis points.
Notes: 1) Latest data (September 2012).2) Excludes foreign branches.3) Latest data 2012Q3.
Source :
Bank for International Settlements and Eurostat (exposure to macro-financially vulnerable countries), IMF (financial soundness indicators), Commission (long-term interest rates), World Bank (gross external debt) and ECB (all other indicators).

43
Table VIII. Labour market and social indicators
Labour market indicators 2007 2008 2009 2010 2011 2012Employment rate
(% of population aged 20-64)67.2 68.8 66.4 64.6 65.1 65.0
Employment growth (% change from previous year)
2.1 3.2 -2.0 -1.5 1.8 0.0
Employment rate of women(% of female population aged 20-64)
58.7 60.3 58.2 57.4 57.6 57.3
Employment rate of men (% of male population aged 20-64)
76.0 77.4 74.6 71.9 72.7 72.8
Employment rate of older workers (% of population aged 55-64)
35.6 39.2 39.5 40.5 41.4 43.1
Part-time employment (% of total employment, 15 years and more)
2.6 2.7 3.6 3.9 4.1 4.2
Part-time employment of women (% of women employment, 15 years and more)
4.5 4.2 4.7 5.4 5.9 5.7
Part-time employment of men (% of men employment, 15 years and more)
1.1 1.4 2.7 2.8 2.8 2.9
Fixed term employment (% of employees with a fixed term contract, 15 years and more)
5.1 4.7 4.4 5.8 6.6 6.8
Transitions from temporary to permanent employment
8.0 4.9 4.0 2.9 : :
Unemployment rate1 (% of labour force, age group 15-74)
11.2 9.6 12.1 14.5 13.6 14.0
Long-term unemployment rate2 (% of labour force) 8.3 6.7 6.5 9.3 9.2 9.4Youth unemployment rate
(% of youth labour force aged 15-24)20.6 19.3 27.6 33.9 33.5 34.0
Youth NEET rate (% of population aged 15-24) 12.5 11.1 12.5 14.1 13.8 13.8
Early leavers from education and training (% of pop. 18-24 with at most lower sec. educ. and not in further education or training) 6.5 6.0 4.9 4.7 5.0 5.3
Tertiary educational attainment (% of population 30-34 having successfully completed tertiary education)
14.8 15.8 17.6 22.1 23.4 23.7
Formal childcare (from 1 to 29 hours; % over the population less than 3 years)
1.0 0.0 1.0 0.0 1.0 :
Formal childcare (30 hours or over; % over the population less than 3 year)
1.0 2.0 2.0 3.0 3.0 :
Labour productivity per person employed (annual % change) 8.2 2.4 -3.0 6.0 1.4 2.0Hours worked per person employed (annual % change) 0.9 0.1 -0.7 1.5 -0.8 -0.4
Labour productivity per hour worked (annual % change; constant prices)
7.2 2.3 -2.3 4.4 2.2 2.4
Compensation per employee (annual % change; constant prices) 7.5 4.0 3.7 4.5 -0.6 0.7
Nominal unit labour cost growth (annual % change) 0.5 4.4 5.7 -0.9 -0.4 0.1Real unit labour cost growth (annual % change) -0.6 1.5 7.0 -1.4 -2.0 -1.3
Notes:1 Unemployed persons are all persons who were not employed, had actively sought work and were ready to begin working immediately or within two weeks. The labour force is the total number of people employed and unemployed.2 Long-term unemployed are unemployed persons for at least 12 months.
Sources: Commission (EU Labour Force Survey and European National Accounts)

44
Expenditure on social protection benefits (% of GDP)
2006 2007 2008 2009 2010
Sickness/Health care 4.75 4.75 5.07 5.75 5.55Invalidity 1.34 1.31 1.40 1.55 1.57
Old age and survivors 6.91 6.76 6.61 7.77 7.76Family/Children 1.65 1.55 1.48 1.72 1.76Unemployment 0.53 0.56 0.60 1.04 0.92
Housing and Social exclusion n.e.c. 0.00 0.00 0.00 0.00 0.00Total 15.74 15.43 15.55 18.25 18.02
of which: means tested benefits 1.02 0.95 0.77 0.89 0.00
Social inclusion indicators 2007 2008 2009 2010 2011
At-risk-of-poverty or social exclusion1
(% of total population)21.3 20.6 19.6 20.6 20.6
At-risk-of-poverty or social exclusion of children (% of people aged 0-17)
25.8 24.3 23.7 25.3 26.0
At-risk-of-poverty or social exclusion of elderly (% of people aged 65+)
22.0 21.9 19.7 16.7 14.5
At-Risk-of-Poverty rate2 (% of total population) 10.6 10.9 11.0 12.0 13.0
Severe Material Deprivation3 (% of total population) 13.7 11.8 11.1 11.4 10.6
Share of people living in low work intensity households4 (% of people aged 0-59)
6.4 5.2 5.6 7.9 7.6
In-work at-risk-of poverty rate (% of persons employed) 4.9 5.8 5.2 5.7 6.3Impact of social transfers (excluding pensions) on reducing
poverty41.8 40.8 35.7 39.4 33.3
Poverty thresholds, expressed in national currency at constant prices5 2383 2822 3213 3434 3516
Gross disposable income (households) 36249 39755 40283 42127 43167Relative median poverty risk gap (60% of median equivalised
income, age: total) 19.2 18.1 23.2 25.7 22.8
Notes:
4 People living in households with very low work intensity: share of people aged 0-59 living in households where the adults (excluding dependent children) work less than 20% of their total work-time potential during the previous 12 months.5 For EE, CY, MT, SI, SK, thresholds in nominal values in Euros; HICP - index 100 in 2006 (2007 survey refers to 2006 incomes)
Sources: For expenditure for social protection benefits ESSPROS; for social inclusion EU-SILC.
2 At-risk-of poverty rate (AROP): share of people with an equivalised disposable income below 60% of the national equivalised median income. 3 Share of people who experience at least 4 out of 9 deprivations: people cannot afford to i) pay their rent or utility bills, ii) keep their home adequately warm, iii) face unexpected expenses, iv) eat meat, fish, or a protein equivalent every second day, v) enjoy a week of holiday away from home once a year, vi) have a car, vii) have a washing machine, viii) have a colour tv, or ix) have a telephone.
1 People at-risk-of poverty or social exclusion (AROPE): individuals who are at-risk-of poverty (AROP) and/or suffering from severe material deprivation (SMD) and/or living in household with zero or very low work intensity (LWI).

45
Table IX. Product markets performance and policy indicators
Performance indicators 2003-2007
2008 2009 2010 2011 2012
Labour productivity1 total economy (annual growth in %)
6.1 2.4 -3.0 6.0 1.4 2.0
Labour productivity1 in manufacturing (annual growth in %)
13.1 3.4 -4.5 25.6 2.1 13.8
Labour productivity1 in electricity, gas, steam and air conditioning supply (annual growth in %)
17.1 -1.4 -19.8 -2.3 12.2 n.a.
Labour productivity1 in the construction sector (annual growth in %)
7.2 10.0 -10.8 1.0 7.7 -3.6
Total number of patent2 applications per million of labour force
12.1 12.6 12.9 12.1 n.a. n.a.
Policy indicators 2003-2007
2008 2009 2010 2011 2012
Enforcing contracts3 (days) 583 565 565 565 565 545
Time to start a business3 (days) 47 18 18 18 18 16R&D expenditure (% of GDP) 0.5 0.5 0.5 0.6 0.7 n.a.
Tertiary educational attainment (% of 30-34 years old population)
13.6 15.8 17.6 22.1 23.4 23.2
Total public expenditure on education (% of GDP) 3.95 3.61 4.09 4.22 n.a. n.a.
2007 2008 2009 2010 2011 2012
Product market regulation4, Overall(Index; 0=not regulated; 6=most regulated)
n.a. 1.6 n.a. n.a. n.a. n.a.
Product market regulation4, Retail(Index; 0=not regulated; 6=most regulated)
n.a. 0.8 n.a. n.a. n.a. n.a.
Product market regulation4, Network Industries5
(Index; 0=not regulated; 6=most regulated)2.0 n.a. n.a. n.a. n.a. n.a.
1 Labour productivity is defined as gross value added (in constant prices) divided by the number of persons employed.
Notes:
Commission, World Bank - Doing Business (for enforcing contracts and time to start a business) and OECD (for the product market regulation indicators).
2 Total number of patent applications to the European Patent Office (EPO) per million of labour force3 The methodologies, including the assumptions, for this indicator are presented in detail on the website http://www.doingbusiness.org/methodology. 4 The methodologies of the product market regulation indicators are presented in detail on the website http://www.oecd.org/document/1/0,3746,en_2649_34323_2367297_1_1_1_1,00.html. The latest available product market regulation indicators refer to 2003 and 2008, except for Network Industries.5 Aggregate Energy, Transport and Communications Regulation (ETCR).*figure for 2007.
Source :

46
Table X. Green Growth
2002-2006 2007 2008 2009 2010 2011
Green Growth performanceMacroeconomic
Energy intensity kgoe / € 0.71 0.53 0.52 0.50 0.51 0.48Carbon intensity kg / € 1.95 1.46 1.41 1.31 1.31 n.a.Resource intensity (reciprocal of resource productivity) kg / € 2.54 2.15 2.34 2.17 n.a. n.a.Waste intensity kg / € n.a. n.a. 0.32 n.a. 0.30 n.a.Energy balance of trade % GDP -5.3% -5.0% -6.0% -4.4% -5.8% -6.5%Energy weight in HICP % n.a. 18 17 16 16 15Difference between change energy price and inflation % n.a. 0.7 0.2 2.7 -4 4.7Environmental taxes over labour taxes ratio 18.2% 18.6% 16.5% 15.7% 15.6% n.a.Environmental taxes over total taxes ratio 7.5% 7.2% 6.8% 6.6% 6.8% n.a.
Sectoral Industry energy intensity kgoe / € 0.47 0.30 0.29 0.31 0.37 n.a.Share of energy-intensive industries in the economy % GDP 16.0 16.6 15.1 13.3 n.a. n.a.Electricity prices for medium-sized industrial users** € / kWh n.a. 0.10 0.12 0.14 0.12 0.13Gas prices for medium-sized industrial users*** € / kWh n.a. 0.03 0.04 0.04 0.03 0.04Public R&D for energy % GDP n.a. 0.01% 0.01% 0.01% 0.01% 0.01%Public R&D for the environment % GDP n.a. 0.01% 0.01% 0.01% 0.01% 0.01%Recycling rate of municipal waste ratio 8.5% 13.2% 15.8% 14.6% 18.1% n.a.Share of GHG emissions covered by ETS* % n.a. 50.5% 51.6% 49.1% 47.3% 49.1%Transport energy intensity kgoe / € n.a. 0.78 0.79 0.73 n.a. n.a.Transport carbon intensity kg / € n.a. 2.05 1.94 1.90 n.a. n.a.
Security of energy supplyEnergy import dependency % n.a. 68.4% 64.6% 66.4% 63.0% 64.2%Diversification of oil import sources HHI n.a. 0.69 0.67 0.68 0.66 n.a.Diversification of energy mix HHI n.a. 0.22 0.23 0.22 0.22 0.22Share renewable energy in energy mix % n.a. 5.4% 5.4% 7.2% 7.8% 7.8%
Country-specific notes: The year 2012 is not included in the table due to lack of data.General explanation of the table items:Source: Eurostat unless indicated otherwise; ECFIN elaborations indicated belowAll macro intensity indicators are expressed as a ratio of a physical quantity to GDP (in 2000 prices) Energy intensity: gross inland energy consumption (in kgoe) divided by GDP (in EUR) Carbon intensity: Greenhouse gas emissions (in kg CO2 equivalents) divided by GDP (in EUR) Resource intensity: Domestic Material Consumption (in kg) divided by GDP (in EUR) Waste intensity: waste (in kg) divided by GDP (in EUR)Energy balance of trade: the balance of energy exports and imports, expressed as % of GDP Energy weight in HICP: the share of the "energy" items in the consumption basket used in the construction of the HICPDifference between energy price change and inflation: energy component of HICP, and total HICP inflation (annual %-change)Environmental taxes over labour or total taxes: from DG TAXUD's database "Taxation trends in the European Union"Industry energy intensity: final energy consumption of industry (in kgoe) divided by gross value added of industry (in 2005 EUR) Share of energy-intensive industries in the economy: share of gross value added of the energy-intensive industries in GDPElectricity and gas prices medium industrial users: consumption band 500 - 2000MWh and 10000 - 100000 GJ; figures excl. VAT.Recycling rate of municipal waste: ratio of municipal waste recycled over total municipal wastePublic R&D for energy or for the environment: government spending on R&D (GBAORD) for these categories as % of GDPShare of GHG emissions covered by ETS: based on greenhouse gas emissions as reported by Member States to EEA (excl LULUCF)Transport energy intensity: final energy consumption of transport activity (kgoe) divided by transp industry gross value added (2005 EUR)Transport carbon intensity: greenhouse gas emissions in transport activity divided by gross value added of the transport sectorEnergy import dependency: net energy imports divided by gross inland energy consumption incl. energy consumption international bunkersDiversification of oil import sources: Herfindahl index (HHI), calculated as the sum of the squared market shares of countries of origin Diversification of the energy mix: Herfindahl Index over natural gas, total petrol products, nuclear heat, renewable energies and solid fuelsShare renewable energy in energy mix: %-share in gross inland energy consumption, expressed in tonne oil equivalents*Provisional figures provided by DG CLIMA. Final figures will be available on 15/04.** For 2007 average of S1 & S2 for DE, LU, NL, FI, SE & UK. Other countries only have S2.*** For 2007 average of S1 & S2 for IT, NL, FI, SE & UK. Other countries only have S2.


![Staff Development Programme[1]](https://static.fdocuments.in/doc/165x107/577d227f1a28ab4e1e9789fd/staff-development-programme1.jpg)


