Commission Report the UNFCCC and the Kyoto Protocol ...
110
EN EN EUROPEAN COMMISSION Brussels, 14.12.2017 SWD(2017) 457 final PART 2/2 COMMISSION STAFF WORKING DOCUMENT Seventh National Communication of the EU Accompanying the document Commission Report Seventh national communication and third biennial report from the European Union under the UN Framework Convention on Climate Change (UNFCCC) (required under the UNFCCC and the Kyoto Protocol) {C(2017) 8511 final} - {SWD(2017) 458 final}
Transcript of Commission Report the UNFCCC and the Kyoto Protocol ...

EN EN
EUROPEAN COMMISSION
Brussels, 14.12.2017
SWD(2017) 457 final
PART 2/2
COMMISSION STAFF WORKING DOCUMENT
Seventh National Communication of the EU
Accompanying the document
Commission Report
Seventh national communication and third biennial report from the European Union
under the UN Framework Convention on Climate Change (UNFCCC) (required under
the UNFCCC and the Kyoto Protocol)
{C(2017) 8511 final} - {SWD(2017) 458 final}

101
Contents
Food production and supply ............................................................................ 104 6.3.1.
Forestry ............................................................................................................ 105 6.3.2.
Freshwater resources ........................................................................................ 106 6.3.3.
Marine resources and fisheries......................................................................... 107 6.3.4.
Energy .............................................................................................................. 107 6.3.5.
Infrastructure and Urban Settlements .............................................................. 108 6.3.6.
Biodiversity, Ecosystems and Ecosystem Services ......................................... 110 6.3.7.
Health ............................................................................................................... 111 6.3.8.
Economic activity and employment................................................................. 114 6.3.9.
Social issues ................................................................................................. 115 6.3.10.
EU-level actions for adaptation to climate change .................................................. 116 6.4.
The EU Strategy on Adaptation to Climate Change ........................................ 116 6.4.1.
Monitoring and evaluation framework .................................................................... 117 6.5.
Progress and outcomes of adaptation action ........................................................... 117 6.6.
7. Financial, technological and capacity-building support ................................................ 124
Introduction ............................................................................................................. 124 7.1.
Provision of ‘new and additional’ resources ........................................................... 125 7.2.
Assistance to developing country Parties that are particularly vulnerable to climate 7.3.
change ................................................................................................................................ 125
Provision of financial resources through multilateral channels .............................. 125 7.4.
Provision of financial resources through bilateral channels .................................... 125 7.5.
Activities related to the transfer of technology and capacity building .................... 125 7.6.
8. Research and systematic observations ........................................................................... 126
8.1. Introduction ............................................................................................................. 126
8.2. General policy on and funding of research and systematic observations ............... 127
8.2.1. General policy on RSO .................................................................................... 127
8.2.2. Funding of RSO ............................................................................................... 139
8.3. Research .................................................................................................................. 143
8.3.1. Climate process and climate system studies, including paleoclimate studies . 144
8.3.2. Modelling and prediction, including general circulation models .................... 145
8.3.3. Research on the impacts of climate change ..................................................... 145

102
8.3.4. Socio-economic analysis, including analysis of both the impacts of climate
change and response options .......................................................................................... 146
8.3.5. Research and development on mitigation and adaptation technologies .......... 146
8.3.6. Research and demonstration of climate services ............................................. 148
8.4. Systematic observation ............................................................................................ 148
8.4.1. Cross-cutting activities..................................................................................... 149
8.4.2. Atmospheric climate observing systems, including those measuring
atmospheric constituents ................................................................................................ 154
8.4.3. Ocean climate observing systems .................................................................... 155
8.4.4. Terrestrial climate observing systems .............................................................. 156
8.4.5. Climate change services ................................................................................... 157
8.4.6. Cryosphere climate observing systems ............................................................ 158
8.4.7. Paleoclimate ..................................................................................................... 159
8.4.8. Support for developing countries to establish and maintain observing systems,
related data and monitoring systems .............................................................................. 159
8.5. Research Infrastructures .......................................................................................... 160
8.5.1. Atmospheric research ....................................................................................... 161
8.5.2. Ocean and Marine research .............................................................................. 162
8.5.3. Arctic research ................................................................................................. 163
8.5.4. Biodiversity ...................................................................................................... 163
9. Education, training and public awareness ...................................................................... 164
Introduction and general policy toward education, training and public awareness 164 9.1.
Primary, secondary and higher education ............................................................... 165 9.2.
Erasmus+ – Education ..................................................................................... 165 9.2.1.
Horizon 2020 – science education ................................................................... 165 9.2.2.
Climate KIC and InnoEnergy .......................................................................... 165 9.2.3.
Public information campaigns ................................................................................. 166 9.3.
EU Climate Diplomacy Days,,......................................................................... 166 9.3.1.
EU Open Doors Day,, ...................................................................................... 167 9.3.2.
Covenant of Mayors for Climate and Energy .................................................. 167 9.3.3.
EU Sustainable Energy Week .......................................................................... 168 9.3.4.
Resource Efficiency Campaign ........................................................................ 168 9.3.5.
EU Green Week ............................................................................................... 169 9.3.6.
European Business Awards for the Environment ............................................ 169 9.3.7.
European Green Capital Award and European Green Leaf Award ................. 169 9.3.8.
Our planet, our future ....................................................................................... 170 9.3.9.

103
European Mobility Week, ............................................................................ 171 9.3.10.
Monitoring public opinion ...................................................................................... 171 9.4.
Eurobarometer results on climate change (2017) ............................................ 171 9.4.1.
Eurobarometer results on environment (for 2014) , ......................................... 172 9.4.2.
Communication activities ........................................................................................ 172 9.5.
Web and social media ...................................................................................... 172 9.5.1.
Publications ...................................................................................................... 173 9.5.2.
Video productions ............................................................................................ 174 9.5.3.
Side events at international climate conferences ............................................. 175 9.5.4.
Training ................................................................................................................... 175 9.6.
Erasmus+ – Training ........................................................................................ 175 9.6.1.
ManagEnergy ................................................................................................... 176 9.6.2.
Resource or information centres ............................................................................. 176 9.7.
Involvement of the public and non-governmental organisations ............................ 176 9.8.
Consultation on revision to the EU Emission Trading System Directive ........ 176 9.8.1.
Public consultation on the preparation of a legislative proposal on the effort of 9.8.2.
Member States to reduce their greenhouse gas emissions to meet the European Union's
greenhouse gas emission reduction commitment in a 2030 perspective ....................... 177
International cooperation on education, training and public awareness ................. 177 9.9.
Doha Work Programme on Article 6 of the Convention ................................. 177 9.9.1.
Article 6-related international cooperation activities ....................................... 177 9.9.2.
10. List of abbreviations ................................................................................................... 180
Appendix I: Summary of the reporting on supplementary information under article 7.2 of the
kyoto protocol ........................................................................................................................ 184
Appendix II: Summary Tables of GHG Emissions in the EU-28+ISL ................................. 185
Appendix III: Main EU programmes on research and systematic observation ..................... 191
104
1.1.
Food production and supply 1.1.1.
Agriculture still plays a dominant economic role in many regions in Europe, and at the same
time continues to be the predominant user of land and water resources. As highlighted in
Section 6.3.1 of the 6NC, the stress imposed by climate change on agriculture is likely to
intensify the regional disparities between European countries, with some regions
experiencing positive impacts, and others experiencing only negative impacts.
Observed changes in crop phenology include the advancement of flowering and harvest dates
in cereals. Projected temperature rise will lead to increased evapotranspiration rates, thereby
increasing crop water demand across Europe. Water demand is expected to increase most in
southern and central Europe, where crop deficit and irrigation needs are projected to increase.
Expansion of a range of agricultural pests not previously found in Europe can be expected
due to increased temperatures allowing them to survive wintertime and to have multiple
generation cycles per year, and by increasing the susceptibility of crops and trees to new
dangerous pests of plants from other continents.
As discussed in Section 6.3.9 of the 6NC, the expected main effect of climate change in the
coming decades will be to shift food production from southern to northern Europe without
significantly curtailing overall production.
Europe is already susceptible to spill over effects from climate change impacts occurring
outside the European territory through various pathways, including agricultural commodities.
Europe in fact relies increasingly on imports to meet demand for food and feed supply.
Climate impacts on agriculture experienced outside Europe are having an effect on the supply
of agricultural commodities within Europe. The Mediterranean area has been identified as the
most vulnerable to shocks in the flow of agricultural commodities, primarily due to its high
dependence on food imports from outside the EU as well as the prominent role food plays in
its economy.
The FOOD 2030 SWD (European Research and Innovation for Food and Nutrition Security)
initiated in 2016 is a first step in the further development of a more coherent approach to
research and innovation in response to recent international political drivers, including the
Sustainable Development Goals and the Paris Agreement. FOOD 2030 is calling for a
systemic approach to future-proofing our nutrition and food systems towards becoming
sustainable, resilient, diverse, responsible, inclusive and competitive in the longer term.
FOOD 2030 builds on four priorities: Nutrition for sustainable and healthy diets; Climate-
smart and environmentally sustainable food systems; Circular and resource efficient food
systems; Innovation and empowerment of communities.

105
Forestry 1.1.2.
Climate change impacts on forests and on the ecosystem services they provide include shifts
of tree species towards higher altitudes and latitudes, an increased risk of forest fires -
particularly in southern Europe - as well as an increased incidence of forest pest insects.
Forests cover around 215 million hectares across Europe, which is around 33 % of the total
land area. In recent years, large forest fires have repeatedly affected Europe, in particular
Mediterranean countries. The danger of forest fires will increase with unmitigated climate
change (preliminary results of the JRC PESETA III project). See Figure 6.6 below.
Cold-adapted coniferous tree species are expected to lose large areas of their ranges to
broadleaf species, and forest growth is projected to decrease in southern Europe but increase
in Northern Europe. Furthermore, projected changes to forest ecosystems will have an impact
on the goods and services that forests provide. For example, the value of forestland in Europe
is forecast to decrease between 14 % and 50 % during the 21st century.
Figure 6-1 Forest fire danger in present, and under two climate change scenarios,
according to two different climate models (H3 and H5), selected to
demonstrate the effect of using different climate models.1
1 JRC (2017) PESETA III Science for Policy Summary Series: Climate Change and Forest Fires

106
Freshwater resources 1.1.3.
Vulnerability to climate change is intimately linked to the impact on water resources
through floods and droughts, but also through the impact on fisheries and low river flows on
aquatic ecosystems.
The Mediterranean region is expected to be increasingly affected by severe impacts on its
water resources, due to extreme high temperatures and droughts. There is high certainty that
the water resources of mountain regions will be negatively affected in the future. This will
have impacts on hydropower production, winter tourism and ecosystems. Physical risk to
infrastructure and settlements from slope instability may also increase.
According to the preliminary results of the droughts and water sectors of the JRC PESETA
III project, under a 2°C climate future the Southwest Mediterranean is a region of concern,
with extreme droughts projected for much of Southern Europe. Regarding river floods,
around 216 000 people across the EU are already exposed to river flooding annually, with
flood damage amounting to € 5.3 billion each year. Under 3 °C global warming and
assuming present socio-economic conditions prevail into the future, and that there is no
adaptation, flood risk could almost triple (preliminary findings of the JRC PESETA III
study). Over 600 000 people could be exposed to floods each year, amounting to € 14.5
billion of annual losses.
With respect to coastal systems, the study’s preliminary results also show that if no
adaptation measures are taken, climate and socio-economic change could increase annual
flood damages by around € 960 billion. From around 100 000 people currently, coastal
floods could affect 3.6 million people annually across Europe by the end of the century, an
increase by a factor of 35.
Marine resources and fisheries 1.1.4.
Increased water temperature and reduced oxygen can result in marked changes in species
composition, nutritional value and size, and on the functioning of aquatic ecosystems.
Climate change has negatively impacted the resilience of marine ecosystems, making them
more vulnerable to other high intensity ecological stressors such as overfishing, pollution and
introduction of non-indigenous species. Of the commonly observed demersal fish species
(fish living and feeding on or near the bottom of seas or lakes), 72 % have experienced
changes in abundance and/or distribution in response to warming waters. This change has
already had important impacts on fisheries in the Atlantic region.
Elevated sea temperatures have triggered a major northwards retreat of colder water plankton
in the North-east Atlantic, estimated at 1 100 km over the last 40 years. This trend has
accelerated since 2000 and is expected to shift the distribution of fisheries. Sub-arctic species
are receding northwards as a result, and more sub-tropical species are appearing in European
fisheries. Continued changes in fisheries distribution will affect the livelihoods of fishing
communities and impact current international agreements on the exploitation of straddling
and highly migratory stocks.
107
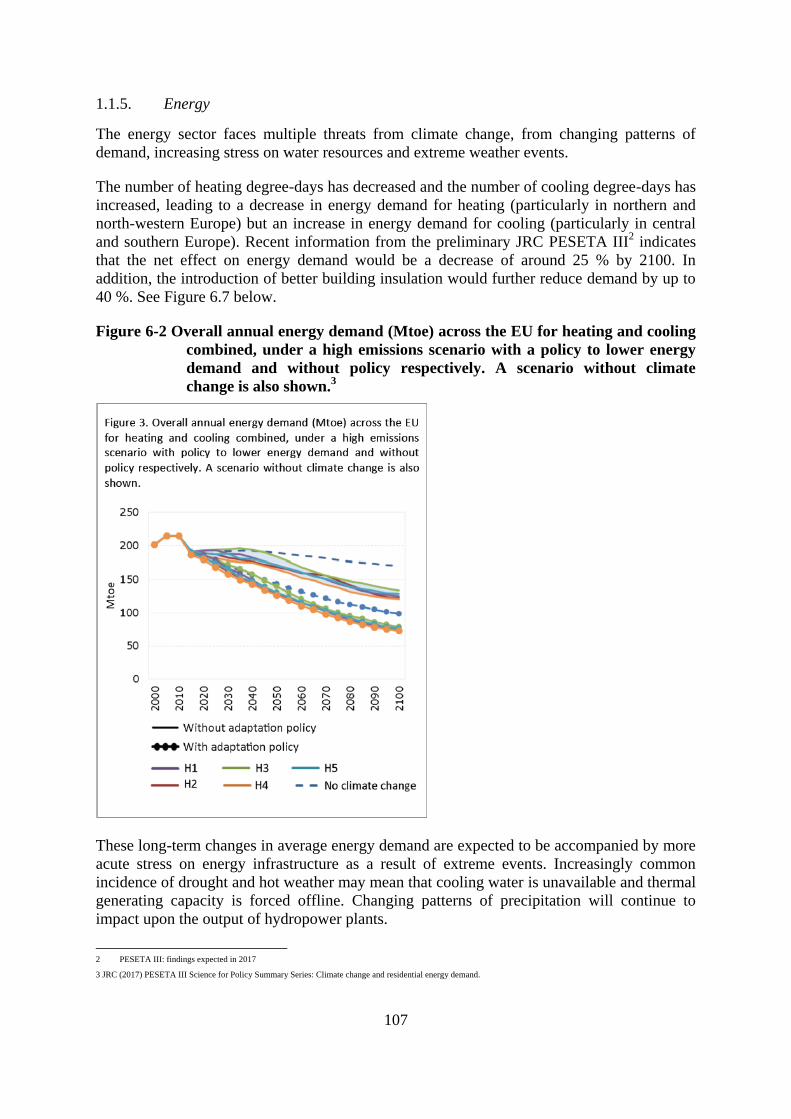
Energy 1.1.5.
The energy sector faces multiple threats from climate change, from changing patterns of
demand, increasing stress on water resources and extreme weather events.
The number of heating degree-days has decreased and the number of cooling degree-days has
increased, leading to a decrease in energy demand for heating (particularly in northern and
north-western Europe) but an increase in energy demand for cooling (particularly in central
and southern Europe). Recent information from the preliminary JRC PESETA III2 indicates
that the net effect on energy demand would be a decrease of around 25 % by 2100. In
addition, the introduction of better building insulation would further reduce demand by up to
40 %. See Figure 6.7 below.
Figure 6-2 Overall annual energy demand (Mtoe) across the EU for heating and cooling
combined, under a high emissions scenario with a policy to lower energy
demand and without policy respectively. A scenario without climate
change is also shown.3
These long-term changes in average energy demand are expected to be accompanied by more
acute stress on energy infrastructure as a result of extreme events. Increasingly common
incidence of drought and hot weather may mean that cooling water is unavailable and thermal
generating capacity is forced offline. Changing patterns of precipitation will continue to
impact upon the output of hydropower plants.
2 PESETA III: findings expected in 2017
3 JRC (2017) PESETA III Science for Policy Summary Series: Climate change and residential energy demand.

108
Infrastructure and Urban Settlements 1.1.6.
Cities and urban areas 1.1.6.1.
Climate change will have a direct impact on cities, including increasing health problems due
to heat, or flooding damage to buildings and infrastructure4. With a higher proportion of
elderly people, cities will also be more sensitive to heat waves and other climatic hazards.
Increased incidences of heavy rainfall can cause flooding along coastlines, within river
catchments and also from poor urban drainage. This has an indirect impact on homes,
business and critical infrastructure.
The urban heat island (UHI) effect is exacerbating the impacts of heat waves, which is
increasingly affecting also cities in central and north-western Europe. High soil sealing5 and
urban sprawl, in combination with more extreme precipitation events and sea level rise
increase the risk of urban flooding. Many cities have experienced significant urban sprawl,
noticeably expanding into areas such as floodplains, therefore increasing their exposure to
floods. Furthermore, low-density housing built on previously untouched land has increased
the risk of forest fires in many residential areas over the last decades, in particular around
cities in southern Europe.
A recent study indicates that under a business-as-usual greenhouse gasses emissions scenario,
potential damage from climate hazards to critical infrastructures in the energy, transport,
industrial and social sector could triple by the 2020s, multiply six-fold by mid-century, and
amount to more than 10 times today’s total of 3.4 billion € /year by the end of the century.
Damage from heatwaves, droughts in southern Europe, and coastal floods shows the most
dramatic rise, but the risks of inland flooding, windstorms, and forest fires will also increase
in Europe, with varying degrees of change across regions. Economic losses are highest for the
industry, transport, and energy sectors. Future losses will not be incurred equally across
Europe. Southern and south-eastern European countries will be most affected and, as a result,
will probably require higher costs of adaptation.6
Construction and buildings 1.1.6.2.
As highlighted in Section 6.3.6 in the 6NC, the impact of climate change is particularly
pertinent to the construction sector given the long life expectancy of buildings. The
vulnerability of buildings and constructions is mainly influenced by the design (e.g.
resistance to storms) and location (e.g. in flood-prone areas, landslides, avalanches).
Transport 1.1.6.3.
Climate-related impacts on transport are primarily the result of extreme events. Transport
systems in mountainous regions, coastal areas and regions prone to more intense rain and
snow are generally expected to be most vulnerable to future climate change. Available
4 EEA (2016) Urban adaptation to climate change in Europe 2016 — Transforming cities in a changing climate, European Environment Agency
5 The destruction or covering of soils by buildings, constructions and layers of completely or partly impermeable artificial material (asphalt, concrete, etc.).
6 Forzieri, G., A. Bianchi, F. Batista e Silva, M. Marin, A. Leblois, C. Lavalle, J. Aerts, L. Feyen, 2017. Escalating impacts of climate extremes on critical
infrastructures in Europe. Global Environmental Change (forthcoming).
109
projections suggest that rail transport will face particularly high risks from extreme weather
events, mostly as a result of the projected increase in heavy rain.
The preliminary results of the JRC PESETA III project show that by the end of the century
under a high emissions scenario, 196 airports and 852 seaports across the EU could face the
risk of inundation due to higher sea levels and extreme weather events. On the other hand,
transportation along the rivers Rhine and Danube could face less drought-related disruptions
relative to the current situation.
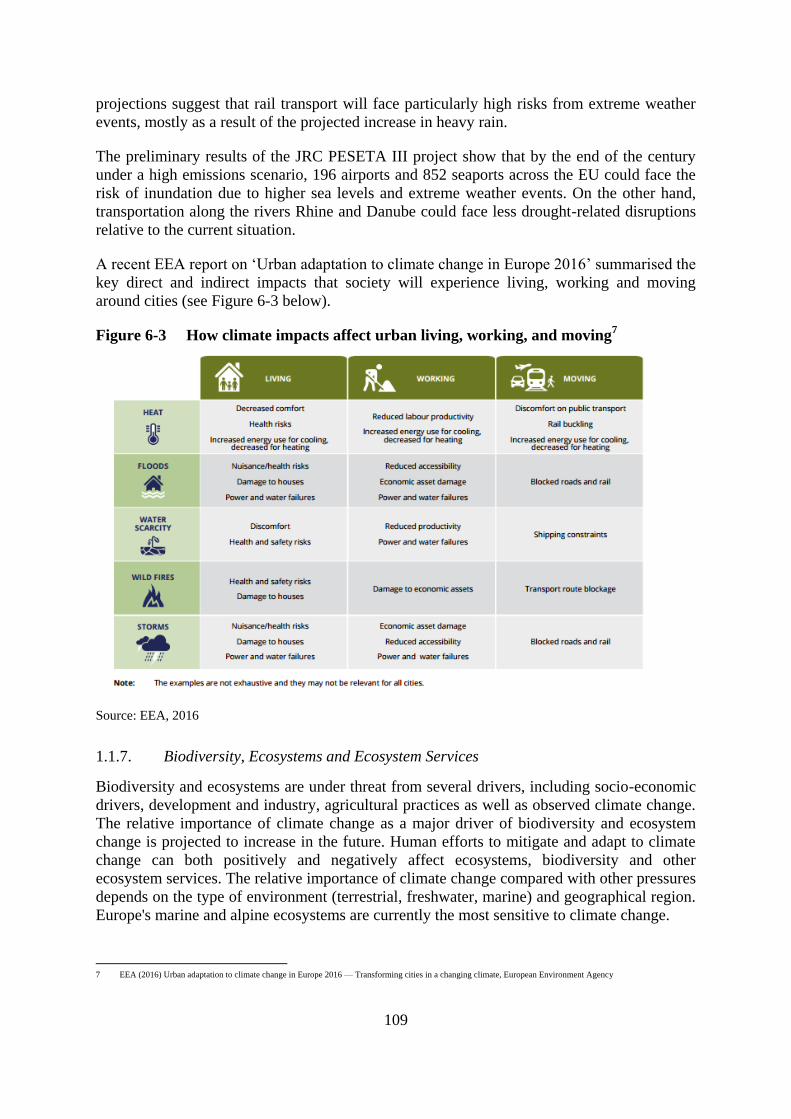
A recent EEA report on ‘Urban adaptation to climate change in Europe 2016’ summarised the
key direct and indirect impacts that society will experience living, working and moving
around cities (see Figure 6-3 below).
Figure 6-3 How climate impacts affect urban living, working, and moving7
Source: EEA, 2016
Biodiversity, Ecosystems and Ecosystem Services 1.1.7.
Biodiversity and ecosystems are under threat from several drivers, including socio-economic
drivers, development and industry, agricultural practices as well as observed climate change.
The relative importance of climate change as a major driver of biodiversity and ecosystem
change is projected to increase in the future. Human efforts to mitigate and adapt to climate
change can both positively and negatively affect ecosystems, biodiversity and other
ecosystem services. The relative importance of climate change compared with other pressures
depends on the type of environment (terrestrial, freshwater, marine) and geographical region.
Europe's marine and alpine ecosystems are currently the most sensitive to climate change.
7 EEA (2016) Urban adaptation to climate change in Europe 2016 — Transforming cities in a changing climate, European Environment Agency
110
Current observed climate change impacts on terrestrial ecosystems include changes in soil
conditions, phenological changes, and altitudinal and latitudinal migration of plant and
animal species (the general trend is northwards and upwards), as well as changes in species
interactions and composition within communities. In Europe, 14 % of habitats and 13 % of
species of interest have been assessed to already be under pressure because of climate
change. The number of habitats threatened by climate change is projected to more than
double in the near future. Many species in the Natura 2000 network are projected to lose
suitable climate niches. It is expected in the future, in particular in the Mediterranean region,
that changes in soil moisture will have a direct effect on terrestrial ecosystems. Climate
change is also anticipated to exacerbate the spread of invasive species, already being
experienced across Europe.
Climate change therefore significantly affects the capacity of ecosystems to provide services
for human well-being and may have already triggered shifts in ecological regimes from one
state to another. While the knowledge base on the combined effects of climate change and
other pressures on ecosystems and their capacity to provide services is still limited, it is
improving.
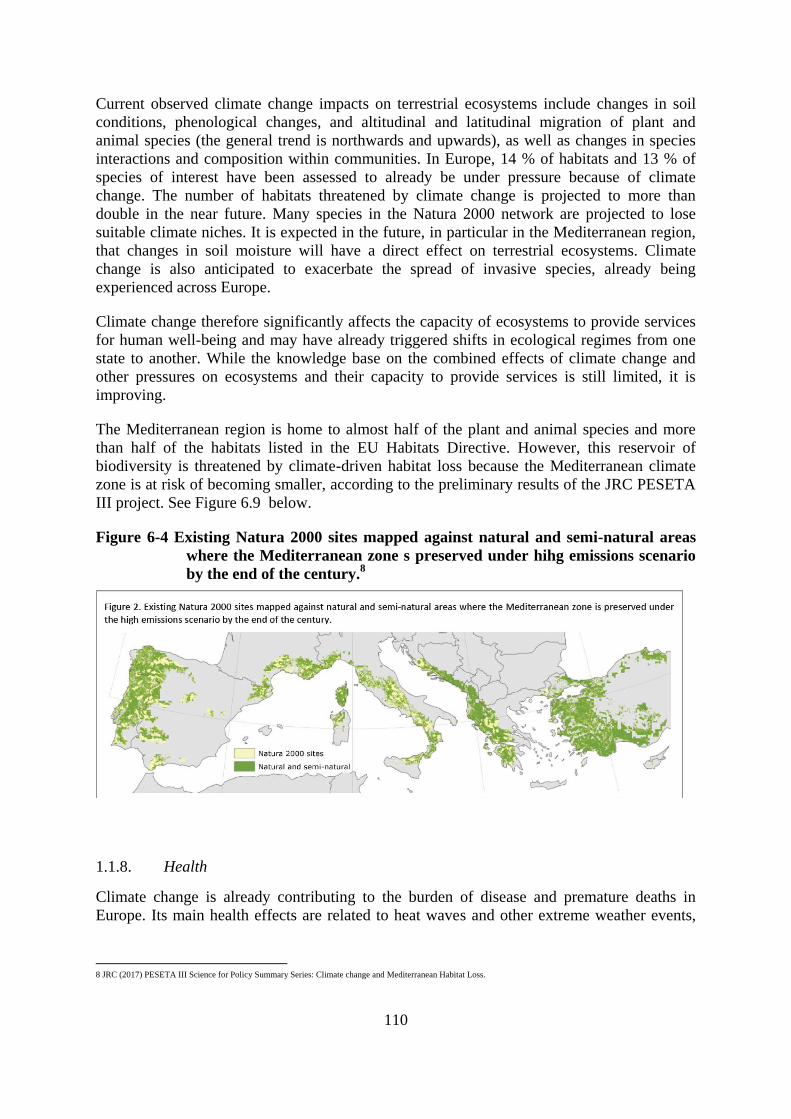
The Mediterranean region is home to almost half of the plant and animal species and more
than half of the habitats listed in the EU Habitats Directive. However, this reservoir of
biodiversity is threatened by climate-driven habitat loss because the Mediterranean climate
zone is at risk of becoming smaller, according to the preliminary results of the JRC PESETA
III project. See Figure 6.9 below.
Figure 6-4 Existing Natura 2000 sites mapped against natural and semi-natural areas
where the Mediterranean zone s preserved under hihg emissions scenario
by the end of the century.8
Health 1.1.8.
Climate change is already contributing to the burden of disease and premature deaths in
Europe. Its main health effects are related to heat waves and other extreme weather events,
8 JRC (2017) PESETA III Science for Policy Summary Series: Climate change and Mediterranean Habitat Loss.

111
changes in the distribution of climate-sensitive diseases and changes in environmental and
social conditions9.
A recent study found that weather-related disasters could affect about two-thirds of the
European population annually by the year 2100 (351 million people exposed per year during
the period 2071–100) compared with 5 % during the reference period (1981–2010; 25 million
people exposed per year). About 50 times the number of fatalities occurring annually during
the reference period (3 000 deaths) could occur by the year 2100 (152 000 deaths).10
Heat waves were the deadliest extreme weather event in the period 1991–2015 in Europe,
causing tens of thousands of premature deaths in Europe. The projected further increase in
the length, frequency and intensity of heat waves will lead to greater mortality, which will be
most pronounced among vulnerable population groups, unless adaptation measures are taken.
Future adaptation will very likely reduce these impacts. The reduction in cold-related deaths
is projected to be smaller than the increase in heat-related deaths in most regions. Mortality
effects are observed even for small differences from seasonal average temperatures. Because
small temperature differences occur much more frequently than large temperature
differences, not accounting for the effect of these small differences would lead to
underestimating the future impact of climate change
Climate change is expected to alter the geographic and seasonal distributions of existing
vectors and vector-borne diseases. Climate change is influencing the transmission cycles of
vector-borne diseases, but disease risks are also affected by factors such as land use, vector
control, human behaviour, population movements and public health capacities. It is widely
suspected that climate change has played (and will continue to play) a role in the expansion
of disease vectors such as the spread of the Asian tiger mosquito (Aedes albopictus), which
can disseminate several diseases including dengue, chikungunya and Zika, and Phlebotomus
species of sand flies which transmit leishmaniasis.
It is not possible to assess whether past climate change has already affected the overall
incidence of water- and food-borne diseases in Europe, but the sensitivity of pathogens to
climate factors suggest that climate change could be having effects on these diseases. The
unprecedented number of vibriosis infections in 2014 has been attributed to the record 2014
heat wave in the Baltic region. Increased sea surface temperatures enabled the right
environmental conditions for Vibrio species to bloom in the marine waters. Furthermore,
climate change has been found to have an impact on food safety hazards throughout the food
chain. Increases in water temperatures due to climate change will alter the seasonal windows
of growth and the geographic range of suitable habitat for toxin-producing harmful algae.
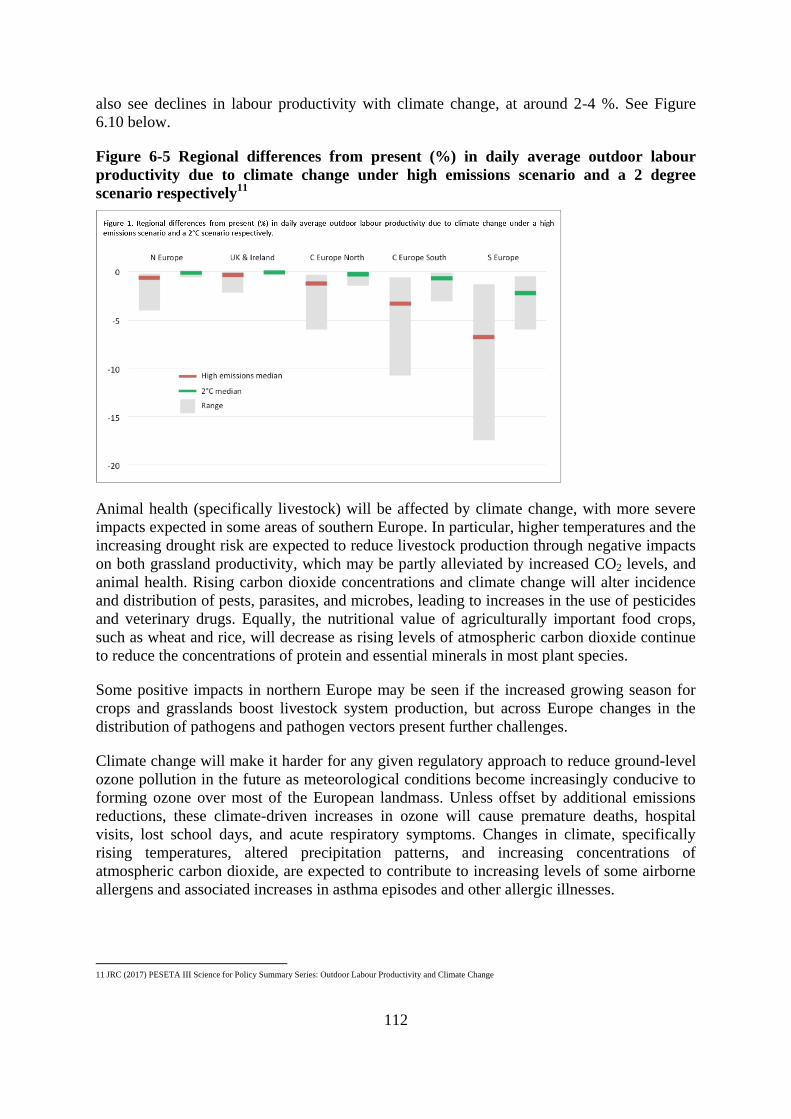
Labour productivity in outdoors sectors (like agriculture and construction sectors) can be
affected by increasing air temperature. According to the preliminary results of the JRC
PESETA III project, under a high emissions scenario and in the absence of adaptation, global
warming could result in declines by around 10-15 % from present-day levels in several
southern European countries by the end of the century. Countries in northern Europe could
9 Paci (2014) Human Health Impacts of Climate Change in Europe, Report for the PESETA II project JRC: url:
http://publications.jrc.ec.europa.eu/repository/bitstream/JRC86970/lfna26494enn.pdf
10 Forzieri, G., A. Cescatti, F. Batista e Silva, L. Feyen, 2017. Increasing risk over time of weather-related hazards to the European population: a data-driven prognostic
study. The Lancet Planetary Health 2017; 1: e200-08.
112
also see declines in labour productivity with climate change, at around 2-4 %. See Figure
6.10 below.
Figure 6-5 Regional differences from present (%) in daily average outdoor labour
productivity due to climate change under high emissions scenario and a 2 degree
scenario respectively11
Animal health (specifically livestock) will be affected by climate change, with more severe
impacts expected in some areas of southern Europe. In particular, higher temperatures and the
increasing drought risk are expected to reduce livestock production through negative impacts
on both grassland productivity, which may be partly alleviated by increased CO2 levels, and
animal health. Rising carbon dioxide concentrations and climate change will alter incidence
and distribution of pests, parasites, and microbes, leading to increases in the use of pesticides
and veterinary drugs. Equally, the nutritional value of agriculturally important food crops,
such as wheat and rice, will decrease as rising levels of atmospheric carbon dioxide continue
to reduce the concentrations of protein and essential minerals in most plant species.
Some positive impacts in northern Europe may be seen if the increased growing season for
crops and grasslands boost livestock system production, but across Europe changes in the
distribution of pathogens and pathogen vectors present further challenges.
Climate change will make it harder for any given regulatory approach to reduce ground-level
ozone pollution in the future as meteorological conditions become increasingly conducive to
forming ozone over most of the European landmass. Unless offset by additional emissions
reductions, these climate-driven increases in ozone will cause premature deaths, hospital
visits, lost school days, and acute respiratory symptoms. Changes in climate, specifically
rising temperatures, altered precipitation patterns, and increasing concentrations of
atmospheric carbon dioxide, are expected to contribute to increasing levels of some airborne
allergens and associated increases in asthma episodes and other allergic illnesses.
11 JRC (2017) PESETA III Science for Policy Summary Series: Outdoor Labour Productivity and Climate Change

113
Ticks capable of carrying the bacteria that cause Lyme disease and other pathogens will show
earlier seasonal activity and a generally northward expansion in response to increasing
temperatures associated with climate change.
Regarding plant health, invasive species are expected to expand across Europe due to
expected increases in temperature.
Economic activity and employment 1.1.9.
The climate change impacts on economic activity and employment are expected to be mixed,
with substantial disparities among regions in Europe. The complexity of the interlinkages
between the climate and the economy mean that there is little certainty in projections.
Rising temperatures and erratic weather patterns have the potential to reduce agricultural
productivity across many European regions. Extreme weather events can severely disrupt
economic activity. Sea-level rise will put physical capital assets at increasing risk. On the
other hand, climate change may also offer new business opportunities in the form of new
products and services to help people to adapt.
Historically, the total reported economic losses caused by weather and climate-related
extremes in the EEA member countries over the period 1980-2015 amount to around EUR
433 billion (in 2015 Euro values). The average annual economic losses have varied between
EUR 7.5 billion in the period 1980-1989, EUR 13.5 billion in the period 1990-1999, and
EUR 14.3 billion in the period 2000-2009. In the period from 2010 to 2015 the average
annual loss accounted to around EUR 13.3 billion12
. The observed variations in reported
economic loss over time are difficult to interpret since a large share of the total deflated
losses has been caused by a small number of events. Specifically, more than 70 % of the
economic losses was caused by only 3 % of all registered events13
. The losses by climate-
event are presented in Figure 6-6 below.
12 http://www.eea.europa.eu/data-and-maps/indicators/direct-losses-from-weather-disasters-3/assessment
13 http://www.eea.europa.eu/data-and-maps/indicators/direct-losses-from-weather-disasters-3/assessment

114
Figure 6-6 Losses from Natural Hazards in EEA member countries (EUR 519 628
million)14
Estimates of the projected economic impacts of climate change in Europe are emerging15
, but
the coverage of these estimates remains only partial with a considerable degree of
uncertainty. Recent studies indicate that the economic costs of climate change will potentially
be high, even for modest levels of climate change; these costs rise significantly for scenarios
of greater levels of warming. For example, a JRC study (JRC PESETA II) estimates that the
annual total damages from climate change in the EU would amount to around EUR 190
billion (with a net welfare loss estimated to be equivalent to 1.8 % of current GDP) under a
reference scenario (SRES A1B) by the end of the 21st century.
These impacts would be reduced to EUR 120 billion (equivalent to 1.2 % of current GDP) in
a 2 °C warmer world. The projected damage costs from climate change are distributed very
heterogeneously across Europe, with notably higher impacts in southern Europe.
The CIRCE project estimated the economic costs of impacts in the Mediterranean region.
Estimates suggest that there will be negative economic consequences for major sectors, such
as tourism and energy. Furthermore, all Mediterranean countries could lose, on average, 1.2
% of GDP in 2050. The largest economic costs relate to sea level rise and tourism.
A recent modelling study showed that approximately 410 000 jobs would be lost by 2050 due
to climate change if no further adaptation takes place.16
The most negatively affected sectors
are likely to be manufacturing and public utilities, which includes manufacturing, electricity,
gas and water supply. Jobs are also likely to be lost in the retail and leisure sector.
In sectors such as agriculture, the impacts on employment are potentially small, but there are
likely to be distributional impacts with positive effects in some countries and negative in
others. Countries such as Bulgaria, Croatia, Estonia, Latvia, and Lithuania, Greece, and
14 http://www.eea.europa.eu/data-and-maps/indicators/direct-losses-from-weather-disasters-3/assessment
15 ECONADAPT: 'The Economics of Climate Change Adaptation'; CIRCLE 2
16 Triple E (Trinomics), TNO and Ricardo AEA (2014) Assessing the implications of climate change adaptation on employment in the EU. Final report to the European
Commission under contract CLIMA.C.3/ETU/2013/0013.
115
Romania which have high climate change damage costs and a relatively high share of people
employed per unit of output, are more likely to experience the negative effects of climate
change on their agriculture and tourism sectors.17
However, the study also shows that
increased levels of adaptation expenditure could have a positive impact on job creation.
Social issues 1.1.10.
As discussed in Section 6.3.11 in the 6NC, climate change impacts are expected to affect
people’s daily lives in terms of employment, housing, health, water and energy access as well
as the furthering of gender equality and human rights efforts. Populations in some European
areas are at a higher risk from climate change than others, depending on their exposure to
climatic hazards and their vulnerability.
Results from scenarios for adaptive capacity in the CLIMSAVE18
project show that overall
coping capacity is assumed to either improve or deteriorate substantially towards the 2020s
and even further towards the 2050s, depending on the scenario. The currently prevailing
spatial distribution across Europe of a higher capacity in central and north-western Europe
and a lower capacity in southern and in particular in (some of) Eastern Europe is projected to
prevail across all scenarios. The research caveats that such trends and patterns do not provide
information on particular threats and specific local contexts, and should therefore be used in
conjunction with hazard-, sector- and location-specific information.
EU-level actions for adaptation to climate change 1.2.
In recognition of the shared challenges and cross-border nature of climate change, the
European Union has led the development of an EU-wide framework for adaptation. The
European Commission started in 2007 by adopting a Green Paper “Adapting to climate
change in Europe – options for EU action”19
. It was followed by the White Paper “Adapting
to climate change: Towards a European framework for action” 20
in 2009. These documents
led to the adoption of the ‘EU strategy on adaptation to climate change’21
on 16 April 2013.
The strategy predates but does not conflict with some key objectives and commitments made
by the EU at the international level, including most recently the UNFCCC Paris Agreement
(Article 7), the Sustainable Development Goals and the Sendai Framework on Disaster Risk
Reduction22
and also the Aichi biodiversity (CBD) targets. It is also in line with the ten
priorities of the Juncker Commission.
17 Triple E (Trinomics), TNO and Ricardo AEA (2014) Assessing the implications of climate change adaptation on employment in the EU. Final report to the European
Commission under contract CLIMA.C.3/ETU/2013/0013.
18 EEA (2017) Climate impacts, vulnerability and adaptation in Europe 2016. European Environment Agency http://www.eea.europa.eu//publications/climate-change-
impacts-and-vulnerability-2016 For more information on CLIMSAVE see: http://www.climsave.eu/climsave/index.html
19 Green Paper from the Commission to the Council, the European Parliament, the European Economic and Social Committee and the Committee of the Regions -
Adapting to climate change in Europe – options for EU action http://eur-lex.europa.eu/legal-content/EN/ALL/?uri=CELEX:52007DC0354
20 COM(2009) 147 final WHITE PAPER Adapting to climate change: Towards a European framework for action http://eur-
lex.europa.eu/LexUriServ/LexUriServ.do?uri=COM:2009:0147:FIN:EN:PDF
21 http://climate-adapt.eea.europa.eu/eu-adaptation-policy/strategy
22 The Sendai Framework for Disaster Risk Reduction 2015-2030 (Sendai Framework) is the first major agreement of the post-2015 development agenda, with seven
targets and four priorities for action. It was endorsed by the UN General Assembly following the 2015 Third UN World Conference on Disaster Risk Reduction
(WCDRR). http://www.unisdr.org/we/coordinate/sendai-framework

116
The following sub-section describes the Strategy in more detail. Progress and outcomes are
reported under Section 6.6.
The EU Strategy on Adaptation to Climate Change 1.2.1.
The ‘EU strategy on adaptation to climate change’ was adopted by the European
Commission on 16 April 2013. The overall aim is to contribute to a more climate-resilient
Europe. This means enhancing the preparedness and capacity to respond to the impacts of
climate change at local, regional, national and EU levels, developing a coherent approach and
improving coordination. It sets out eight actions to meet the Strategy’s three specific
objectives:
Objective 1 Promoting action by Member States
Action 1: Encourage all Member States to adopt comprehensive adaptation strategies
Action 2: Provide LIFE funding to support capacity building and step up adaptation
action in Europe (2013-2020)
Action 3: Introduce adaptation in the Covenant of Mayors framework (2013/2014)
Objective 2 Better informed decision-making
Action 4: Bridge the knowledge gap
Action 5: Further develop Climate-ADAPT as the ‘one-stop shop’ for adaptation
information in Europe
Objective 3 Climate-proofing EU action: promoting adaptation in key vulnerable
sectors
Action 6: Facilitate the climate-proofing of the Common Agricultural Policy (CAP), the
Cohesion Policy and the Common Fisheries Policy (CFP)
Action 7: Ensuring more resilient infrastructure
Action 8: Promote insurance and other financial products for resilient investment and
business decisions
117
Monitoring and evaluation framework 1.3.
While there is no specific monitoring and evaluation framework for the EU Strategy on
climate change adaptation, a number of the Actions within it are evaluated in their own right.
Furthermore the Commission is evaluating progress in a cross-sectional dimension across a
number of policies (including the Common Agriculture Policy and the Cohesion Policy). This
includes the ‘Adaptation Scoreboard’ in relation to Action 1 was proposed in 2013 and is
currently being updated in discussion with Member States (See more in Section 6.6 below);
the LIFE Programme that has its own M&E framework (including a monitoring team,
NEEMO); and the Covenant of Mayors for Climate and Energy, which is in the process of
adopting an integrated online monitoring and reporting framework to be used by all
signatures to the Covenant.
Progress and outcomes of adaptation action 1.4.
Since the publication of the 6th
NC in 2014, the EU and its Member States have significantly
increased the number of actions for coping with the impacts of climate change at
international, national and local levels as well as across sectors. These are presented in detail
below, by each Action of the EU Strategy. The ongoing evaluation of the Strategy is expected
to be published in early 2018.
Objective 1 Promoting action by Member States
Action 1: Encourage all Member States to adopt comprehensive adaptation strategies
To achieve coordination and coherence at the various levels of planning and management, the
Commission in 2013 developed guidelines23
on formulating adaptation strategies and on
developing, implementing and reviewing national adaptation policies. In 2014, the
Commission developed an ‘adaptation preparedness scoreboard’, identifying key indicators
for measuring Member States' level of readiness24
. As part of the ongoing evaluation study,
this scoreboard is being updated to align with MS reporting needs and offer a more
streamlined approach to monitoring national level progress on adaptation planning and
action. To date, 23 Member States have adopted national adaptation strategies as opposed to
15 in 2013. As part of an evaluation process to be completed in 2018, the Commission is
assessing the general progress on adaptation action in the Member States.
By April 2017, 23 EU Member States had adopted a National Adaptation Strategy (NAS).
Most of the existing strategies include very little information on implementation (e.g.
monitoring, financing of adaptation action) and therefore, some countries have gone on to set
out concrete action plans (NAP). These strategies and action plans are undoubtedly a good
starting point for adaptation action but the 2013 EU strategy recommends that all 28 EU
Member States should have their own adaptation policies adopted. Figure 6-7 shows an
overview of the status of National Adaptation Strategies in EEA member countries.
23 Included practical examples, checklists, and detailed information on the range of support available at European level. See: European Commission (2014) SWD 134
Guidelines on developing adaptation strategies, European Commission, Brussels.
24 http://climate-adapt.eea.europa.eu/eu-adaptation-policy/strategy/index_html/resolveuid/bbc416202fd844b1a09f90a2990553ae

118
Figure 6-7 below provides an overview of adaptation activities in all EU Member States.
Figure 6-7 Overview of National Adaptation Strategies in the EU
Action 2: Provide LIFE funding to support capacity building and step up adaptation
action in Europe (2013-2020)
The EU will provide financial support for adaptation through the proposed EU financial
instrument for the Environment (LIFE) with a dedicated sub-programme on Climate Action.
Its general objective is to contribute to the implementation, updating and development of EU
environmental policy and legislation by co-financing pilot or demonstration projects with
European added value. The total LIFE Climate Action envelope for 2014-2017 is EUR 449.6
million that is split between mitigation and adaptation, with adaptation allocated a total of
EUR 190.1 million. Demonstration, best-practice or governance and information projects are
awarded through annual calls. Since 2014, three calls for proposals have been launched
(2014, 2015 and 2016) and a fourth call (2017) is currently ongoing. LIFE also supports
“integrated projects” which implement climate change adaptation strategies at regional or MS

119
level25
. A new innovative financial instrument, the Natural Capital Financing Facility was
introduced to the LIFE programme in 2015 (MAWP 2014 – 2017) and is implemented by the
European Investment Bank. The NCFF contributes to meeting the objectives set out by LIFE,
in particular “nature and biodiversity” and “climate change adaptation” by providing
financial solutions to bankable projects promoting the conservation, restoration, management
and enhancement of natural capital for biodiversity and climate adaptation benefits26
. The
first operations are expected to be signed in 2017.
Action 3: Introduce adaptation in the Covenant of Mayors framework (2013/2014)
Building on the success of the Covenant of Mayors, created in 2008 to implement the EU
2020 climate and energy targets, the Mayors Adapt initiative invited cities to voluntarily
commit to anticipating and preparing for the inevitable impacts of climate change. Signatory
cities undertook to contribute to the EU’s Adaptation Strategy by developing comprehensive
local adaptation strategies or integrating these into relevant existing plans.
The Covenant of Mayors for Climate & Energy was launched in 2015 with the aim to inform,
mobilise and support cities. It integrates the Mayors Adapt initiative that was launched in
2014. More than 800 cities have committed to the new integrated targets since the integrated
Covenant was established. Together with the former Mayors Adapt signatories, this brings
almost 900 cities committed to adaptation planning and action. It is expected that by the end
of 2017 around 100 European cities will have submitted a climate risk and vulnerability
assessment as well as indicative adaptation actions. There is a strong potential for thousands
of cities to join. Signatories now pledge to:
Reduce CO2/GHG emissions by at least 40 % by 2030;
Adapt to the impacts of climate change;
Translate their political commitment into local results by developing local action
plans and reporting on their implementation.
Objective 2 Better informed decision-making
Action 4: Bridge the knowledge gap
The Strategy, recognizing that substantial knowledge gaps need to be filled, identifies the
need for the European Commission to work with Member States and stakeholders in refining
these knowledge gaps and identifying the relevant tools and methodologies to address them.
These findings are then fed into the EU’ Framework Programme for Research and Innovation
2014-2020 – Horizon 2020, where they will be addressed through specific programmes and
by mainstreaming climate action across the full programme.
Research is key for effective adaptation, as practical adaptation actions and measures must be
based on sound, scientific, technical and socio-economic information. This has been
recognised by the European Commission and the level of spending on impacts and
vulnerability assessment and adaptation has increased significantly since the 6th
NC.
25 The first two Integrated Projects for the sub-programme on Climate Action came through the 2015 call and includes the Danish Coast2Coast Climate Challenge project
(LIFE15 IPC/DK/000006).
26 See: http://www.eib.org/products/blending/ncff/index.htm

120
The key mechanism that the EU uses to support research in Europe is Horizon 2020, which is
funding EUR 80 billion over 7 years from 2014 to 2020. Horizon 2020 aims to support smart,
sustainable and inclusive economic growth27
. Climate action is one of the cross-cutting issues
mainstreamed in Horizon 2020. It is estimated that overall climate-related expenditure should
exceed 35 % of the total Horizon 2020 budget. The programme aims to further improve
understanding of the causes and impacts of climate change and better coordinate efforts to
address them28
. It also aims to pool resources to develop better tools, methods and standards
to help assess the impact of climate change and adaptation responses.
The research projects on impacts, vulnerability and adaptation that have been funded through
Horizon 2020 and the preceding research funds (the European Commission 6th
and the 7th
Framework Programmes) are summarised in Chapter 7.
The Joint Research Centre (JRC) is the scientific and technical arm of the European
Commission. It provides scientific advice and technical expertise to support a wide range of
EU policies such as climate change adaptation. JRC has presented an overview on research
carried out in order to support the EU climate change policy, taking into account support for
mitigation and adaptation130
. These include:
Studies on the economic impacts of climate change in the EU (JRC PESETA I and
PESETA II and PESETA III). The main purpose of the PESETA I study was to make
a consistent physical and economic assessment of the impacts of climate change in
Europe at the end of the 21st
century for various sectors. PESETA II, released in 2014,
responds to a need to provide quantitative modelling support to the European
Commission services regarding the impacts of climate change in Europe29
. JRC
PESETA III is expected to be completed later in 2017;
Support to Climate-ADAPT by providing data and content from in‐house sources
such as the European Forest Data Centre, European Database of Vulnerabilities, etc.;
Report on Environment and human health with one chapter on climate change (joint
JRC-EEA report)132
.
The European Environment Agency (EEA) has also had a significant role in advancing the
knowledge base on climate change impacts, vulnerability and adaptation in recent years. The
EEA produces integrated environmental data and indicator sets, assessments and thematic
analyses in order to provide a sound decision basis for environmental and climate change
policies in the EU and Member States and for cooperation with candidate and potential
candidate countries. Further information on the JRC and EEAs role in research is given in
Section 8.2.1.5.
Action 5: Further develop Climate-ADAPT as the ‘one-stop shop’ for adaptation
information in Europe
27 https://ec.europa.eu/programmes/horizon2020/en/what-horizon-2020
28 https://ec.europa.eu/programmes/horizon2020/en/h2020-section/fighting-and-adapting-climate-change-1
29 Ciscar JC, Feyen L, Soria A, Lavalle C, Raes F, et al. (2014). Climate Impacts in Europe. The JRC PESETA II Project. JRC Scientific and Policy Reports, EUR
26586EN.http://publications.jrc.ec.europa.eu/repository/bitstream/JRC87011/reqno_jrc87011_final%20report%20ready_final3.pdf

121
Climate-ADAPT is a European Commission initiative that aims to facilitate access to sound
adaptation information in Europe. It is managed by the EEA, and covers EEA member
countries (EU MS plus Iceland, Lichtenstein, Norway, Turkey and Switzerland). It is a
repository of information submitted by different providers covering sector and national
policies, case studies of implemented adaptation actions, projects, knowledge tools, networks
and a database. It also provides information on adaptation strategies at different governance
levels in Europe, and access to specifically designed tools to support adaptation planning and
implementation. It is one of the most visited EEA thematic sites. Over the past years EEA has
updated the platform’s content with information from countries (as submitted under the
MMR, article 15); EU research and other EU funded projects and many other sources. A bi-
monthly newsletter on climate change adaptation in Europe has been in place since early
2015 with increasing numbers of subscribers. Regular webinars have been held with
providers and users, as well as expert meetings with managers of national and other
knowledge platforms to enhance complementarity with Climate-ADAPT. An evaluation is
currently being undertaken to assess the actions related to Climate-ADAPT in sharing
knowledge on climate change impacts, vulnerability and adaptation at the European level.
Objective 3 Climate-proofing EU action: promoting adaptation in key vulnerable
sectors
Action 6: Facilitate the climate-proofing of the Common Agricultural Policy (CAP), the
Cohesion Policy and the Common Fisheries Policy (CFP)
The European Commission remains strongly committed to mainstreaming adaptation into key
EU funds, policies and programmes. The Commission intends to ensure improved access to
funding as a critical factor in building a climate-resilient Europe and supporting Member
States’ adaptation activities. The European Structural and Investment Funds (ESIF) is the
EU’s main investment policy tool (with about 43 % of the EU budget). The ESIF is a family
of five EU funds and has a budget of EUR 454 billion for the period 2014-2020. Through
investments in climate action, about 25 % of the funds contribute to EU climate policy
objectives simultaneously. These funds help deliver the EU Regional and Cohesion Policy,
the EU Common Agricultural Policy, the EU Integrated Maritime Policy and the EU
Common Fisheries Policy, as well as Social and Employment Policy.
Action 7: Ensuring more resilient infrastructure
Infrastructure projects, which are characterised by a long life span and high costs, need to
withstand the current and future impacts of climate change. The European Commission is
continuing to explore all the potential ways at its hand to enhance the adaptation capacity of
European infrastructures, from mainstreaming to standardisation, to ecosystem-based
approaches or providing further guidance to project developers. The European Financing
Institutions Working Group on Adaptation to Climate Change (EUFIWACC) developed
guidelines for project development and the execution of Mandate M/526 to revise
infrastructure standards for energy, transport, buildings and constructions is now at “full
speed”.
Action 8: Promote insurance and other financial products for resilient investment and
business decisions

122
The European Commission's aim is to improve the market penetration of natural disaster
insurance and to unleash the full potential of insurance pricing and other financial products
for risk awareness prevention and mitigation and for long-term resilience in investment and
business decisions. Floods have resulted in 4 700 fatalities and caused direct economic losses
of more than EUR 150 billion (based on 2013 values), which is almost one-third of the
damage caused by all natural hazards. Less than a quarter of these damages were insured.
To address this gap, ongoing work is being undertaken on:
Taking stock of insurance mechanisms covering weather and climate related disaster
risks, applied in (and beyond) the EU;
Determining cost effectiveness of insurance mechanisms;
Analysis of which mechanisms incentivise prevention of risk and support damage
reduction;
Definition of next steps in insuring weather and climate related extreme events.

123
2. FINANCIAL, TECHNOLOGICAL AND CAPACITY-BUILDING SUPPORT
Key developments
The EU’s provision of bilateral financial support has increased during the reporting
period, from USD 1 281 million (€ 964 million) in 2013 to USD 3 020 million (€ 2
730 million) in 201630
.
Total financial support provided by the EU in the years 2015 and 2016 amounted to
USD 4 702 million (€ 4 247 million).
Financial support for climate change adaptation has increased during the reporting
period, from USD 878 million (€ 661 million) in 2013 to USD 1 316 million (€ 1 190
million) in 2016.
Financial support for Least Developed Countries (LDCs) increased during the
reporting period, from USD 382 million (€ 288 million) in 2013, to USD 1 062
million (€ 960 million) in 2016.
The EU has increased targeted support to the poorest and most vulnerable countries,
through a variety of policies and measures, but specifically through the European
Development Fund (EDF), Development Cooperation Instrument (DCI), and a new
phase of the EU Global Climate Change Alliance Plus (GCCA+) Initiative, with
respective commitments of USD 33 739 million (€ 30 500 million), USD 21 681
million (€ 19 600 million) and USD 479 million (€ 432 million) during 2014-2020.
Introduction 2.1.
This chapter includes information on financial, technological and capacity-building support
provided by the EU to developing country Parties to the UNFCCC Convention31
, during the
years 2015 and 2016. EU support reported here comprises funds committed by EU
institutions and the European Investment Bank (EIB). It does not include contributions by
individual Member States, which can be found in each Member State’s respective National
Communication and Biennial Report. In some cases, the qualitative information reported may
refer to Member State activities, but where this occurs this will be clearly stated.
The methodology used to track financial support is outlined in [3BR] Section 6.2.3. This
includes details on how support has been categorised as ‘new and additional’, and how the
purpose of the support has been defined as either mitigation, adaptation or cross-cutting.
Where the reporting guidelines require similar information to be provided in both the
National Communication and the Biennial Report, such information has been provided in the
Biennial Report only. In these cases, the reader will be referred to the respective chapter in
the Biennial Report.
30 EUR have been converted to USD for all figures using the OECD-DAC annual average exchange rates: https://data.oecd.org/conversion/exchange-rates.htm
31 This includes non-Annex I countries as well as Annex-I countries with economies in transition (the Russian Federation, the Baltic States, and several Central and Eastern
European States). Specifically, Annex-I countries with economies in transition included in the National Communication and Biennial Report are Belarus, Turkey, and
Ukraine.

124
Provision of ‘new and additional’ resources 2.2.
Information on the EU’s approach to the provision of climate finance, including the provision
of new and additional resources, can be found in [3BR] Section 6.2.
Assistance to developing country Parties that are particularly vulnerable to 2.3.
climate change
Information on EU assistance to developing country Parties that are particularly vulnerable to
climate change can be found in [3BR] Section 6.2.
Provision of financial resources through multilateral channels 2.4.
Information on EU provision of financial resources through multilateral channels can be
found in [3BR] Section 6.3.
Provision of financial resources through bilateral channels 2.5.
Information on EU provision of financial resources through bilateral channels can be found in
[3BR] Section 6.3.
Activities related to the transfer of technology and capacity building 2.6.
Information on EU activities related to the transfer of technology and capacity building can
be found in [3BR] Sections 6.4 and 6.5.

125
3. RESEARCH AND SYSTEMATIC OBSERVATIONS
Key Developments
The EU contributes to research and systematic observation (RSO) through the involvement of
multiple actors, by means of a suite of instruments, tools and programmes, and across
multiple sectoral policies.
Key vehicles include Horizon 2020, the EU’s 2014-2020 framework programme for research
and innovation, which is investing heavily in climate action, with approximately 35 % of its
budget expected to be used for climate-relevant research and innovation.
Other action includes: LIFE (the EU’s 2014-2020 funding instrument for the environment
and climate); and the 2014-2020 programme for the competitiveness of enterprises and
SMEs. In addition international cooperation is enhanced through various platforms and
instruments; and contributions are made to and/or financial support provided for major
international institutions, research initiatives and programmes, such as the UNFCCC, the
Intergovernmental Panel on Climate Change (IPCC) and the global climate observing system
(GCOS), and Mission Innovation – launched in the margins of COP 21 to accelerate global
clean energy innovation through the doubling of clean energy R&I public investments in the
next 5 years.
To facilitate the implementation of the strategy on accelerating clean energy research and
innovation, over EUR 2 billion in Horizon 2020's work programme (2018-2020) have been
allocated to programmable actions addressing four interconnected research and innovation
priorities (decarbonising the EU's building stock by 2050, strengthening EU leadership in
renewables, developing affordable and integrated energy storage solutions, and electro-
mobility and a more integrated urban transport system). In addition, further research
investments from Member States towards low-carbon energy are planned through the
Strategic Energy Technologies (SET) Plan. It promotes research and innovation efforts across
Europe by supporting the most impactful technologies in the EU's transformation to a low-
carbon energy system. It promotes cooperation amongst EU countries, companies, research
institutions, and the EU itself.
8.1. Introduction
Research on climate change processes and impacts on natural resources and humankind helps
us to identify and assess key drivers and improves our understanding of their interactions.
The EU contributes to Research and Systematic Observation (RSO) through the involvement
of multiple actors (see Section 8.2.1.5) and through a suite of instruments, tools and
programmes and across multiple sectorial policies (see Section 8.2.1.6).
EU-funded research aims to better understand the climate evolution (past, present, future),
identify and quantify its impact on ecosystems and humans (from local to global scales) and
facilitate the design and development of highly effective, cost-efficient response strategies
and technologies.
The EU Framework Programme for Innovation, Horizon 2020, is the biggest EU Research
and Innovation Programme to date with nearly 80 billion euros of funding available between
2014 and 2020 – in addition to the private investment that this money will attract.

126
Research is a shared competence with the Member States. A strong partnership is being
ensured by building on the work of the Strategic Forum for International Science and
Technology Cooperation (SFIC). SFIC is a strategic forum and an advisory body to the
Council and the Commission with a view to implementing a European Partnership in the field
of international scientific and technological cooperation (S&T cooperation). SFIC is
composed of the European Commission, all EU MS and several non-EU countries as
observers.
As an advisory body, SFIC plays an active role in the implementation of the S&T cooperation
agreements with third countries and high level policy dialogues with international partner
countries and regions. Country-specific Working Groups have contributed to creating a more
coherent strategy for research and innovation (R&I) cooperation with specific partner
countries and regions.
In the EU, certain research and innovation policy measures are designed and implemented at
national level by EU MS and others are done at EU level. The EU level work forms the scope
of this chapter.
The chapter begins by describing in general terms the policy and funding of RSO, the EU’s
participation in GCOS’s activities and finally points to some of most emblematic RSO
projects.
8.2. General policy on and funding of research and systematic observations
8.2.1. General policy on RSO
Different countries are developing different scientific and research strengths. By combining
research teams from all over the world, access to new data and scientific results and
innovative solutions can be enhanced. For Europe, cooperation means accessing new sources
of knowledge, attracting fresh scientific talent and investment, agreeing on common
procedures for conducting research and developing common standards.
8.2.1.1.European research and support for climate action
Environmental research and innovation for climate action is centred around in Horizon 2020's
Societal Challenge on "Climate action, environment, resource efficiency and raw
materials"32
. This has the objective of achieving a resource efficient and climate change
resilient economy and society, protecting and sustainably managing natural resources and
ecosystems and ensuring a sustainable supply and use of raw materials, to meet the needs of a
growing global population within the sustainable limits of the planet's natural resources and
eco-systems.
Helping to build a green economy in synchronisation with the natural environment, is part of
the answer. Therefore Horizon 2020 activities focus on moving towards a "green" society and
economy and they seek to address knowledge gaps to understand changes in the environment,
32 European Commission, The EU Framework Programme for Research and Innovation, Climate Action, Environment, Resource Efficiency and Raw Materials, 2017,
(Webpage accessed on 13-06-2017) http://ec.europa.eu/programmes/horizon2020/en/h2020-section/climate-action-environment-resource-efficiency-and-raw-
materials
Other societal challenges such as on “Secure, Clean and Efficient Energy” and on “Smart, Green and Integrated Transport” are also relevant to climate action.

127
identify the policies, methods and tools that would most effectively tackle the challenges, and
support innovators and businesses to bring green solutions to the market.
Through its last work programme covering the period 2018-2020, Horizon 2020 will continue
supporting research and innovation relevant for the objectives of the Paris Agreement.
Dedicated projects and activities funded under the programme will produce data and
scientific knowledge for climate action, design realistic pathways for achieving the global
and European mitigation and adaptation goals and develop ground-breaking technological
and non-technological solutions, including for the energy, transport and industrial systems.
Actions will support a broad range of EU policies and objectives, such as the EU’s energy
and climate policies, Arctic policy, Adaptation Strategy and climate diplomacy efforts. They
will also boost cooperation with strategic partner countries and key regions of the world.
8.2.1.2.Relation to work of IPCC and UNFCCC and other international initiatives
Throughout its implementation period Horizon 2020 contains specific actions designed to
provide input to the IPCC33
and to deliver commitments made under the Belmont Forum and
the Group on Earth Observation (GEO).
EU research projects also have been and are producing significant results for several
international activities under different frameworks, such as the United Nations Framework
Convention on Climate Change, the 2030 Agenda for Sustainable Development, the Sendai
Framework for Disaster Risk Reduction, the Habitat III Conference on Sustainable Urban
Development, and a number of environmental agreements. For instance, more than one
thousand publications from FP7 projects34
contributed to the fifth Assessment Report of the
IPCC that provided scientific grounds for global, European and national climate action.
Similarly, systems and services such as the Knowledge Centre for Disaster Risk Management
and the Copernicus services implemented by the EC underpin the realisation of several these
commitments.
8.2.1.3.Changes Post-Paris35
Around 35 % of the funding for the Horizon 2020 programme is expected to be invested in
climate related-projects. However, by November 2016, budget implementation seemed to be
somewhat lagging behind this target. The Paris Agreement provides a strong incentive to
address the gap in the upcoming Horizon 2020 work programmes that will cover the 2018-
2020 period.
33 EUR-Lex Access to European Union Law, COM2016(0657) (Webpage accessed on 13-06-2017): http://eur-lex.europa.eu/legal-
content/EN/ALL/?uri=COM:2016:0657:FIN
34 Projects funded under the 7th EU Research and Innovation Framework Programme that ran between 2007 and 2013, or briefly FP7.
35 European Commission DG Climate Action, Implementing the Paris Agreement. Progress of the EU towards the at least -40% target, 2016,
https://ec.europa.eu/clima/sites/clima/files/eu_progress_report_2016_en.pdf

128
8.2.1.4.Space Policy36,37
Article 189 of the Treaty on the Functioning of the European Union (TFEU) confers on the
Union a shared space competence which it pursues alongside that of the Member States. The
Union thus has a specific mandate to draw up a European space policy, and, "to this end, it
may promote joint initiatives, support research and technological development and coordinate
the efforts needed for the exploration and exploitation of space". To this end, "...Parliament
and the Council shall establish the necessary measures, which may take the form of a
European space programme".
Europe — the Member States, the European Space Agency (ESA), the European
Organisation for the Exploitation of Meteorological Satellites (EUMETSAT) and the EU —
has achieved many successes in space with breakthrough technologies and exploration
missions, such as ESA's Rosetta mission and unique Copernicus’ Earth observation and
Meteosat’s meteorology oriented capabilities. Europe represents today the second largest
public space budget in the world with programmes and facilities spanning different European
countries. The EU alone will invest over EUR 12 billion in space activities between 2014 and
2020. It owns world class space systems including those associated with the Copernicus
programme for Earth observation. The EU currently has 18 satellites in orbit and over 30
planned in the next 10 to15 years.
Space technologies, data and services can support numerous EU policies and key political
priorities, including economic competitiveness, migration, climate change, the Digital Single
Market and sustainable management of natural resources.
In 2016, the European Commission proposed a new Space strategy for Europe, focused on
four strategic goals: maximising the benefits of space for society and the EU economy;
fostering a globally competitive and innovative European space sector; reinforcing Europe’s
autonomy in accessing and using space in a secure and safe environment; and strengthening
Europe’s role as a global actor and promoting international cooperation. Three of these goals
relate to observation programmes:
Maximising the benefits - Copernicus is one of the leading providers of Earth
observation data. The full exploitation of data, products and information delivered by
Copernicus remained a challenging task due to some technical barriers. Therefore, the
Commission facilitates access to and exploitation of space data enabling their cross-
fertilisation with other sources of data;
Competitive and innovative European space sector - as part of the New Skills Agenda
for Europe, the Commission will launch a dedicated sector skills alliance for
space/Earth observation gathering key stakeholders from industry, research,
universities and public authorities to tackle new skills requirements in the sector;
Promoting international cooperation - the Commission has been using EU space
programmes to contribute to and benefit from international efforts through initiatives
36 European Commission, Towards a space strategy for the European Union that benefits its citizens, COM(2011) 152, http://eur-lex.europa.eu/legal-
content/en/ALL/?uri=CELEX:52011DC0152 (Webpage accessed on 19-06-2017).
37 European Commission, Space strategy for Europe, COM(2016) 705, http://www.ipex.eu/IPEXL-WEB/dossier/document/COM20160705.do (Webpage accessed on 19-
06-2017).
129
such as the Global Earth Observation System of Systems (GEOSS) and the
Committee on Earth Observation Satellites (CEOS) through links with Copernicus.
8.2.1.5.Main RSO actors
As already clarified above, in the EU there are two sets of RSO actions that can be
distinguished: those that are implemented by Member States and others that are coordinated
at the EU level. The latter make up the scope of this chapter and a complex set of institutions
contributes to these activities.
A more detailed description of the roles and responsibilities of the main RSO actors at the EU
level was provided in the EU’s 6NC for the following actors. Updates only have been
mentioned here.
Directorate-General for Research and Innovation (DG RTD)38
The mission of the DG Research and Innovation is to develop and implement the European
research and innovation policy with a view to achieving the goals of Europe 2020 and the
Innovation Union.
Joint Research Centre (JRC)39
As the Commission's in-house science service, the JRC's mission is to provide EU policies
with independent, evidence-based scientific and technical support throughout the whole
policy cycle.
Directorate-General GROW – Internal Market, Industry, Entrepreneurship and SMEs40
The European Commission's DG GROW is responsible for EU policy on the single market,
industry, entrepreneurship and small businesses. DG GROW’s responsibilities were
previously covered by the DG for Internal Market (DG MARKT) and the DG for Enterprise
and Industry (DG ENTR). DG GROW has the mission of helping turn the EU into a smart,
sustainable and inclusive economy by implementing the industrial and sectorial policies of
the flagship Europe 2020 initiative. Additionally it is responsible for completing the internal
market for goods and services, fostering entrepreneurship and growth by reducing the
administrative burden on small businesses; facilitating access to funding for small and
medium-sized enterprises; supporting access to global markets for EU companies; generating
policy on the protection and enforcement of industrial property rights, coordinating the EU
position and negotiations in the international intellectual property rights (IPR) system, and
assisting innovators on how to effectively use IPR; delivering the EU’s space policy via the
two large-scale programmes, i.e. Copernicus (the European Earth Observation programme)
and Galileo (the European global navigation satellite system), as well as research action to
spur technological innovation and economic growth.
38 European Commission, Directorate-General for Research & Innovation – Mission, 2015, http://ec.europa.eu/research/index.cfm?pg=dg (Webpage accessed on 19-06-
2017).
39 EU Science Hub, the European Commission’s science and knowledge service, JRC, 2017, https://ec.europa.eu/jrc/en (Webpage accessed on 19-06-2017).
40 European Commission, Directorate-General GROW, Internal Market, Industry, Entrepreneurship and SMEs, 2017 https://ec.europa.eu/info/departments/internal-market-
industry-entrepreneurship-and-smes (Webpage accessed on 19-06-2017).

130
Directorate-General for Climate Action41
DG Climate Action was established in February 2010, climate change being previously
included in the remit of DG Environment. It leads international negotiations on climate, helps
the EU to deal with the consequences of climate change and to meet its targets for 2020 and
develops and implements the EU Emissions Trading System (EU ETS)42
.
European Environment Agency (EEA)43
and European Environment Information and
Observation Network (EIONET)44
The EEA is an agency of the European Union. The EEA aims to support sustainable
development by helping to achieve significant and measurable improvement in Europe's
environment, through the provision of timely, targeted, relevant and reliable information to
policymaking agents and the public. EIONET is a partnership network of the EEA and its
member and cooperating countries. The EEA is responsible for developing the network and
coordinating its activities.
European Space Agency (ESA)45
ESA is Europe’s gateway to space. Its mission is to shape the development of Europe’s space
capability and ensure that investment in space continues to deliver benefits to the citizens of
Europe and the world. ESA’s job is to draw up the European space programme and
implement it.
European Organisation for the Exploitation of Meteorological Satellites (EUMETSAT46
)
EUMETSAT purpose is to supply weather and climate-related satellite data, images and
products – 24 hours a day, 365 days a year – to the National Meteorological Services of
Member and Cooperating States in Europe, and other users worldwide. EUMETSAT has a
fully integrated cooperation with the United States, sharing and exploiting a joint polar
system with their National Oceanographic and Atmospheric Administration (NOAA) which
includes two satellites - Metop and NPP Suomi – flying on complementary polar orbits, the
so called “mid-morning” and “afternoon” orbits. EUMETSAT is also rapidly developing
cooperation with satellite operators of China, India, Japan, Korea and Russia to coordinate
their respective missions, exchange data and expertise, facilitate distribution of EUMETSAT
data world-wide and expand the portfolio of data services available to Member States.
Looking into the longer term future, EUMETSAT has already started to develop, in
cooperation with ESA, the future geostationary and low Earth satellite systems required to
deliver and further improve observations in the 2020 to 2040 timeframe47
. In addition,
41 Directorate-General for Climate Action (DG-CLIMA), Data Providers and Partners, 2011, European Environment agency. https://www.eea.europa.eu/data-and-
maps/data-providers-and-partners/directorate-general-for-climate-action (Webpage accessed on 19-06-2017).
43 The European Environment Agency. who we are/ what we do/how we do it, 2015, https://www.eea.europa.eu/publications/eea-general-brochure . Also
https://www.eea.europa.eu/ (Webpage accessed on 19-06-2017)
44 EIONET (website), News from across the EIONET. http://www.eionet.europa.eu/ (Webpage accessed on 19-06-2017).
45 ESA (website), 2017, United space in Europe. http://www.esa.int/ESA (webpage accessed on 19-06-2017).
46 EUMETSAT. 2017. Monitoring weather and climate from space. http://www.eumetsat.int/website/home/index.html (Webpage accessed on 19-06-2017).
47 EUMETSAT. 2017. Monitoring weather and climate from space. http://www.eumetsat.int/website/home/index.html (Webpage accessed on 19-06-2017).

131
EUMETSAT provides data, products and support services to the Copernicus information
services and user communities, with a focus on marine, atmosphere and climate48
.
European Institute of Innovation & Technology (EIT)49
The EIT is a body of the European Union that aims to enhance Europe’s ability to innovate
by nurturing entrepreneurial talent and supporting new ideas. Its mission is to contribute to
the competitiveness of Europe, its sustainable economic growth and job creation by
promoting and strengthening synergies and cooperation among businesses, education
institutions and research organisations. It also aims to create favourable environments for
creative thought, to enable world-class innovation and entrepreneurship to thrive in Europe.
EIT integrates higher education, research and business in areas of high societal need through
the Knowledge and Innovation Communities (KICs). Climate-KIC50
and EIT's InnoEnergy51
aim to significantly accelerate the innovation required for a transformation to a low-carbon
economy, and to ensure Europe benefits from new technologies, company growth and jobs.
Climate KIC has adopted four sectoral approaches to guide climate innovation and tackle
climate change including urban transitions, sustainable production systems, decision metrics
and finance and sustainable land use52
. EIT's InnoEnergy tackles all fields related to the
transformation of the energy system into a low-carbon one: energy storage, energy efficiency,
renewables, chemical fuels, smart grids, among others.
The below are new key RSO actors that were created since the publication of the EU’s
6NC.
European Research Council (ERC)53
The aim of the European Research Council (ERC) is to provide attractive and flexible
funding to enable talented and creative individual researchers and their teams to pursue
ground-breaking, high-gain/high-risk research in any field at the frontier of science. The
ERC was set up under the 2007-2013 research framework programme (FP7) and managed
the ‘Ideas’ initiative. Both the Ideas and Horizon 2020 objectives are fully in line with the
aims of the Europe 2020 strategy designed to deliver smart, sustainable and inclusive
growth through the strengthening of every link in the innovation chain, from 'blue sky'
research to commercialization and contribute to the Commission's general objective A new
boost for Jobs, Growth and Investment.
For that purpose, the ERC is composed on the one hand of an independent Scientific
Council of 22 scientists, scholars and engineers of the highest repute who establish the
overall ERC’s scientific strategy and have full authority over decisions on the type of
research to be funded. On the other hand, a dedicated implementation structure in the form
48 EUMETSAT, 2017, About Copernicus. http://www.eumetsat.int/website/home/Copernicus/AboutCopernicus/index.html (Webpage accessed on 19-06-2017).
49 European Institute of Innovation & Technology. 2017. EIT – Making Innovation Happen. https://eit.europa.eu/ (Webpage accessed on 19-06-2017).
50 Climate-KIC, 2017. About us. www.climate-kic.org (Webpage accessed on 19-06-2017).
51 http://www.innoenergy.com/
52 Climate-KIC, 2017, We adopt four sectoral approaches to guide climate innovation and tackle climate change. http://www.climate-kic.org/themes/ (Webpage accessed on
19-06-2017).
53 ERCEA, Annual work programme 2017, http://ec.europa.eu/info/publications/executive-agencies-2017-annual-work-programmes_en (Webpage accessed on 19-06-
2017).

132
of an executive Agency (ERCEA) is responsible for the administrative implementation and
programme execution under the supervision of its parent Directorate-General, DG RTD.
By supporting the best research and making Europe a magnet for world-class talent, the
ERC contributes actively to the Commission’s political guidelines, pushing knowledge
forward in a variety of fields including energy and climate.
Research Executive Agency (REA)
The REA is a funding institution for research and innovation, which manages EU research
grants. Responsibilities of the REA include to help manage parts of Horizon 2020, run
research projects supported under Horizon 2020 and FP7 (a predecessor programme to
Horizon 2020), provide support to clients (e.g. applicants for funding, beneficiaries and
independent experts), keep close contact with beneficiaries of EU funds, manage the EC
research enquiry service and support independent experts evaluating project proposals
competing for EU research funds.
Executive Agency for SMEs (EASME)
The Executive Agency for SMEs (EASME) replaces the executive agency for
competitiveness and innovation that managed Enterprise Europe Network, Intelligent Energy
– Europe, Eco-innovation and Marco Polo. The aim of EASME is to create a more
competitive and resource-efficient European economy based on knowledge and innovation.
EASME provides support to beneficiaries to turn EU policy into action and it manages
significant parts of COSME, LIFE and Horizon 2020.
8.2.1.6.Main instruments, policies and programmes
Table 8-1 provides an overview of the relevant main EU programmes on research and
systematic observation.
Table 8-1 Main EU programmes on research and systematic observation
Heading Programme Short description
1a: Competitiveness for
growth and jobs (includes the
European Fund for Strategic
Investment (EFSI)
Copernicus The European Earth Observation Programme
Horizon 2020 The Framework Programme for research and
innovation
CEF Connecting Europe Facility
COSME Programme for the Competitiveness of
Enterprises and small and medium-sized
enterprises: EU‘s programme dedicated to
support SMEs
2 Sustainable growth:
Natural resources
LIFE French: L’Instrument Financier pour
l’Environnement
Horizon 2020
Horizon 2020 (2014-2020) is the EU's main instrument for funding research and innovation
in Europe and beyond from 2014 to 2020.

133
Horizon 2020 is also the financial instrument implementing the Innovation Union, a Europe
2020 flagship initiative aimed at securing Europe's global competitiveness. It ‘promises more
breakthroughs, discoveries and world-firsts by taking great ideas from the lab to the
market’54
, including in the field of climate action.
Seen as an instrument to drive economic growth and create jobs, Horizon 2020 has the
political backing of Europe’s leaders and the Members of the European Parliament. They
agreed that research is an investment in the EU’s future and so put it at the heart of the EU’s
blueprint for smart, sustainable and inclusive growth and jobs.
By coupling research and innovation, Horizon 2020 is helping to achieve this with its
emphasis on excellent science, industrial leadership and tackling societal challenges. The
goal is to ensure Europe produces world-class science, removes barriers to innovation and
makes it easier for the public and private sectors to work together in delivering innovation.
Horizon 2020 is open to everyone, with a simple structure that aims to reduce red tape and
time so participants can focus on what is important.
This multi-annual regional programme relies on contributions from 28 EU Member States
and 14 Associated Countries55
. Legal entities from any country are eligible to join as
consortium members any project proposals to Horizon 2020 calls. Participation from outside
the European Union is explicitly encouraged in many calls for proposals56
.
Horizon 2020 is structured around three main research areas which are called “pillars”:
Excellent Science, the first pillar, focuses on basic science;
Industrial Leadership, the second pillar, has a budget of 14 billion euro, 18 % of
the total Horizon 2020 budget. This is based on Europe 2020 and Innovation
Union strategies and is managed by DG Enterprise;
Societal Challenges, the third pillar, funds potential solutions to social and
economic problems.
The societal challenge on climate action is particularly relevant for this chapter, as well as
some elements of the following societal challenges: health, food security, energy and
transport. There are also climate-related projects funded under the first pillar (Excellent
Science).
LIFE57
The LIFE Programme (French: L’Instrument Financier pour l’Environnement) is the
European Union’s funding instrument for the environment and climate action. The general
objective of LIFE is to contribute to the implementation, updating and development of EU
environmental and climate policy and legislation by co-financing projects with European
added value. LIFE began in 1992 and to date there have been four complete phases of the
54 European Commission, The EU Framework Programme for Research and Innovation, What is Horizon 2020?, 2015. (Webpage accessed on: 13-06-2017)
https://ec.europa.eu/programmes/horizon2020/en/what-horizon-2020)
55 Iceland, Norway, Albania, Bosnia and Herzegovina, the former Yugoslav Republic of Macedonia, Montenegro, Serbia, Turkey, Israel, Moldova, Switzerland, Faroe
Islands, Ukraine, Tunisia, Georgia and Armenia (http://ec.europa.eu/research/participants/data/ref/h2020/grants_manual/hi/3cpart/h2020-hi-list-ac_en.pdf)
56 http://ec.europa.eu/research/participants/data/ref/h2020/grants_manual/hi/3cpart/h2020-hi-3cpart_en.pdf
57 European Commission. 2017. LIFE (2014 – 2020). Available from: http://ec.europa.eu/environment/life/funding/lifeplus.htm [accessed on 20/07/2017].
134
programme (LIFE I: 1992-1995, LIFE II: 1996-1999, LIFE III: 2000-2006 and LIFE+: 2007-
2013). The current programme LIFE runs from 2014 to 2020 with a budget of 3.4 billion
Euro.
European Research Area (ERA)
The European Commission's 2012 policy Communication on the European Research Area58
led to a significant improvement in Europe's research performance to promote growth and job
creation.
With the explicit objective of opening up and connecting EU research systems – important
due to the increased cross-national nature of research – the ERA reform agenda focuses on
five key priorities:
More effective national research systems;
Optimal transnational co-operation and competition on common research agendas,
grand challenges and infrastructures;
An open labour market for researchers facilitating mobility, supporting training and
ensuring attractive careers;
Gender equality and gender mainstreaming in research encouraging gender diversity
to foster science excellence and relevance;
Optimal circulation and transfer of scientific knowledge to guarantee access to and
uptake of knowledge by all.
The ERA-NET instrument under Horizon 2020 is designed to support public-public
partnerships in their preparation, establishment of networking structures, design,
implementation and coordination of joint activities as well as topping up of single joint calls
and of actions of a transnational nature.
The ERA-NET under Horizon 2020 merges the former ERA-NET and ERA-NET Plus into a
single instrument with the central and compulsory element of implementing one substantial
call with top-up funding from the Commission. The focus of ERA-NETs is therefore shifting
from the funding of networks to the top-up funding of single joint calls for transnational
research and innovation in selected areas with high European added value and relevance for
Horizon 2020. This aims at increasing substantially the share of funding that Member States
dedicate jointly to challenge driven research and innovation agendas. Financial contributions
of Member States can be in cash or in kind to broaden the scope of ERA-NETs towards the
coordination institutional funding of governmental research organisations.
The Joint Programming Initiatives (JPI) are also part of the ERA. Particularly relevant in this
context are the JPI on Connecting Climate Knowledge for Europe (JPI-Climate) and on
Agriculture, Food Security and Climate Change (FACCE-JPI). The concept of Joint
Programming was introduced by the European Commission in July 2008.
58 European Commission. 2017. European Research Area. Available from: http://ec.europa.eu/research/era/index_en.htm [accessed on 25/07/2017].
135
JPI-Climate59
is a pan-European intergovernmental initiative gathering European countries to
jointly coordinate climate research and fund new transnational research initiatives that
provide useful climate knowledge and services for post-COP21 Climate Action.
JPI-Climate connects scientific disciplines, enables cross-border research and increases the
science-practice interaction. JPI-Climate contributes to the overall objective of developing a
ERA and to underpin the European efforts in tackling the societal challenge of climate
change. The JPI-Climate Strategic Research and Innovation Agenda (SRIA) sets out three
overarching challenges and one strategic mechanism that together are intended to develop
and support excellent, innovative, relevant and informative climate research. The framing –
especially the emphasis on connectivity and synergy - reflects the priorities and approaches
of researchers, funders and practitioners in the countries participating in JPI-Climate.
The Joint Programming Initiative on Agriculture, Food Security and Climate Change
(FACCE-JPI)60
brings together 22 countries who are committed to building an integrated
ERA addressing the interconnected challenges of sustainable agriculture, food security and
impacts of climate change.
FACCE-JPI provides and steers research to support sustainable agricultural production and
economic growth, to contribute to a European bio-based economy, while maintaining and
restoring ecosystem services under current and future climate change. The integrated
FACCE-JPI strategic research agenda defines five core research themes:
Sustainable food security under climate change, based on an integrated food systems
perspective: modelling, benchmarking and policy research perspective;
Environmentally sustainable growth and intensification of agricultural systems under
current and future climate and resource availability;
Assessing and reducing trade-offs between food production, biodiversity and
ecosystem services;
Adaptation to climate change throughout the whole food chain, including market
repercussions;
Greenhouse gas mitigation: nitrous oxide and methane mitigation in the agriculture
and forestry sector, carbon sequestration, fossil fuel substitution and mitigating GHG
emissions induced by indirect land use change.
An implementation plan was launched in the summer of 2015, setting out short-term and
mid-term priority actions to implement the FACCE-JPI strategic research agenda, in
coherence with the Work-Programme of Horizon 2020.
In 2016 saw an update to the original Strategic Research Agenda named "FACCE-JPI in
brief". This update refreshed the original five core themes, reframing them around new, more
impact-driven research priorities.
59 JPI Climate. 2017. Connecting Climate Knowledge for Europe. Available from: http://www.jpi-climate.eu/home. [accessed on 20/07/2017].
60 Agriculture, Food Security and Climate Change (FACCEJPI). What is FACCE-JPI? Available from: http://www.faccejpi.com/About-Us/What-is-FACCE-JPI [accessed
on 20/07/2017].

136
The JPI Urban Europe61
was created in 2010 to address the global urban challenges of today
with the ambition to develop a European research and innovation hub on urban matters and
create European solutions by means of coordinated research. Research themes for 2014 to
2020 include: sustainable transition pathways; and urban environmental sustainability and
resilience.
Article 18562
Article 185 of the Treaty on the Functioning of the European Union (TFEU) enables the EU
to participate in research programmes undertaken jointly by several Member States, including
participation in the structures created for the execution of national programmes.
The actions supported may cover subjects not directly linked to the themes of Horizon 2020,
as far as they have a sufficient EU added value. They will also be used to enhance the
complementarity and synergy between Horizon 2020 and activities carried out under
intergovernmental structures such as EUREKA63
and COST64
.
61 Urban Europe. 2017. Introduction JPI Urban Europe. Available from: http://jpi-urbaneurope.eu/about/intro/ [accessed on 20/07/2017].
62 European Commission. 2017. European Research Area What is Article 185? Available from: http://ec.europa.eu/research/era/what-is-art-185_en.htm [accessed on
20/07/2017].
63 Eureka Network – Innovation Across Borders. 2017. Eureka Cluster Success Story. Available from: http://www.eurekanetwork.org/ [accessed on 20/07/2017].
64 Cost, European Cooperation in Science and Technology. 2017. About Cost. Available from: http://www.cost.eu/ [accessed on 20/07/2017].

137
Copernicus65
Through satellite and in-situ observations, six Copernicus services deliver near-real-time
data, products and information on a global level which can also be used for local and regional
needs, to help us better understand our planet and sustainably manage the environment we
live in. A detailed description of Copernicus, its users, management and services can be
found in section 8.4.1.2. under cross-cutting activities in systematic observations.
Summary information on GCOS activities
GCOS is intended to be a long-term, user-driven operational system capable of providing
the comprehensive observations required for:
Monitoring the climate system;
Detecting and attributing climate change;
Assessing impacts of, and supporting adaptation to, climate variability and change
Application to national economic development; and
Research to improve understanding, modelling and prediction of the climate
system.
As contributing to GCOS, the EU contributes to the collection of Atmospheric, Oceanic and
Terrestrial Essential Climate Variables (ECVs) through Copernicus, the European system
for monitoring the Earth. GCOS assesses and communicates requirements for climate
observations and data products, identifies in particular the ECVs on which data are needed,
advises on and promotes implementation and reviews progress and reports to its sponsors
and the UNFCCC. In its latest report on implementation needs GCOS also makes the link
between climate needs and those serving other international forums such as the UN
Convention to Combat Desertification, the Convention to combat desertification, the
Convention on Biological Diversity, the Ramsar convention on wetlands, the Sendai
framework for disaster risk reduction and the Sustainable Development Goals of Agenda
2030.
The European Commission has undertaken to evaluate the status quo and future plans for
the provision of climate data and identify what actions are required to build on existing and
planned capacities to secure a dependable and comprehensive information source for climate
data. The Copernicus’ Climate Change service will in particular contribute to the provision
of ECVs, climate analyses and projections at temporal and spatial scales relevant to
adaptation and mitigation strategies for the various EU sectoral policies.
8.2.1.7.International Cooperation
Fostering international cooperation in research and innovation is a strategic priority for the
EU, as it allows:
Access to the latest knowledge and the best talent worldwide;
To tackle global societal challenges more effectively;
To create business opportunities in new and emerging markets;
To support external policy through science diplomacy.
65 Copernicus, Europe’s eyes on Earth. 2017. Copernicus in brief. Available from: http://www.copernicus.eu/main/copernicus-brief [accessed on 20/07/2017].

138
Horizon 2020, the EU's framework programme for research and innovation, is open to
participants from across the world and with many topics specifically targeting international
cooperation. Cooperation takes place in research and innovation projects, networking
between projects, joint or coordinated calls and specific joint initiatives.
The European Commission is leading the way in many global research partnerships. Very
often research and innovation to tackle societal challenges in areas like health, food, energy
and water is best implemented through global multilateral initiatives where solutions can be
developed and deployed more effectively. These multilateral initiatives are important to
address EU commitments to international objectives like the 2030 Agenda for Sustainable
Development; COP21 (also referred to as the Paris Agreement); Mission Innovation
(launched in the margins of COP 21, see also Section 9.9.2.4), to accelerate global clean
energy innovation through the doubling of clean energy R&I public investments in the next 5
years; or the WHO Resolutions, to reduce the global burden and pool resources for better
results and greater impact.
Knowledge and technology should also circulate as freely as possible in a "global research
area". To enable researchers to work together smoothly across borders, e.g. on large-scale
common challenges, the European Commission is working to address obstacles to efficient
international cooperation by ensuring fair and equitable framework conditions. This includes
issues such as reciprocal access to programmes, mechanisms for co-funding, mutual access to
resources and efficient and fair intellectual property rights systems. To do so, the EU
concluded 20 Science & Technology (S&T) agreements and maintains several policy
dialogues with countries and regions across the globe.
Established in 1984, the Committee on Earth Observation Satellites (CEOS) coordinates civil
space-borne observations of the Earth. Participating agencies strive to enhance international
coordination and data exchange and to optimize societal benefit. Currently, 60 members and
associate members made up of space agencies, national, and international organizations
participate in CEOS planning and activities. It is noteworthy that the European Commission
will chair CEOS activities in 2018.
8.2.2. Funding of RSO
The EU is among the world leaders in research and innovation and is regarded as an
attractive partner for international cooperation. Environmental research is a particularly
good example of EU efforts to provide a common reference framework and tackle global
societal challenges – whether they relate to climate, disasters, water or pollution – together
with international partners.
Considering the crucial role of research and innovation in tackling climate change66
, funding
for climate action has been mainstream in the EU's multiannual financial framework 2014-
2020, incl. in main EU research funds, see Table 8-22. In Horizon 2020 'climate action,
resource efficiency and raw materials' has been identified as one of the societal challenges
that will drive the activities from research to market in Horizon 2020. Low-carbon solutions
in the energy system, mobility and transport will be the focus of two other societal
challenges. The programme marks a new emphasis on innovation-related solutions and it is
66 European Commission. 2017. Research and Innovation – Pushing boundaries and improving quality of life Available from: https://europa.eu/european-
union/sites/europaeu/files/research_en.pdf [accessed on 25/07/2017].

139
expected that around 35 % of the Horizon 2020 budget of around € 80 billion will be climate
related expenditure; see Table 8-2.
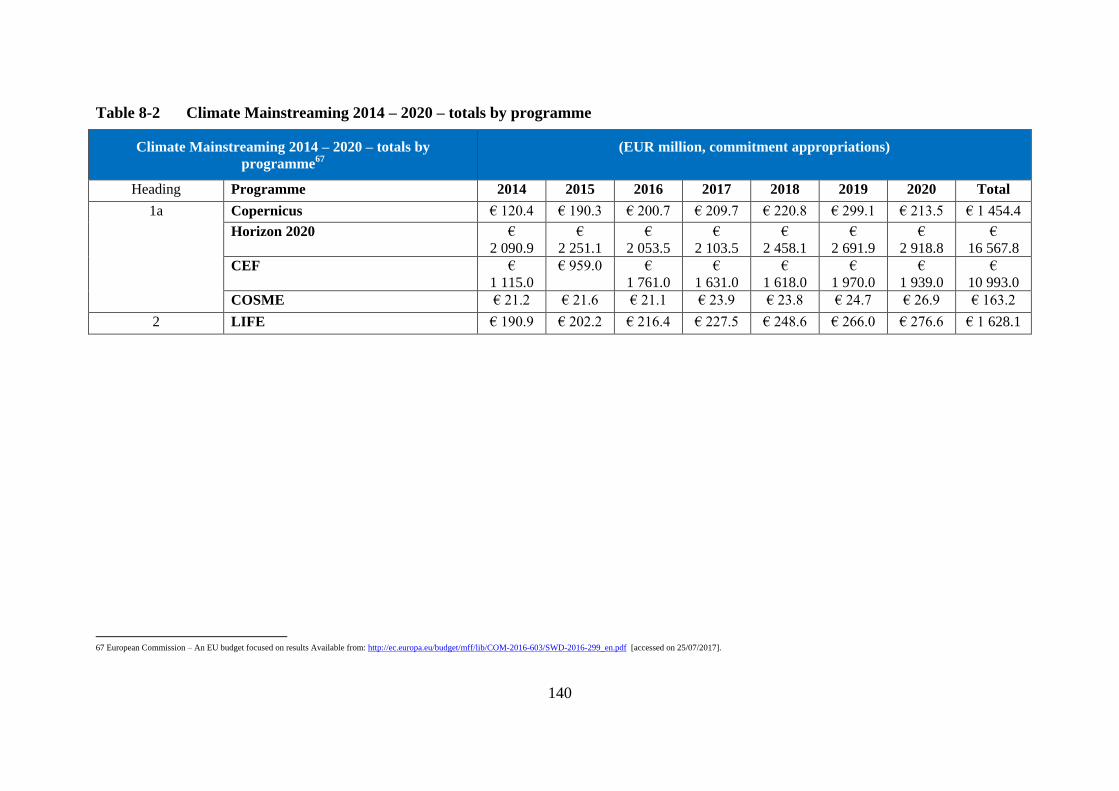
140
Table 8-2 Climate Mainstreaming 2014 – 2020 – totals by programme
Climate Mainstreaming 2014 – 2020 – totals by
programme67
(EUR million, commitment appropriations)
Heading Programme 2014 2015 2016 2017 2018 2019 2020 Total
1a Copernicus € 120.4 € 190.3 € 200.7 € 209.7 € 220.8 € 299.1 € 213.5 € 1 454.4
Horizon 2020 €
2 090.9
€
2 251.1
€
2 053.5
€
2 103.5
€
2 458.1
€
2 691.9
€
2 918.8
€
16 567.8
CEF €
1 115.0
€ 959.0 €
1 761.0
€
1 631.0
€
1 618.0
€
1 970.0
€
1 939.0
€
10 993.0
COSME € 21.2 € 21.6 € 21.1 € 23.9 € 23.8 € 24.7 € 26.9 € 163.2
2 LIFE € 190.9 € 202.2 € 216.4 € 227.5 € 248.6 € 266.0 € 276.6 € 1 628.1
67 European Commission – An EU budget focused on results Available from: http://ec.europa.eu/budget/mff/lib/COM-2016-603/SWD-2016-299_en.pdf [accessed on 25/07/2017].
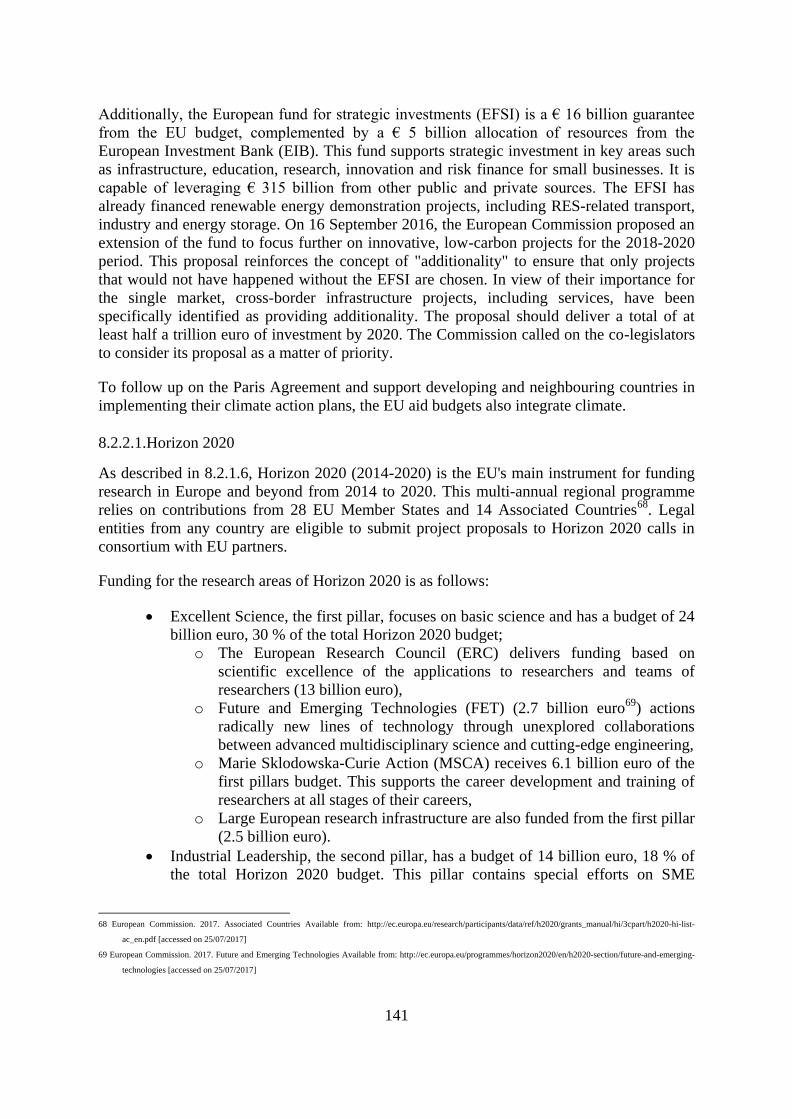
141
Additionally, the European fund for strategic investments (EFSI) is a € 16 billion guarantee
from the EU budget, complemented by a € 5 billion allocation of resources from the
European Investment Bank (EIB). This fund supports strategic investment in key areas such
as infrastructure, education, research, innovation and risk finance for small businesses. It is
capable of leveraging € 315 billion from other public and private sources. The EFSI has
already financed renewable energy demonstration projects, including RES-related transport,
industry and energy storage. On 16 September 2016, the European Commission proposed an
extension of the fund to focus further on innovative, low-carbon projects for the 2018-2020
period. This proposal reinforces the concept of "additionality" to ensure that only projects
that would not have happened without the EFSI are chosen. In view of their importance for
the single market, cross-border infrastructure projects, including services, have been
specifically identified as providing additionality. The proposal should deliver a total of at
least half a trillion euro of investment by 2020. The Commission called on the co-legislators
to consider its proposal as a matter of priority.
To follow up on the Paris Agreement and support developing and neighbouring countries in
implementing their climate action plans, the EU aid budgets also integrate climate.
8.2.2.1.Horizon 2020
As described in 8.2.1.6, Horizon 2020 (2014-2020) is the EU's main instrument for funding
research in Europe and beyond from 2014 to 2020. This multi-annual regional programme
relies on contributions from 28 EU Member States and 14 Associated Countries68
. Legal
entities from any country are eligible to submit project proposals to Horizon 2020 calls in
consortium with EU partners.
Funding for the research areas of Horizon 2020 is as follows:
Excellent Science, the first pillar, focuses on basic science and has a budget of 24
billion euro, 30 % of the total Horizon 2020 budget;
o The European Research Council (ERC) delivers funding based on
scientific excellence of the applications to researchers and teams of
researchers (13 billion euro),
o Future and Emerging Technologies (FET) (2.7 billion euro69
) actions
radically new lines of technology through unexplored collaborations
between advanced multidisciplinary science and cutting-edge engineering,
o Marie Sklodowska-Curie Action (MSCA) receives 6.1 billion euro of the
first pillars budget. This supports the career development and training of
researchers at all stages of their careers,
o Large European research infrastructure are also funded from the first pillar
(2.5 billion euro).
Industrial Leadership, the second pillar, has a budget of 14 billion euro, 18 % of
the total Horizon 2020 budget. This pillar contains special efforts on SME
68 European Commission. 2017. Associated Countries Available from: http://ec.europa.eu/research/participants/data/ref/h2020/grants_manual/hi/3cpart/h2020-hi-list-
ac_en.pdf [accessed on 25/07/2017]
69 European Commission. 2017. Future and Emerging Technologies Available from: http://ec.europa.eu/programmes/horizon2020/en/h2020-section/future-and-emerging-
technologies [accessed on 25/07/2017]

142
funding and also gives risk financing through loans of the European Investment
Bank (2.8 billion euro);
Societal challenges, the third pillar, funds potential solutions to social and
economic problems. It is split into seven sub-programs;
o Health (7.5 billion euro),
o Food, water, forestry, bio economy (3.8 billion euro),
o Energy (5.9 billion euro),
o Transport (6.3 billion euro),
o Climate action, environment, resource efficiency, and raw materials (3.1
billion euro),
o European society (1.3 billion euro),
o Security (1.7 billion euro).
Progress has been, and continues to be, made in reducing fragmentation across the European
Research Area and in strengthening coordination of national and regional research
programmes. Horizon 2020 is supporting two main tools to achieve these goals – the ERA-
NET scheme and actions under Article 185, as described below.
8.2.2.2.LIFE
As described under Section 8.2.1.6., the LIFE Programme (French: L’Instrument Financier
pour l’Environnement) is the European Union’s funding instrument for the environment and
climate action. From 1992 LIFE has co-financed some 4 306 projects across the EU.
The LIFE programme for 2014-2020, with a budget of € 3.4 billion, will support public
authorities, NGOs and private actors, especially small and medium enterprises, in testing
small-scale low carbon and adaptation technologies, new approaches and methodologies to
address climate issues. Specific local and regional climate mitigation or adaptation strategies
or action plans will also be financed. Moreover, the sub-programme will support capacity
building as well as awareness-raising actions involving stakeholders, in order to improve the
implementation of the existing climate legislation.
8.3. Research
Figure 8-1 gives an overview of the main areas for research projects and the sections where
they are discussed in this national communication.

143
Figure 8-1 Overview of main areas of research projects and section numbers
8.3.1. Climate process and climate system studies, including paleoclimate studies
For most of the areas in Sections 8.3, 8.4 and 8.5, a selection of key projects is listed as in
the diagram below. This includes some additional information such as the end date of the
project and whether it included cooperation with participants from outside the EU. Further
information about the projects, including their end date, EU contribution and website is
given in Appendix III.

144
8.3.2. Modelling and prediction, including general circulation models
8.3.3. Research on the impacts of climate change
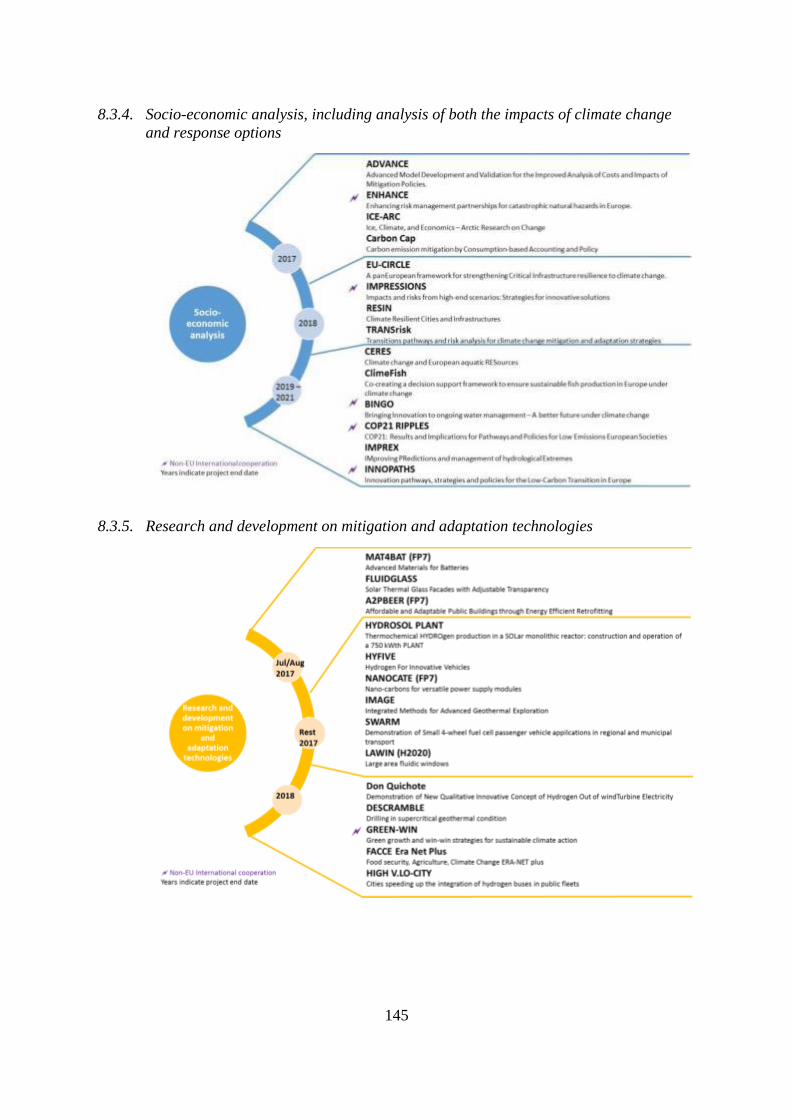
145
8.3.4. Socio-economic analysis, including analysis of both the impacts of climate change
and response options
8.3.5. Research and development on mitigation and adaptation technologies

146
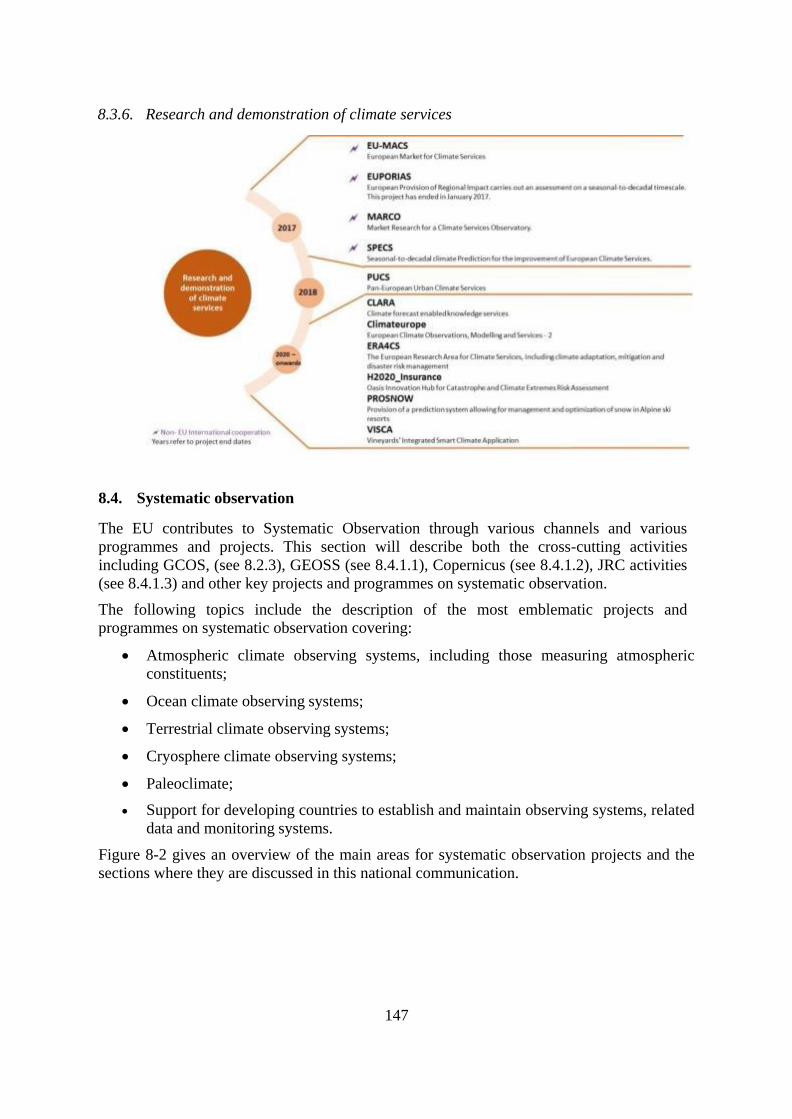
147
8.3.6. Research and demonstration of climate services
8.4. Systematic observation
The EU contributes to Systematic Observation through various channels and various
programmes and projects. This section will describe both the cross-cutting activities
including GCOS, (see 8.2.3), GEOSS (see 8.4.1.1), Copernicus (see 8.4.1.2), JRC activities
(see 8.4.1.3) and other key projects and programmes on systematic observation.
The following topics include the description of the most emblematic projects and
programmes on systematic observation covering:
Atmospheric climate observing systems, including those measuring atmospheric
constituents;
Ocean climate observing systems;
Terrestrial climate observing systems;
Cryosphere climate observing systems;
Paleoclimate;
Support for developing countries to establish and maintain observing systems, related
data and monitoring systems.
Figure 8-2 gives an overview of the main areas for systematic observation projects and the
sections where they are discussed in this national communication.

148
Figure 8-2 Overview of main areas of systematic observation projects and section
numbers
8.4.1. Cross-cutting activities
8.4.1.1.Global Earth Observation System of Systems (GEOSS)
The Earth’s atmosphere, oceans and landscapes are changing rapidly, with human activities
being a major driver. Monitoring and modelling these changes are critical for governments,
private sector and citizens to make informed decisions on the global challenges our society is
facing. Vital information is being gathered by land, sea, air and space-based Earth
observation systems.
The Group on Earth Observations (GEO) brings together 103 partner countries from around
the world, including the European Commission and 109 participating organizations to
connect the demand for sound and timely environmental information with the supply of data
and information about the Earth. Together, the GEO community is creating a Global Earth
Observation System of Systems (GEOSS) to better integrate observing systems and share
data by connecting existing infrastructures using common standards. There are more than
200 million open data resources in GEOSS.
Advocacy for broad, open data policies helps ensure that the data collected through national,
regional and global observing systems is both made available and applied to decision-
making for global priorities including The Sustainable Development Goals, The Paris
Agreement on climate change, The Sendai Framework for Disaster Risk Reduction and
Aichi Targets of The Convention on Biodiversity. GEOSS provides open and unrestricted
access to millions of observation data, items of information and products. These can be used
to tackle issues including protecting people against natural disasters, responding to climate
change, managing energy resources or promoting sustainable agriculture, among other
societal challenges.

149
In January 2014, government ministers from the GEO member countries resolved to renew
GEO's mandate for a further decade. This second phase of GEO (2016-2025) will be crucial
in terms of stepping up the use of a more robust GEOSS.
The GEO Workplan 2017-2025 brings together experts to ensure global collaboration,
identify gaps and reduce duplication in the areas of Biodiversity and Ecosystem
Sustainability; Disaster Resilience; Energy and Mineral Resources Management; Food
Security; Infrastructure & Transportation Management; Public Health Surveillance;
Sustainable Urban Development; and Water Resources Management.
The EU is a driving force within GEO. The European Commission, as a founding member
and one of the four co-chairs of this initiative, and the EU Member States are contributing
actively to this international effort. This has resulted in strengthened transnational
collaboration in Earth observation activities within and outside the EU.
The EU Research and Innovation programmes have been pivotal in building the GEOSS,
with more than € 200 M invested over the period 2007-2013 and with ongoing support by
Horizon 2020 activities. Copernicus, the European Earth observation programme, also
provides a crucial framework for the achievement of a strong and visible European
contribution.
The current transition period in GEO is a unique window of opportunity for Europe to assess
and review its position in this global initiative. Therefore, the European Commission has
conducted several consultations of experts and society to identify preliminary issues and
possible EU-level actions to improve coordination of Earth Observations through GEO and
speed up the evolution of the GEOSS into a system with the capacity to contribute to EU
policies and benefit EU industry and European society as a whole. The outcomes of these
consultations were consolidated in the Commission document "Global Earth Observation
System of Systems (GEOSS): achievements to date and challenges to 2025" and in the report
which resulted from a public consultation conducted in 2015.
8.4.1.2.Copernicus
Through satellite and in-situ observations, Copernicus services deliver near-real-time data,
products and information on a global level which can also be used for local and regional
needs, to help us better understand our planet and sustainably manage the environment we
live in.
Copernicus is served by a set of dedicated satellites (the Sentinel families) and contributing
missions (existing commercial and public satellites). The Sentinel satellites are specifically
designed to meet the needs of the Copernicus services and their users. Since the launch of
Sentinel-1A in 2014, the European Union set in motion a process to place a constellation of
almost 20 more satellites in orbit before 2030.
Copernicus also collects information from In-situ networks, which deliver data acquired by a
multitude of sensors on the ground, at sea or in the air.
The Copernicus Services transform this wealth of satellite and in-situ data into value-added
information by processing and analysing the data. Datasets stretching back for years and

150
decades are made comparable and searchable, thus ensuring the monitoring of changes;
patterns are examined and used to create better forecasts, for example, of the ocean and the
atmosphere. Maps are created from imagery, features and anomalies are identified and
statistical information is extracted.
These value-adding activities are streamlined through six thematic streams of Copernicus
services:
Atmosphere (CAMS) (See Section 8.4.2.1);
Marine (CMEMS) (See Section 8.4.3.1);
Land (CLMS) (See Section 8.4.4.1);
Climate Change (C3S) (see Section 8.4.5.1);
Emergency (EMS);
Security.
The information provided by the Copernicus services can be used by end users for a wide
range of applications in a variety of areas. These include urban area management, sustainable
development and nature protection, regional and local planning, agriculture, forestry and
fisheries, health, civil protection, infrastructure, transport and mobility, as well as tourism.
The main users of Copernicus services are policymakers and public authorities who need the
information to develop environmental legislation and policies or to take critical decisions in
the event of an emergency, such as a natural disaster or a humanitarian crisis.
Based on the Copernicus services and on the data collected through the Sentinels and the
contributing missions, many value-added services can be tailored to specific public or
commercial needs, resulting in new business opportunities.
In 2016, the European Commission completed a large-scale study which examined the
overall impact of the Copernicus programme on the European economy and its benefits for
the Space industry, the downstream sector and end-users. The results of this exercise were
published in the first Copernicus Market Report. Moreover, several former economic studies
had already demonstrated a huge potential for job creation, innovation and growth.
The Copernicus programme is coordinated and managed by the European Commission. The
development of the observation infrastructure is performed under the aegis of the European
Space Agency for the space component and of the European Environment Agency and the
Member States for the in situ component.

151
8.4.1.3.JRC activities
A number of JRC activities are related to climate change. Beyond its contribution to
legislative proposals, the JRC advised EU negotiators at the Marrakech summit (COP22) and
presented its most recent work to inform related debates in the broader scientific and policy
arenas.
Some examples of the large number of achievements and impacts of the JRC in climate area
are related to:
Achievement Year Description and impact
JRC report: Paris pledges
insufficient to meet 2°C,
(GECO 2016 - Global
Energy and Climate
Outlook: Road from Paris)
2016 This report looks into the evolution of the world energy system and
GHG emissions to 2050 under different energy and climate policy
scenarios. Based on the most recent energy and economic data, the
report provided a quantified foundation for international discussions
and contributed to future global stocktaking exercises.
JRC and the PBL
Netherlands
Environmental Assessment
Agency Report: Global
CO2 emissions from fossil
fuels and industrial
processes stall
2016 This report concluded that global CO2 emissions from fossil-fuel
combustion and industrial processes stalled, confirming the slowing
trend observed since 2012.
The JRC co-authored the
Copernicus CO2 report:
Independent Greenhouse
Gas Verification
2016 This report describes the greenhouse gas verification system. This
report was cited by the New York Times (May 2016) and presented
to the UNFCCC SBSTA meeting (Bonn, May 2016) and to the
COP22 summit (Marrakech, November 2016).
Methodology for setting
forest reference levels
(FRLs)
2016 Driving Europe’s transition to a Low-Carbon Economy - the JRC
developed a methodology for setting forest reference levels (FRLs),
which enable different national circumstances to be accommodated.
The JRC also contributed to the development of a set of scenarios

152
for assessing the impact of different policies to tackle CO2
emissions from road transport. The scenarios were simulated with
the JRC's newly developed fleet impact model DIONE, to develop
projections on the evolution of the vehicle mix, activity, energy
consumption and emissions up to 2050.
Modelling tool SHERPA 2016 The SHERPA model (Screening for High Emission Reduction
Potential on Air) calculates how changes in emissions affect air
quality in urban areas.
Report on biofuels:
Biofuels from algae:
technology options, energy
balance and GHG
emissions
2016 This shows that the cost of algal production and its conversion into
biofuels remains still too costly for economically viable production.
Report on the Covenant of
Mayors (CoMs):
Greenhouse Gas Emissions
Achievements and
Projections
2016 This report revealed that the first 315 implementation reports from
more than 6 200 municipalities across the EU and beyond show an
overall reduction in GHG emissions of 23 % compared to baseline
levels. Building on the CoM, a new, more ambitious Covenant of
Mayors for Climate and Energy was announced in October 2015,
based on three pillars: mitigation; adaptation; and secure,
sustainable and affordable energy. At 4 September 2016, the cut-off
date of the JRC analysis, 6 926 local authorities from 54 countries
had joined the initiative, representing more than 213 million
inhabitants.
Report on how design,
construction, operation and
maintenance standards of
critical infrastructures
should be adapted to
protect them from climate-
related hazards.
2016 According to a new JRC study, the current design, construction,
operation and maintenance standards of critical infrastructures,
including energy, transport, industrial and social sectors, should be
adapted to protect them from climate-related hazards. The study
also showed that southern countries are most likely to be affected
throughout the 21st century and thus require substantial investment
to protect them from climate hazards.
Study on food safety and
nutrition in 2050
2016 JRC contributed to a study on food safety and nutrition in 2050
which employed the methodology of scenario constructed on the
basis of different developments of specific drivers that can
significantly impact and bring change to the food system, including
climate change (Delivering on EU food safety and nutrition in 2050
– future challenges and policy preparedness).
European Atlas of Forest
Tree Species
2016 This provides a wealth of information on the many tree species in
our forests, including their climatic preferences and singularities
and how threats such as climate change may affect them.
European Energy
Efficiency Platform (E3P)
2016 JRC has a long history of cooperation in earth observation research
and programme planning with other key Copernicus partners across
Europe, especially ESA, EUMETSAT, ECMWF, EUSC, EMSA,
Frontex and EEA. JRC launched the interactive and collaborative
online European Energy Efficiency Platform (E3P) and also
contributed to the Accelerating Clean-Energy Innovation
Communication with the findings produced by the Strategic Energy
Technologies Information System (SETIS). It was also involved in a
number of initiatives related to the EU Energy Security Strategy.
Studies on the economic
impacts of climate change
in the EU
2014
and
ongoing
PESETA I, PESETA II (reported in 2014) and PESETA III
(expected to be completed in 2017. See also Section 6.6.

153
Studies in the area of
"Associated and
Neighbourhood Countries"
- Air quality in the Danube macroregion and modelling vector-borne
infectious disease dynamics under climate change
Studies on Arctic sea ice 2016
and
2017
Recent JRC studies suggest that the ongoing shrinkage of the Arctic
sea ice cover is linked to a combination of global temperature rise,
the pronounced warming in the Arctic and weather anomalies in the
mid-latitudes70. Changes in atmospheric circulation due to polar
atmospheric warming and reduced winter sea ice have also
significantly impacted the long range transport and deposition of
black carbon (BC) in the Arctic71.
Research, technology,
technical services and
training for nuclear
safeguards
- JRC continues to provide enabling research, technology,
instruments, technical services and training for nuclear safeguards
including the verification of treaties and agreements, to inspection
agencies, States and operators, as planed under the EURATOM
treaty. This includes promoting education and training for Nuclear
Decommissioning
8.4.2. Atmospheric climate observing systems, including those measuring atmospheric
constituents
8.4.2.1.Copernicus Atmosphere Monitoring Service
The Copernicus Atmosphere Monitoring Service (CAMS) is part of the Copernicus
Programme and provides continuous data and information on atmospheric composition. The
service describes the current situation, forecasts the situation a few days ahead, and analyses
consistently retrospective data records for recent years. This service, MACC-III (Monitoring
Atmospheric Composition and Climate - Interim Implementation), is the pre-operational
Copernicus Atmosphere Service.
CAMS delivers the following operational services:
Daily production of near-real-time analyses and forecasts of global atmospheric
composition;
Reanalyses providing consistent multi-annual global datasets of atmospheric
composition with a frozen model/assimilation system;
Daily production of near-real-time European air quality analyses and forecasts with a
multi-model ensemble system;
Reanalyses providing consistent annual datasets of European air quality with a frozen
model/assimilation system, supporting in particular policy applications;
70 Dobricic and Vignati (2016), Large-Scale Atmospheric Warming in Winter and the Arctic Sea Ice Retreat, American Meteorological Society. Available at:
http://journals.ametsoc.org/doi/pdf/10.1175/JCLI-D-15-0417.1
71 Pozzoli, et al. (2017) Impacts of large-scale atmospheric circulation changes in winter on black carbon transport and deposition to the Arctic, Atmospheric Chemistry
and Physic, 17, 11803–11818 Available at: https://www.atmos-chem-phys.net/17/11803/2017/acp-17-11803-2017.pdf

154
Products to support policy users, adding value to “raw” data products in order to
deliver information products in a form adapted to policy applications and policy-
relevant work;
Solar and UV radiation products supporting the planning, monitoring, and efficiency
improvements of solar energy production and providing quantitative information on
UV irradiance for downstream applications related to health and ecosystems;
Greenhouse gas surface flux inversions for CO2, CH4 and N2O, allowing the
monitoring of the evolution in time of these fluxes;
Climate forcings from aerosols and long-lived (CO2, CH4) and shorter-lived
(stratospheric and tropospheric ozone) agents;
Anthropogenic emissions for the global and European domains and global emissions
from wildfires and biomass burning.
8.4.3. Ocean climate observing systems
8.4.3.1.Copernicus Marine Environment Monitoring Service
The Copernicus Marine Environment Monitoring Service (CMEMS) provides regular and
systematic reference information on the physical state, variability and dynamics of the
ocean and marine ecosystems for the global ocean and the European regional seas.
The observations and forecasts produced by the service support all marine applications.
For instance, the provision of data on currents, winds and sea ice help to improve ship
routing services, offshore operations or search and rescue operations, thus contributing to
marine safety.
The service also contributes to the protection and the sustainable management of living
marine resources in particular for aquaculture, fishery research or regional fishery
organisations.
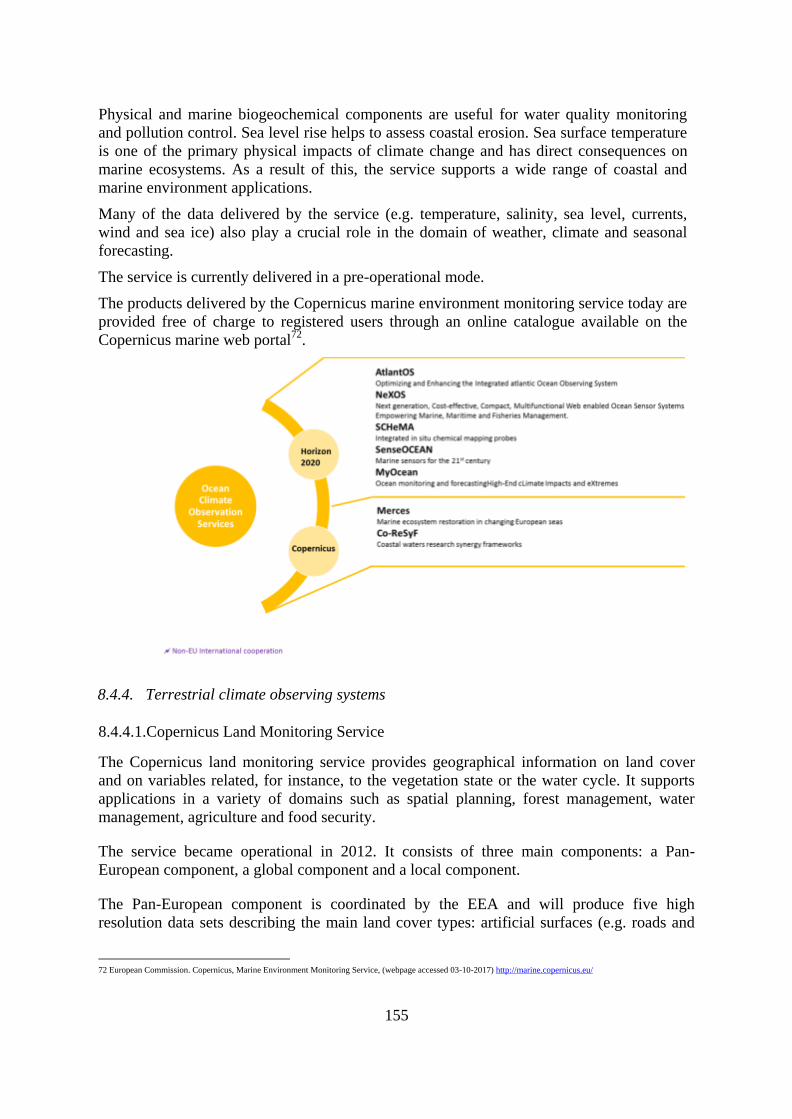
155
Physical and marine biogeochemical components are useful for water quality monitoring
and pollution control. Sea level rise helps to assess coastal erosion. Sea surface temperature
is one of the primary physical impacts of climate change and has direct consequences on
marine ecosystems. As a result of this, the service supports a wide range of coastal and
marine environment applications.
Many of the data delivered by the service (e.g. temperature, salinity, sea level, currents,
wind and sea ice) also play a crucial role in the domain of weather, climate and seasonal
forecasting.
The service is currently delivered in a pre-operational mode.
The products delivered by the Copernicus marine environment monitoring service today are
provided free of charge to registered users through an online catalogue available on the
Copernicus marine web portal72
.
8.4.4. Terrestrial climate observing systems
8.4.4.1.Copernicus Land Monitoring Service
The Copernicus land monitoring service provides geographical information on land cover
and on variables related, for instance, to the vegetation state or the water cycle. It supports
applications in a variety of domains such as spatial planning, forest management, water
management, agriculture and food security.
The service became operational in 2012. It consists of three main components: a Pan-
European component, a global component and a local component.
The Pan-European component is coordinated by the EEA and will produce five high
resolution data sets describing the main land cover types: artificial surfaces (e.g. roads and
72 European Commission. Copernicus, Marine Environment Monitoring Service, (webpage accessed 03-10-2017) http://marine.copernicus.eu/
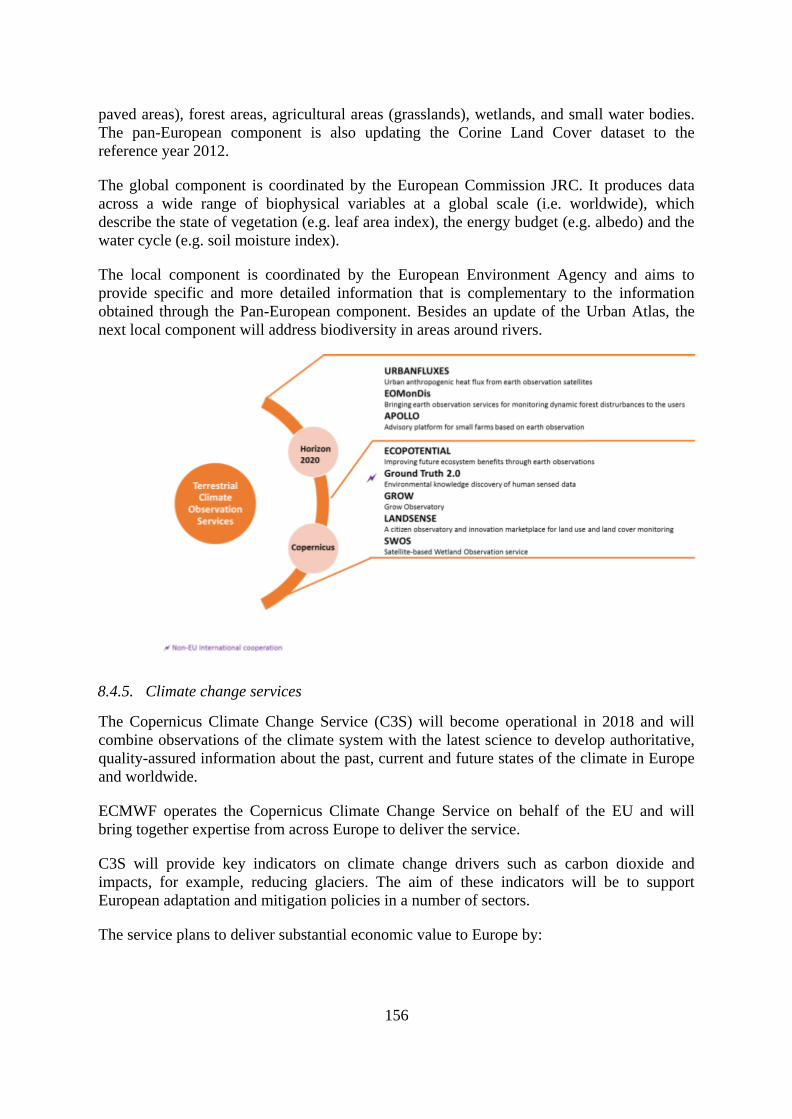
156
paved areas), forest areas, agricultural areas (grasslands), wetlands, and small water bodies.
The pan-European component is also updating the Corine Land Cover dataset to the
reference year 2012.
The global component is coordinated by the European Commission JRC. It produces data
across a wide range of biophysical variables at a global scale (i.e. worldwide), which
describe the state of vegetation (e.g. leaf area index), the energy budget (e.g. albedo) and the
water cycle (e.g. soil moisture index).
The local component is coordinated by the European Environment Agency and aims to
provide specific and more detailed information that is complementary to the information
obtained through the Pan-European component. Besides an update of the Urban Atlas, the
next local component will address biodiversity in areas around rivers.
8.4.5. Climate change services
The Copernicus Climate Change Service (C3S) will become operational in 2018 and will
combine observations of the climate system with the latest science to develop authoritative,
quality-assured information about the past, current and future states of the climate in Europe
and worldwide.
ECMWF operates the Copernicus Climate Change Service on behalf of the EU and will
bring together expertise from across Europe to deliver the service.
C3S will provide key indicators on climate change drivers such as carbon dioxide and
impacts, for example, reducing glaciers. The aim of these indicators will be to support
European adaptation and mitigation policies in a number of sectors.
The service plans to deliver substantial economic value to Europe by:

157
Informing policy development to protect citizens from climate-related hazards such
as high-impact weather events;
Improving planning of mitigation and adaptation practices for key human and
societal activities;
Promoting the development of new services for the benefit of society.
The service will build upon and complement capabilities existing at national level and being
developed through a number of climate-change research initiatives. It will become a major
contribution from the EU to the WMO Global Framework for Climate Services and its
Climate Monitoring Architecture.
The service will provide comprehensive climate information covering a wide range of
components of the Earth-system and timescales spanning decades to centuries. It will
maximise the use of past, current and future earth observations (from in-situ and satellite
observing systems) in conjunction with modelling, supercomputing and networking
capabilities. This will produce a consistent, comprehensive and credible description of the
past, current and future climate.
8.4.6. Cryosphere climate observing systems73
As part of the global land service (see also Section 8.4.4.1) Copernicus is developing a set of
cryosphere products – snow extent, snow water equivalent and lake ice extent. In the period
from 2016-2020 these operations ae being brought online. These build on work in the ESA
GlobSnow and EC CryoLand and SEN3App projects.
73 Copernicus Global Land service. 2016. Services monitoring Earth systems. Available from:
http://workshop.copernicus.eu/sites/default/files/content/attachments/ajax/cryosphere_global_land.pdf [accessed on 20/07/2017].
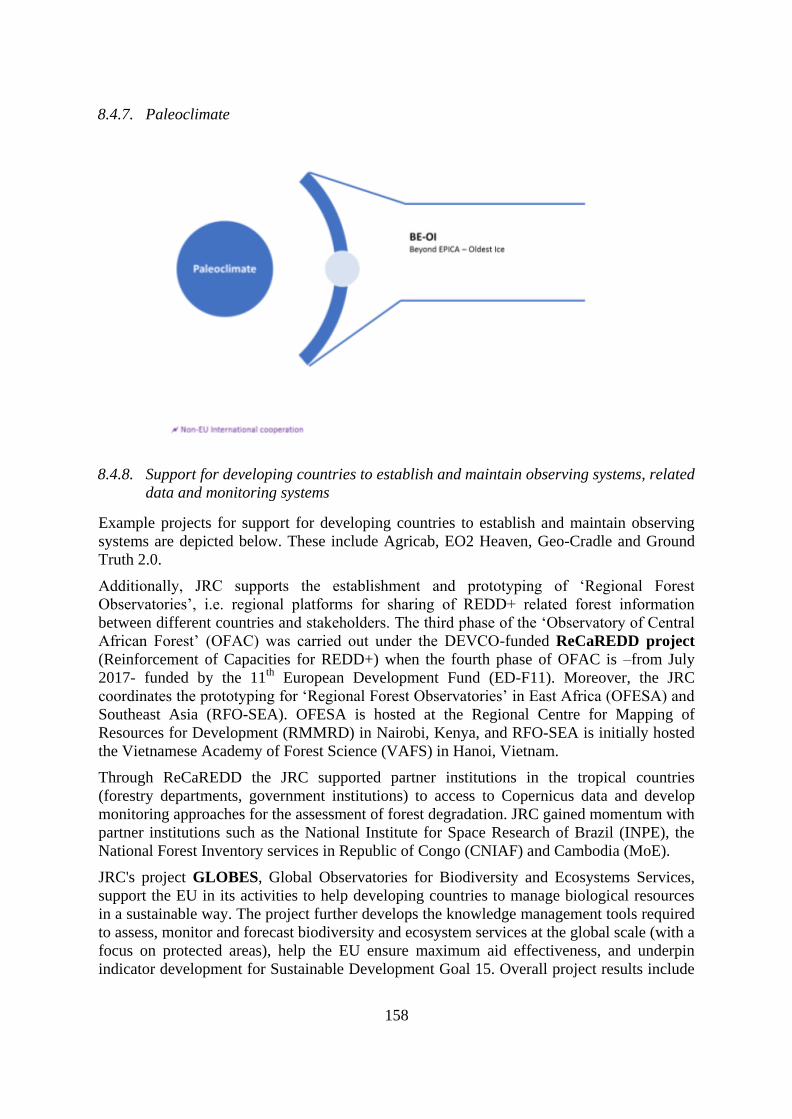
158
8.4.7. Paleoclimate
8.4.8. Support for developing countries to establish and maintain observing systems, related
data and monitoring systems
Example projects for support for developing countries to establish and maintain observing
systems are depicted below. These include Agricab, EO2 Heaven, Geo-Cradle and Ground
Truth 2.0.
Additionally, JRC supports the establishment and prototyping of ‘Regional Forest
Observatories’, i.e. regional platforms for sharing of REDD+ related forest information
between different countries and stakeholders. The third phase of the ‘Observatory of Central
African Forest’ (OFAC) was carried out under the DEVCO-funded ReCaREDD project
(Reinforcement of Capacities for REDD+) when the fourth phase of OFAC is –from July
2017- funded by the 11th
European Development Fund (ED-F11). Moreover, the JRC
coordinates the prototyping for ‘Regional Forest Observatories’ in East Africa (OFESA) and
Southeast Asia (RFO-SEA). OFESA is hosted at the Regional Centre for Mapping of
Resources for Development (RMMRD) in Nairobi, Kenya, and RFO-SEA is initially hosted
the Vietnamese Academy of Forest Science (VAFS) in Hanoi, Vietnam.
Through ReCaREDD the JRC supported partner institutions in the tropical countries
(forestry departments, government institutions) to access to Copernicus data and develop
monitoring approaches for the assessment of forest degradation. JRC gained momentum with
partner institutions such as the National Institute for Space Research of Brazil (INPE), the
National Forest Inventory services in Republic of Congo (CNIAF) and Cambodia (MoE).
JRC's project GLOBES, Global Observatories for Biodiversity and Ecosystems Services,
support the EU in its activities to help developing countries to manage biological resources
in a sustainable way. The project further develops the knowledge management tools required
to assess, monitor and forecast biodiversity and ecosystem services at the global scale (with a
focus on protected areas), help the EU ensure maximum aid effectiveness, and underpin
indicator development for Sustainable Development Goal 15. Overall project results include

159
the improvement of the baseline information sought by the EC and the UN Convention on
Biological Diversity to assess progress on key targets, and the increased support of JRC to
developing countries through capacity building and improved access to essential
information.
8.5. Research Infrastructures
Figure 8-3 gives an overview of the main areas for research infrastructure projects and the
sections where they are discussed in this national communication.

160
Figure 8-3 Overview of main areas of research infrastructure projects and section
numbers
8.5.1. Atmospheric research
Example project of research infrastructures for atmospheric research are depicted below.
JRC is partner of the project ACTRIS2, which aims at coordinating the European ground-
based network of stations equipped with advanced in-situ and remote sensing atmospheric
instrumentation for measuring aerosols, clouds and short-lived gaseous species. ACTRIS-2
has the essential role to ensure the production of comparable, quality assured and timely
open data to provide a robust scientific evidence for air quality and climate policies’ impact.

161
JRC supports smart climate change policymaking in the Commission, by establishing
greenhouse gas (GHG) emissions and their trends based on emission inventories,
atmospheric flux & concentration measurements and their linkage based on inverse
modelling. It relies on the EDGAR database for emission inventories, the ABC-IS station in
Ispra and the GHG flux measurement tower in San Rossore - both of the latter aim at being
part of the GHG monitoring network of ESFRI’s ICOS-Research Infrastructure. Inverse
modelling gives estimates of GHG emissions by combining top-down concentration
measurements and the bottom-up measurements in the EDGAR database, in order to verify
emissions reported to UNFCCC. The reductions in GHG and air pollutant emissions as a
result of past, current and future global policies and energy reforms are monitored, and their
impact on health and ecosystems is assessed.
8.5.2. Ocean and Marine research

162
8.5.3. Arctic research
8.5.4. Biodiversity

163
4. EDUCATION, TRAINING AND PUBLIC AWARENESS
Key Developments
The EU has been investing significant effort and resources into raising its citizens’
awareness of the challenges posed by climate change, but also the opportunities, in
particular as regards reducing GHG emissions. Actions in the field of education, public
information campaigns, communication activities, training, and awareness raising
campaigns, have all played an important role in this context. For instance, Erasmus+
education, Horizon 2020 science education and the Knowledge and Innovation
Communities of the European Institute of Innovation and Technology, in particular the
Climate (ClimateKIC) and Energy (InnoEnergy) ones, are notable education efforts; and the
EU Climate Diplomacy and EU Open Door days, are two key public information
campaigns.
In line with the guidelines on preparation of a national communication, the sections on
education, training and public awareness are:
Introduction and general policy toward education, training and public awareness
(Section 9.1);
Primary, secondary and higher education (Section 9.2);
Public information campaigns (Section 9.3 – 9.5);
Training programmes (Section 9.6);
Resource or information centres (Section 9.7);
Involvement of the public and non-governmental organisations (Section 9.8);
Participation in international activities (Section 9.9).
Introduction and general policy toward education, training and public 4.1.
awareness
This chapter on education, training and public awareness has been structured in order to be
as consistent as possible with the structure proposed by the UNFCCC reporting guidelines,
thus enhancing comparability with reports by other Parties and facilitating the task of the
expert review team.
The chapter focuses on key aspects related to education, training, public awareness and
support to developing country partners on matters related to Article 6 of the Convention
(Action for Climate Empowerment). In order to keep the chapter concise, only a brief
description of the most relevant activities is included. In most cases the internet address of
the activities is provided, thus facilitating access to additional information.
In the European Union, responsibility for education and training policy lies with Member
States. The EU’s role is to support the improvement of national systems through
complementary EU level tools, mutual learning, exchange of good practice and financial
support.
The Member States’ seventh National Communications report on education and training
activities at the national level. Nevertheless, the EU supports the Member States’ activities
164
under different programmes and actions. Therefore, the EU seventh National
Communication reports not only on public awareness activities, but also on education and
training activities at the EU level.
Primary, secondary and higher education 4.2.
Activities on primary, secondary and higher education comprise:
Education aspects of Erasmus; and
The Horizon 2020 programme call on science education.
These are presented in more detail in the following.
Erasmus+ – Education74
4.2.1.
The Erasmus+ programme merges seven former programmes and has opportunities for
education (this section) and training (Section 9.6) for a wide variety of people. Following on
from the earlier Erasmus programme, Erasmus+ helps organise student and doctoral
exchanges within programme countries and to and from a broad range of partner countries. It
is anticipated that there will be opportunities for about 2 million students from 2014 to 2020.
Students can study abroad for 3-12 months, with a maximum of 12 months in each study
cycle, e.g. Bachelor, Master and Doctoral or equivalents.
Horizon 2020 – science education75
4.2.2.
Making science education and careers attractive for young people is an ambitious goal, since
it targets a drastic improvement in science and technology literacy in our society. Within the
Horizon 2020 programme, the biggest EU research and innovation programme, a call has
been launched with the aim of making science education and careers more attractive for
young people.
Expected impacts of the call include developing scientific citizenship by promoting
innovative pedagogies in science education, attracting more young people towards science,
with a special emphasis on girls, and addressing the challenges faced by young people, in
pursuing careers in science, technology, engineering and innovation.
Climate KIC76
and InnoEnergy77
4.2.3.
Education is also provided through the EIT’s Knowledge and Innovation Communities:
Climate-KIC and InnoEnergy. These provide, for instance, a graduate school, professional
education and online courses. (See also section 8.2.1.5)
74 European Commission, Erasmus+, http://ec.europa.eu/programmes/erasmus-plus/node_en (webpage accessed 29-08-2017)
75 European Commission, Science Education, https://ec.europa.eu/programmes/horizon2020/en/h2020-section/science-education (webpage accessed 29-08-2017)
76 European Commission, Climate-KIC. http://www.climate-kic.org/ (webpage accessed 17-10-2017)
77 European Commission, EIT InnoEnergy, https://eit.europa.eu/eit-community/eit-innoenergy. (webpage accessed 17-10-2017)

165
Public information campaigns 4.3.
In addition to ongoing communication activities related to climate change and EU action to
address it, the European Commission has carried out several EU-wide public information
and awareness-raising campaigns that are of direct or indirect relevance to climate change.
Many of the campaigns make considerable use of the internet and social media tools, but all
also include opportunities for personal live interaction. The campaigns employ websites,
Facebook pages, Twitter feeds, video productions, seminars, workshops and other types of
live events.
Examples of activities and events undertaken during the reporting period include:
EU Climate Diplomacy Days;
EU Open Doors Day;
Covenant of Mayors for Climate and Energy;
EU Sustainable Energy Week;
Resource Efficiency Campaign;
EU Green Week;
European Business Awards for the Environment;
European Green Capital Award and European Green Leaf;
Our Planet, Our Future;
European Mobility Week.
EU Climate Diplomacy Days78
,79
,80
4.3.1.
The EU Climate Diplomacy Week is an annual event that EU Delegations around the world
have been organising since 2015. Through various events and activities, European Embassies
around the world highlight the positive action that is being taken around the globe in
collaboration with the EU and its Member States.
In June 2015, the first EU Climate Diplomacy Days engaged a range of stakeholders – from
the general public to the business community and civil society organisations – in various
events taking place in the context of the then upcoming COP21 conference in Paris.
In 2016, the EU Climate Diplomacy Week was held worldwide from 12-18 September and
focused on the Paris Agreement.
78 European External Action Service, European Climate Policy Day, 2015, https://eeas.europa.eu/headquarters/headquarters-homepage_en/2394/European Climate
Diplomacy Day (webpage accessed on 29-08-2017)
79 European Commission, Climate Diplomacy Week: maintaining the political momentum in support of climate action , 2016
https://ec.europa.eu/clima/news/articles/news_2016091201_en (webpage accessed on 29-08-2017)
80 European External Action Service, EU Climate Diplomacy Week, 2017, https://eeas.europa.eu/delegations/south-africa/28455/eu-climate-diplomacy-week-19-june-2-
july-2017_en, (webpage accessed on 29-08-2017)

166
The latest edition held in June/July 2017 focused on the implementation of the Paris
Agreement and the energy–climate nexus.
EU Open Doors Day81
,82
,83
4.3.2.
Europe Day, held on 9 May every year, celebrates peace and unity in Europe. The date
marks the anniversary of the historical 'Schuman declaration'. To celebrate Europe Day, EU
institutions open their doors in early May to the public, and local EU offices in Europe and
all over the world organise a variety of activities and events for all ages. Each year thousands
of people take part in visits, debates, concerts and other events to mark the day and raise
awareness about the EU.
In 2015, the interactive activities in the energy and climate area of the exhibition at the
European Commission in Brussels focused on the Paris Agreement and the EU's Energy
Union strategy.
In 2016, participants could help produce smart and clean energy to run the transport system,
heat the houses and light up the streets in a mock-up of a climate-friendly and energy-
efficient smart city of the future.
In 2017, the energy and climate stand gave participants the opportunity to turn their own
energy into sustainable energy on a power-generating dancefloor. In addition, through a quiz
participants could discover how to take climate action in their everyday life.
Covenant of Mayors for Climate and Energy84
4.3.3.
The Covenant of Mayors initiative encourages local and regional authorities to commit to
support the implementation of the EU's target to reduce greenhouse emissions by at least 40
% by 2030 and adopt an integrated approach to tackling mitigation and adaptation to climate
change. They do so by voluntarily developing Sustainable Energy Action Plans.
The Covenant was originally launched by the European Commission in 2008, and the new
integrated Covenant of Mayors for Climate and Energy was launched by the European
Commission in October 2015. By late April 2017, the covenant had been signed by 7 336
local and regional authorities with a combined population of over 229 million people. Of
these signatories, 669 are to the new Covenant of Mayors for Climate and Energy.
In 2016, the Covenant of Mayors for Climate and Energy and the Compact of
Mayors announced the Global Covenant of Mayors for Climate & Energy85
, a newly merged
initiative to bring these two efforts together.
81 European Union, Europe Day, https://europa.eu/european-union/about-eu/symbols/europe-day_en, (webpage accessed on 29-08-2017)
82 European Union, Open Doors Day of the European Commission 2017, http://ec.europa.eu/belgium/events/europe-day_en, (webpage accessed on 29-08-2017)
83 European Commission, Climate and Energy Stand 2017, http://ec.europa.eu/belgium/events/170506_ener_clima_en, (webpage accessed on 29-08-2017)
84 Covenant of Mayors for Climate and Energy, http://www.covenantofmayors.eu/index_en.html, (webpage accessed 29-08-2107)
85 Global Covenant of Mayors for Climate & Energy, Global Covenant of Mayors for Climate & Energy (webpage accesses 18-10-2017)
167
EU Sustainable Energy Week86
4.3.4.
The EU Sustainable Energy Week (EUSEW) is a month-long series of activities to build a
secure energy future for Europe. It brings together public authorities, private companies,
NGOs and consumers to promote initiatives to save energy and move towards renewables for
clean, secure and efficient power.
Launched in 2006 by the European Commission, the EUSEW is organised by the Executive
Agency for Small and Medium-sized Enterprises (EASME) in close cooperation with the
European Commission's Directorate-General for Energy.
Events include a conference and associated networking, awards and Energy Days. The
awards are in four jury-assessed categories: Consumers, Public Sector, Businesses and,
introduced in 2017, Energy Islands. All finalists also compete for the Citizens’ prize, with
the winner chosen by a public online vote. Energy Days are organised by local public and
private organisations to engage citizens and energy stakeholders in building the Energy
Union.
Resource Efficiency Campaign87
4.3.5.
The European Commission’s Generation Awake campaign concluded in 2015 after four
years of engaging Europeans with upbeat messages on how to become more sustainable
consumers and save natural resources. The campaign won a media industry award for its
interactive house website and videos, which were viewed 10 million times. 140 000 people
joined the Generation Awake Facebook group and over 2 000 media articles were published
about the campaign.
The campaign reached out to 25- to 40-year-olds, with a focus on young urban adults
(identified as most open and receptive to environmental behavioural change) and families
with small children (the biggest consumers but who are also keen to work towards a better
quality of life for their families).
At the end of the campaign, the Commission organised an evaluation by independent
consultants, who conducted an online survey, focus groups, expert interviews, including with
behavioural scientists, and an online review. According to the report, Generation Awake
succeeded in making the topic accessible to a wide audience. The videos were highly
appreciated, as were the tone and tools used on the website. The conclusion was that
Generation Awake raised awareness about resource efficiency as far as “can be expected for
campaigns of this scale”. The campaign reached 6 % of the EU population, i.e.
approximately 30 million people – an impressive share of the potential target audience.
86 European Commission, Sustainable Energy Week, http://www.eusew.eu/about-sustainable-energy-week, (webpage accessed 29-08-2107)
87 European Commission, Waking up to resource efficiency, 2015, https://ec.europa.eu/environment/efe/themes/resource-efficiency/waking-resource-efficiency_en,
(webpage accessed 29-08-2107)

168
EU Green Week88
4.3.6.
The European Commission’s Green Week is the biggest annual conference on European
environment policy. It is open to the public and participation is free of charge.
Green Week offers a unique opportunity for debate and exchanges of experiences and best
practice. Over the past decade, the conference has established itself as an unmissable event
for anyone involved with protecting the environment.
The themes of Green Week over recent years have been:
2011 – Resource efficiency: using less, living better
2012 – Every drop counts: the water challenge
2013 – Cleaner air for all
2014 – Circular economy – saving resources, creating jobs
2015 – Nature, our health, our wealth
2016 – Investing for a greener future
2017 – Green jobs for a greener future.
European Business Awards for the Environment89
4.3.7.
The European Business Awards for the Environment (EBAE) celebrate those companies at
the forefront of eco-innovation, or that have a respect for the environment at the very core of
their business principles.
The awards are held every second year (currently the 2016-2017 cycle), and winners are
recognised in the following five categories: management, product and services, process
innovation, and international business cooperation, and business and biodiversity.
European Green Capital Award and European Green Leaf Award90
4.3.8.
Europe is an urban society that faces many environmental challenges. The European
Commission has long recognised the important role that local authorities play in improving
the environment.
The European Green Capital Award has been conceived as an initiative to promote and
reward these efforts.
The award aims to provide an incentive for cities to inspire each other and share best
practices, while at the same time engaging in friendly competition. In other words, the cities
become role models for each other.
88 European Commission, EU Green Week, 2017, http://www.eugreenweek.eu/, (webpage accessed 29-08-2107)
89 European Commission, European Business Awards for the Environment, http://ec.europa.eu/environment/awards/index.html, (webpage accessed 29-08-2107)
90 European Commission, European Green Capital, http://ec.europa.eu/environment/europeangreencapital/index_en.htm, (webpage accessed 29-08-2107)
169
Starting in 2010, one European city has been awarded the title of European Green Capital
each year. The award is given to a city that:
Has a consistent record of achieving high environmental standards;
Is committed to ongoing and ambitious goals for further environmental improvement
and sustainable development; and
Can act as a role model to inspire other cities and promote best practices to all other
European cities.
The winners to date are Stockholm (Sweden) 2010, Hamburg (Germany) 2011, Vitoria-
Gasteiz (Spain) 2012, Nantes (France) 2013. Copenhagen (Denmark) 2014, Bristol (United
Kingdom) 2015, Llubljana (Slovenia) 2016, Essen (Germany) 2017, and Nijmegen (The
Netherlands) for 2018.
Following the success of the European Green Capital Award, the European Green Leaf
Award was introduced as a competition aimed at cities and towns across Europe, with
between 20,000 and 100,000 inhabitants. This Award recognises commitment to better
environmental outcomes, with a particular accent on efforts that generate green growth and
new jobs. The objectives of the European Green Leaf Award are:
To recognise cities that demonstrate a good environmental record and commitment to
generating green growth;
To encourage cities to actively develop citizens’ environmental awareness and
involvement;
To identify cities able to act as a ‘green ambassador’ and to encourage other cities to
progress towards better sustainability outcomes.
This is presented in conjunction with the European Green Capital Award. The inaugural
winners in 2015 were Mollet del Vallès (Spain) and Torres Vedras (Portugal), followed by
Galway (Ireland) in 2017 and Leuven (Belgium) and Växjö (Sweden) for 2018.
Our planet, our future91
4.3.9.
In 2015, in advance of the COP21 discussions in Paris, the European Commission's
Directorate-General for Climate Action produced a magazine aimed at 11–16 year olds,
entitled “Our planet, our future: Fighting climate change together”. The publication includes
information on the science of climate change, how the EU is taking action to reduce
greenhouse gas emissions and adapt to climate change, and how everyone can contribute to
fighting climate change in their everyday lives. The magazine is available in all EU
languages and through a number of websites for educational resources. A new version of the
magazine will be available in late 2017.
91 European Commission, Youth & Climate, 2017, https://ec.europa.eu/clima/citizens/youth_en, (webpage accessed 29-08-2107)
170
European Mobility Week92
,93
4.3.10.
European Mobility Week is an annual campaign on sustainable urban mobility organised
with the political and financial support of the Directorates-General for the Environment and
Transport of the European Commission. The campaign, which runs from 16 to 22
September every year, encourages local authorities to organize activities for citizens based
on a focal theme for each year, and to launch and promote permanent measures that support
the theme.
Recent themes have included “Choose. Change. Combine” on multimodality in 2015,
"Smart and sustainable mobility" in 2016 and “Sharing gets you further” on sharing
transport, including through the use of apps and online platforms, in 2017.
Since its introduction in 2002, the impact of European Mobility Week has steadily grown,
both across Europe and around the world. In recent years, the campaign has spread to
countries outside the EU, including Argentina, Belarus, Japan, Kazakhstan, Mali and
Mexico.
In 2016, a record of 2 427 cities from 51 countries in the EU and beyond took part in
European Mobility Week. In 2016, 7 386 measures were implemented, these being in 1 229
cities that declared they had implemented at least one measure. These mainly focus on
mobility management, such as launching awareness-raising campaigns; accessibility, such
as creating wheelchair ramps; and new or improved bicycle facilities.
European Mobility Week is promoted using its website and by social media. All these
modes showed increased usage in 2016 compared with 2015. For example, the Facebook
account has 11 922 followers, an increase of 36 % on 2015.
Monitoring public opinion 4.4.
Eurobarometer results on climate change (2017)94 4.4.1.
Following on from EU-wide surveys of public attitudes to climate change in 2009 and 2011
reported in the 6NC, further surveys have been carried out in 201395
, 201596
and 2017.
The most recent Eurobarometer survey on climate change was carried out in 2017, with
27 901 EU citizens from different social and demographic groups interviewed face-to-face in
their mother tongue.
The results show that climate change remains a key concern for the European public, with
around three-quarters of respondents (74 %) seeing it as a very serious problem – up from
92 European Mobility Week, 16-22 September 2017, http://www.mobilityweek.eu/home/, (webpage accessed 29-08-2107)
93 European Mobility Week, 16-22 September 2016, Participation Report, http://mobilityweek.eu/fileadmin/user_upload/materials/participation_resources/
2016/2016_EMW_Participation_Report.pdf, (webpage accessed 29-08-2107)
94 European Commission, Special Eurobarometer 459 Climate Change, September 2017, https://ec.europa.eu/clima/sites/clima/files/support/docs/report_2017_en.pdf
95 European Commission, Special Eurobarometer 409 Climate Change, March 2014, (Fieldwork in 2013)
http://ec.europa.eu/commfrontoffice/publicopinion/index.cfm/Survey/getSurveyDetail/search/climate%20change/surveyKy/1084 (webpage accessed 02-10-2017)
96 European Commission, Special Eurobarometer 435 Climate Change, November 2015,
http://ec.europa.eu/commfrontoffice/publicopinion/index.cfm/Survey/getSurveyDetail/search/climate%20change/surveyKy/2060 (webpage accessed 02-10-2017)
171
69 % in the previous survey in 2015 – and over nine in ten (92 %) considering it a serious
problem.
Climate change is seen by EU citizens as the third single most serious global problem,
behind poverty/hunger/lack of drinking water and international terrorism. Nine in ten
respondents (90 %) also take personal action to tackle climate change, the most common
action being trying to reduce waste and regularly separating it for recycling (71 %).
The results also indicate that nearly four in five Europeans (79 %) believe that fighting
climate change and using energy more efficiently can boost the EU economy and jobs, while
the same proportion think that more public financial support should be given to the transition
to clean energies even if this means reducing fossil fuel subsidies.
Nearly two-thirds of respondents agree that reducing fossil fuel imports from third countries
can benefit the EU economically and increase the security of EU energy supplies (65 % and
64 % respectively). Almost nine in ten also believe it is important for their national
government to set targets to increase renewable energy use by 2030 and provide support for
improving energy efficiency by 2030 (89 % and 88 % respectively).
Eurobarometer results on environment (for 2014) 97
,98
4.4.2.
A Eurobarometer survey in the related area of attitudes towards the environment was
undertaken in 2014, based on face to face interviews with 27 988 respondents.
When asked how important the environment is to them personally, the view of Europeans is
overwhelmingly positive with 95 % of respondents considering it to be important.
Although this survey focussed on issues other than climate change, when asked about actions
taken towards protecting the environment, the actions listed also relate to climate change, the
top four being: separated most of waste for recycling; cut down energy consumption; cut
down on water consumption and chosen a more environmentally way of travelling. Over six
out of ten respondents (62 %) feel well informed about environmental issues.
Communication activities 4.5.
Web and social media 4.5.1.
Table 9-1 below lists examples of climate change related websites and social media many of
which are in addition to those identified elsewhere in this chapter.
Table 9-1 Websites and social media
Title Address
EU Climate Action website and social https://ec.europa.eu/clima/
97 There is a lot more in the survey, but most of it is to do with general environmental issues rather than those associated with climate change
98 European Commission, Attitudes of European Citizens Towards the Environment, 2014, http://ec.europa.eu/public_opinion/archives/ebs/ebs_416_sum_en.pdf,
(webpage accessed 29-08-2107)
172
media channels (European
Commission's Directorate-General for
Climate Action)
https://www.facebook.com/EUClimateAction
https://twitter.com/EUClimateAction
https://www.youtube.com/user/EUClimateAction
European Commission's political
priorities – Energy Union and climate
https://ec.europa.eu/commission/priorities/energy-union-
and-climate_en
Miguel Arias Cañete, European
Commissioner for Climate Action and
Energy
https://ec.europa.eu/commission/commissioners/2014-
2019/arias-canete_en
European Climate Adaptation
Platform
http://climate-adapt.eea.europa.eu/
Covenant of Mayors for Climate &
Energy
http://www.covenantofmayors.eu/index_en.html
Climate-related webpages of other
departments of the European
Commission
Agriculture and rural development – Agriculture and
climate change
Energy
Environment
Internal market, industry, entrepreneurship and SMEs –
Sustainability and circular economy
International cooperation and development – Climate
change, disaster risk reduction and desertification
Mobility and transport – Clean transport
Regional policy – Low-carbon economy
Research and innovation – Climate action and resource
efficiency
Trade - Sustainable development
Joint Research Centre – Environment and climate change
European Environment Agency https://www.eea.europa.eu/themes/climate-change-
adaptation
https://www.eea.europa.eu/themes/climate
https://twitter.com/EUEnvironment
https://www.facebook.com/European.Environment.Agency/
Publications 4.5.2.
The European Commission has published a range of brochures, factsheets, reports and other
publications related to climate change and EU action. A list of publications is available
online on the EU Climate Action website99
.
The European Environment Agency also publishes regular assessments on climate change
mitigation and adaption, including the annual report on trends and projections on greenhouse
99 European Commission, Climate Action, Publications, https://ec.europa.eu/clima/publications_en (webpage accessed 02-10-2017)
173
gas emissions, energy efficiency and renewable energy in the EU100
. The EEA has also
published a comprehensive assessment on climate change impacts and vulnerability in
Europe101
as well as an EEA briefing on climate finance102
. These publications are
complemented by EEA Signals, aimed at raising public awareness environmental and
climate issues. To this end, Signals is translated to more than 12 European languages to
enhance its outreach. Signals 2015103
focused mainly on climate change, while 2016104
and
2017105
focused on mobility and energy, respectively, both of which emphasised the links
between these sectors and climate change. The complete list of EEA publications on climate
change is available on the EEA website106
.
Video productions 4.5.3.
The European Commission has published a range of multilingual videos related to climate
change and EU action. The European Environment Agency also produced short videos and
animations on climate change targeting the wider public.
The videos are available online at: https://www.youtube.com/user/EUClimateAction
Table 9-2 Examples of videos from the European Commission and European
Environment Agency
Title Address
Videos produced by the European Commission
Paris Agreement – the world unites to
fight climate change
https://www.youtube.com/watch?v=5Tf5Hxa_dKs
Causes and consequences of climate
change
https://www.youtube.com/watch?v=oyiNyWQeysI
EU climate action https://www.youtube.com/watch?v=yFq5p2l0Q2o&t=3s
EU funding for climate action https://www.youtube.com/watch?v=MIZvHNiduBk
EU adaptation to climate change https://www.youtube.com/watch?v=PNpQVrwS68w
100 European Environment Agency, Trends and projections in Europe 2016 – Tracking progress towards Europe’s climate and energy targets,
https://www.eea.europa.eu/publications/trends-and-projections-in-europe (webpage accessed 02-10-2017)
101 European Environment Agency, Climate change, impacts and vulnerability in Europe 2016, EEA report 1/2017, https://www.eea.europa.eu/publications/climate-
change-impacts-and-vulnerability-2016 (webpage accessed 02-10-2017)
102 European Environment Agency, Financing Europe’s low carbon, climate resilient future, July 2017, https://www.eea.europa.eu/themes/climate/financing-europe2019s-
low-carbon-climate/financing-europes-low-carbon-climate (webpage accessed 02-10-2017)
103 European Environment Agency, EEA Signals 2015 – Living in a changing climate, June 2015, https://www.eea.europa.eu/publications/signals-2015 (webpage
accessed 02-10-2017)
104 European Environment Agency, Signals 2016 – Towards clean and smart mobility, June 2016, https://www.eea.europa.eu/publications/signals-2016 (webpage accessed
02-10-2017)
105 European Environment Agency, Signals 2017 – Shaping the future of energy in Europe: Clean, smart and renewable August 2017,
https://www.eea.europa.eu/publications/signals-2017 (webpage accessed 02-10-2017)
106 European Environment Agency, Publications, https://www.eea.europa.eu/publications#c14=&c12=&c7=en&c11=5&b_start=0 (Select ‘climate change adaptation’ and
‘climate change mitigation’ under available topics. Webpage accessed 02-10-2017)

174
Title Address
EU financing climate action in
developing countries
https://www.youtube.com/watch?v=L5nKMI8vl1A&t=129s
Videos produced by the European Environment Agency
Climate change impacts in Europe https://www.youtube.com/watch?v=jS0ZIUtsQHg
Climate change adaptation in cities https://www.youtube.com/watch?v=nMzpKpY_Kvk
Are we ready for climate change? https://www.youtube.com/watch?v=yX9UqBGjCkQ
Side events at international climate conferences 4.5.4.
During the annual UNFCCC climate conferences, the EU Pavilion hosts a series of side-
events focused on a range of climate-related themes.
As an example, at COP22 in 2016, 102 official side-events took place at the EU Pavilion,
aimed at stimulating the debate on key thematic areas, engaging observers and facilitating
dialogue with party delegates and other participants.
Training 4.6.
The EU programmes that are most relevant to training on climate change are:
Training aspects of Erasmus+;
ManagEnergy.
These are presented in more detail in the following.
Erasmus+ – Training107
4.6.1.
The Erasmus+ programme offers a broad range of opportunities for training, including
training of relevance to climate action:
For teachers to teach in an educational institute abroad;
For staff in education – both teaching and non-teaching – to train abroad;
For a range of students, apprentices and graduates to gain experience in the
workplace in traineeships abroad.
Over the period from 2014 to 2020, it is anticipated that the programme will provide
opportunities for about 800 000 lecturers, teachers, trainers, education staff and youth
workers and for about 650 000 vocational education and training students.
107 Erasmus Plus, https://www.erasmusplus.org.uk/, (webpage accessed 29-08-2017)

175
ManagEnergy108
4.6.2.
Launched in 2002, ManagEnergy is a technical support initiative financed under the
Intelligent Energy - Europe programme and managed by the European Commission’s
Executive Agency for SMEs (EASME). It supports local and regional energy actions in the
fields of energy efficiency and renewable energy. Its main target groups include local and
regional public authorities, energy agencies and other organisations.
ManagEnergy offers a wide range of tools and facilities, which aim at enabling best practice
sharing, ensuring capacity building and improving networking among energy actors across
Europe.
Over the past 3 years ManagEnergy organised 45 capacity building workshops in different
Member States and 33 networking events, in which stakeholders involved met and interacted
at the European level.
A new ManagEnergy initiative is starting in June 2017 and will organise Master classes and
peer-to-peer coaching to raise the skills of local and regional energy agencies in energy
efficiency, financing and project development.
Resource or information centres 4.7.
It is the EU’s policy to make all relevant information publicly available. For a list of
publications and websites, please refer to Sections 9.5.1 and 9.5.2 above.
Involvement of the public and non-governmental organisations 4.8.
EU law requires extensive engagement and consultation of stakeholders during the policy-
making process. The following examples illustrate stakeholder engagement and
consultation in the process of formulating EU policies. These policy initiatives were
preceded by wide-ranging consultation and benefited from a broad spectrum of scientific
and policy expertise.
Consultation on revision to the EU Emission Trading System Directive109
4.8.1.
The European Commission presented in July 2015 a legislative proposal to revise the EU
emissions trading system (EU ETS) for the period after 2020. Stakeholders were involved at
various stages in the development of this proposal.
Extensive consultations were carried out in 2014, including stakeholder events and written
consultations. The consultation on the revision of the EU ETS received more than 500
contributions, of which 6 % were from citizens and NGOs. Following these consultations
and the analysis of EU climate policy targets for 2030, the Commission carried out an impact
assessment.
108 European Commission, Executive Agency for SMEs, ManagEnergy, https://ec.europa.eu/easme/en/managenergy, (webpage accessed on 29-08-2017)
109 European Commission, Revision for Phase 4 (2021-2030) of the EU ETS, https://ec.europa.eu/clima/policies/ets/revision_en, (webpage accessed on 29-08-2017)
176
The public also had the possibility to provide feedback on the legislative proposal after it
was adopted by the European Commission. Feedback was received from 85 stakeholders and
a summary was presented to the European Parliament and the Council.
Public consultation on the preparation of a legislative proposal on the effort of 4.8.2.
Member States to reduce their greenhouse gas emissions to meet the European
Union's greenhouse gas emission reduction commitment in a 2030 perspective110
In July 2016, the European Commission presented a legislative proposal, the "Effort
Sharing Regulation", setting out binding annual greenhouse gas emission targets for
Member States for the period 2021–2030. These targets cover sectors of the economy that
fall outside the scope of the EU ETS.
In advance of presenting the proposal stakeholders were involved at various stages in its
development, for example through written consultations on the 2030 climate and energy
framework and on the preparation of the legislative proposal (114 responses, of which 22 %
were from citizens and NGOs).
International cooperation on education, training and public awareness 4.9.
Doha Work Programme on Article 6 of the Convention 4.9.1.
The European Union contributed actively to the intermediate review of the Doha Work
Programme on Article 6 of the Convention (education, training and public awareness). This
was carried out through written submissions and active EU participation in Article 6
discussions.
The report on progress in implementing the Doha work programme111
included reference to
the EU-wide communications campaign “A world like you, With a climate you like” as an
example of an activity on public awareness. The Climate-ADAPT online platform was
referred to as an example of providing public access to information.
The EU also provided funding to the UNFCCC Secretariat for Article 6 activities.
Article 6-related international cooperation activities 4.9.2.
The EU has been actively supporting a number of activities to implement Article 6 in
developing countries and other third countries. More specific details about the EU’s
international cooperation on climate change are provided in the respective sections. Below
is a list of examples of EU-supported activities relating to education, training and public
awareness in third countries.
110 European Commission, Proposal for an Effort Sharing Regulation 2021-2030, https://ec.europa.eu/clima/policies/effort/proposal_en, (webpage accessed on 29-08-
2017)
111 UNFCCC, Review of the Doha Work Programme on Article 6 of the Convention, http://unfccc.int/resource/docs/2016/sbi/eng/06.pdf, (webpage accessed on 29-08-
2017)

177
Global Climate Change Alliance (GCCA)112
4.9.2.1.
The GCCA was launched by the European Commission in 2007 to strengthen dialogue and
cooperation on climate change between the EU and the most vulnerable developing
countries, particularly least developed countries and small island developing states (for more
information on the GCCA see the chapter on international cooperation on adaptation). It
started its work in just four pilot countries. Today it has a budget of more than € 300 million
and is one of the most significant climate initiatives in the world. It supports 51 programmes
around the world and is active in 38 countries, eight regions and sub-regions and at the
global level.
In 2014, a new phase of the GCCA, the GCCA+ flagship initiative, began in line with the
European Commission’s new Multiannual Financial Framework (2014-2020).
The GCCA+ aim is to boost the efficiency of its response to the needs of vulnerable
countries and groups. Using ambitious and innovative approaches, it will achieve its goals
by: serving as a platform for dialogue and exchange of experience; and by acting as a source
of technical and financial support for the world’s most climate-vulnerable countries.
World Bank Partnership for Market Readiness (PMR) 113
and International 4.9.2.2.
Carbon Action Partnership (ICAP)114
The PMR is a forum for collective innovation and action and a fund to support capacity
building to scale up climate change mitigation using markets and carbon pricing. The PMR
links 19 implementing country participants – middle income countries that receive funding
and technical support – and 13 contributing participants – that contribute funding and share
relevant experience. Following an initial contribution to the PMR, for the 2011-2016 period
of € 5 million, an additional contribution of € 10 million has been agreed115
, for capacity
building in developing countries, including the organisation of training workshops to help
countries build expertise in market mechanisms.
The European Commission is a founding member of the International Carbon Action
Partnership (ICAP), which brings together countries and regions with mandatory cap-and-
trade systems. The ICAP provides a forum for sharing experience and knowledge and
organises regular training courses.
Group on Earth Observations (GEO) Capacity Building116
,117
4.9.2.3.
The Group on Earth Observations is coordinating efforts to build a Global Earth
Observation System of Systems, or GEOSS and aims at, among other objectives,
developing capacity-building activities in the domain of earth observation, providing
112 Global Climate Change Alliance, http://www.gcca.eu/, (webpage accessed on 29-08-2017)
113 World Bank, The Partnership for Market Readiness, https://www.thepmr.org/, (webpage accessed on 29-08-2017)
114 International Carbon Action Partnership, https://icapcarbonaction.com/en/, (webpage accessed on 29-08-2017)
115 European Commission, Additional contributions to PMR
http://www.europarl.europa.eu/RegData/docs_autres_institutions/commission_europeenne/comitologie/ros/2012/D024151-03/COM-AC_DR(2012)D024151-
03(ANN7)_EN.pdf, (webpage accessed on 29-8-2017)
116 Group on Earth Observations, Capacity Building, http://www.earthobservations.org/cb.php, (webpage accessed on 29-08-2017)
117 GeoCab, Earth Observation Capacity Building Portal, http://www.geocab.org/, (webpage accessed on 29-08-2017)

178
support to international research initiatives in which Europe would contribute to the
development of observing systems.
Several past and on-going projects throughout the GEO Work Plan have collected or are
collecting information about capacity building resources118
(i.e. stakeholder contacts,
description of initiatives and activities, training material etc.) on different geographical areas
and about different topics. The Global Earth Observations Capacity Building (GEOCAB)
Portal aims to capture capacity development material and make them easily accessible.
Efforts including by the GEO Secretariat and European Union FP7 projects GeoNetCab,
EOPOWER and IASON have started to identify capacity development opportunities and
materials from outside the GEO community and these are made accessible through the
GEOCAB portal.
Mission Innovation119 4.9.2.4.
Mission Innovation (MI) is a global initiative of 22 countries and the European Union to
dramatically accelerate global clean energy innovation. Participating countries have
committed to seek to double their governments’ clean energy research and development
(R&D) investments over five years, while encouraging greater levels of private sector
investment in transformative clean energy technologies.
The Commission, on behalf of the EU has a leading role within the global Mission
Innovation initiative. It leads the Converting Sunlight Innovation Challenge to create
storable solar fuels and the Affordable Heating and Cooling of Buildings Innovation
Challenge, and takes an active part in the remaining innovation challenges. These challenges
are aimed at catalyzing our global research efforts in areas that could provide significant
benefits in reducing greenhouse gas emissions, increasing energy security, and creating new
opportunities for clean economic growth. By doing so, MI members aim to encourage
increased engagement from the global research community, industry, and investors, while
also providing opportunities for new collaborations between MI members.
118 European Commission, Capacity Building For GEOSS: European Contributions to capacity building activities in GEO, 2014,
http://www.earthobservations.org/documents/cb/2014_Capacity_Building_For_GEOSS_by_EC.pdf, (webpage accessed on 29-08-2017)
119 http://mission-innovation.net/about/

179
5. LIST OF ABBREVIATIONS
Abbreviation Description
1BR First Biennial Report
2BR Second Biennial Report
3BR Third Biennial Report
6NC 6th National Communication
7NC Seventh National Communication
AAU Assigned amount unit
AR4 Fourth Assessment Report
AR5 Fifth Assessment Report
BR Biennial Report
C3S Copernicus Climate Change Service
CAMS Copernicus Atmosphere Monitoring Service
CAP Common Agricultural Policy
CB Capacity Building
CCS Carbon Capture and storage
CDM Clean Development Mechanism
CEOS Committee on Earth Observation Satellites
CER Certified emission reduction
CETA EU-Canada Comprehensive Economic and Trade Agreement
CFP Common Fisheries Policy
CH4 Methane
CMEMS Copernicus Marine Environment Monitoring Service
CO2 Carbon dioxide
CO2e Carbon dioxide equivalent
CoM Covenant of Mayors
COP21 21st Conference of the Parties
CP1 First commitment period
CP2 Second commitment period
CRF Common Reporting Format
CTF Common tabular format
DCI Development Cooperation Instrument
DG Directorate-General
DG RTD Directorate-General for Research and Innovation
DRR Disaster Risk Reduction
DRR Disaster Risk Reduction
E3P European Energy Efficiency Platform
EAFRD European Agricultural Fund for Rural Development
EAP Environmental Action Programme
EASME Executive Agency for SMEs
ECCP II The Second European Climate Change Programme
ECMWF European Centre for Medium range Weather Forecasting
ECU European Currency Unit

180
ECVs Atmospheric, Oceanic and Terrestrial Essential Climate Variables
EDF European Development Fund
EEA European Environment Agency
EEEF European Energy Efficiency Fund
EIB European Investment Bank
EIONET European Environment Information and Observation Network
EIT European Institute of Innovation & Technology
ERA European Research Area
ERC European Research Council
ERDF European Regional Development Fund
ERU emission reduction unit
ESA European Space Agency
ESD Effort Sharing Decision
ESIF European Structural and Investment Funds
ETC/ACM European Topic Centre on Air Pollution and Climate Change Mitigation
EU European union
EU ETS EU Emission Trading System
EU NIR 2017 EU national inventory report, as submitted to the UNFCCC in 2017
EU-15 Austria, Belgium, Denmark, Finland, France, Germany, Greece, Ireland, Italy, Luxembourg,
Netherlands, Portugal, Spain, Sweden and United Kingdom
EU-27 EU-15 plus Bulgaria, Cyprus, Czech Republic, Estonia, Hungary, Latvia, Lithuania, Malta,
Poland, Romania, Slovakia and Slovenia
EU-28 28 Member States of the European Union. EU-27, plus Croatia
EUFIWACC The European Financing Institutions Working Group on Adaptation to Climate Change
EUMETSAT European Organisation for the Exploitation of Meteorological Satellites
EUR Euro
EUSEW EU Sustainable Energy Week
FACCE-JPI Joint Programming Initiative on Agriculture, Food Security and Climate Change
FET Future and Emerging Technologies
F-gases Fluorinated greenhouse gases
FP7 EU’s Seventh Framework Programme for Research and Technological Development
FRL forest reference levels
GAEC Good agricultural and environmental conditions
GCCA+ Global Climate Change Alliance Plus
GCOS Global Climate Observing System
GCOS Global Climate Observing System
GDP Gross Domestic Product
GEO Group on Earth Observation
GEOCAB Global Earth Observations Capacity Building
GEOSS Global Earth Observation System of Systems
GHG Greenhouse Gas
GVA Gross Value Added
GWP Global Warming Potential
HFCs Hydrofluorocarbons

181
ICAP International Carbon Action Partnership
IED Industrial Emissions Directive
IPCC Intergovernmental Panel on Climate Change
ISL Iceland
ITL Independent Transaction Log
JPI Joint Programming Initiatives
JRC Joint Research Centre
JU The 'Fuel Cells and Hydrogen Joint Undertaking'
KIC Knowledge and Innovation Communities
Km Kilometre
KP Kyoto Protocol
LCER Long-term certified emission reduction
LDCs Least Developed Countries
LECB Low Emission Capacity Building Programme
LIFE EU financial instrument for the Environment (French: L’Instrument Financier pour
l’Environnement)
LULUCF Land Use, Land-Use Change and Forestry
M&E Monitoring and evaluation
MAC Mobile Air Conditioning Systems
MACC-III Monitoring Atmospheric Composition and Climate - Interim Implementation
MMR Monitoring Mechanism Regulation
MRS Macro-regional strategy
MS Member State
MSCA Marie Sklodowska-Curie Action
Mt Megatonnes
N2O Nitrous Oxide
NAP National Adaptation Plan
NAS National Adaptation Strategy
NC National Communication
NCFF Natural Capital Financing Facility
NDC Nationally Determined Contribution
NGO Non-Government Organisation
NIR National Inventory Report
NOAA National Oceanographic and Atmospheric Administration
PaMs Policies and measures
PDA Project Development Assistance
PFCs Perfluorocarbons
PMR World Bank Partnership for Market Readiness
PPS Purchasing power standards
QA/QC Quality Assurance / Quality Control
R&I Research and innovation
REA Research Executive Agency
REFIT The Regulatory Fitness and Performance programme
RES Renewable Energy Sources
182
RMU Removal unit
RSO Research and Systematic Observations
S&T scientific and technological
SAR Second Assessment Report
SDGs Sustainable Development Goals
SDS Sustainable Development Strategy
SETIS Strategic Energy Technologies Information System
SET Plan Strategic Energy Technology Plan
SF6 Sulphur Hexafluoride
SFIC Strategic Forum for International Science and Technology Cooperation
SHERPA Screening for High Emission Reduction Potential on Air
SITC Standard International Trade Classification
SLR Sea Level Rise
SMEs Small-Medium Enterprises
SRIA Strategic Research and Innovation Agenda
SWD Staff Working Document
tCER Temporary certified emission reduction
TFEU Treaty on the Functioning of the European Union
toe Tonnes of Oil Equivalent
TWh Terawatt hour
UAA Utilised agricultural area
UHI Urban heat island
UN United Nations
UNFCCC United Nations Framework Convention on Climate Change and the Kyoto Protocol
USD US Dollars
WAM With Additional Measures
WEM With Existing Measures
WOM Without Measures
WRI World Resource Institute

183
APPENDIX I: SUMMARY OF THE REPORTING ON SUPPLEMENTARY INFORMATION UNDER
ARTICLE 7.2 OF THE KYOTO PROTOCOL
The table shows a summary of the reporting on supplementary information under Article 7.2
of the Kyoto Protocol, and cross references the reporting requirement to the respective
section of this Communication.
Information reported under Article 7 paragraph 2 National Communication section(s)
National systems in accordance with Article
5, paragraph 1 3.3
National registry 3.4
Supplementarity relating to the mechanisms
pursuant to Articles 6, 12 and 17 4.5.4.1, 4.5.4.2
Policies and measures in accordance with
Article 2 4.5.4.3
Domestic and regional programmes and/or
legislative arrangements and enforcement
and administrative procedures
4.5.3
Information under Article 10
Article 10, para. a (efforts to improve
emissions inventories) 3.3
Article 10, para. b (policy action on
mitigation AND adaptation measures) 4.4, 6.4
Article 10, para. c (Activities related
to transfer of technology) 7.6
Article 10, para. d (Activities related to
systematic observation) 8.2
Article 10 para. e (Activities related to
international education and training, and
national level public awareness)
9.3, 9.9
Financial resources 7.2, 7.3, 7.4
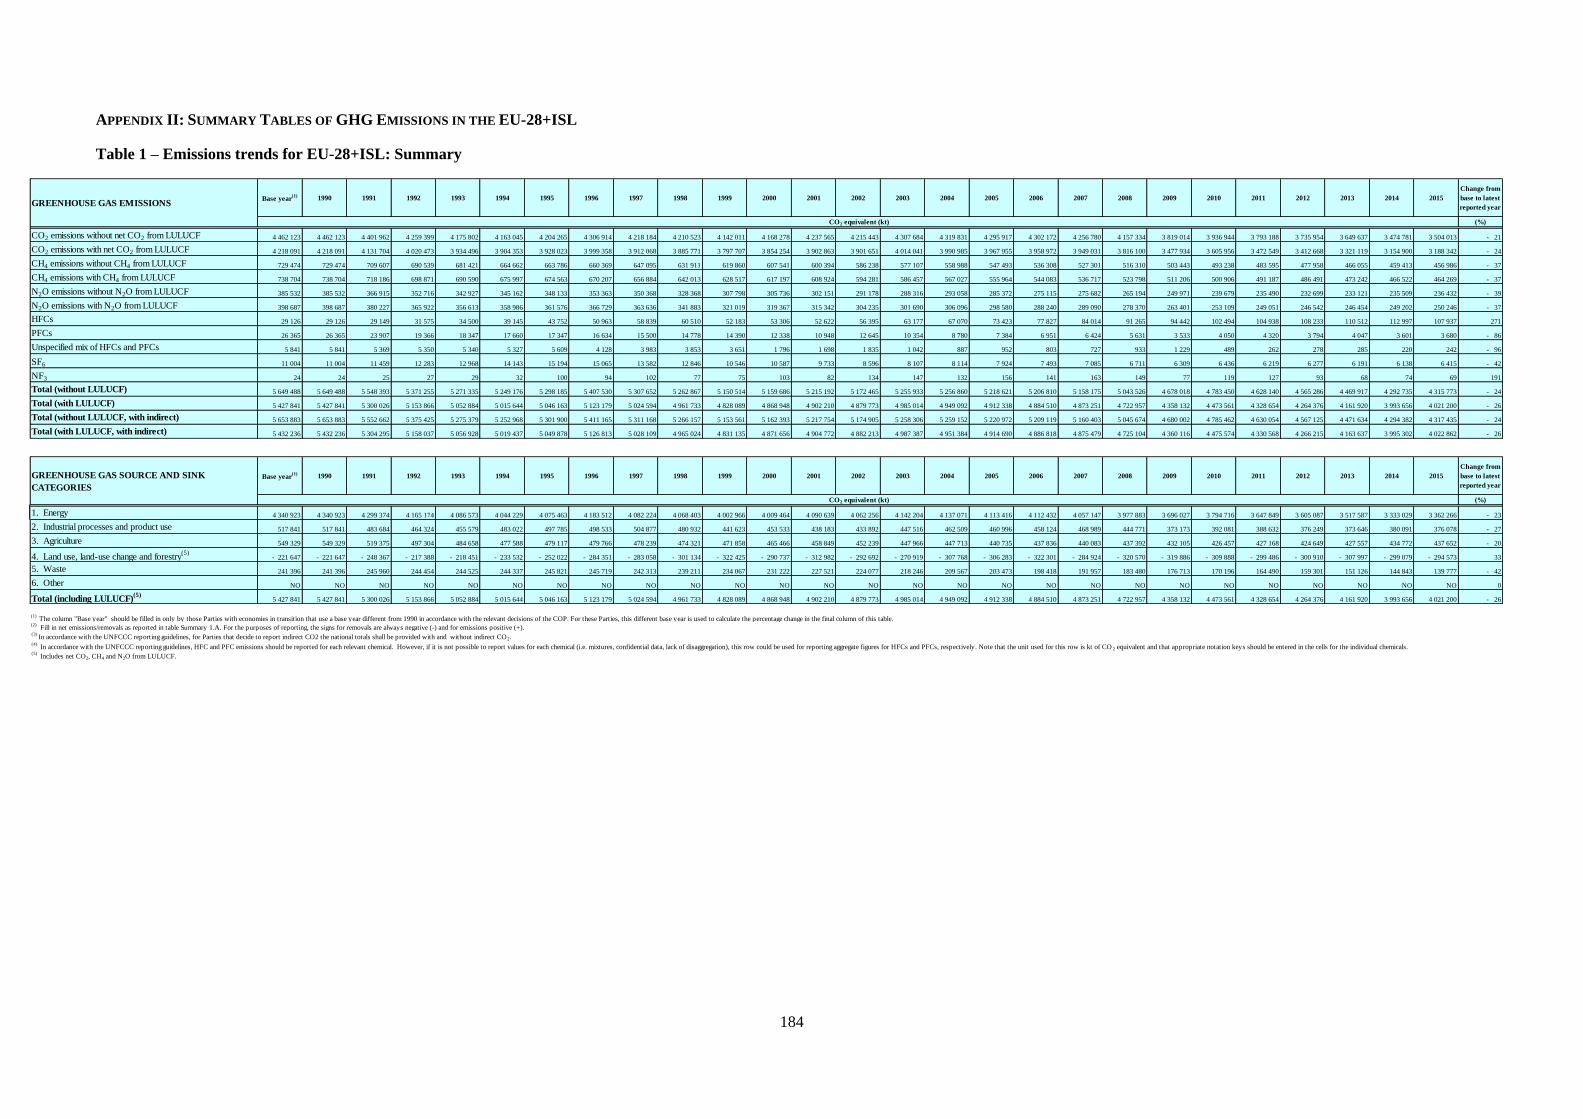
184
APPENDIX II: SUMMARY TABLES OF GHG EMISSIONS IN THE EU-28+ISL
Table 1 – Emissions trends for EU-28+ISL: Summary
Base year(1) 1990 1991 1992 1993 1994 1995 1996 1997 1998 1999 2000 2001 2002 2003 2004 2005 2006 2007 2008 2009 2010 2011 2012 2013 2014 2015
Change from
base to latest
reported year
(%)
CO2 emissions without net CO2 from LULUCF 4 462 123 4 462 123 4 401 962 4 259 399 4 175 802 4 163 045 4 204 265 4 306 914 4 218 184 4 210 523 4 142 011 4 168 278 4 237 565 4 215 443 4 307 684 4 319 831 4 295 917 4 302 172 4 256 780 4 157 334 3 819 014 3 936 944 3 793 188 3 735 954 3 649 637 3 474 781 3 504 013 - 21
CO2 emissions with net CO2 from LULUCF 4 218 091 4 218 091 4 131 704 4 020 473 3 934 496 3 904 353 3 928 023 3 999 358 3 912 068 3 885 771 3 797 707 3 854 254 3 902 863 3 901 651 4 014 041 3 990 985 3 967 955 3 958 972 3 949 031 3 816 100 3 477 934 3 605 956 3 472 549 3 412 668 3 321 119 3 154 900 3 188 342 - 24
CH4 emissions without CH4 from LULUCF 729 474 729 474 709 607 690 539 681 421 664 662 663 786 660 369 647 095 631 911 619 860 607 541 600 394 586 238 577 107 558 988 547 493 536 308 527 301 516 310 503 443 493 238 483 595 477 958 466 055 459 413 456 986 - 37
CH4 emissions with CH4 from LULUCF 738 704 738 704 718 186 698 871 690 590 675 997 674 563 670 207 656 884 642 013 628 517 617 197 608 924 594 281 586 457 567 027 555 964 544 083 536 717 523 798 511 206 500 906 491 187 486 491 473 242 466 522 464 269 - 37
N2O emissions without N2O from LULUCF 385 532 385 532 366 915 352 716 342 927 345 162 348 133 353 363 350 368 328 368 307 798 305 736 302 151 291 178 288 316 293 058 285 372 275 115 275 682 265 194 249 971 239 679 235 490 232 699 233 121 235 509 236 432 - 39
N2O emissions with N2O from LULUCF 398 687 398 687 380 227 365 922 356 613 358 986 361 576 366 729 363 636 341 883 321 019 319 367 315 342 304 235 301 690 306 096 298 580 288 240 289 090 278 370 263 401 253 109 249 051 246 542 246 454 249 202 250 246 - 37
HFCs 29 126 29 126 29 149 31 575 34 500 39 145 43 752 50 963 58 839 60 510 52 183 53 306 52 622 56 395 63 177 67 070 73 423 77 827 84 014 91 265 94 442 102 494 104 938 108 233 110 512 112 997 107 937 271
PFCs 26 365 26 365 23 907 19 366 18 347 17 660 17 347 16 634 15 500 14 778 14 390 12 338 10 948 12 645 10 354 8 780 7 384 6 951 6 424 5 631 3 533 4 050 4 320 3 794 4 047 3 601 3 680 - 86
Unspecified mix of HFCs and PFCs 5 841 5 841 5 369 5 350 5 340 5 327 5 609 4 128 3 983 3 853 3 651 1 796 1 698 1 835 1 042 887 952 803 727 933 1 229 489 262 278 285 220 242 - 96
SF6 11 004 11 004 11 459 12 283 12 968 14 143 15 194 15 065 13 582 12 846 10 546 10 587 9 733 8 596 8 107 8 114 7 924 7 493 7 085 6 711 6 309 6 436 6 219 6 277 6 191 6 138 6 415 - 42
NF3 24 24 25 27 29 32 100 94 102 77 75 103 82 134 147 132 156 141 163 149 77 119 127 93 68 74 69 191
Total (without LULUCF) 5 649 488 5 649 488 5 548 393 5 371 255 5 271 335 5 249 176 5 298 185 5 407 530 5 307 652 5 262 867 5 150 514 5 159 686 5 215 192 5 172 465 5 255 933 5 256 860 5 218 621 5 206 810 5 158 175 5 043 526 4 678 018 4 783 450 4 628 140 4 565 286 4 469 917 4 292 735 4 315 773 - 24
Total (with LULUCF) 5 427 841 5 427 841 5 300 026 5 153 866 5 052 884 5 015 644 5 046 163 5 123 179 5 024 594 4 961 733 4 828 089 4 868 948 4 902 210 4 879 773 4 985 014 4 949 092 4 912 338 4 884 510 4 873 251 4 722 957 4 358 132 4 473 561 4 328 654 4 264 376 4 161 920 3 993 656 4 021 200 - 26
Total (without LULUCF, with indirect) 5 653 883 5 653 883 5 552 662 5 375 425 5 275 379 5 252 968 5 301 900 5 411 165 5 311 168 5 266 157 5 153 561 5 162 393 5 217 754 5 174 905 5 258 306 5 259 152 5 220 972 5 209 119 5 160 403 5 045 674 4 680 002 4 785 462 4 630 054 4 567 125 4 471 634 4 294 382 4 317 435 - 24
Total (with LULUCF, with indirect) 5 432 236 5 432 236 5 304 295 5 158 037 5 056 928 5 019 437 5 049 878 5 126 813 5 028 109 4 965 024 4 831 135 4 871 656 4 904 772 4 882 213 4 987 387 4 951 384 4 914 690 4 886 818 4 875 479 4 725 104 4 360 116 4 475 574 4 330 568 4 266 215 4 163 637 3 995 302 4 022 862 - 26
Base year(1) 1990 1991 1992 1993 1994 1995 1996 1997 1998 1999 2000 2001 2002 2003 2004 2005 2006 2007 2008 2009 2010 2011 2012 2013 2014 2015
Change from
base to latest
reported year
(%)
1. Energy 4 340 923 4 340 923 4 299 374 4 165 174 4 086 573 4 044 229 4 075 463 4 183 512 4 082 224 4 068 403 4 002 966 4 009 464 4 090 639 4 062 256 4 142 204 4 137 071 4 113 416 4 112 432 4 057 147 3 977 883 3 696 027 3 794 716 3 647 849 3 605 087 3 517 587 3 333 029 3 362 266 - 23
2. Industrial processes and product use 517 841 517 841 483 684 464 324 455 579 483 022 497 785 498 533 504 877 480 932 441 623 453 533 438 183 433 892 447 516 462 509 460 996 458 124 468 989 444 771 373 173 392 081 388 632 376 249 373 646 380 091 376 078 - 27
3. Agriculture 549 329 549 329 519 375 497 304 484 658 477 588 479 117 479 766 478 239 474 321 471 858 465 466 458 849 452 239 447 966 447 713 440 735 437 836 440 083 437 392 432 105 426 457 427 168 424 649 427 557 434 772 437 652 - 20
4. Land use, land-use change and forestry(5)
- 221 647 - 221 647 - 248 367 - 217 388 - 218 451 - 233 532 - 252 022 - 284 351 - 283 058 - 301 134 - 322 425 - 290 737 - 312 982 - 292 692 - 270 919 - 307 768 - 306 283 - 322 301 - 284 924 - 320 570 - 319 886 - 309 888 - 299 486 - 300 910 - 307 997 - 299 079 - 294 573 33
5. Waste 241 396 241 396 245 960 244 454 244 525 244 337 245 821 245 719 242 313 239 211 234 067 231 222 227 521 224 077 218 246 209 567 203 473 198 418 191 957 183 480 176 713 170 196 164 490 159 301 151 126 144 843 139 777 - 42
6. Other NO NO NO NO NO NO NO NO NO NO NO NO NO NO NO NO NO NO NO NO NO NO NO NO NO NO NO 0
Total (including LULUCF)(5)
5 427 841 5 427 841 5 300 026 5 153 866 5 052 884 5 015 644 5 046 163 5 123 179 5 024 594 4 961 733 4 828 089 4 868 948 4 902 210 4 879 773 4 985 014 4 949 092 4 912 338 4 884 510 4 873 251 4 722 957 4 358 132 4 473 561 4 328 654 4 264 376 4 161 920 3 993 656 4 021 200 - 26
GREENHOUSE GAS EMISSIONS
GREENHOUSE GAS SOURCE AND SINK
CATEGORIES
(2) Fill in net emissions/removals as reported in table Summary 1.A. For the purposes of reporting, the signs for removals are always negative (-) and for emissions positive (+).
(3) In accordance with the UNFCCC reporting guidelines, for Parties that decide to report indirect CO2 the national totals shall be provided with and without indirect CO2.
(4) In accordance with the UNFCCC reporting guidelines, HFC and PFC emissions should be reported for each relevant chemical. However, if it is not possible to report values for each chemical (i.e. mixtures, confidential data, lack of disaggregation), this row could be used for reporting aggregate figures for HFCs and PFCs, respectively. Note that the unit used for this row is kt of CO 2 equivalent and that appropriate notation keys should be entered in the cells for the individual chemicals.
(5) Includes net CO2, CH4 and N2O from LULUCF.
CO2 equivalent (kt)
CO2 equivalent (kt)
(1) The column "Base year" should be filled in only by those Parties with economies in transition that use a base year different from 1990 in accordance with the relevant decisions of the COP. For these Parties, this different base year is used to calculate the percentage change in the final column of this table.
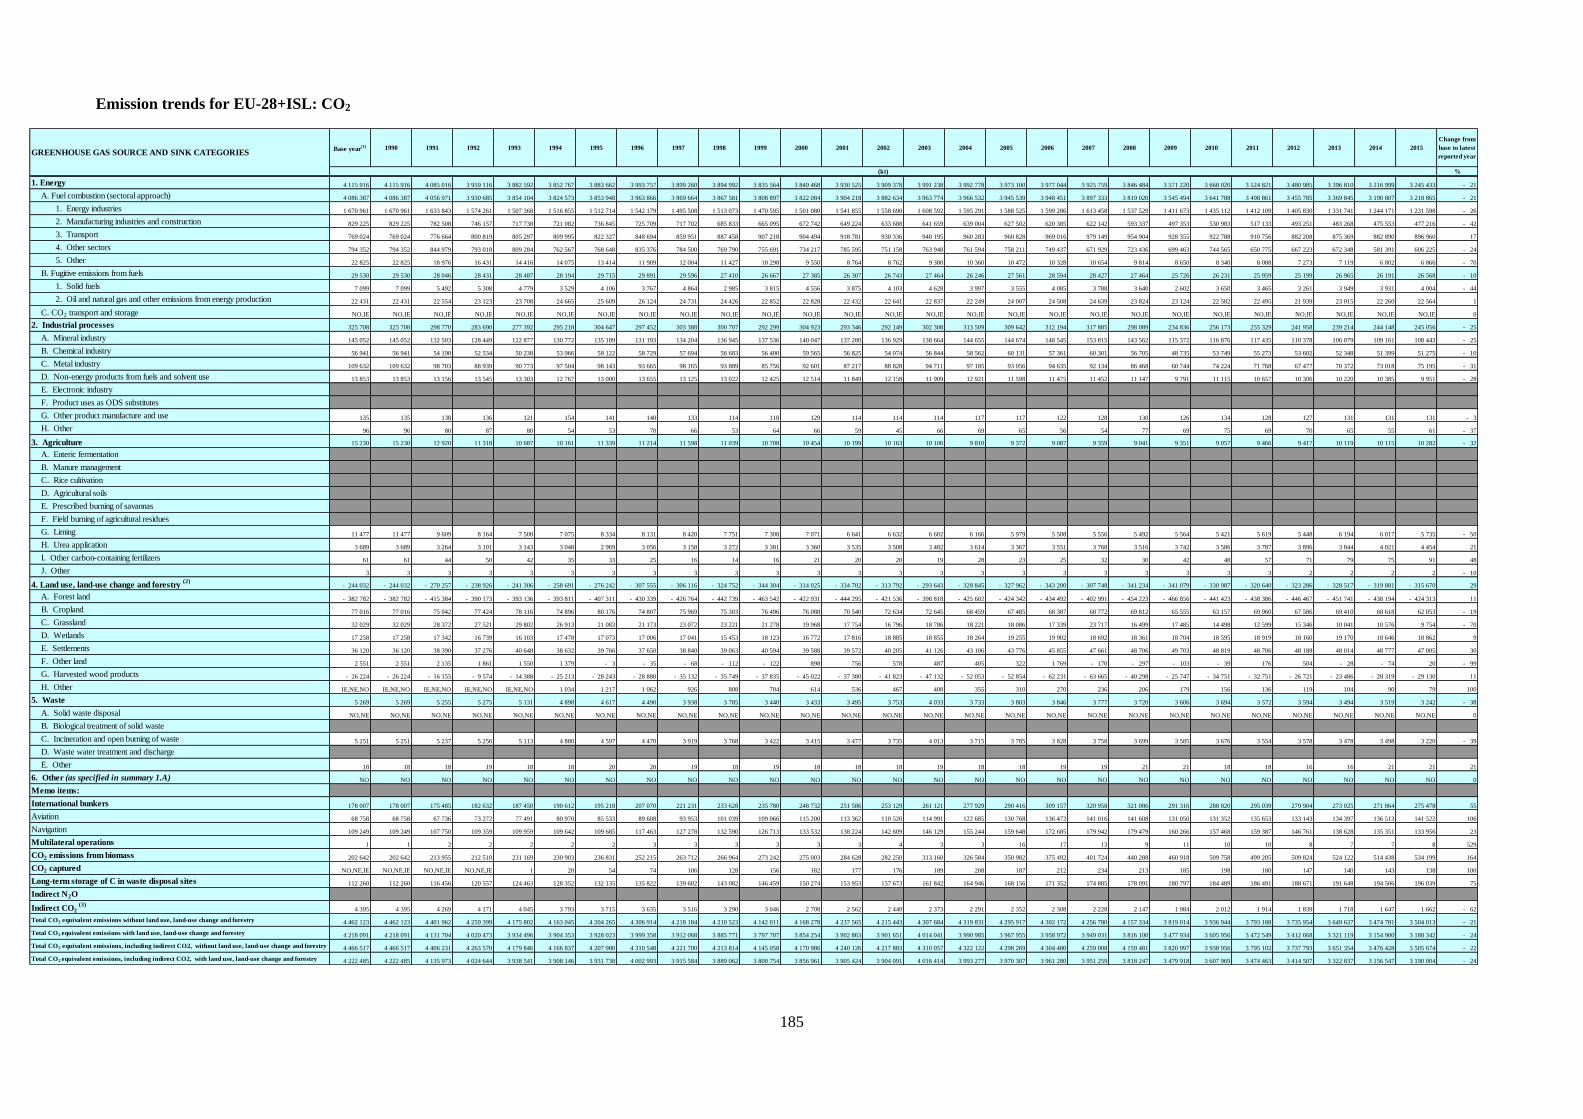
185
Emission trends for EU-28+ISL: CO2
Base year(1) 1990 1991 1992 1993 1994 1995 1996 1997 1998 1999 2000 2001 2002 2003 2004 2005 2006 2007 2008 2009 2010 2011 2012 2013 2014 2015
Change from
base to latest
reported year
%
1. Energy 4 115 916 4 115 916 4 085 016 3 959 116 3 882 592 3 852 767 3 883 662 3 993 757 3 899 260 3 894 992 3 835 564 3 849 468 3 930 525 3 909 378 3 991 238 3 992 778 3 973 100 3 977 044 3 925 759 3 846 484 3 571 220 3 668 020 3 524 821 3 480 985 3 396 810 3 216 999 3 245 433 - 21
A. Fuel combustion (sectoral approach) 4 086 387 4 086 387 4 056 971 3 930 685 3 854 104 3 824 573 3 853 948 3 963 866 3 869 664 3 867 581 3 808 897 3 822 084 3 904 218 3 882 634 3 963 774 3 966 532 3 945 539 3 948 451 3 897 333 3 819 020 3 545 494 3 641 788 3 498 861 3 455 785 3 369 845 3 190 807 3 218 865 - 21
1. Energy industries 1 670 961 1 670 961 1 633 843 1 574 261 1 507 368 1 516 855 1 512 714 1 542 179 1 495 508 1 513 073 1 470 595 1 501 080 1 541 855 1 558 690 1 608 592 1 595 291 1 588 525 1 599 286 1 613 458 1 537 529 1 411 673 1 435 112 1 412 109 1 405 830 1 331 741 1 244 171 1 231 598 - 26
2. Manufacturing industries and construction 829 225 829 225 782 508 746 157 717 738 721 082 736 845 725 709 717 702 685 833 665 095 672 742 649 224 633 688 641 659 639 004 627 502 620 385 622 142 593 337 497 353 530 983 517 133 493 251 483 268 475 553 477 216 - 42
3. Transport 769 024 769 024 776 664 800 819 805 297 809 995 822 327 848 694 859 951 887 458 907 218 904 494 918 781 930 336 940 195 960 283 960 828 969 016 979 149 954 904 928 355 922 788 910 756 882 208 875 369 882 890 896 960 17
4. Other sectors 794 352 794 352 844 979 793 018 809 284 762 567 768 648 835 376 784 500 769 790 755 691 734 217 785 595 751 158 763 948 761 594 758 211 749 437 671 929 723 436 699 463 744 565 650 775 667 223 672 348 581 391 606 225 - 24
5. Other 22 825 22 825 18 976 16 431 14 416 14 075 13 414 11 909 12 004 11 427 10 298 9 550 8 764 8 762 9 380 10 360 10 472 10 328 10 654 9 814 8 650 8 340 8 088 7 273 7 119 6 802 6 866 - 70
B. Fugitive emissions from fuels 29 530 29 530 28 046 28 431 28 487 28 194 29 715 29 891 29 596 27 410 26 667 27 385 26 307 26 743 27 464 26 246 27 561 28 594 28 427 27 464 25 726 26 231 25 959 25 199 26 965 26 191 26 568 - 10
1. Solid fuels 7 099 7 099 5 492 5 308 4 779 3 529 4 106 3 767 4 864 2 985 3 815 4 556 3 875 4 103 4 628 3 997 3 555 4 085 3 788 3 640 2 602 3 650 3 465 3 261 3 949 3 931 4 004 - 44
2. Oil and natural gas and other emissions from energy production 22 431 22 431 22 554 23 123 23 708 24 665 25 609 26 124 24 731 24 426 22 852 22 828 22 432 22 641 22 837 22 249 24 007 24 508 24 639 23 824 23 124 22 582 22 495 21 939 23 015 22 260 22 564 1
C. CO2 transport and storage NO,IE NO,IE NO,IE NO,IE NO,IE NO,IE NO,IE NO,IE NO,IE NO,IE NO,IE NO,IE NO,IE NO,IE NO,IE NO,IE NO,IE NO,IE NO,IE NO,IE NO,IE NO,IE NO,IE NO,IE NO,IE NO,IE NO,IE 0
2. Industrial processes 325 708 325 708 298 770 283 690 277 392 295 218 304 647 297 452 303 388 300 707 292 299 304 923 293 346 292 149 302 308 313 509 309 642 312 194 317 885 298 089 234 836 256 173 255 329 241 958 239 214 244 148 245 056 - 25
A. Mineral industry 145 052 145 052 132 503 128 449 122 877 130 772 135 189 131 193 134 204 136 945 137 536 140 047 137 280 136 929 138 664 144 655 144 674 148 545 153 815 143 562 115 372 116 876 117 435 110 378 106 079 109 161 108 443 - 25
B. Chemical industry 56 941 56 941 54 190 52 534 50 238 53 966 58 122 58 729 57 694 56 683 56 400 59 565 56 825 54 074 56 844 58 562 60 131 57 361 60 301 56 705 48 735 53 749 55 273 53 602 52 348 51 399 51 275 - 10
C. Metal industry 109 632 109 632 98 703 88 939 90 773 97 504 98 143 93 665 98 165 93 889 85 756 92 601 87 217 88 828 94 711 97 185 93 056 94 635 92 134 86 468 60 744 74 224 71 768 67 477 70 372 73 018 75 195 - 31
D. Non-energy products from fuels and solvent use 13 853 13 853 13 156 13 545 13 303 12 767 13 000 13 655 13 125 13 022 12 425 12 514 11 849 12 158 11 909 12 921 11 598 11 475 11 452 11 147 9 791 11 115 10 657 10 306 10 220 10 385 9 951 - 28
E. Electronic industry
F. Product uses as ODS substitutes
G. Other product manufacture and use 135 135 138 136 121 154 141 140 133 114 118 129 114 114 114 117 117 122 128 130 126 134 128 127 131 131 131 - 3
H. Other 96 96 80 87 80 54 53 70 66 53 64 66 59 45 66 69 65 56 54 77 69 75 69 70 65 55 61 - 37
3. Agriculture 15 230 15 230 12 920 11 318 10 687 10 161 11 339 11 214 11 598 11 039 10 708 10 454 10 199 10 163 10 106 9 810 9 372 9 087 9 359 9 041 9 351 9 057 9 466 9 417 10 119 10 115 10 282 - 32
A. Enteric fermentation
B. Manure management
C. Rice cultivation
D. Agricultural soils
E. Prescribed burning of savannas
F. Field burning of agricultural residues
G. Liming 11 477 11 477 9 609 8 164 7 500 7 075 8 334 8 131 8 420 7 751 7 308 7 071 6 641 6 632 6 602 6 166 5 979 5 508 5 556 5 492 5 564 5 421 5 619 5 448 6 194 6 017 5 735 - 50
H. Urea application 3 689 3 689 3 264 3 101 3 143 3 048 2 969 3 056 3 158 3 272 3 381 3 360 3 535 3 508 3 482 3 614 3 367 3 551 3 768 3 516 3 742 3 586 3 787 3 896 3 844 4 021 4 454 21
I. Other carbon-containing fertilizers 61 61 44 50 42 35 33 25 16 14 16 21 20 20 19 28 23 25 32 30 42 48 57 71 79 75 91 48
J. Other 3 3 3 3 3 3 3 3 3 3 3 3 3 3 3 3 3 3 3 3 3 3 3 2 2 2 2 - 10
4. Land use, land-use change and forestry (2)
- 244 032 - 244 032 - 270 257 - 238 926 - 241 306 - 258 691 - 276 242 - 307 555 - 306 116 - 324 752 - 344 304 - 314 025 - 334 702 - 313 792 - 293 643 - 328 845 - 327 962 - 343 200 - 307 748 - 341 234 - 341 079 - 330 987 - 320 640 - 323 286 - 328 517 - 319 881 - 315 670 29
A. Forest land - 382 782 - 382 782 - 415 384 - 390 173 - 393 136 - 393 811 - 407 311 - 430 339 - 426 764 - 442 739 - 463 542 - 422 931 - 444 295 - 421 536 - 398 818 - 425 602 - 424 342 - 434 492 - 402 991 - 454 223 - 466 856 - 441 423 - 438 386 - 446 467 - 451 741 - 438 194 - 424 313 11
B. Cropland 77 016 77 016 75 042 77 424 78 116 74 896 80 176 74 807 75 969 75 303 76 496 76 088 70 540 72 634 72 645 68 459 67 485 68 387 68 772 69 812 65 555 63 157 69 960 67 586 69 410 68 618 62 053 - 19
C. Grassland 32 029 32 029 28 372 27 521 29 802 26 913 21 083 21 173 23 072 23 221 21 278 19 968 17 754 16 796 18 786 18 221 18 086 17 339 23 717 16 499 17 485 14 498 12 599 15 346 10 041 10 576 9 754 - 70
D. Wetlands 17 258 17 258 17 342 16 739 16 103 17 478 17 073 17 006 17 041 15 453 18 123 16 772 17 816 18 885 18 855 18 264 19 255 19 902 18 692 18 361 18 704 18 595 18 919 18 160 19 170 18 646 18 862 9
E. Settlements 36 120 36 120 38 390 37 276 40 648 38 632 39 766 37 650 38 840 39 063 40 594 39 588 39 572 40 205 41 126 43 106 43 776 45 855 47 661 48 706 49 703 48 819 48 706 48 188 48 014 48 777 47 005 30
F. Other land 2 551 2 551 2 135 1 861 1 550 1 379 - 3 - 35 - 68 - 112 - 122 898 756 578 487 405 322 1 769 - 170 - 297 - 103 - 39 176 504 - 28 - 74 20 - 99
G. Harvested wood products - 26 224 - 26 224 - 16 155 - 9 574 - 14 388 - 25 213 - 28 243 - 28 880 - 35 132 - 35 749 - 37 835 - 45 022 - 37 380 - 41 823 - 47 132 - 52 053 - 52 854 - 62 231 - 63 665 - 40 298 - 25 747 - 34 751 - 32 751 - 26 721 - 23 486 - 28 319 - 29 130 11
H. Other IE,NE,NO IE,NE,NO IE,NE,NO IE,NE,NO IE,NE,NO 1 034 1 217 1 062 926 808 704 614 536 467 408 355 310 270 236 206 179 156 136 119 104 90 79 100
5. Waste 5 269 5 269 5 255 5 275 5 131 4 898 4 617 4 490 3 938 3 785 3 440 3 433 3 495 3 753 4 033 3 733 3 803 3 846 3 777 3 720 3 606 3 694 3 572 3 594 3 494 3 519 3 242 - 38
A. Solid waste disposal NO,NE NO,NE NO,NE NO,NE NO,NE NO,NE NO,NE NO,NE NO,NE NO,NE NO,NE NO,NE NO,NE NO,NE NO,NE NO,NE NO,NE NO,NE NO,NE NO,NE NO,NE NO,NE NO,NE NO,NE NO,NE NO,NE NO,NE 0
B. Biological treatment of solid waste
C. Incineration and open burning of waste 5 251 5 251 5 237 5 256 5 113 4 880 4 597 4 470 3 919 3 768 3 422 3 415 3 477 3 735 4 013 3 715 3 785 3 828 3 758 3 699 3 585 3 676 3 554 3 578 3 478 3 498 3 220 - 39
D. Waste water treatment and discharge
E. Other 18 18 18 19 18 18 20 20 19 18 19 18 18 18 19 18 18 19 19 21 21 18 18 16 16 21 21 21
6. Other (as specified in summary 1.A) NO NO NO NO NO NO NO NO NO NO NO NO NO NO NO NO NO NO NO NO NO NO NO NO NO NO NO 0
Memo items:
International bunkers 178 007 178 007 175 485 182 632 187 450 190 612 195 218 207 070 221 231 233 628 235 780 248 732 251 586 253 129 261 121 277 929 290 416 309 157 320 958 321 086 291 316 288 820 295 039 279 904 273 025 271 864 275 478 55
Aviation 68 758 68 758 67 736 73 272 77 491 80 970 85 533 89 608 93 953 101 039 109 066 115 200 113 362 110 520 114 991 122 685 130 768 136 472 141 016 141 608 131 050 131 352 135 653 133 143 134 397 136 513 141 522 106
Navigation 109 249 109 249 107 750 109 359 109 959 109 642 109 685 117 463 127 278 132 590 126 713 133 532 138 224 142 609 146 129 155 244 159 648 172 685 179 942 179 479 160 266 157 468 159 387 146 761 138 628 135 351 133 956 23
Multilateral operations 1 1 2 2 2 2 2 3 3 3 3 3 3 4 3 3 16 17 13 9 11 10 10 8 7 7 8 529
CO2 emissions from biomass 202 642 202 642 213 955 212 510 231 169 230 903 236 831 252 215 263 712 266 964 273 242 275 003 284 628 282 250 313 160 326 584 350 982 375 492 401 724 440 288 460 918 509 758 499 205 509 824 524 122 514 438 534 199 164
CO2 captured NO,NE,IE NO,NE,IE NO,NE,IE NO,NE,IE 1 20 54 74 106 128 156 182 177 176 189 208 187 212 234 213 185 198 180 147 140 143 138 100
Long-term storage of C in waste disposal sites 112 260 112 260 116 456 120 557 124 463 128 352 132 135 135 822 139 602 143 082 146 459 150 274 153 953 157 673 161 842 164 946 168 156 171 352 174 885 178 091 180 797 184 489 186 491 188 671 191 648 194 506 196 039 75
Indirect N2O
Indirect CO2 (3)
4 395 4 395 4 269 4 171 4 045 3 793 3 715 3 635 3 516 3 290 3 046 2 708 2 562 2 440 2 373 2 291 2 352 2 308 2 228 2 147 1 984 2 012 1 914 1 839 1 718 1 647 1 662 - 62
Total CO2 equivalent emissions without land use, land-use change and forestry 4 462 123 4 462 123 4 401 962 4 259 399 4 175 802 4 163 045 4 204 265 4 306 914 4 218 184 4 210 523 4 142 011 4 168 278 4 237 565 4 215 443 4 307 684 4 319 831 4 295 917 4 302 172 4 256 780 4 157 334 3 819 014 3 936 944 3 793 188 3 735 954 3 649 637 3 474 781 3 504 013 - 21
Total CO2 equivalent emissions with land use, land-use change and forestry 4 218 091 4 218 091 4 131 704 4 020 473 3 934 496 3 904 353 3 928 023 3 999 358 3 912 068 3 885 771 3 797 707 3 854 254 3 902 863 3 901 651 4 014 041 3 990 985 3 967 955 3 958 972 3 949 031 3 816 100 3 477 934 3 605 956 3 472 549 3 412 668 3 321 119 3 154 900 3 188 342 - 24
Total CO2 equivalent emissions, including indirect CO2, without land use, land-use change and forestry 4 466 517 4 466 517 4 406 231 4 263 570 4 179 846 4 166 837 4 207 980 4 310 548 4 221 700 4 213 814 4 145 058 4 170 986 4 240 126 4 217 883 4 310 057 4 322 122 4 298 269 4 304 480 4 259 008 4 159 481 3 820 997 3 938 956 3 795 102 3 737 793 3 651 354 3 476 428 3 505 674 - 22
Total CO2 equivalent emissions, including indirect CO2, with land use, land-use change and forestry 4 222 485 4 222 485 4 135 973 4 024 644 3 938 541 3 908 146 3 931 738 4 002 993 3 915 584 3 889 062 3 800 754 3 856 961 3 905 424 3 904 091 4 016 414 3 993 277 3 970 307 3 961 280 3 951 259 3 818 247 3 479 918 3 607 969 3 474 463 3 414 507 3 322 837 3 156 547 3 190 004 - 24
GREENHOUSE GAS SOURCE AND SINK CATEGORIES
(kt)
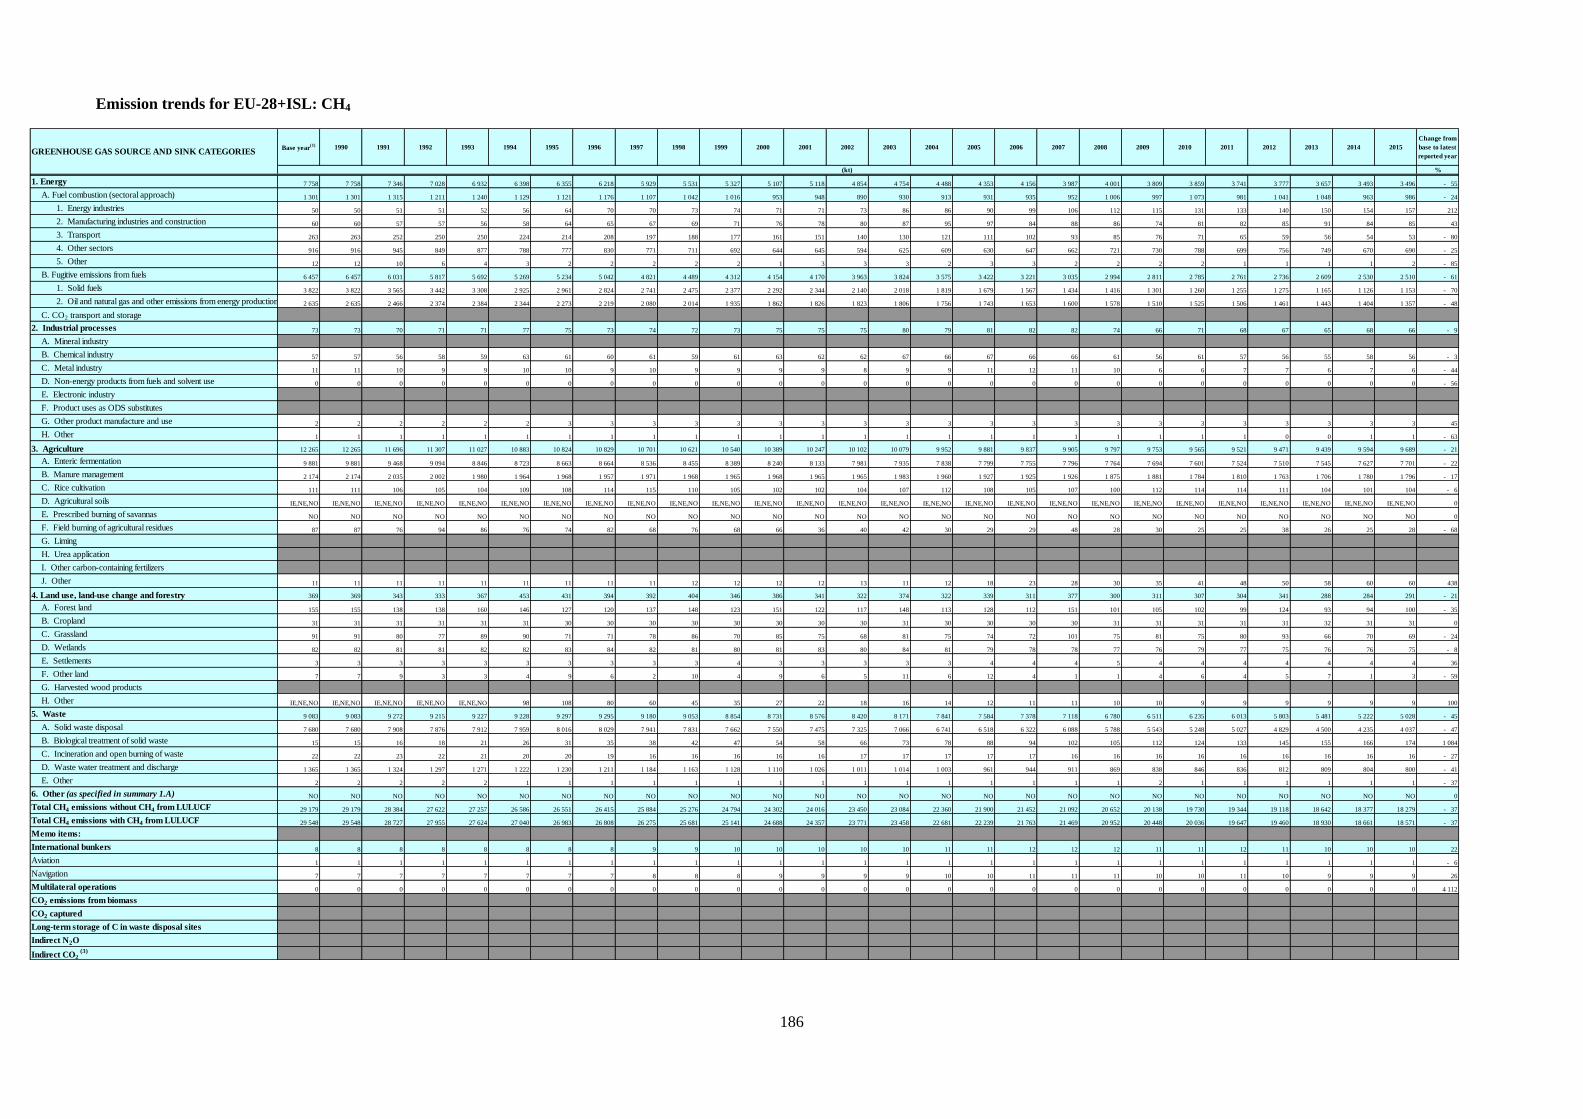
186
Emission trends for EU-28+ISL: CH4
Base year(1) 1990 1991 1992 1993 1994 1995 1996 1997 1998 1999 2000 2001 2002 2003 2004 2005 2006 2007 2008 2009 2010 2011 2012 2013 2014 2015
Change from
base to latest
reported year
%
1. Energy 7 758 7 758 7 346 7 028 6 932 6 398 6 355 6 218 5 929 5 531 5 327 5 107 5 118 4 854 4 754 4 488 4 353 4 156 3 987 4 001 3 809 3 859 3 741 3 777 3 657 3 493 3 496 - 55
A. Fuel combustion (sectoral approach) 1 301 1 301 1 315 1 211 1 240 1 129 1 121 1 176 1 107 1 042 1 016 953 948 890 930 913 931 935 952 1 006 997 1 073 981 1 041 1 048 963 986 - 24
1. Energy industries 50 50 51 51 52 56 64 70 70 73 74 71 71 73 86 86 90 99 106 112 115 131 133 140 150 154 157 212
2. Manufacturing industries and construction 60 60 57 57 56 58 64 65 67 69 71 76 78 80 87 95 97 84 88 86 74 81 82 85 91 84 85 43
3. Transport 263 263 252 250 250 224 214 208 197 188 177 161 151 140 130 121 111 102 93 85 76 71 65 59 56 54 53 - 80
4. Other sectors 916 916 945 849 877 788 777 830 771 711 692 644 645 594 625 609 630 647 662 721 730 788 699 756 749 670 690 - 25
5. Other 12 12 10 6 4 3 2 2 2 2 2 1 3 3 3 2 3 3 2 2 2 2 1 1 1 1 2 - 85
B. Fugitive emissions from fuels 6 457 6 457 6 031 5 817 5 692 5 269 5 234 5 042 4 821 4 489 4 312 4 154 4 170 3 963 3 824 3 575 3 422 3 221 3 035 2 994 2 811 2 785 2 761 2 736 2 609 2 530 2 510 - 61
1. Solid fuels 3 822 3 822 3 565 3 442 3 308 2 925 2 961 2 824 2 741 2 475 2 377 2 292 2 344 2 140 2 018 1 819 1 679 1 567 1 434 1 416 1 301 1 260 1 255 1 275 1 165 1 126 1 153 - 70
2. Oil and natural gas and other emissions from energy production 2 635 2 635 2 466 2 374 2 384 2 344 2 273 2 219 2 080 2 014 1 935 1 862 1 826 1 823 1 806 1 756 1 743 1 653 1 600 1 578 1 510 1 525 1 506 1 461 1 443 1 404 1 357 - 48
C. CO2 transport and storage
2. Industrial processes 73 73 70 71 71 77 75 73 74 72 73 75 75 75 80 79 81 82 82 74 66 71 68 67 65 68 66 - 9
A. Mineral industry
B. Chemical industry 57 57 56 58 59 63 61 60 61 59 61 63 62 62 67 66 67 66 66 61 56 61 57 56 55 58 56 - 3
C. Metal industry 11 11 10 9 9 10 10 9 10 9 9 9 9 8 9 9 11 12 11 10 6 6 7 7 6 7 6 - 44
D. Non-energy products from fuels and solvent use 0 0 0 0 0 0 0 0 0 0 0 0 0 0 0 0 0 0 0 0 0 0 0 0 0 0 0 - 56
E. Electronic industry
F. Product uses as ODS substitutes
G. Other product manufacture and use 2 2 2 2 2 2 3 3 3 3 3 3 3 3 3 3 3 3 3 3 3 3 3 3 3 3 3 45
H. Other 1 1 1 1 1 1 1 1 1 1 1 1 1 1 1 1 1 1 1 1 1 1 1 0 0 1 1 - 63
3. Agriculture 12 265 12 265 11 696 11 307 11 027 10 883 10 824 10 829 10 701 10 621 10 540 10 389 10 247 10 102 10 079 9 952 9 881 9 837 9 905 9 797 9 753 9 565 9 521 9 471 9 439 9 594 9 689 - 21
A. Enteric fermentation 9 881 9 881 9 468 9 094 8 846 8 723 8 663 8 664 8 536 8 455 8 389 8 240 8 133 7 981 7 935 7 838 7 799 7 755 7 796 7 764 7 694 7 601 7 524 7 510 7 545 7 627 7 701 - 22
B. Manure management 2 174 2 174 2 035 2 002 1 980 1 964 1 968 1 957 1 971 1 968 1 965 1 968 1 965 1 965 1 983 1 960 1 927 1 925 1 926 1 875 1 881 1 784 1 810 1 763 1 706 1 780 1 796 - 17
C. Rice cultivation 111 111 106 105 104 109 108 114 115 110 105 102 102 104 107 112 108 105 107 100 112 114 114 111 104 101 104 - 6
D. Agricultural soils IE,NE,NO IE,NE,NO IE,NE,NO IE,NE,NO IE,NE,NO IE,NE,NO IE,NE,NO IE,NE,NO IE,NE,NO IE,NE,NO IE,NE,NO IE,NE,NO IE,NE,NO IE,NE,NO IE,NE,NO IE,NE,NO IE,NE,NO IE,NE,NO IE,NE,NO IE,NE,NO IE,NE,NO IE,NE,NO IE,NE,NO IE,NE,NO IE,NE,NO IE,NE,NO IE,NE,NO 0
E. Prescribed burning of savannas NO NO NO NO NO NO NO NO NO NO NO NO NO NO NO NO NO NO NO NO NO NO NO NO NO NO NO 0
F. Field burning of agricultural residues 87 87 76 94 86 76 74 82 68 76 68 66 36 40 42 30 29 29 48 28 30 25 25 38 26 25 28 - 68
G. Liming
H. Urea application
I. Other carbon-containing fertilizers
J. Other 11 11 11 11 11 11 11 11 11 12 12 12 12 13 11 12 18 23 28 30 35 41 48 50 58 60 60 438
4. Land use, land-use change and forestry 369 369 343 333 367 453 431 394 392 404 346 386 341 322 374 322 339 311 377 300 311 307 304 341 288 284 291 - 21
A. Forest land 155 155 138 138 160 146 127 120 137 148 123 151 122 117 148 113 128 112 151 101 105 102 99 124 93 94 100 - 35
B. Cropland 31 31 31 31 31 31 30 30 30 30 30 30 30 30 31 30 30 30 30 31 31 31 31 31 32 31 31 0
C. Grassland 91 91 80 77 89 90 71 71 78 86 70 85 75 68 81 75 74 72 101 75 81 75 80 93 66 70 69 - 24
D. Wetlands 82 82 81 81 82 82 83 84 82 81 80 81 83 80 84 81 79 78 78 77 76 79 77 75 76 76 75 - 8
E. Settlements 3 3 3 3 3 3 3 3 3 3 4 3 3 3 3 3 4 4 4 5 4 4 4 4 4 4 4 36
F. Other land 7 7 9 3 3 4 9 6 2 10 4 9 6 5 11 6 12 4 1 1 4 6 4 5 7 1 3 - 59
G. Harvested wood products
H. Other IE,NE,NO IE,NE,NO IE,NE,NO IE,NE,NO IE,NE,NO 98 108 80 60 45 35 27 22 18 16 14 12 11 11 10 10 9 9 9 9 9 9 100
5. Waste 9 083 9 083 9 272 9 215 9 227 9 228 9 297 9 295 9 180 9 053 8 854 8 731 8 576 8 420 8 171 7 841 7 584 7 378 7 118 6 780 6 511 6 235 6 013 5 803 5 481 5 222 5 028 - 45
A. Solid waste disposal 7 680 7 680 7 908 7 876 7 912 7 959 8 016 8 029 7 941 7 831 7 662 7 550 7 475 7 325 7 066 6 741 6 518 6 322 6 088 5 788 5 543 5 248 5 027 4 829 4 500 4 235 4 037 - 47
B. Biological treatment of solid waste 15 15 16 18 21 26 31 35 38 42 47 54 58 66 73 78 88 94 102 105 112 124 133 145 155 166 174 1 084
C. Incineration and open burning of waste 22 22 23 22 21 20 20 19 16 16 16 16 16 17 17 17 17 17 16 16 16 16 16 16 16 16 16 - 27
D. Waste water treatment and discharge 1 365 1 365 1 324 1 297 1 271 1 222 1 230 1 211 1 184 1 163 1 128 1 110 1 026 1 011 1 014 1 003 961 944 911 869 838 846 836 812 809 804 800 - 41
E. Other 2 2 2 2 2 1 1 1 1 1 1 1 1 1 1 1 1 1 1 1 2 1 1 1 1 1 1 - 37
6. Other (as specified in summary 1.A) NO NO NO NO NO NO NO NO NO NO NO NO NO NO NO NO NO NO NO NO NO NO NO NO NO NO NO 0
Total CH4 emissions without CH4 from LULUCF 29 179 29 179 28 384 27 622 27 257 26 586 26 551 26 415 25 884 25 276 24 794 24 302 24 016 23 450 23 084 22 360 21 900 21 452 21 092 20 652 20 138 19 730 19 344 19 118 18 642 18 377 18 279 - 37
Total CH4 emissions with CH4 from LULUCF 29 548 29 548 28 727 27 955 27 624 27 040 26 983 26 808 26 275 25 681 25 141 24 688 24 357 23 771 23 458 22 681 22 239 21 763 21 469 20 952 20 448 20 036 19 647 19 460 18 930 18 661 18 571 - 37
Memo items:
International bunkers 8 8 8 8 8 8 8 8 9 9 10 10 10 10 10 11 11 12 12 12 11 11 12 11 10 10 10 22
Aviation 1 1 1 1 1 1 1 1 1 1 1 1 1 1 1 1 1 1 1 1 1 1 1 1 1 1 1 - 6
Navigation 7 7 7 7 7 7 7 7 8 8 8 9 9 9 9 10 10 11 11 11 10 10 11 10 9 9 9 26
Multilateral operations 0 0 0 0 0 0 0 0 0 0 0 0 0 0 0 0 0 0 0 0 0 0 0 0 0 0 0 4 112
CO2 emissions from biomass
CO2 captured
Long-term storage of C in waste disposal sites
Indirect N2O
Indirect CO2 (3)
GREENHOUSE GAS SOURCE AND SINK CATEGORIES
(kt)

187
Emission trends for EU-28+ISL: N2O
Base year(1) 1990 1991 1992 1993 1994 1995 1996 1997 1998 1999 2000 2001 2002 2003 2004 2005 2006 2007 2008 2009 2010 2011 2012 2013 2014 2015
Change from
base to latest
reported year
%
1. Energy 104 104 103 102 103 106 110 115 117 118 115 108 108 106 108 108 106 106 106 105 99 101 99 100 98 96 99 - 5
A. Fuel combustion (sectoral approach) 104 104 102 101 102 105 110 114 116 117 114 108 107 105 107 107 105 105 106 105 99 101 99 99 98 96 98 - 5
1. Energy industries 28 28 28 27 26 26 26 26 25 25 24 25 26 27 28 28 28 28 28 28 26 27 28 28 27 26 26 - 9
2. Manufacturing industries and construction 20 20 19 19 18 17 18 18 18 18 18 18 18 18 19 19 18 19 19 18 15 15 15 14 14 14 14 - 29
3. Transport 26 26 27 28 30 34 38 42 44 46 44 37 36 34 33 33 31 31 31 30 29 29 29 29 30 30 31 19
4. Other sectors 28 28 28 27 28 27 27 28 28 27 27 27 27 26 27 27 28 27 27 29 28 29 27 27 28 26 27 - 5
5. Other 1 1 1 1 1 1 1 0 1 0 0 0 0 0 0 1 1 1 1 0 0 0 0 0 0 0 0 - 63
B. Fugitive emissions from fuels 0 0 1 1 1 1 1 1 1 1 1 1 1 1 1 1 1 1 1 1 0 0 0 0 0 0 0 - 23
1. Solid fuels 0 0 0 0 0 0 0 0 0 0 0 0 0 0 0 0 0 0 0 0 0 0 0 0 0 0 0 - 4
2. Oil and natural gas and other emissions from energy production 0 0 1 1 1 1 1 1 1 1 1 1 1 1 1 1 1 1 1 1 0 0 0 0 0 0 0 - 23
C. CO2 transport and storage
2. Industrial processes 396 396 380 370 353 368 367 377 361 290 224 230 228 202 203 208 200 170 170 135 104 69 53 47 39 38 37 - 91
A. Mineral industry
B. Chemical industry 376 376 361 350 334 348 347 358 342 271 205 212 210 185 186 192 183 153 154 119 89 54 38 33 26 25 25 - 93
C. Metal industry 0 0 0 0 0 0 0 0 0 0 0 0 0 0 0 0 0 0 0 0 0 0 0 0 0 0 0 - 40
D. Non-energy products from fuels and solvent use 0 0 0 0 0 0 0 0 0 0 0 0 0 0 0 0 0 0 0 0 0 0 0 0 0 0 0 - 2
E. Electronic industry
F. Product uses as ODS substitutes
G. Other product manufacture and use 19 19 19 19 19 19 19 19 19 19 18 18 17 17 16 16 16 16 16 16 15 14 14 14 13 12 11 - 41
H. Other 0 0 0 0 0 0 0 0 0 0 0 0 0 0 0 0 0 0 0 0 0 0 0 0 0 0 0 29
3. Agriculture 763 763 718 682 665 656 662 664 668 664 663 655 646 636 624 635 619 614 614 616 600 598 603 599 609 620 621 - 19
A. Enteric fermentation
B. Manure management 99 99 95 91 88 84 84 83 82 82 81 79 79 78 77 76 76 75 75 74 73 72 71 70 69 70 70 - 29
C. Rice cultivation
D. Agricultural soils 661 661 621 588 575 569 576 578 583 579 580 574 566 557 545 557 541 537 537 540 526 525 530 527 538 549 549 - 17
E. Prescribed burning of savannas NO NO NO NO NO NO NO NO NO NO NO NO NO NO NO NO NO NO NO NO NO NO NO NO NO NO NO 0
F. Field burning of agricultural residues 2 2 2 3 2 2 2 2 2 2 2 2 1 1 1 1 1 1 1 1 1 1 1 1 1 1 1 - 65
G. Liming
H. Urea application
I. Other carbon containing fertlizers
J. Other 0 0 0 0 0 0 0 0 0 0 0 0 0 0 0 0 1 1 1 1 1 1 1 1 1 1 1 151
4. Land use, land-use change and forestry 44 44 45 44 46 46 45 45 45 45 44 46 44 44 45 44 44 44 45 44 45 45 46 46 45 46 46 5
A. Forest land 14 14 14 14 14 15 14 15 14 14 14 15 14 14 14 14 14 14 14 14 14 14 14 14 14 14 14 - 2
B. Cropland 15 15 15 15 15 15 15 15 15 15 15 14 14 14 13 13 13 13 13 13 13 13 13 13 13 13 13 - 17
C. Grassland 3 3 3 2 3 3 2 2 2 3 2 3 2 2 2 2 2 2 3 2 2 2 2 3 1 2 2 - 45
D. Wetlands 1 1 1 1 1 1 1 1 1 1 1 1 1 1 1 1 1 1 1 1 1 1 1 1 1 1 1 21
E. Settlements 6 6 7 7 8 7 7 7 7 7 7 7 8 8 8 8 8 9 9 9 9 9 9 10 10 11 11 83
F. Other land 2 2 2 2 3 3 3 3 3 3 3 3 4 4 4 4 4 4 4 4 4 4 4 4 4 4 4 85
G. Harvested wood products
H. Other 0 0 0 0 0 0 0 0 0 0 0 0 0 0 0 0 0 0 0 1 1 1 1 1 1 1 1 42
5. Waste 30 30 30 30 29 29 29 30 30 31 31 32 32 33 33 33 34 34 34 34 35 36 36 36 36 36 36 20
A. Solid waste disposal
B. Biological treatment of solid waste 1 1 1 1 1 2 2 2 3 3 4 4 5 5 6 6 6 7 7 7 8 9 9 9 9 10 10 784
C. Incineration and open burning of waste 2 2 2 2 2 2 2 2 2 2 2 2 2 2 2 2 2 2 2 2 2 2 2 2 2 2 2 - 2
D. Waste water treatment and discharge 27 27 27 26 26 26 25 25 25 25 25 26 25 25 25 25 25 25 25 25 25 25 25 24 24 25 25 - 11
E. Other NO NO NO NO NO NO 0 0 0 0 0 0 0 0 0 0 0 0 0 0 0 0 0 0 0 0 0 100
6. Other (as specified in summary 1.A) NO NO NO NO NO NO NO NO NO NO NO NO NO NO NO NO NO NO NO NO NO NO NO NO NO NO NO 0
Total direct N2O emissions without N2O from LULUCF 1 294 1 294 1 231 1 184 1 151 1 158 1 168 1 186 1 176 1 102 1 033 1 026 1 014 977 968 983 958 923 925 890 839 804 790 781 782 790 793 - 39
Total direct N2O emissions with N2O from LULUCF 1 338 1 338 1 276 1 228 1 197 1 205 1 213 1 231 1 220 1 147 1 077 1 072 1 058 1 021 1 012 1 027 1 002 967 970 934 884 849 836 827 827 836 840 - 37
Memo items:
International bunkers 5 5 5 6 6 6 6 6 7 7 7 8 8 7 8 8 8 9 9 9 8 8 8 8 8 8 8 46
Aviation 2 2 2 2 2 2 3 3 3 3 3 3 3 3 3 4 4 4 4 4 4 4 4 4 4 4 4 106
Navigation 3 3 3 3 4 4 4 4 4 4 4 4 4 4 4 4 4 5 5 5 4 4 4 4 4 4 4 9
Multilateral operations 0 0 0 0 0 0 0 0 0 0 0 0 0 0 0 0 0 0 0 0 0 0 0 0 0 0 0 66 630
CO2 emissions from biomass
CO2 captured
Long-term storage of C in waste disposal sites
Indirect N2O 72 72 67 64 61 58 56 53 52 50 48 45 45 44 43 44 43 42 41 41 38 38 37 36 36 35 36 - 49
Indirect CO2 (3)
GREENHOUSE GAS SOURCE AND SINK CATEGORIES
(kt)

188
Emission trends for EU-28+ISL: HFCs, PFCs, SF6, and NF3
Base year(1) 1990 1991 1992 1993 1994 1995 1996 1997 1998 1999 2000 2001 2002 2003 2004 2005 2006 2007 2008 2009 2010 2011 2012 2013 2014 2015
Change from
base to latest
reported year
%
Emissions of HFCs and PFCs - (kt CO2 equivalent) 61 332 61 332 58 425 56 291 58 187 62 132 66 707 71 725 78 322 79 142 70 224 67 440 65 268 70 876 74 572 76 738 81 759 85 581 91 165 97 828 99 204 107 033 109 520 112 305 114 845 116 819 111 859 82
Emissions of HFCs - (kt CO2 equivalent) 29 126 29 126 29 149 31 575 34 500 39 145 43 752 50 963 58 839 60 510 52 183 53 306 52 622 56 395 63 177 67 070 73 423 77 827 84 014 91 265 94 442 102 494 104 938 108 233 110 512 112 997 107 937 271
HFC-23 2 2 2 2 2 2 2 3 3 3 2 1 1 1 1 0 0 0 0 0 0 0 0 0 0 0 0 - 95
HFC-32 0 0 0 0 0 0 0 0 0 0 0 0 0 1 1 1 1 1 2 2 2 3 3 3 4 4 4 21 594 114
HFC-41 NO NO NO NO NO NO NO NO NO NO NO NO NO NO NO NO NO NO NO NO NO NO NO NO NO NO NO 0
HFC-43-10mee NO,IE NO,IE NO,IE NO,IE NO,IE NO,IE NO,IE NO,IE NO,IE NO,IE NO,IE 0 0 0 0 0 0 0 0 0 0 0 0 0 0 0 0 100
HFC-125 0 0 0 0 0 0 0 0 1 1 1 2 2 3 3 4 5 5 6 7 7 8 9 9 10 10 10 113 089
HFC-134 NO NO NO NO NO NO NO NO NO NO NO NO NO NO NO NO NO NO NO NO NO NO NO NO NO NO NO 0
HFC-134a 0 0 0 1 3 3 4 6 8 10 11 13 15 16 18 20 22 23 25 26 26 27 27 27 28 28 28 573 767
HFC-143 NO NO NO NO NO NO NO NO NO NO NO NO NO NO NO NO NO NO NO NO NO NO NO NO NO NO NO 0
HFC-143a 1 1 1 0 0 0 0 0 0 1 1 2 2 2 3 3 4 4 5 5 5 6 6 6 6 6 6 1 066
HFC-152 NO NO NO NO NO NO NO NO NO NO NO NO NO NO NO NO NO NO NO NO NO NO NO NO NO NO NO 0
HFC-152a 0 0 0 0 0 0 1 1 1 1 1 2 3 4 4 4 3 4 4 4 4 4 4 4 3 3 3 1 986 781
HFC-161 NO NO NO NO NO NO NO NO NO NO NO NO NO NO NO NO NO NO NO NO NO NO NO NO NO NO NO 0
HFC-227ea NO,NE,IE NO,NE,IE NO,NE,IE NO,NE,IE 0 0 0 0 0 0 0 0 0 0 0 0 0 0 0 0 0 0 0 0 0 0 0 100
HFC-236cb NO NO NO NO NO NO NO NO NO NO NO NO NO NO NO NO NO NO NO NO NO NO NO NO NO NO NO 0
HFC-236ea NO NO NO NO NO NO NO NO NO NO NO NO NO NO NO NO NO NO NO NO NO NO NO NO NO NO NO 0
HFC-236fa NO NO NO NO NO NO NO NO 0 0 0 0 0 0 0 0 0 0 0 0 0 0 0 0 0 0 0 100
HFC-245ca NO NO NO NO NO NO NO NO NO NO NO NO NO NO NO NO NO NO NO NO NO NO NO NO NO NO NO 0
HFC-245fa NO,NE,IE NO,NE,IE NO,NE,IE NO,NE,IE NO,NE,IE NO,NE,IE 0 0 0 0 0 0 0 0 0 0 0 0 0 0 0 0 0 0 0 0 1 100
HFC-365mfc NO,NE,IE NO,NE,IE NO,NE,IE NO,NE,IE NO,NE,IE NO,NE,IE NO,NE,IE NO,NE,IE NO,NE,IE 0 0 0 0 0 0 1 1 1 1 0 0 0 0 0 0 0 0 100
Unspecified mix of HFCs(4)
- (kt CO2 equivalent) 2 2 4 6 37 154 250 608 1 427 1 295 1 117 913 648 478 453 485 501 553 657 752 691 674 899 957 878 784 739 30 077
Emissions of PFCs - (kt CO2 equivalent) 26 365 26 365 23 907 19 366 18 347 17 660 17 347 16 634 15 500 14 778 14 390 12 338 10 948 12 645 10 354 8 780 7 384 6 951 6 424 5 631 3 533 4 050 4 320 3 794 4 047 3 601 3 680 - 86
CF4 2 2 2 2 2 1 2 1 1 1 1 1 1 1 1 1 1 1 1 0 0 0 0 0 0 0 0 - 88
C2F6 1 1 0 0 0 0 0 0 0 0 0 0 0 0 0 0 0 0 0 0 0 0 0 0 0 0 0 - 94
C3F8 0 0 0 0 0 0 0 0 0 0 0 0 0 0 0 0 0 0 0 0 0 0 0 0 0 0 0 - 16
C4F10 0 0 0 0 0 0 0 0 0 0 0 0 0 0 0 0 0 0 0 0 0 0 0 0 0 0 0 - 35
c-C4F8 0 0 0 0 0 0 0 0 0 0 0 0 0 0 0 0 0 0 0 0 0 0 0 0 0 0 0 - 62
C5F12 0 0 0 0 0 0 0 0 0 0 0 0 0 0 0 0 0 0 0 0 0 0 0 0 0 0 0 - 100
C6F14 0 0 0 0 0 0 0 0 0 0 0 0 0 0 0 0 0 0 0 0 0 0 0 0 0 0 0 - 66
C10F18 NO NO NO NO NO NO NO NO NO NO NO NO NO NO NO NO NO NO NO NO NO NO NO NO NO NO NO 0
c-C3F6 NO NO NO NO NO NO NO NO NO NO NO NO NO NO NO NO NO NO NO NO NO NO NO NO NO NO NO 0
Unspecified mix of PFCs(4)
- (kt CO2 equivalent) 314 314 328 343 406 398 556 481 440 405 472 510 532 480 601 661 744 744 840 782 634 708 734 756 680 593 550 75
Unspecified mix of HFCs and PFCs - (kt CO2
equivalent)
5 841 5 841 5 369 5 350 5 340 5 327 5 609 4 128 3 983 3 853 3 651 1 796 1 698 1 835 1 042 887 952 803 727 933 1 229 489 262 278 285 220 242 - 96
Emissions of SF6 - (kt CO2 equivalent) 11 004 11 004 11 459 12 283 12 968 14 143 15 194 15 065 13 582 12 846 10 546 10 587 9 733 8 596 8 107 8 114 7 924 7 493 7 085 6 711 6 309 6 436 6 219 6 277 6 191 6 138 6 415 - 42
SF6 0 0 1 1 1 1 1 1 1 1 0 0 0 0 0 0 0 0 0 0 0 0 0 0 0 0 0 - 42
Emissions of NF3 - (kt CO2 equivalent) 24 24 25 27 29 32 100 94 102 77 75 103 82 134 147 132 156 141 163 149 77 119 127 93 68 74 69 191
NF3 0 0 0 0 0 0 0 0 0 0 0 0 0 0 0 0 0 0 0 0 0 0 0 0 0 0 0 191
GREENHOUSE GAS SOURCE AND SINK
CATEGORIES(kt)
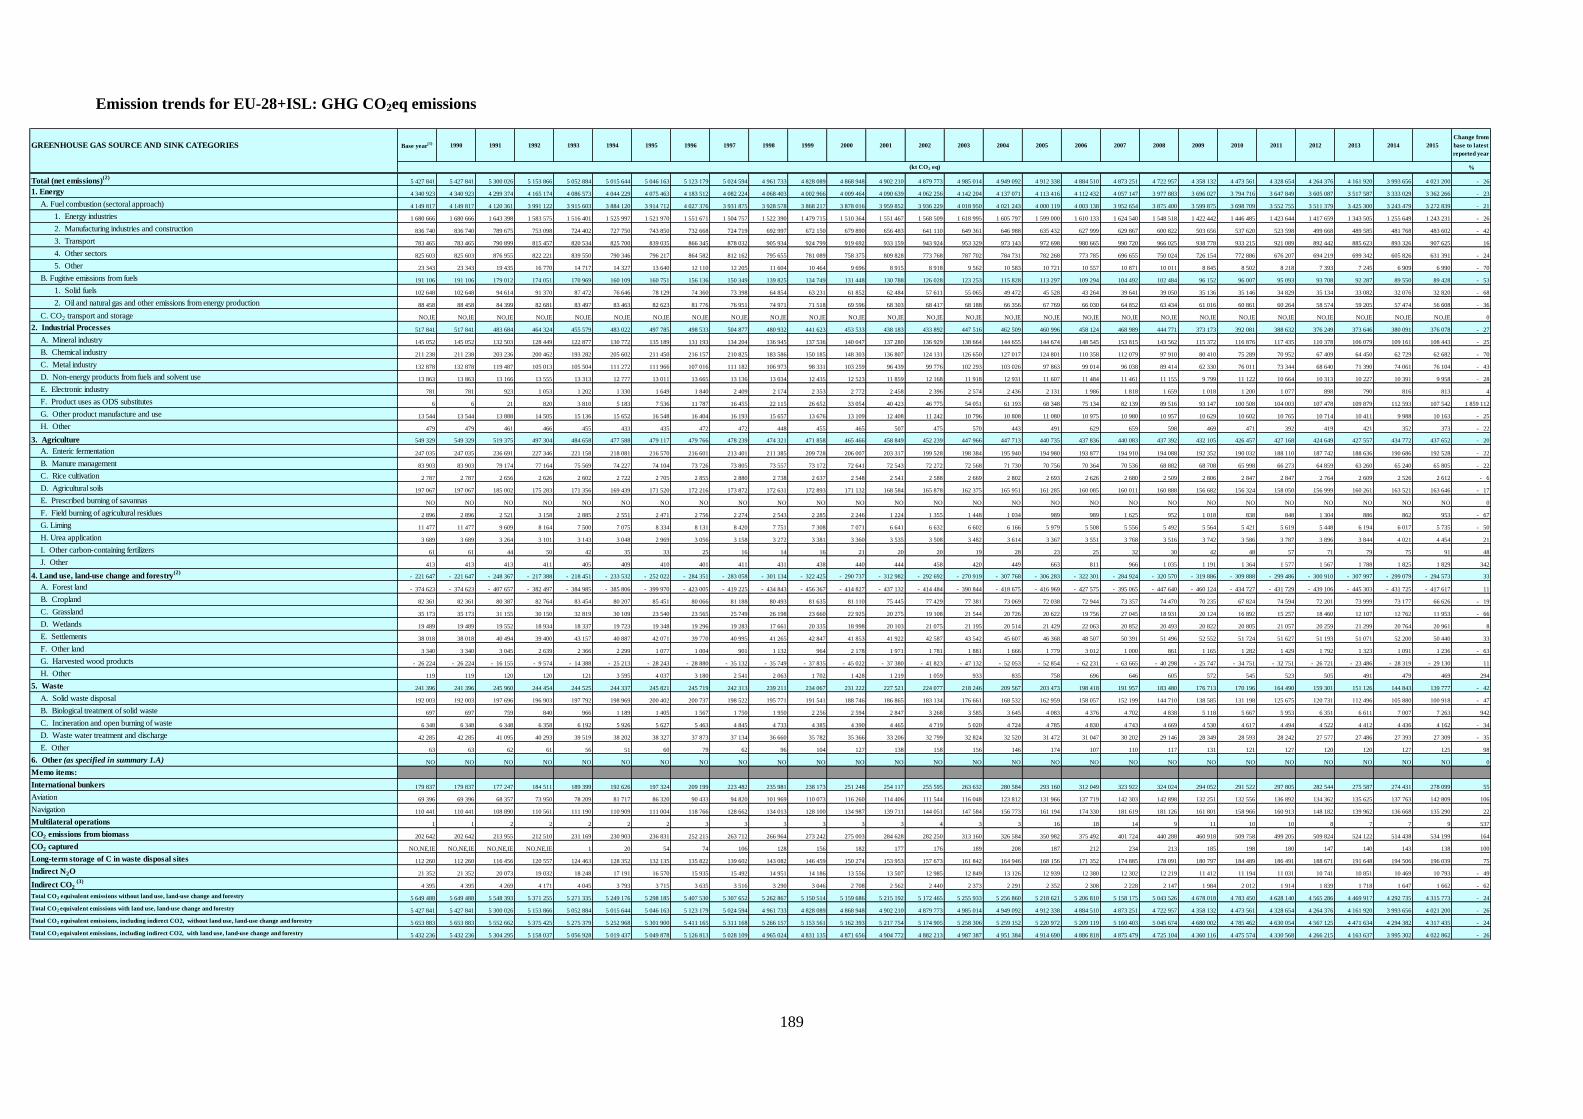
189
Emission trends for EU-28+ISL: GHG CO2eq emissions
GREENHOUSE GAS SOURCE AND SINK CATEGORIES Base year(1) 1990 1991 1992 1993 1994 1995 1996 1997 1998 1999 2000 2001 2002 2003 2004 2005 2006 2007 2008 2009 2010 2011 2012 2013 2014 2015
Change from
base to latest
reported year
%
Total (net emissions)(2)
5 427 841 5 427 841 5 300 026 5 153 866 5 052 884 5 015 644 5 046 163 5 123 179 5 024 594 4 961 733 4 828 089 4 868 948 4 902 210 4 879 773 4 985 014 4 949 092 4 912 338 4 884 510 4 873 251 4 722 957 4 358 132 4 473 561 4 328 654 4 264 376 4 161 920 3 993 656 4 021 200 - 26
1. Energy 4 340 923 4 340 923 4 299 374 4 165 174 4 086 573 4 044 229 4 075 463 4 183 512 4 082 224 4 068 403 4 002 966 4 009 464 4 090 639 4 062 256 4 142 204 4 137 071 4 113 416 4 112 432 4 057 147 3 977 883 3 696 027 3 794 716 3 647 849 3 605 087 3 517 587 3 333 029 3 362 266 - 23
A. Fuel combustion (sectoral approach) 4 149 817 4 149 817 4 120 361 3 991 122 3 915 603 3 884 120 3 914 712 4 027 376 3 931 875 3 928 578 3 868 217 3 878 016 3 959 852 3 936 229 4 018 950 4 021 243 4 000 119 4 003 138 3 952 654 3 875 400 3 599 875 3 698 709 3 552 755 3 511 379 3 425 300 3 243 479 3 272 839 - 21
1. Energy industries 1 680 666 1 680 666 1 643 398 1 583 575 1 516 401 1 525 997 1 521 970 1 551 671 1 504 757 1 522 390 1 479 715 1 510 364 1 551 467 1 568 509 1 618 995 1 605 797 1 599 000 1 610 133 1 624 540 1 548 518 1 422 442 1 446 485 1 423 644 1 417 659 1 343 505 1 255 649 1 243 231 - 26
2. Manufacturing industries and construction 836 740 836 740 789 675 753 098 724 402 727 750 743 850 732 668 724 719 692 997 672 150 679 890 656 483 641 110 649 361 646 988 635 432 627 999 629 867 600 822 503 656 537 620 523 598 499 668 489 585 481 768 483 602 - 42
3. Transport 783 465 783 465 790 899 815 457 820 534 825 700 839 035 866 345 878 032 905 934 924 799 919 692 933 159 943 924 953 329 973 143 972 698 980 665 990 720 966 025 938 778 933 215 921 089 892 442 885 623 893 326 907 625 16
4. Other sectors 825 603 825 603 876 955 822 221 839 550 790 346 796 217 864 582 812 162 795 655 781 089 758 375 809 828 773 768 787 702 784 731 782 268 773 785 696 655 750 024 726 154 772 886 676 207 694 219 699 342 605 826 631 391 - 24
5. Other 23 343 23 343 19 435 16 770 14 717 14 327 13 640 12 110 12 205 11 604 10 464 9 696 8 915 8 918 9 562 10 583 10 721 10 557 10 871 10 011 8 845 8 502 8 218 7 393 7 245 6 909 6 990 - 70
B. Fugitive emissions from fuels 191 106 191 106 179 012 174 051 170 969 160 109 160 751 156 136 150 349 139 825 134 749 131 448 130 788 126 028 123 253 115 828 113 297 109 294 104 492 102 484 96 152 96 007 95 093 93 708 92 287 89 550 89 428 - 53
1. Solid fuels 102 648 102 648 94 614 91 370 87 472 76 646 78 129 74 360 73 398 64 854 63 231 61 852 62 484 57 611 55 065 49 472 45 528 43 264 39 641 39 050 35 136 35 146 34 829 35 134 33 082 32 076 32 820 - 68
2. Oil and natural gas and other emissions from energy production 88 458 88 458 84 399 82 681 83 497 83 463 82 623 81 776 76 951 74 971 71 518 69 596 68 303 68 417 68 188 66 356 67 769 66 030 64 852 63 434 61 016 60 861 60 264 58 574 59 205 57 474 56 608 - 36
C. CO2 transport and storage NO,IE NO,IE NO,IE NO,IE NO,IE NO,IE NO,IE NO,IE NO,IE NO,IE NO,IE NO,IE NO,IE NO,IE NO,IE NO,IE NO,IE NO,IE NO,IE NO,IE NO,IE NO,IE NO,IE NO,IE NO,IE NO,IE NO,IE 0
2. Industrial Processes 517 841 517 841 483 684 464 324 455 579 483 022 497 785 498 533 504 877 480 932 441 623 453 533 438 183 433 892 447 516 462 509 460 996 458 124 468 989 444 771 373 173 392 081 388 632 376 249 373 646 380 091 376 078 - 27
A. Mineral industry 145 052 145 052 132 503 128 449 122 877 130 772 135 189 131 193 134 204 136 945 137 536 140 047 137 280 136 929 138 664 144 655 144 674 148 545 153 815 143 562 115 372 116 876 117 435 110 378 106 079 109 161 108 443 - 25
B. Chemical industry 211 238 211 238 203 236 200 462 193 282 205 602 211 450 216 157 210 825 183 586 150 185 148 303 136 807 124 131 126 650 127 017 124 801 110 358 112 079 97 910 80 410 75 289 70 952 67 409 64 450 62 729 62 682 - 70
C. Metal industry 132 878 132 878 119 487 105 013 105 504 111 272 111 966 107 016 111 182 106 973 98 331 103 259 96 439 99 776 102 293 103 026 97 863 99 014 96 038 89 414 62 330 76 011 73 344 68 640 71 390 74 061 76 104 - 43
D. Non-energy products from fuels and solvent use 13 863 13 863 13 166 13 555 13 313 12 777 13 011 13 665 13 136 13 034 12 435 12 523 11 859 12 168 11 918 12 931 11 607 11 484 11 461 11 155 9 799 11 122 10 664 10 313 10 227 10 391 9 958 - 28
E. Electronic industry 781 781 923 1 053 1 202 1 330 1 649 1 840 2 409 2 174 2 353 2 772 2 458 2 396 2 574 2 436 2 131 1 986 1 818 1 659 1 018 1 200 1 077 898 790 816 813 4
F. Product uses as ODS substitutes 6 6 21 820 3 810 5 183 7 536 11 787 16 455 22 115 26 652 33 054 40 423 46 775 54 051 61 193 68 348 75 134 82 139 89 516 93 147 100 508 104 003 107 478 109 879 112 593 107 542 1 859 112
G. Other product manufacture and use 13 544 13 544 13 888 14 505 15 136 15 652 16 548 16 404 16 193 15 657 13 676 13 109 12 408 11 242 10 796 10 808 11 080 10 975 10 980 10 957 10 629 10 602 10 765 10 714 10 411 9 988 10 163 - 25
H. Other 479 479 461 466 455 433 435 472 472 448 455 465 507 475 570 443 491 629 659 598 469 471 392 419 421 352 373 - 22
3. Agriculture 549 329 549 329 519 375 497 304 484 658 477 588 479 117 479 766 478 239 474 321 471 858 465 466 458 849 452 239 447 966 447 713 440 735 437 836 440 083 437 392 432 105 426 457 427 168 424 649 427 557 434 772 437 652 - 20
A. Enteric fermentation 247 035 247 035 236 691 227 346 221 158 218 081 216 570 216 601 213 401 211 385 209 728 206 007 203 317 199 528 198 384 195 940 194 980 193 877 194 910 194 088 192 352 190 032 188 110 187 742 188 636 190 686 192 528 - 22
B. Manure management 83 903 83 903 79 174 77 164 75 569 74 227 74 104 73 726 73 805 73 557 73 172 72 641 72 543 72 272 72 568 71 730 70 756 70 364 70 536 68 882 68 708 65 998 66 273 64 859 63 260 65 240 65 805 - 22
C. Rice cultivation 2 787 2 787 2 656 2 626 2 602 2 722 2 705 2 855 2 880 2 738 2 637 2 548 2 541 2 588 2 669 2 802 2 693 2 626 2 680 2 509 2 806 2 847 2 847 2 764 2 609 2 526 2 612 - 6
D. Agricultural soils 197 067 197 067 185 002 175 283 171 356 169 439 171 520 172 216 173 872 172 631 172 893 171 132 168 584 165 878 162 375 165 951 161 285 160 085 160 011 160 888 156 682 156 324 158 050 156 999 160 261 163 521 163 646 - 17
E. Prescribed burning of savannas NO NO NO NO NO NO NO NO NO NO NO NO NO NO NO NO NO NO NO NO NO NO NO NO NO NO NO 0
F. Field burning of agricultural residues 2 896 2 896 2 521 3 158 2 885 2 551 2 471 2 756 2 274 2 543 2 285 2 246 1 224 1 355 1 448 1 034 989 989 1 625 952 1 018 838 848 1 304 886 862 953 - 67
G. Liming 11 477 11 477 9 609 8 164 7 500 7 075 8 334 8 131 8 420 7 751 7 308 7 071 6 641 6 632 6 602 6 166 5 979 5 508 5 556 5 492 5 564 5 421 5 619 5 448 6 194 6 017 5 735 - 50
H. Urea application 3 689 3 689 3 264 3 101 3 143 3 048 2 969 3 056 3 158 3 272 3 381 3 360 3 535 3 508 3 482 3 614 3 367 3 551 3 768 3 516 3 742 3 586 3 787 3 896 3 844 4 021 4 454 21
I. Other carbon-containing fertilizers 61 61 44 50 42 35 33 25 16 14 16 21 20 20 19 28 23 25 32 30 42 48 57 71 79 75 91 48
J. Other 413 413 413 411 405 409 410 401 411 431 438 440 444 458 420 449 663 811 966 1 035 1 191 1 364 1 577 1 567 1 788 1 825 1 829 342
4. Land use, land-use change and forestry(2)
- 221 647 - 221 647 - 248 367 - 217 388 - 218 451 - 233 532 - 252 022 - 284 351 - 283 058 - 301 134 - 322 425 - 290 737 - 312 982 - 292 692 - 270 919 - 307 768 - 306 283 - 322 301 - 284 924 - 320 570 - 319 886 - 309 888 - 299 486 - 300 910 - 307 997 - 299 079 - 294 573 33
A. Forest land - 374 623 - 374 623 - 407 657 - 382 497 - 384 985 - 385 806 - 399 970 - 423 005 - 419 225 - 434 843 - 456 367 - 414 827 - 437 132 - 414 484 - 390 844 - 418 675 - 416 969 - 427 575 - 395 065 - 447 640 - 460 124 - 434 727 - 431 729 - 439 106 - 445 303 - 431 725 - 417 617 11
B. Cropland 82 361 82 361 80 387 82 764 83 454 80 207 85 451 80 066 81 188 80 493 81 635 81 110 75 445 77 429 77 381 73 069 72 038 72 944 73 357 74 470 70 235 67 824 74 594 72 201 73 999 73 177 66 626 - 19
C. Grassland 35 173 35 173 31 155 30 150 32 819 30 109 23 540 23 565 25 749 26 198 23 660 22 925 20 275 19 108 21 544 20 726 20 622 19 756 27 045 18 931 20 124 16 892 15 257 18 460 12 107 12 762 11 953 - 66
D. Wetlands 19 489 19 489 19 552 18 934 18 337 19 723 19 348 19 296 19 283 17 661 20 335 18 998 20 103 21 075 21 195 20 514 21 429 22 063 20 852 20 493 20 822 20 805 21 057 20 259 21 299 20 764 20 961 8
E. Settlements 38 018 38 018 40 494 39 400 43 157 40 887 42 071 39 770 40 995 41 265 42 847 41 853 41 922 42 587 43 542 45 607 46 368 48 507 50 391 51 496 52 552 51 724 51 627 51 193 51 071 52 200 50 440 33
F. Other land 3 340 3 340 3 045 2 639 2 366 2 299 1 077 1 004 901 1 132 964 2 178 1 971 1 781 1 881 1 666 1 779 3 012 1 000 861 1 165 1 282 1 429 1 792 1 323 1 091 1 236 - 63
G. Harvested wood products - 26 224 - 26 224 - 16 155 - 9 574 - 14 388 - 25 213 - 28 243 - 28 880 - 35 132 - 35 749 - 37 835 - 45 022 - 37 380 - 41 823 - 47 132 - 52 053 - 52 854 - 62 231 - 63 665 - 40 298 - 25 747 - 34 751 - 32 751 - 26 721 - 23 486 - 28 319 - 29 130 11
H. Other 119 119 120 120 121 3 595 4 037 3 180 2 541 2 063 1 702 1 428 1 219 1 059 933 835 758 696 646 605 572 545 523 505 491 479 469 294
5. Waste 241 396 241 396 245 960 244 454 244 525 244 337 245 821 245 719 242 313 239 211 234 067 231 222 227 521 224 077 218 246 209 567 203 473 198 418 191 957 183 480 176 713 170 196 164 490 159 301 151 126 144 843 139 777 - 42
A. Solid waste disposal 192 003 192 003 197 696 196 903 197 792 198 969 200 402 200 737 198 522 195 771 191 541 188 746 186 865 183 134 176 661 168 532 162 959 158 057 152 199 144 710 138 585 131 198 125 675 120 731 112 496 105 880 100 918 - 47
B. Biological treatment of solid waste 697 697 759 840 966 1 189 1 405 1 567 1 750 1 950 2 256 2 594 2 847 3 268 3 585 3 645 4 083 4 376 4 702 4 838 5 118 5 667 5 953 6 351 6 611 7 007 7 263 942
C. Incineration and open burning of waste 6 348 6 348 6 348 6 358 6 192 5 926 5 627 5 463 4 845 4 733 4 385 4 390 4 465 4 719 5 020 4 724 4 785 4 830 4 743 4 669 4 530 4 617 4 494 4 522 4 412 4 436 4 162 - 34
D. Waste water treatment and discharge 42 285 42 285 41 095 40 293 39 519 38 202 38 327 37 873 37 134 36 660 35 782 35 366 33 206 32 799 32 824 32 520 31 472 31 047 30 202 29 146 28 349 28 593 28 242 27 577 27 486 27 393 27 309 - 35
E. Other 63 63 62 61 56 51 60 79 62 96 104 127 138 158 156 146 174 107 110 117 131 121 127 120 120 127 125 98
6. Other (as specified in summary 1.A) NO NO NO NO NO NO NO NO NO NO NO NO NO NO NO NO NO NO NO NO NO NO NO NO NO NO NO 0
Memo items:
International bunkers 179 837 179 837 177 247 184 511 189 399 192 626 197 324 209 199 223 482 235 981 238 173 251 248 254 117 255 595 263 632 280 584 293 160 312 049 323 922 324 024 294 052 291 522 297 805 282 544 275 587 274 431 278 099 55
Aviation 69 396 69 396 68 357 73 950 78 209 81 717 86 320 90 433 94 820 101 969 110 073 116 260 114 406 111 544 116 048 123 812 131 966 137 719 142 303 142 898 132 251 132 556 136 892 134 362 135 625 137 763 142 809 106
Navigation 110 441 110 441 108 890 110 561 111 190 110 909 111 004 118 766 128 662 134 013 128 100 134 987 139 711 144 051 147 584 156 773 161 194 174 330 181 619 181 126 161 801 158 966 160 913 148 182 139 962 136 668 135 290 22
Multilateral operations 1 1 2 2 2 2 2 3 3 3 3 3 3 4 3 3 16 18 14 9 11 10 10 8 7 7 9 537
CO2 emissions from biomass 202 642 202 642 213 955 212 510 231 169 230 903 236 831 252 215 263 712 266 964 273 242 275 003 284 628 282 250 313 160 326 584 350 982 375 492 401 724 440 288 460 918 509 758 499 205 509 824 524 122 514 438 534 199 164
CO2 captured NO,NE,IE NO,NE,IE NO,NE,IE NO,NE,IE 1 20 54 74 106 128 156 182 177 176 189 208 187 212 234 213 185 198 180 147 140 143 138 100
Long-term storage of C in waste disposal sites 112 260 112 260 116 456 120 557 124 463 128 352 132 135 135 822 139 602 143 082 146 459 150 274 153 953 157 673 161 842 164 946 168 156 171 352 174 885 178 091 180 797 184 489 186 491 188 671 191 648 194 506 196 039 75
Indirect N2O 21 352 21 352 20 073 19 032 18 248 17 191 16 570 15 935 15 492 14 951 14 186 13 556 13 507 12 985 12 849 13 126 12 939 12 380 12 302 12 219 11 412 11 194 11 031 10 741 10 851 10 469 10 793 - 49
Indirect CO2 (3)
4 395 4 395 4 269 4 171 4 045 3 793 3 715 3 635 3 516 3 290 3 046 2 708 2 562 2 440 2 373 2 291 2 352 2 308 2 228 2 147 1 984 2 012 1 914 1 839 1 718 1 647 1 662 - 62
Total CO2 equivalent emissions without land use, land-use change and forestry 5 649 488 5 649 488 5 548 393 5 371 255 5 271 335 5 249 176 5 298 185 5 407 530 5 307 652 5 262 867 5 150 514 5 159 686 5 215 192 5 172 465 5 255 933 5 256 860 5 218 621 5 206 810 5 158 175 5 043 526 4 678 018 4 783 450 4 628 140 4 565 286 4 469 917 4 292 735 4 315 773 - 24
Total CO2 equivalent emissions with land use, land-use change and forestry 5 427 841 5 427 841 5 300 026 5 153 866 5 052 884 5 015 644 5 046 163 5 123 179 5 024 594 4 961 733 4 828 089 4 868 948 4 902 210 4 879 773 4 985 014 4 949 092 4 912 338 4 884 510 4 873 251 4 722 957 4 358 132 4 473 561 4 328 654 4 264 376 4 161 920 3 993 656 4 021 200 - 26
Total CO2 equivalent emissions, including indirect CO2, without land use, land-use change and forestry 5 653 883 5 653 883 5 552 662 5 375 425 5 275 379 5 252 968 5 301 900 5 411 165 5 311 168 5 266 157 5 153 561 5 162 393 5 217 754 5 174 905 5 258 306 5 259 152 5 220 972 5 209 119 5 160 403 5 045 674 4 680 002 4 785 462 4 630 054 4 567 125 4 471 634 4 294 382 4 317 435 - 24
Total CO2 equivalent emissions, including indirect CO2, with land use, land-use change and forestry 5 432 236 5 432 236 5 304 295 5 158 037 5 056 928 5 019 437 5 049 878 5 126 813 5 028 109 4 965 024 4 831 135 4 871 656 4 904 772 4 882 213 4 987 387 4 951 384 4 914 690 4 886 818 4 875 479 4 725 104 4 360 116 4 475 574 4 330 568 4 266 215 4 163 637 3 995 302 4 022 862 - 26
(kt CO2 eq)

190
APPENDIX III: MAIN EU PROGRAMMES ON RESEARCH AND SYSTEMATIC OBSERVATION
Section Project Acronym Project Title Project
End Date
EC Contribution International
Cooperation
i.e. EU -
nonEU?
WEBSITE
8.3.5 A2PBEER (FP7) Affordable and Adaptable
Public Buildings through
Energy Efficient Retrofitting
08/2017 € 6 500 000 No www.a2pbeer.eu
ADDRESS Active Distribution networks
with full integration of
Demand and distributed
energy RESourceS
05/2013 € 8.999.997 No http://www.addressfp7.org/
8.3.4 ADVANCE Advanced Model
Development and Validation
for the Improved Analysis of
Costs and Impacts of
Mitigation Policies
12/2016 € 5 699 168 No http://www.fp7-advance.eu/
8.3.2 APPLICATE Advanced Prediction in
Polar regions and beyond:
Modelling, observing system
design and LInkages
associated with ArctiC
ClimATE change
10/2020 € 7 999 591 Yes http://applicate.eu/about-the-project
8.4.5 AtlantOS Optimizing and Enhancing
the Integrated Atlantic
Ocean Observing System
06/2019 € 20 652 921 Yes https://www.atlantos-h2020.eu/

191
Section Project Acronym Project Title Project
End Date
EC Contribution International
Cooperation
i.e. EU -
nonEU?
WEBSITE
8.3.2 BACCHUS Impact of Biogenic versus
Anthropogenic emissions
on Clouds and Climate:
towards a Holistic
UnderStanding
05/2018 € 8 746 587 Yes http://www.bacchus-env.eu/
8.4.7 BE-OI Beyond EPICA - Oldest Ice 09/2019 € 2 223 000 Yes http://www.beyondepica.eu/
8.3.4 BINGO Bringing INnovation to
onGOing water management
– A better future under
climate change
06/2019 € 7 822 423 No http://www.projectbingo.eu/
8.3.5 BIOBOOST Biomass based energy
intermediates boosting
biofuel production
06/2015 € 5 088 531 No http://www.bioboost.eu/home.php
8.3.5 BIOBUILD (FP7) High Performance,
Economical and Sustainable
Biocomposite Building
Materials
05/2015 € 4 878 496 No www.biobuildproject.eu
8.3.2 Blue-Action Arctic Impact on Weather
and Climate
02/2021 € 7 500 000 Yes http://www.blue-action.eu/index.php?id=3498
8.3.5 BRESAER (H2020) Breakthrough solutions for
adaptable envelopes for
building refurbishment
07/2019 € 5 849 107 No www.bresaer.eu
8.3.5 CAMPUS21 (FP7) Control & Automation
Management of Buildings &
Public Spaces in the 21st
Century
05/2015 € 2 286 091 No www.campus21-project.eu
192
Section Project Acronym Project Title Project
End Date
EC Contribution International
Cooperation
i.e. EU -
nonEU?
WEBSITE
8.3.4. CARBON CAP Carbon emission mitigation
by Consumption-based
Accounting and Policy
12/2016 € 3 573 912 No http://www.carboncap.eu/
8.3.5 CD-LINKS Linking Climate and
Development Policies -
Leveraging International
Networks and Knowledge
Sharing
08/2019 € 5 037 963 Yes http://www.cd-links.org/
8.3.5 CHIC Clean Hydrogen in
European Cities
12/2016 € 25 878 334 No http://chic-project.eu/
8.3.5 CLAiR-CITY Citizen Led Air pollution
Reduction in Cities
04/2020 € 6 692 548 No http://www.claircity.eu/
8.3.6 CLARA Climate forecast enabled
knowledge services
05/2020 € 3 459 075 No
8.3.5 CLARITY Integrated Climate
Adaptation Service Tools
for Improving Resilience
Measure Efficiency
€ 4 999 999 No
8.3.6 Climateurope European Climate
Observations, Modelling and
Services - 2
11/2020 € 2 994 373 No
8.3.4 COP21 RIPPLES COP21: Results and
Implications for Pathways
and Policies for Low
Emissions European
Societies
11/2019 € 2 986 924 Yes http://cordis.europa.eu/project/rcn/206263_en.html

193
Section Project Acronym Project Title Project
End Date
EC Contribution International
Cooperation
i.e. EU -
nonEU?
WEBSITE
8.3.1
8.3.2
CRESCENDO Coordinated Research in
Earth Systems and Climate:
Experiments, kNowledge,
Dissemination and Outreach
10/2020 € 14 338 876 No https://www.crescendoproject.eu/
8.3.2 DACCIWA Dynamics-aerosol-
chemistry-cloud interactions
in West Africa
11/2018 € 8 746 951.77 Yes www.dacciwa.eu
8.3.5 DEEPEGS DEPLOYMENT OF DEEP
ENHANCED
GEOTHERMAL SYSTEMS
FOR SUSTAINABLE
ENERGY BUSINESS
11/2019 € 19 999 740 No http://deepegs.eu/
8.3.5 DESCRAMBLE Drilling in supercritical
geothermal condition
04/2018 € 6 753 635 No http://www.descramble-h2020.eu/
8.3.5 Don Quichote Demonstration Of New
Qualitative Innovative
Concept of Hydrogen Out of
windTurbine Electricity
03/2018 € 2 954 846 No http://www.don-quichote.eu/
8.4.1 eartH2Observe Global Earth Observation
for integrated water resource
assessment
12/2017 € 8 869 787 Yes www.earth2observe.eu
8.3.5 ECO-Binder
(H2020)
Development of insulating
concrete systems based on
novel low CO2 binders
12/2018 € 5 846 216 No www.ecobinder-project.eu
8.3.5 ECOGRID EU Large scale Smart Grids
demonstration of real time
market-based integration of
DER and DR
02/2015 € 12 649 939 No http://www.eu-ecogrid.net/

194
Section Project Acronym Project Title Project
End Date
EC Contribution International
Cooperation
i.e. EU -
nonEU?
WEBSITE
8.4.6 ECOPOTENTIAL ECOPOTENTIAL:
IMPROVING FUTURE
ECOSYSTEM BENEFITS
THROUGH EARTH
OBSERVATIONS
05/2019 € 14 874 340 No http://www.ecopotential-project.eu/
8.3.5 EERA-DTOC EERA Design Tools for
Offshore Wind Farm Cluster
06/2015 € 2 899 857 No http://www.eera-dtoc.eu/
8.3.5 e-HIGHWAY2050 Modular Development Plan
of the Pan-European
Transmission System 2050
12/2015 € 8.990.672 No http://www.e-highway2050.eu
8.3.5 3EMOTION Environmentally Friendly,
Efficient Electric Motion
12/2019 € 14 999 983 No http://www.3emotion.eu/
8.3.4 ENHANCE Enhancing risk management
partnerships for catastrophic
natural hazards in Europe
11/2016 € 5 992 084 No http://enhanceproject.eu/
EUCalc EU Calculator: trade-offs
and pathways towards
sustainable and low-carbon
European Societies
10/2019 € 5 283 351 Yes http://www.european-calculator.eu/index.php/9-
uncategorised/71-european-calculator-project
8.3.4 EU-CIRCLE A panEuropean framework
for strengthening Critical
Infrastructure resilience to
climate change
05/2018 € 7 283 525 No http://www.eu-circle.eu/
8.3.6 EU-MACS European Market for
Climate Services
10/2018 € 1 499 621 Yes http://eu-macs.eu/#
EU-PolarNET Yes http://www.eu-polarnet.eu/

195
Section Project Acronym Project Title Project
End Date
EC Contribution International
Cooperation
i.e. EU -
nonEU?
WEBSITE
8.3.2 EUPORIAS EUropean Provision Of
Regional Impact Assessment
on a Seasonal-to-decadal
timescale
01/2017 € 8 976 723.45 Yes www.euporias.eu
8.3.5 EuroBioRef EUROpean multilevel
integrated BIOREFinery
design for sustainable
biomass processin
02/2014 € 23 073 794 No http://www.eurobioref.org/
8.3.5 FLUIDGLASS Solar Thermal Glass
Facades with Adjustable
Transparency
08/2017 € 3.866.050 No http://www.fluidglass.eu/
8.4.1
8.4.8
GEO-CRADLE Coordinating and
integRating state-of-the-art
Earth Observation Activities
in the regions of North
Africa, Middle East, and
Balkans and Developing
Links with GEO related
initiatives towards GEOSS
07/2018 € 2 910 800 Yes
8.3.5 GREEN-WIN Green growth and win-win
strategies for sustainable
climate action
08/2018 € 3 624 763 Yes http://green-win-project.eu/about
8.4.4
8.4.8
Ground Truth 2.0 Ground Truth 2.0 -
Environmental knowledge
discovery of human sensed
data
08/2019 € 4 975 094 No http://gt20.eu/
8.4.6 GROW GROW Observatory 10/2019 € 5 096 920 No http://growobservatory.org/

196
Section Project Acronym Project Title Project
End Date
EC Contribution International
Cooperation
i.e. EU -
nonEU?
WEBSITE
8.3.6 H2020_Insurance Oasis Innovation Hub for
Catastrophe and Climate
Extremes Risk Assessment
04/2020 € 4 802 522 No
8.3.5 HARFIR (FP7) Heusler Alloy replacement
for Iridium
03/2017 € 1 781 910 No www.harfir.eu
8.3.5 H2ME Hydrogen Mobility Europe 05/2020 € 32 000 000 No http://h2me.eu/
8.3.5 HAWE High Altitude Wind Energy 09/2014 € 1 920 470 No http://www.omnidea.net/hawe/
8.3.3 HELIX High-End cLimate Impacts
and eXtremes
10/2017 € 8 999 998 Yes https://www.helixclimate.eu/
8.3.5 HIGH V.LO-CITY Cities speeding up the
integration of hydrogen
buses in public fleets
12/2018 € 13 491 724 No http://highvlocity.eu/
8.3.5 HYDROSOL-
PLANT
Thermochemical
HYDROgen production in a
SOLar monolithic reactor:
construction and operation
of a 750 kWth PLANT
09/2017 € 2 265 385 No http://hydrosol-plant.certh.gr/
8.3.5 HYFIVE Hydrogen For Innovative
Vehicles
09/2017 € 17 970 566 No http://www.hyfive.eu/
8.3.5 HYTRANSIT European Hydrogen Transit
Buses in Scotland
12/2018 € 6 999 999 No http://chic-project.eu/fuel-cell-buses-in-
europe/hytransit
8.3.5 ICARUS Integrated Climate forcing
and Air pollution Reduction
in Urban Systems
04/2020 € 6 472 015 No http://icarus2020.eu/
8.3.4 ICE-ARC Ice, Climate, and Economics
- Arctic Research on Change
12/2017 € 8 874 626 Yes www.ice-arc.eu
197
Section Project Acronym Project Title Project
End Date
EC Contribution International
Cooperation
i.e. EU -
nonEU?
WEBSITE
8.3.5 IMAGE Integrated Methods for
Advanced Geothermal
Exploration
10/2017 € 10 051 044 No http://www.image-fp7.eu/Pages/default.aspx
8.3.4 IMPRESSIONS Impacts and risks from high-
end scenarios: Strategies for
innovative solutions
10/2018 € 8 914 935 Yes http://www.impressions-project.eu
8.3.4 IMPREX IMproving PRedictions and
management of hydrological
EXtremes
09/2019 € 7 996 848 No http://www.imprex.eu/
8.3.4 INNOPATHS Innovation pathways,
strategies and policies for
the Low-Carbon Transition
in Europe
11/2020 € 5 996 716 Yes http://www.innopaths.eu/
8.4.6 INTAROS Integrated Arctic
observation system
11/2021 € 15 490 067 Yes
8.3.5 iSCAPE Improving the Smart Control
of Air Pollution in Europe
08/2019 € 5 850 829 No https://www.iscapeproject.eu/
8.4.6 LANDSENSE A Citizen Observatory and
Innovation Marketplace for
Land Use and Land Cover
Monitoring
08/2020 € 5 088 292 No http://www.landsense.eu/
8.3.5 LAWIN (H2020) LARGE AREA FLUIDIC
WINDOWS
12/2017 € 5 983 039 No http://cordis.europa.eu/project/rcn/193466_en.html
8.3.5 MAGIC Moving Towards Adaptive
Governance in Complexity:
Informing Nexus Security
05/2020 € 7 457 761 No http://magic-nexus.eu/project-overview/

198
Section Project Acronym Project Title Project
End Date
EC Contribution International
Cooperation
i.e. EU -
nonEU?
WEBSITE
8.3.6 MARCO MArket Research for a
Climate Services
Observatory
10/2018 € 1 520 304 Yes http://marco-h2020.eu/
8.3.5 MAT4BAT (FP7) Advanced Materials for
batteries
07/2017 € 8 191 959 No www.mat4bat.eu
8.3.2 NACLIM North Atlantic Climate:
Predictability of the climate
in the North
Atlantic/European sector
related to North
Atlantic/Arctic sea surface
temperature and sea ice
variability and change
01/2017 € 8 598 407 Yes www.naclim.eu
8.3.5 NANOCATE (FP7) Nano-carbons for versatile
ppower supply modules
09/2017 € 3 994 210 No www.nanocate.eu
8.4.5 NeXOS Next generation, Cost-
effective, Compact,
Multifunctional Web
Enabled Ocean Sensor
Systems Empowering
Marine, Maritime and
Fisheries Management
09/2017 € 5 906 479 Yes www.nexosproject.eu
8.4.1 NextGEOSS Next Generation GEOSS for
Innovation Business
05/2020 € 9 999 999 No https://www.nersc.no/project/nextgeoss
8.3.5 PHBOTTLE (FP7) Advanced solutions for
packaging and non-
packaging applications
05/2015 € 2 873 649 Yes www.phbottle.eu

199
Section Project Acronym Project Title Project
End Date
EC Contribution International
Cooperation
i.e. EU -
nonEU?
WEBSITE
8.3.5 PLANGRIDEV Distribution grid planning
and operational principles
for EV mass roll-out while
enabling DER integration
02/2016 € 4 875 289 No http://www.plangridev.eu/
8.3.1
8.3.2
PRIMAVERA PRocess-based climate
sIMulation: AdVances in
high resolution modelling
and European climate Risk
Assessment
10/2019 € 14 967 970 No http://cordis.europa.eu/project/rcn/196807_en.html
8.3.5 PROETHANOL2G Integration of Biology and
Engineering into an
Economical and Energy-
Efficient 2G Bioethanol
Biorefinery
10/2014 € 980 000 Yes http://www.proethanol2g.org/
8.3.6 PROSNOW Provision of a prediction
system allowing for
management and
optimization of snow in
Alpine ski resorts
08/2020 € 3 209 616 No
8.3.6 PUCS Pan-European Urban
Climate Services
11/2019 € 2 936 601 No
8.3.5 PVCROPS PhotoVoltaic Cost r€
duction, Reliability,
Operational performance,
Prediction and Simulation
10/2015 € 3 798 605 Yes http://www.pvcrops.eu/
REINVENT Realising Innovation in
Transitions for
Decarbonisation
11/2020 € 4 500 000 Yes http://cordis.europa.eu/project/rcn/206259_en.html
200
Section Project Acronym Project Title Project
End Date
EC Contribution International
Cooperation
i.e. EU -
nonEU?
WEBSITE
8.3.4 RESIN Climate Resilient Cities and
Infrastructures
10/2018 € 7 466 005 No http://www.resin-cities.eu/home/
8.3.2 SCENT Smart Toolbox for Engaging
Citizens into a People-
Centric Observation Web
08/2019 € 3 264 675 No https://scent-project.eu/
8.4.5 SCHeMA INTEGRATED IN SITU
CHEMICAL MAPPING
PROBES
09/2017 € 5 200 489 Yes www.schema-ocean.eu
8.3.5 SECTOR Production of Solid
Sustainable Energy Carriers
from Biomass by Means of
Torrefaction
12/2015 € 7 565 725 Yes https://sector-project.eu/
8.4.5 SenseOCEAN SenseOCEAN: Marine
sensors for the 21st Century
09/2017 € 5 924 945 No www.senseocean.eu
8.4.1 SIGMA Stimulating Innovation for
Global Monitoring of
Agriculture and its Impact
on the Environment in
support of GEOGLAM
(SIGMA)
07/2017 € 8 750 133 Yes http://www.geoglam-sigma.info
8.3.5 SIM4NEXUS Sustainable Integrated
Management FOR the
NEXUS of water-land-food-
energy-climate for a
resource-efficient Europe
05/2020 € 7 895 658 No http://www.sim4nexus.eu/

201
Section Project Acronym Project Title Project
End Date
EC Contribution International
Cooperation
i.e. EU -
nonEU?
WEBSITE
8.3.5 SOLARH2 European Solar-Fuel
Initiative - Renewable
Hydrogen from Sun and
Water. Science Linking
Molecular Biomimetics and
Genetics
01/2012 € 3 927 810 No http://www.solarh2.tu-
darmstadt.de/solarh2/index.en.jsp
8.3.2 SPECS Seasonal-to-decadal climate
Prediction for the
improvement of European
Climate Services
01/2017 € 8 224 862 Yes http://www.specs-fp7.eu/
8.3.2 STRATOCLIM Stratospheric and upper
tropospheric processes for
better climate predictions
11/2018 € 8 548 477.98 Yes www.stratoclim.org
8.3.5 SWARM Demonstration of Small 4-
Wheel fuel cell passenger
vehicle Applications in
Regional and Municipal
transport
12/2017 € 6 822 808 No http://www.swarm-project.eu/
8.4.6 SWOS Satellite-based Wetland
Observation Service
05/2018 € 4 979 189 No http://swos-service.eu/
8.3.4 TRANSrisk Transitions pathways and
risk analysis for climate
change mitigation and
adaption strategies
08/2018 € 7 454 018 No http://transrisk-project.eu/
8.3.6 VISCA Vineyards´ Integrated Smart
Climate Application
04/2020 € 2 793 145 No http://cordis.europa.eu/project/rcn/210173_en.html

202
Section Project Acronym Project Title Project
End Date
EC Contribution International
Cooperation
i.e. EU -
nonEU?
WEBSITE
8.3.5 EXILVA (BBI JU) Flagship demonstration of
an integrated plant towards
large scale supply and
market assessment of MFC
(microfibrillated cellulose)
04/2019 € 27 433 611 N/A http://www.exilva.com/
8.3.5 AGRIMAX (BBI
JU)
Agri and food waste
valorisation co-ops based on
flexible multi-feedstocks
biorefinery processing
technologies for new high
added value applications
09/2020 € 12 484 461.46 N/A http://agrimax-project.eu/
8.3.5 BIOFOREVER
(BBI JU)
BIO-based products from
FORestry via Economically
Viable European Routes
08/2019 € 9 937 998.02 N/A https://www.bioforever.org
8.3.5 LIPES (BBI JU) Life Integrated Process for
the Enzymatic Splitting of
triglycerides
08/2021 € 4 295 153.67 N/A http://www.lipes.eu
8.3.5 PULPACKTION
(BBI JU)
Optimised moulded pulp for
renewable packaging
solutions
09/2020 BBI JU
contribution
N/A N/A
8.3.5 CELBICON
(H2020)
Cost-effective CO2
conversion into chemicals
via combination of Capture,
ELectrochemical and BI-
ochemical CONversion
technologies
43709 € 5 429 201 50 N/A http://www.celbicon.org
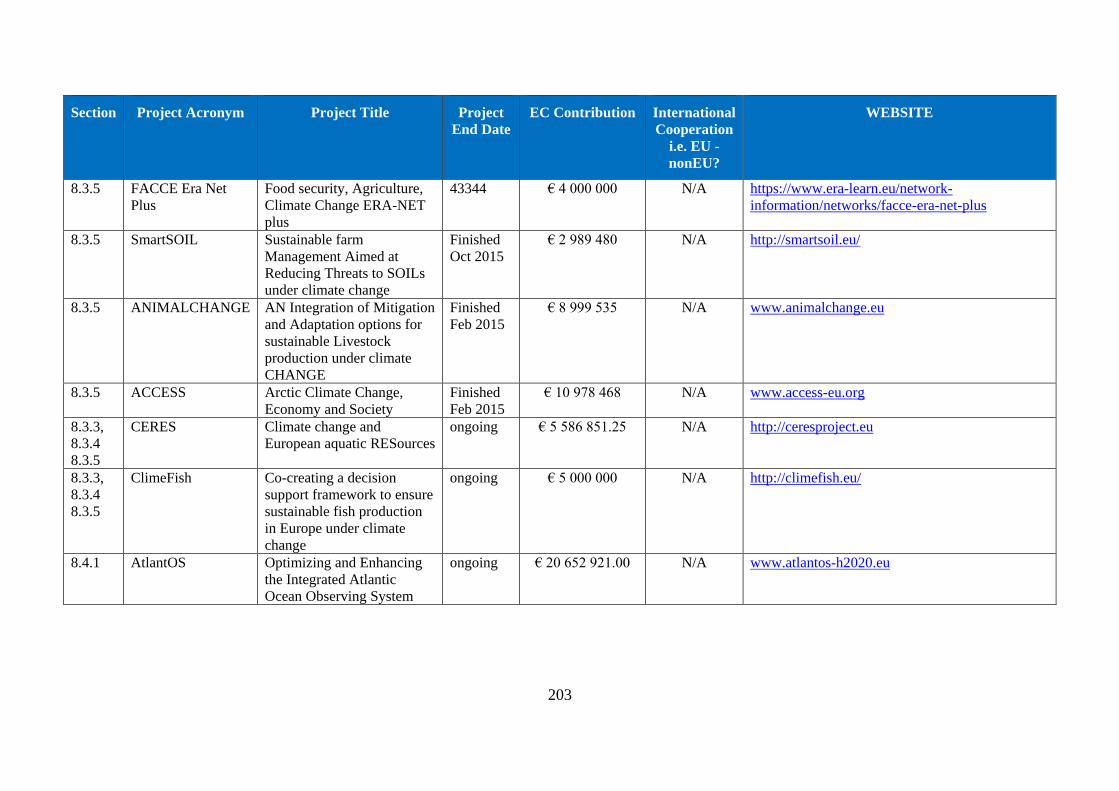
203
Section Project Acronym Project Title Project
End Date
EC Contribution International
Cooperation
i.e. EU -
nonEU?
WEBSITE
8.3.5 FACCE Era Net
Plus
Food security, Agriculture,
Climate Change ERA-NET
plus
43344 € 4 000 000 N/A https://www.era-learn.eu/network-
information/networks/facce-era-net-plus
8.3.5 SmartSOIL Sustainable farm
Management Aimed at
Reducing Threats to SOILs
under climate change
Finished
Oct 2015
€ 2 989 480 N/A http://smartsoil.eu/
8.3.5 ANIMALCHANGE AN Integration of Mitigation
and Adaptation options for
sustainable Livestock
production under climate
CHANGE
Finished
Feb 2015
€ 8 999 535 N/A www.animalchange.eu
8.3.5 ACCESS Arctic Climate Change,
Economy and Society
Finished
Feb 2015
€ 10 978 468 N/A www.access-eu.org
8.3.3,
8.3.4
8.3.5
CERES Climate change and
European aquatic RESources
ongoing € 5 586 851.25 N/A http://ceresproject.eu
8.3.3,
8.3.4
8.3.5
ClimeFish Co-creating a decision
support framework to ensure
sustainable fish production
in Europe under climate
change
ongoing € 5 000 000 N/A http://climefish.eu/
8.4.1 AtlantOS Optimizing and Enhancing
the Integrated Atlantic
Ocean Observing System
ongoing € 20 652 921.00 N/A www.atlantos-h2020.eu

204
Section Project Acronym Project Title Project
End Date
EC Contribution International
Cooperation
i.e. EU -
nonEU?
WEBSITE
8.4.1 ODYSSEA OPERATING A
NETWORK OF
INTEGRATED
OBSERVATORY
SYSTEMS IN THE
MEDITERRANEAN SEA
Staring on
1st June
2017
€ 8 398 716.00 N/A N/A
8.4.1 INTAROS Optimizing and Enhancing
the Integrated Atlantic
Ocean Observing System
ongoing € 15 490 066.78 N/A http://cordis.europa.eu/project/rcn/205992_en.html
CATCH-C Compatibility of
Agricultural Management
Practices and Types of
Farming in the EU to
enhance Climate Change
Mitigation and Soil Health
Finished
December
2014
€ 2 960 679 N/A www.catch-c.eu
FORMIT FORest management
strategies to enhance the
MITigation potential of
European forests
September
2016
€ 2 978 197 N/A http://www.eu-formit.eu
8.4.8 AGRICAB A framework for enhancing
EO capacity for Agriculture
and Forest Management in
Africa as a contribution to
GEOSS
Finished
December
2015
€ 3 499 234 Yes http://www.agricab.info/Pages/home.aspx
8.4.8 EO2Heaven Earth Observation and
ENVironmental modelling
for the mitigation of HEAlth
risks
Finished
May 2013
€ 6 273 262 Yes http://copernicus.eu/projects/eo2heaven

205
Section Project Acronym Project Title Project
End Date
EC Contribution International
Cooperation
i.e. EU -
nonEU?
WEBSITE
Research infrastructure projects
8.5.1. ACTRIS PPP ACTRIS PPP - Aerosols,
Clouds and Trace gases
Preparatory Phase Project
12/2019 € 3 999 996 http://actris2.nilu.no/
8.5.1. ACTRIS-2 Aerosols, Clouds, and Trace
gases Research
InfraStructure
04/2019 € 9 541 195 Yes http://actris2.nilu.no/
8.5.1. ARISE2 Atmospheric dynamics
Research InfraStructure in
Europe
08/2018 € 2 985 250 http://arise-project.eu/
8.5.4. Advance_eLTER Advancing the European
Long-Term Ecosystem,
critical zone and socio-
ecological Research
Infrastructure towards
ESFRI
12/2017 € 899 820 http://www.lter-europe.net/elter-esfri/advance-
elter
8.5. COOP_PLUS COOPERATION OF
RESEARCH
INFRASTRUCTURES TO
ADDRESS GLOBAL
CHALLENGES IN THE
ENVIRONMENT FIELD
08/2018 € 1 997 990 http://www.coop-plus.eu/

206
Section Project Acronym Project Title Project
End Date
EC Contribution International
Cooperation
i.e. EU -
nonEU?
WEBSITE
8.5. DANUBIUS-PP PREPARATORY PHASE
FOR THE PAN-
EUROPEAN RESEARCH
INFRASTRUCTURE
DANUBIUS–RI “THE
INTERNATIONAL
CENTRE FOR
ADVANCED STUDIES ON
RIVER-SEA SYSTEMS
11/2019 € 3 996 405 http://danubius-pp.eu/
8.5.4. eLTER European Long-Term
Ecosystem and socio-
ecological Research
Infrastructure
05/2019 € 4 999 138 http://www.lter-europe.net/elter
8.5.2. EMBRIC European Marine Biological
Research Infrastructure
Cluster to promote the Blue
Bioeconomy
05/2019 € 9 041 611 http://www.embric.eu/
8.5.2. EMSO-Link Implementation of the
Strategy to Ensure the
EMSO ERIC’s Long-term
Sustainability
02/2020 € 4 359 451 http://www.emso-eu.org/site/
8.5.2. EMSODEV EMSO implementation and
operation: DEVelopment of
instrument module
08/2018 € 4 298 602 http://www.emsodev.eu/
8.5. ENVRI PLUS Environmental Research
Infrastructures Providing
Shared Solutions for Science
and Society
04/2019 € 14 683 534 http://www.envriplus.eu/

207
Section Project Acronym Project Title Project
End Date
EC Contribution International
Cooperation
i.e. EU -
nonEU?
WEBSITE
8.5.4. ERIFORE Research Infrastructure for
Circular Forest Bioeconomy
01/2018 € 2 628 700 http://erifore.eu/
8.5.1. EUROCHAMP-
2020
Integration of European
Simulation Chambers for
Investigating Atmospheric
Processes – Towards 2020
and beyond
11/2020 € 8 941 290 http://www.eurochamp.org/
8.5.4. GLOBIS-B GLOBal Infrastructures for
Supporting Biodiversity
research
05/2018 € 1 005 875 http://www.globis-b.eu/
8.5. HYDRALAB-
PLUS
HYDRALAB+ Adapting to
climate change
08/2019 € 9 979 376 http://hydralab.eu/
8.5.3. INTERACT International Network for
Terrestrial Research and
Monitoring in the Arctic
09/2020 € 10 000 000 Yes http://www.eu-interact.org/
8.5.2. JERICO-NEXT Joint European Research
Infrastructure network for
Coastal Observatory – Novel
European eXpertise for
coastal observaTories
08/2019 € 9 998 876 http://www.jerico-ri.eu/
8.5.2. ODIP 2 Extending the Ocean Data
Interoperability Platform
03/2018 € 1 912 086 Yes http://www.odip.eu/
8.5.1. RINGO Readiness of ICOS for
Necessities of integrated
Global Observations
12/2020 € 4 719 680 https://www.icos-ri.eu/ringo

208
Section Project Acronym Project Title Project
End Date
EC Contribution International
Cooperation
i.e. EU -
nonEU?
WEBSITE
8.5.2. SeaDataCloud
SeaDataCloud - Further
developing the pan-
European infrastructure for
marine and ocean data
management
10/2020 € 9 999 738 Yes https://www.seadatanet.org/About-
us/SeaDataCloud

209