Commission on Teacher Credentialing Biennial … on Teacher Credentialing Biennial Report Calendar...
66
Commission on Teacher Credentialing Biennial Report Calendar Year 2007 Institution: California State University Channel Islands Report submitted: August 15, 2008 Last Site Visit: No site visit has been conducted Name of Program: School of Education All credential programs are at one site. Program Contact: Joan Karp Senior Associate Dean and Director of the School of Education [email protected] 805-437-8871 805-437-3302 (fax)
Transcript of Commission on Teacher Credentialing Biennial … on Teacher Credentialing Biennial Report Calendar...

Commission on Teacher Credentialing Biennial Report
Calendar Year 2007 Institution: California State University Channel Islands Report submitted: August 15, 2008 Last Site Visit: No site visit has been conducted Name of Program: School of Education All credential programs are at one site. Program Contact: Joan Karp
Senior Associate Dean and Director of the School of Education
805-437-8871
805-437-3302 (fax)

2
Table of Contents
Section A Credential Specific Information Multiple Subject Multiple Subject with BCLAD Multiple Subject Intern
3
Single Subject (Mathematics, Science and English) Single Subject Intern (Mathematics, Science and English)
23
Educational Specialist Mild/Moderate Level I 39 Educational Specialist Mild/Moderate Level I Intern
Educational Specialist Mild/Moderate Level II 47 Administrative Services Preliminary 57
Section B Institutional Summary and Plan of Action 65
California State University Channel Islands

3
Multiple Subject Teacher Credential Program Credentials awarded: Multiple Subject
Multiple Subject with BCLAD Multiple Subject Intern
Program Contacts:
Dr. Merilyn Buchanan (805) 437-8579 [email protected]
Dr. Kaia Tollefson (805) 437-3125 [email protected]
I. Contextual Information The Multiple Subject (MS) Teaching Credential Program serves Ventura and southern Santa Barbara counties. The MS Program prepares teachers to work in K-8 self-contained elementary or middle school classroom settings with responsibility for all subject areas. Candidates graduate with the necessary skills to meet the needs of the diverse population found in California’s public schools, including students with special needs and English language learners and actively engage all K-8 students in their own learning.
The following candidate learning outcomes align with CCTC standards and expectations: • Teach all general education subjects in self-contained classroom • Teach children with English as first or second language • Understand and relate to diversity of languages and cultures in and among children and
families • Meet the diverse needs of all students and those with special needs • Be reflective and deliberate practitioners • Link content and pedagogy • Actively engage children in their learning • Integrate research, theory and best educational practice into their teaching
The program has 3.5 full-time equivalent tenure track faculty, one of whom is responsible for program coordination and advising as well as teaching. Other faculty, instructors and supervisors, are full time or part-time lecturers. The first cohort of twenty Multiple Subject candidates enrolled in Fall 2002. Full-time candidates complete the program as a cohort in two semesters. Part-time candidates overlap with other cohorts to complete the program in up to six semesters. BCLAD was added to the Multiple Subject Program after its approval in summer of 2007. One student completed the BCLAD in the fall of 2007. During 2007 there were no interns.
Multiple Subject Program Candidate Information January 1, 2007 – December 31, 2007 Semester Number of Candidates Number of Completers/Graduates Spring 66: 51 Full time, 15 Part time 36: 33 Full time, 5 Part time Fall 49: 38 Full time, 11 Part-time 21: 18 Full time, 3 Part time
California State University Channel Islands

4
The program is composed of five teaching methods courses: mathematics, two literacy courses, and two integrated courses: science, health and physical education; and history, social studies and art. To continue in the program, candidates must have no course grade lower than a C+. A candidate enrolled in a methods course also enrolls in a supervised field placement. For the initial field placement candidates are placed in a kindergarten through 3rd grade classroom. In the second or advanced semester student teaching occurs in a 3rd through 6th grade classroom. Part-time candidates have a semester-long half-day field placement for each methods course in which they are enrolled. School placements are arranged by the Director of Field Placements and are chosen to provide access to and experience with various grade levels in a variety of social and educational settings. Full time candidates spend the first eight weeks of each semester taking methods courses, attending two class sessions for each course per week, and spend one full day per week participating in the assigned classroom where they complete course assignments. During the second eight weeks of each semester, candidates student teach five full days a week. Throughout the semester, candidates attend a student teaching seminar every other week. Part-time candidates student teach in their final semester in two back-to-back eight week placements, one at the lower grades and one at the upper grades. Changes Since Commission Approval of Current Multiple Subject Credential Program in 2002 Since 2002, the MS Credential Program has made several changes to improve the preparation of candidates. Some of the significant programmatic changes are: Spring 2003 • Evening sections added to accommodate part time students’ and interns’ needs • Mock interviews developed as an additional authentic performance assessment • Candidates presented a professional portfolio that clustered the TPEs in a way similar to the
domains of the California Standards for the Teaching Profession Fall 2004 • Change in structure to 8 weeks of classes followed by 8 weeks of student teaching • Classroom observation and participation extended to one full day each week for first eight
weeks of each semester Fall 2005 • Initial student teaching placements in grades K-3 to align with focus of Literacy 1 • EDMS 520/521 moved from credential program to EDUC pre-requisite course series • Multiple Subject Program piloted Teaching Performance Assessment tasks • Candidates completed at least two from the series of four assessment tasks • Candidates used a portfolio as the primary mechanism to present summative evidence of
practice Fall 2006 • Passing all sections of the CSET becomes an entry requirement for the program • Exit Portfolio evolved to a professional practice portfolio and includes scored California
TPAs
California State University Channel Islands

5
• Lesson planning moved from EDUC 520 and added to EDUC 510, allowing for more classroom management content in EDUC 520
• Most MS courses taught off campus at the Professional Development School site. Fall 2007 • Final cohort to produce TPA portfolio • Initial Piloting of PACT with incoming candidates • Cooperating teacher and university supervisor evaluate candidate’s professional disposition
to determine readiness for full time student teaching • Evening section of EDMS 523, 527 and 529 discontinued due to decrease in number of part-
time students and cessation of Multiple Subject teaching internships • EDMS 522 and EDMS 526 retained as evening sections for students in Education Specialist
Level I or modified MS part-time program II. Candidate Assessment/Performance and Program Effectiveness Information Data collected during Spring and Fall 2007 comes from the following Key Assessments:
Key Assessment #1: a: California Teaching Performance Assessment (TPA) Task 4 b: Performance Assessment of California Teachers (PACT)
Key Assessment #2: Student Teaching Evaluations Key Assessment #3: Practice Teaching Experience Survey Key Assessment #4: Mock Interviews (Fall 2007) Key Assessment #5: CSU System-wide Exit Survey Key Assessment #6: CSU System-wide One Year Out Survey
Key Assessment #1a: California Teaching Performance Assessment (TPA, Spring 2007) Description of the assessment In Spring 2007, advanced semester MS student teachers completed the culminating California TPA Task 4 to demonstrate mastery of the knowledge, skills and abilities required of a beginning K-8 teacher, as portrayed in the thirteen TPEs. Candidates provided information on a specific learning environment and class; planned and implemented a lesson with adaptations for two focus students; analyzed the lesson and student learning; and reflected on the total process. A 20 minute videotaped episode of the lesson was submitted along with evidence of student learning. Data collection process • Thirty six candidates completed Task 4 during second semester student teaching • In May 2007, completed TPAs were collected and evaluated by MS Program faculty • Levels 4 and 3 were passing scores, level 2 required remediation, level 1 was failing Summary of Aggregated Data Score of 4: 14/36 = 39% Score of 2: 0/36 Score of 3: 22/36 = 61% Score of 1: 0/36 Eight of the 36 candidates had a second reading of their original Task 4 submission.
California State University Channel Islands
6
# of Candidates
Initial result Required action Rescored result
4 Failed at least one section at the first reading
Resubmit one or more sections. Meet with MS coordinator or Director of Field Placements for individual hour-long intervention session
All 4 candidates scored 3 on the second reading
4 Borderline: score between a 2 and a 3 on at least one section
Re-scored by a second evaluator. Third reader utilized if scorers were two or more levels apart
All 4 candidates scored 3 on the second reading
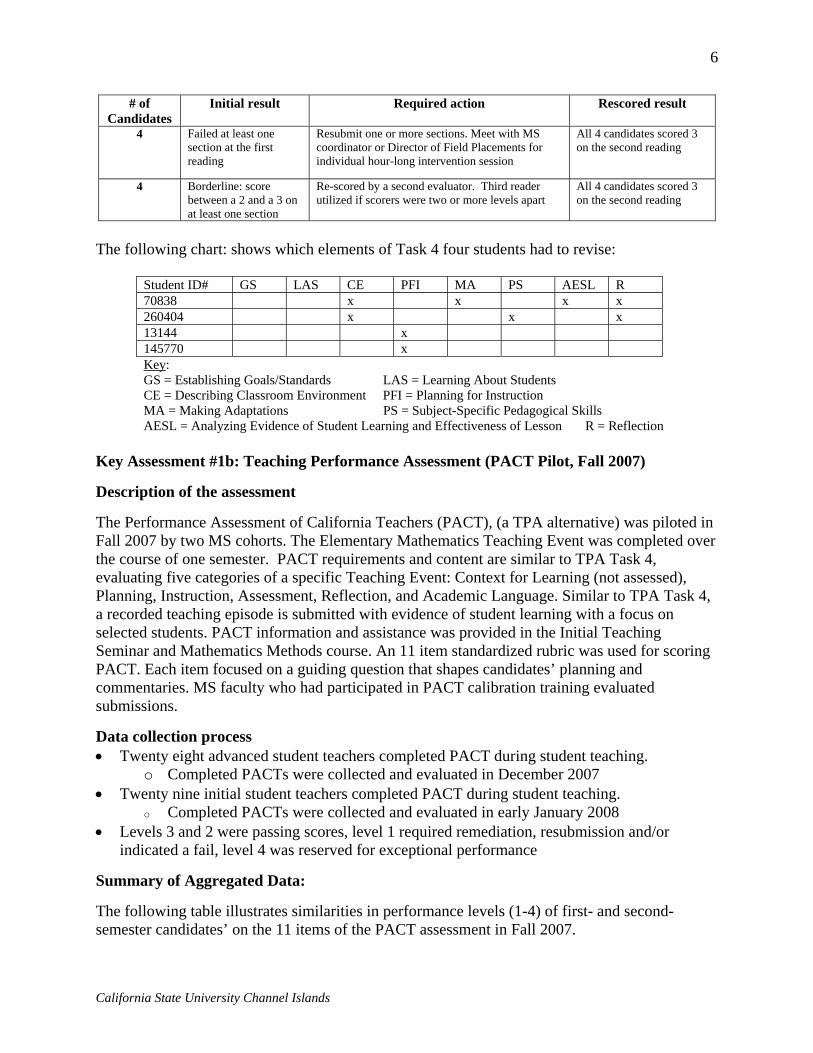
The following chart: shows which elements of Task 4 four students had to revise:
Student ID# GS LAS CE PFI MA PS AESL R 70838 x x x x 260404 x x x 13144 x 145770 x Key: GS = Establishing Goals/Standards LAS = Learning About Students CE = Describing Classroom Environment PFI = Planning for Instruction MA = Making Adaptations PS = Subject-Specific Pedagogical Skills AESL = Analyzing Evidence of Student Learning and Effectiveness of Lesson R = Reflection
Key Assessment #1b: Teaching Performance Assessment (PACT Pilot, Fall 2007) Description of the assessment The Performance Assessment of California Teachers (PACT), (a TPA alternative) was piloted in Fall 2007 by two MS cohorts. The Elementary Mathematics Teaching Event was completed over the course of one semester. PACT requirements and content are similar to TPA Task 4, evaluating five categories of a specific Teaching Event: Context for Learning (not assessed), Planning, Instruction, Assessment, Reflection, and Academic Language. Similar to TPA Task 4, a recorded teaching episode is submitted with evidence of student learning with a focus on selected students. PACT information and assistance was provided in the Initial Teaching Seminar and Mathematics Methods course. An 11 item standardized rubric was used for scoring PACT. Each item focused on a guiding question that shapes candidates’ planning and commentaries. MS faculty who had participated in PACT calibration training evaluated submissions. Data collection process • Twenty eight advanced student teachers completed PACT during student teaching.
o Completed PACTs were collected and evaluated in December 2007 • Twenty nine initial student teachers completed PACT during student teaching.
o Completed PACTs were collected and evaluated in early January 2008 • Levels 3 and 2 were passing scores, level 1 required remediation, resubmission and/or
indicated a fail, level 4 was reserved for exceptional performance Summary of Aggregated Data: The following table illustrates similarities in performance levels (1-4) of first- and second-semester candidates’ on the 11 items of the PACT assessment in Fall 2007.
California State University Channel Islands

7
Fall 2007
1st Semester Candidates n=29
2nd Semester Candidates n=28
1 2 3 4 1 2 3 4 PLANNING 0% 17% 66% 17% 0% 18% 68% 14% EM1 Establishing a balanced instructional focus 0 4 19 6 0 4 19 5 EM2 Making content accessible 0 6 17 6 0 6 17 5 EM3 Designing assessments 0 5 21 3 0 5 21 2 INSTRUCTION 9% 33% 50% 9% 9% 34% 50% 7% EM4 Engaging students in learning 2 9 14 4 2 9 14 3 EM5 Monitoring learning during instruction 3 10 15 1 3 10 14 1 ASSESSMENT 9% 41% 43% 7% 9% 43% 45% 4% EM6 Analyzing student work from an assessment 2 12 13 2 2 12 13 1 EM7 Using assessment to inform teaching 3 12 12 2 3 12 12 1 REFLECTION 3% 40% 55% 2% 4% 41% 55% 0% EM8 Monitoring student progress 1 12 16 0 1 12 15 0 EM9 Reflecting on learning 1 11 16 1 1 11 16 0 ACADEMIC LANGUAGE 0% 52% 41% 7% 0% 54% 43% 4% EM10 Understanding language demands 0 16 11 2 0 16 11 1 EM11 Supporting academic language development 0 14 13 2
0 14 13 1 It should be noted that evaluators were aware of the combination of lack of practical experience and high levels of stress felt by first-semester student teachers when completing PACT, factors taken into account when designating final scores. Key Assessment #2: Student Teaching Evaluations Description of the assessment
A Student Teaching Evaluation Form is used by field supervisors when assessing candidates’ growth and achievements in teaching practice. A new form was piloted in Fall 2007.
• The evaluation form used in Spring 2007 with initial and advanced student teachers was organized in six categories around the 13 TPE’s and used a 4-point rating scale.
• The evaluation form used in Fall 2007 with advanced student teachers was organized in four assessment areas and used a 3-point rating scale that was correlated with PACT categories as well as TPEs.
Comparison of scoring categories on Student Teaching Evaluation forms
‘Old’ form – Spring 2007 ‘New’ form – Fall 2007
Qualitative rating Numeric score Qualitative rating Numeric score
Noteworthy evidence 4 Considerable evidence 3 Exceeding expectations (EE) 3
Some evidence 2 Achieving expectations (AE) 2 No evidence 1 Needs special attention (SA) 1
Not yet observed. NYO Unobserved (UN)
Data collection process Each semester, a university supervisor reports a student teacher’s performance progress at least three times, yielding two formative assessments and one summative evaluation for each candidate. The chart below shows which forms were used, when and with which cohort.
California State University Channel Islands

8
Form Used Cohort
‘Old’ – developed in 2002 Spring 2007 Initial and Advanced Candidates ‘New’ developed in 2007 Fall 2007 Advanced student teaching
Due to different evaluation instruments, only general comparisons can be made across data. Summary of Aggregated Data: Spring 2007 (Old Form)
Student teaching supervisors summative evaluations were used to calculate the percentage of ratings awarded.
Initial Candidates 1 2 3 4 Advanced Candidates 1 2 3 4 Shows lowest third of specific TPEs that were rated at level 4
TPE 7: Teaching ELL 0% 0% 70% 30% TPE 7: Teaching ELL 0% 0% 39% 61% TPE 2: Monitoring student learning during instruction
0% 3% 59% 38% TPE 6: Developmentally appropriate teaching practices
0% 0% 38% 63%
TPE 5: Student engagement 0% 6% 55% 39% TPE 5: Student engagement 0% 0% 36% 64% TPE 8: Learning about students 0% 5% 53% 42% TPE 3: Interpretation and use of
assessments 0% 0% 29% 71%
Shows middle third of specific TPEs that were rated at level 4 TPE 3: Interpretation and use of assessments
0% 3% 54% 43% TPE 8: Learning about students 0% 0% 27% 73%
TPE 6: Developmentally-appropriate practices
0% 5% 50% 45% TPE 1: Subject specific pedagogy skills 0% 0% 26% 74%
TPE 10: Instructional time 0% 5% 44% 51% TPE 2: Monitoring student learning during instruction
0% 0% 26% 74%
TPE 1: Subject specific pedagogy skills 0% 0% 49% 51% TPE 10: Instructional time 0% 0% 25% 75% TPE 4: Making content accessible 0% 7% 40% 53% TPE 4: Making content accessible 0% 0% 23% 77%
Shows highest third of specific TPEs that were rated at level 4 TPE 11: Social environment 0% 5% 31% 64% TPE 11: Social environment 0% 0% 17% 83% TPE 9: Instructional planning 0% 2% 23% 75% TPE 9: Instructional planning 0% 0% 14% 86% TPE 13: Professional growth 0% 0% 20% 80% TPE 13: Professional growth 0% 0% 3% 97% TPE 12: Professional, legal, and ethical obligations
0% 0% 10% 90% TPE 12: Professional, legal, and ethical obligations
0% 0% 0% 100%
Summary of Aggregated Data: Fall 2007 (Pilot/New Form) The following chart collapses a comprehensive data set of summative evaluation results. It shows the number of items in each of the four (A-D) overarching categories assessed that appear in the lower-, middle-, and higher-end ranges of performance. Shaded cells indicate the few visible patterns in candidate performance.
A. Context/Environment for Learning: 10 items: TPE 8, 10-11
B. Instructional Planning & Assessment: 13 items: TPE 1-3, 7, 9-10
C. Instructing Students & Supporting Lrng: 15 items: TPE 4-8, 10-11
D. Developing as a Prof & Disposition: 16 items: TPE 12-13
Initial Advanced Initial Advanced Initial Advanced Initial Advanced Low End 4 6 6 6 8 4 0 2 Mid-range 5 3 4 3 4 7 4 4 High End 1 1 3 4 3 4 12 10 Key Assessment #3: Practice Teaching Experience Survey Description of the assessment The Practice Teaching Experience (PTE) Survey consists of ten open-ended questions which allow candidates to detail perceived benefits and strengths of the placement or to describe less
California State University Channel Islands

9
positive aspects. Students can remain anonymous. Although the results of this survey are used primarily for placement and program assessment, responses to four questions are useful in assessing specific aspects of candidate performance and reveal individual perceptions of preparedness for entry to the teaching profession. Data collection process At the end of both teaching experiences candidates are encouraged but not required to complete the PTE Survey. It is distributed and collected after two weeks by Initial and Advanced Student Teaching Seminar instructors. The typical return rate is around 75%. An electronic survey copy is available also through Blackboard, a course management tool. Responses are coded in accordance with qualitative research methods. Trends and idiosyncratic replies are reported statistically and verbatim to MS faculty.
Summary of aggregated data Question #3 : “Was there opportunity for you to try out some of the ideas presented in your education classes? Please elaborate your answer.”
Yes Somewhat No Initial (F07) n = 14 65% 14% 21% Advanced (Spr07) n = 23 83% 9% 9%
The summary of responses suggests that cooperating teachers may offer more opportunities for second-semester student teachers to apply ideas and to practice what they have learned in their methods coursework. Elaborations indicate the majority of candidates in each semester of student teaching: • enjoyed opportunities to plan and teach their own lessons • were able to teach (the) elementary math PACT unit • advanced placement student teachers planned in a variety of content areas • initial student teachers mostly had opportunities to plan math lessons • teachers let students implement their own behavioral management plan • adapt instructional techniques learned in methods courses • use many SDAIE strategies with EL in the classroom
Students unable to implement their own ideas offered two explanations: cooperating teachers who were “very controlling” and district pacing plans and curricula that emphasize uniformity of instruction across grade level classrooms. Question #4: “What experiences during the teaching assignment had the most impact on you? (Positive and/or negative)” Responses differed between first and second-semester student teachers. Advanced semester candidates reported: • The experiences most meaningful were the lessons that didn’t go as planned, especially
when my students didn’t do what was expected of them. • The most powerful experience was getting to know the students and their different learning
styles and behaviors.
California State University Channel Islands

10
Typical of the comments candidates wrote of their initial experience were: • The most impact that I had was how much the students responded to me. • I was surprised at how close I became with the students.
Question #5: What experiences were you hoping for that the placement didn’t provide?” and Question #6: How could CSUCI have better prepared you so as to maximize the experience? A thematic analysis of responses to these two questions yield the following categories which offer insight into candidates’ perceptions of their own preparedness as beginning teachers. #5: What experiences were you hoping for that the placement didn’t provide? Initial Placement Candidates (F07) Advanced Placement Candidates (Spr07) None (4/14) 29% None (14/23) 61% Report cards, conferences (3/14) 21% Improved placement (3/23) 13% More support (2/14) 14% More exp w/ special needs (2/23) 9% More experience w/ diversity (2/14) 14% Improved everything (1/23) 4% Access to more grade levels (1/14) 7% More field experience (1/23) 4% More autonomy (1/14) 7% Experience with field trips (1/23) 4% More hands-on/best practices (1/14) 7% More experience w/ planning (1/23) 4% #6: How could CSUCI have better prepared you so as to maximize the experience? Initial Placement Candidates (F07) Advanced Placement Candidates (Spr07) No improvement suggested (6/14) 43% No improvement suggested (12/23) 52% Teaching ideas, techniques (3/14) 21% More field experience (3/23) 13% Improved placement (2/14) 14% Clarified expectations (3/23) 13% More field experience (1/14) 7% Classrm mgt/communication (2/23) 9% More info about student tchg (1/14) 7% Technology training (1/23) 4% More support (1/14) 7% Info on promotion/retention (1/23) 4% Long-term planning (1/23) 4% The higher percentage of second-semester respondents offering no suggestion for improvement suggests more widespread and greater levels of confidence and a stronger sense of preparedness for entering the profession. First-semester candidates indicated a need for more practical teaching ideas and strategies (e.g., “ways to teach spelling or how to add two digit numbers,” and “gradebooks, bulletin boards”), while the experience of second semester candidates led to more global learning needs (e.g., “More daily, weekly, monthly planning, “technology,” “parent communication/ conflict resolution” training). Key Assessment #4: Mock Interviews (Fall 2007) Description of the assessment In the final semester, candidates participate in mock job interviews. Candidates must articulate their understandings and synthesize knowledge and skills attained from all of the courses in the program. Candidates receive immediate verbal and written feedback on their performance, résumé and cover letter and suggestions for improvement by a panel of three or four interviewers. Panels are comprised of school and district level administrators, CSUCI Educational Leadership Program graduate students, cooperating teachers, and MS faculty. ‘Mock interviews’ provide a valuable experience for candidates entering the job market and are also an authentic performance assessment tool.
California State University Channel Islands

11
Data collection process In Fall, 23 of 25 second-semester candidates participated in the mock interview process. Each interviewer provided the candidates with written feedback using the CSU Channel Islands Mock Interview Rubric printed on NCR paper, leaving a copy for the program’s use. Summary of aggregated data Only data for Fall 2007 are presented in the table below which displays data for each of 23 interviewees gathered from 12 of the 18 interviewers. Assessment Criteria Exemplary Adequate Needs
Improvement Appearance 17 6 Use of Professional Pedagogical Language 8 15 Response to the Questions (Content) 7 16 Communication Style 16 6 1 Resume 17 5 1 Candidates debrief the mock interview experience and comments are overwhelmingly positive. Unsolicited e-mails indicate perceived value of this experience, for example: • Thank you for organizing the interview. It was sooooo helpful! • Thank you again for providing me with the opportunity to get my feet wet with the practice interview.
What a fabulous idea. • I wanted to say thank you for arranging the interviews …. It was a great experience. I feel
much more prepared now for the real thing. Please pass on my gratitude to those who took the time to meet with us. I truly appreciated their feedback.
Key Assessment #5: CSU System-wide Exit Survey Description of the assessment The CSU Chancellor’s Office administers an on-line survey to all candidates exiting credential programs. Program completers answer a number of selected-response and four open-ended questions. The purpose is to gain graduates’ judgment of how well CSU campuses prepare them for 23 critical teaching responsibilities. Quantitative data is summarized into tables for each institution and program and compared with CSU System Averages. Qualitative data are presented as verbatim responses. Faculty examine the valuable Exit Survey information noting positive responses and scrutinizing the negative. The verbatim responses complement the quantitative data, providing valuable explanations that assist with program improvement efforts.
Data collection process At the end of each semester, graduating MS credential candidates complete a 30-minute on-line Chancellor’s Office survey. To ensure a significant campus response rate, candidates are asked to bring verification of Exit Survey completion to the Credential Office as they complete recommendation files for CCTC. Data were recorded from 54 out of the 59 CSUCI Multiple Subject program completers.
California State University Channel Islands

12
Summary of aggregated data Data taken from the following survey summary tables are included in this report:
• Evaluation of Teacher Education Program Quality • Concepts and Practices for Multiple Subject Teaching (K-8) • CSU Coursework and Fieldwork in Learning to Teach • The Quality of Pedagogical Preparation Programs
Candidates’ voices are presented through a selection of responses to the open-ended prompts. Examination of the data shows trends in program strengths and areas for improvement, as well as illustrating how contradictory individual perceptions can be. Evaluation of Teacher Education Program Quality Overall Assessment in 2006-07 by 2006-07 Exiting Graduates of Multiple Subject Programs.
Fifty one exiting students gave their overall impression of the quality of the Multiple Subject program. Compared with MS credential candidates in the CSU as a whole, CI students perception that they ‘learned a lot’ in the program was lower by 4.5% and the percentage of those who determined the program had ‘relatively little substance or offered nothing of value’ was very slightly higher by 0.2%
CSUCI CSU System What is your overall evaluation of your Teaching Credential Program? Select the one statement that most closely matches your current overall perspective on your program.
N % N %
I learned a lot in my CSU credential program. 35 66.0% 2879 70.5% I learned quite a bit that was important. 16 30.2% 1066 26.1% The CSU program included relatively little substance. 2 3.8% 114 2.8% The CSU professional prep. program offered nothing of value. 0 0% 24 .6%
The other tables unpack these general perceptions and, to some extent, uncover which specific areas of the program exiting candidates feel have / have not prepared them well. Concepts and Practices for Multiple Subject Teaching (K-8) Evaluated in 2006-07 by Graduates Exiting these Programs While They Taught in Grades K-8. These questions address preparation for pedagogical the practices and concepts teachers confront as challenges during the initial years of teaching, focusing on those that tend to be associated with multiple-subject (K-8 level) assignments. Items extracted from this section show K-8 practices in which CSUCI exiting candidates considered themselves Well or Adequately Prepared, included are:
...to know and understand (all the core) subjects of the curriculum at my grade level(s).
...to teach physical education according to the California P. E. Curriculum Framework.
...to design hands-on classroom activities that suit the attention spans of my students.
...to promote the academic skills of pupils at different levels of prior proficiency.
...to assist students in managing their time and in keeping track of school assignments.
...to build on peer friendships, develop group skills, and encourage leadership roles.
...to encourage students to take risks in discovery activities and divergent thinking.
...to assist students in decision-making, problem-solving, and critical thinking.
...to create an environment that supports language use, analysis, practice and fun.
...to use language so pupils at different levels understand oral and written English.
California State University Channel Islands

13
CSUCI graduates rated their preparedness for each item within ± 2 percentage points of all CSU exiting candidates.
In the the following areas CSUCI exiting MS candidates considered themselves less well prepared (<-5%) than all exiting CSU System MS candidates are.
...understand child development, human learning and the purposes of schools.
... teach visual and performing arts according to California Content Standards.
... teach health according to the California Health Curriculum Framework.
Table 28: The Quality of Pedagogical Preparation Programs Table 28 charts responses to thirteen statements describing mandatory state and national, standards-based qualities for accredited teacher preparation programs: qualities that are largely invisible to candidates during their time in a credential program1. MS program completers judged the accuracy of each statement using the following options: Statement Was True=3, Was Mostly True=2, Was Somewhat True=1, Was Not True=0. The following statements are some of those judged as ‘True’ or ‘Mostly True’ by the majority (>83%) of CSUCI graduates, which was more than or equal to systemwide completers.
The program had a sequence of courses and school experiences that addressed the complexities of teaching gradually over time. During the program, I saw evidence that university faculty and administrators worked closely with educators in K-12 schools. At each stage of the teaching credential program, I felt ready to assume a little more responsibility for K-12 student instruction. I taught in at least one school that was a good environment for practice teaching and for reflecting on how I was teaching pupils. My cooperating teacher(s) frequently observed my teaching, met with me and offered useful advice about my teaching. My university supervisor regularly observed my teaching, met with me and offered constructive feedback about my teaching. During the teaching credential program I developed valuable relationships and felt a sense of community with my peers. My peers in the teaching credential program were ethnically and racially diverse.
Two statements from Table 28 were red flagged because CSUCI graduates judged them lower than all other CSU campus MS respondents.
The program provided an appropriate mixture of theoretical ideas and practical strategies, and I learned about links between them. During supervised teaching, my university-based supervisor and cooperating teacher communicated effectively with each other.
Verbatim responses of CSUCI Multiple Subject Graduates from the CSU Exit Survey Summary of aggregated data The work-product of the Chancellor’s Office states, (qualitative data) “add considerably to the texture and meaning of the evaluation findings. In the participants’ own language, these responses lead to
1 Center for Teacher Quality Office of the Chancellor. 2007. The California State University Systemwide EXIT Evaluation of Professional Teacher Preparation. An Initiative of the CSU Deans of Education, p. 45.
California State University Channel Islands

14
an elaborated, nuanced understanding of the program as it is actually experienced and viewed by the evaluation participants' teacher preparation program”. (p. 3) The selection of verbatim responses is offered here illustrates the range of courses and elements that exiting CSUCI candidates found of most and least value in the MS program.
Course in the credential program which were most valuable: The prerequisite courses for the credential program were just as valuable as the teaching methods courses. The csu educational experience provided me with a variety of different experiences and philosophies that have all contributed to my growth as a teacher. Every course had value in some way, and each instructor gave me something to take on my journey. Literacy 1: good test prep class for the RICA, learned the stages of reading and writing and activities and strategies for teaching primary students. Social Studies: Loved this class! Learned how to create a community in the classroom, a safe environment that welcomes diversity. Learned how to give students a voice. Literacy 2: Learned about Guided Reading and Writing Workshops. Learned how to develop a lterature unit and the elements of literature studies. Science, Health, and PE: Learned a ton of PE activities, learned how to teach science and the value of discrepent events, learned how to integrate health, science and PE in lessons. Math- our teacher introduced us to the local council for teachers of mathematics and we got to join and go to meetings, a very valuable resource. She also introduced us to different ways of teaching and ways to use common items as manipulatives. Learned about problem-based math. Classroom Management - We spent all semester constructing a hard copy of our full classroom management plan, including prevention and intervention strategies, class rules and routines, and family involvement. I've often referred back to my management plan and intend to continue to do so once I have my own class. Student teaching experiences were the most helpful. the courses were not as useful as the hands on learning that took place in the actual classrooms. Element of the credential program that was most valuable (e.g., student teaching, peer relationships, fieldwork, coursework) Peer relationships with the other students in the program was fun as we became a family and went through the intense but exciting ezperience. Student teaching gave me the confidence and assurance that I can do this. The coursework offered the theory I needed to strenthen my teaching skills and gave me the desire to continue learning about teaching for the rest of my life. Again, it was not any single element that was most valuable. Fieldwork and observations linked theory with practice, and allowed me to work with experienced teachers. student teaching has been hands-on and provided a realistic look at the planning involved with teaching. The coursework was brutal at times, but there is value in hard work and dedication. If it were easy, everyone would have a degree and/or teaching credential. Student teaching definately was the most valuable element for my teacher preparation because I was able to use what I have learned from my methods classes in a real classroom. I have learned a lot of valuable information from my cooperating teachers. Especially when we had to take over the classroom, that was beneficial, because it let us know if we were capable of being able to have our own classroom one day. Also, when you're actually in a classroom, you can practice what you've learned about classroom management, behavior problems, lesson planning and teaching, grading, etc. Overall it's been a great experience.
Element of the credential program that was least valuable (e.g.,, student teaching, peer relationships, coursework) TPA's were a necessary evil, I understand. I wasn't one of the ones who bitched and complained about them constantly...however, I do feel that they could have been structured a bit better to offer a more interesting process of observation, teaching, and evaluation of students. Coursework- most all of my classes felt like a waste of time. The instructors seemed to show up with no plan for the day. I felt like they wanted to get up there and preach about everything we shouldn't do, rather than give us concrete ideas on what we should do as a teacher and HOW to actually do those things. The teachers were also very unorganized. In our science/health/PE class, we only talked about science for the entire semester. In history methods, I don't feel that I really learned anything about teaching social studies. My second semester Student Teaching Seminar also felt like a waste of
California State University Channel Islands

15
time (first semester was definetely worthwhile). Everything was unorganized and no one knew when or whom to turn in assignments to. Usually we'd show up and share our feelings about student teaching for the entire period. Also, I felt like they left us very unprepared for our "mock interview." We were not taught any interviewing skills. I went to my interview and got ripped apart. The fieldwork was the least valuable for me only because I was already in the classroom teaching gaining greater experience there than the fieldwork I was having to do to fulfill the course requirements.
Specific change(s) that should be made in your teacher credential program More work in front of others, more improvisation, more emphasis on how to use the tools (lesson guides given at each school) given to teachers in the classroom today. I wrote endless lesson plans and most working teachers tell me they never write lesson plans. So, why did I write them??? I needed to know how to effectively utilize the materials that would be provided to me at an actual school. I would like to see a course that gives you the opportunity to see the things teachers are required to do outside of actual teaching. An introduction to assessment for report cards. How to refer students to a student study team. My teacher preparation program needs to teach us scenarios of what do when different things happen in the classroom. It's nice to study philosophies, but it would have been nice if we had learned how to deal with irrate parents, etc. I would suggest making seminar more worth my time. I really felt it was a repeat of the information and knowledge i gained in my pre requisite and method classes. Many nights i felt like i could have been spending my time more wisely. However, i will add that the second semester seminar was much more beneficial than 1st semester. I would also suggest more preparation for the use of technology in the classroom. That is one area i really feel unsure about and this is the way of education. Also, the TPAs were so painful and i feel like i gained nothing from them, i did not understand the purpose. They were so repetitive and monotonous. I suggest a drastic overhaul of this practice.
Key Assessment #6: CSU System-wide One-Year-Out Survey Description of the assessment The CSU System-wide Evaluation of Teacher Preparation is an annual survey of credential graduates and their employers addressing level of preparation in five major areas. The aim is to help CSU close gaps and remedy shortcomings in the future preparation of teachers. Data collection process At the end of the first year of teaching, CSU graduates’ and their school-site supervisors answer an extensive set of common and credential-specific selected response questions. Additionally, CSU teaching graduates are invited to respond in their own words to three open-ended questions that mirror those asked in the program Exit Survey: • Name the one course in your credential program that was most valuable in your preparation for teaching.
Briefly tell what made the course valuable for you. • Which element of your teaching credential program was least valuable for you as you prepared for teaching?
Briefly tell what made this element of the program the least valuable for you. • Based on your recent experience as a classroom teacher, what specific change(s) would you recommend in the
teacher preparation program where you earned your teaching credential? Employers are asked to respond in their own words to two open-ended questions: • Describe the knowledge, skill or ability in which this beginning teacher is most proficient, and that prospective
teachers would ordinarily learn in a university. • Describe the most serious gap in this new teacher’s knowledge, skills or abilities that prospective teachers
should learn in a university.
California State University Channel Islands

16
Responses are voluntary. Many participants chose only to respond to some open questions. Questions that are thematically related are grouped into 26 composite scores and reported to each campus and a comparison is made to the mean of all CSU campus responses. Summary of aggregated data Thirty nine graduates of the CSUCI Multiple Subject program and twelve employers responded to the questions. The data presented represent their responses on questions specific to Multiple Subject Program. This table shows how the perception of program completers (teachers) and their principals (supervisors) differ.
Well or Adequately Prepared CSU System-wide Survey One-Year Out: Supervisors and First Year Teachers
From CSUCI Composite Graphs for Year 7 Report CSUCI All CSU A1 Supervisor K-8 Supervisors Assess the Overall Effectiveness of CSU Multiple Subject Credential
Programs 88% 80%
A1 Teacher First Year Multiple Subject Teachers Assess the Overall Effectiveness of Their CSU Credential Programs
85% 72%
B1 Supervisor K-8 Supervisors Assess CSU Preparation of Multiple Subject Teachers for Reading Language Arts Instruction (K-8)
91% 82%
B1 Teacher First Year Multiple Subject Teachers Assess Their CSU Preparation for Reading-Language Arts Instruction (K-8)
89% 81%
B2 Supervisor K-8 Supervisors Assess CSU Preparation of Multiple Subject Teachers for Mathematics Instruction (K-8)
86% 84%
B2 Teacher First Year Multiple Subject Teachers Assess Their CSU Preparation for Mathematics Instruction (K-8)
86% 81%
B7 Supervisor Supervisors Assess CSU Preparation to Teach Subjects Other than Reading & Math (K-8) 81% 78% B7 Teacher Multiple Subject Teachers Assess Their CSU Preparation to Teach Subjects Other than
Reading and Math (K-8) 78% 60%
D1 Supervisor School Supervisors Assess Preparation of Teachers for Equity and Diversity in Teaching 92% 79% D2 Supervisor Primary-Grade Supervisors Assess CSU Preparation of Teachers to Teach Young
Children (K-3) 99% 81%
D7 Supervisor School Supervisors Assess CSU Preparation of Multiple Subject-Single Subject Teachers to Teach Special Learners in Inclusive Schools
90% 79%
D7 Teacher First-Year Multiple Subject-Single Subject Teachers Assess Their CSU Preparation to Teach Special Learners in Inclusive Schools
81% 69%
E1 Teacher CSU Teachers Assess the Overall Value of Professional Coursework in Their First Year of Teaching
79% 75%
Verbatim responses from the CSU year out survey of CSUCI Multiple Subject credential graduates and their supervisors. The selection of results that follow shows, in graduates’ comments to Questions 17-19, which were the most frequently referenced aspects of the MS program. All categories of supervisors’ comments for Question 17 are noted. The numbers and percentages indicate the actual number of respondents and the percentage they represent of the whole group. Multiple Subject Credential Responses Only Part I Question 17: “…please name the one course in your credential program that turned out to be most valuable in your subsequent teaching. 17: 38% A. Comments that relate to subjects of the K-12 school curriculum. A-1: Reading, Language Arts, and English Methods Courses—includes reading, literacy, language arts, English, and writing courses. 10: 26% B. Comments that cut across all subjects of the K-12 school curriculum.
California State University Channel Islands

17
B-4: Classroom Management Courses—includes comments regarding entire courses in classroom management, behavior management, and classroom organization, as well as comments regarding components of classes devoted to these subjects. 6 16% B-9: Field-Study Courses—includes comments related to student teaching, observation, internships, other field-study experiences, and their related seminars and mentors. 6 :16% C. Other comments that do not fit into the categories in Sets A or B above C-4: Everything Valuable - includes comments in which the respondent indicated that all elements of the program were valuable. 7 : 21% Question 18: “Which element of your teaching credential program was least valuable for you in your subsequent teaching? 18: 39% A. Comments that relate to subjects of the K-12 school curriculum. A-1: Reading, Language Arts, and English Methods Courses - includes reading, literacy, language arts, English, and writing courses. 4 :12% B. Comments about aspects of the program that cut across all subjects of the school curriculum. B-1: Classroom Management Courses—includes comments regarding any courses in classroom management or behavior management and comments regarding components of classes that address these areas. 3: 9% C. Other comments that do not fit into the categories in Sets A or B above. C-6: Instructional Methodology/Requirements of the Program—includes comments related to method of instruction, instructional content, and program requirements. 4 :12% Question 19: “Based on your recent experience as a classroom teacher, what specific change(s) should be made in the teacher preparation program where you earned your teaching credential? Number of Graduates who responded to question 19: 39% A. Curricular features of the program. These categories include comments regarding the breadth and depth of program content (scope), the order of presentation (sequence), and time allotment for both individual course elements and the program as a whole (pacing). A-6: Methods Course Specifics—includes teaching of reading, math, science, social studies, P.E., art, etc. 7: 20% B. Non-curricular features of the program. These categories include comments regarding elements of the program that bear on program effectiveness, but do not speak directly to course content. B-2: Classroom Experience—includes amount, variety and continuity of K-12 classroom experience and observation. 2:6% B-3: Classroom Supervision—includes University supervisors, mentor teachers, and other onsite supervisors. 2: 6% B-7: Program Flexibility—includes comments regarding the need for flexibility in class meeting location, attendance requirements, addressing the needs of working students, tailoring program to alternative credentialing routes, etc. 2: 6% Part II: Supervisor Question 17: “…please describe the most serious gap in this new teacher’s knowledge, skills or abilities that prospective teachers should learn in a university.” Number of Supervisors who responded to question 17: 8% A. Assessment to inform instruction. This category includes designing authentic assessments, checking for understanding, interpreting/analyzing data, grading, action research, etc. 1: 17% E. Differentiating instruction. This category includes meeting the needs of individual students, mainstreaming English Language Learners, modifying curriculum, intervention, gifted students, cultural and socioeconomic considerations, etc. 1: 17% G. Lesson delivery and pacing. This category includes using time effectively, staying focused, sticking to most important points, maintaining interest, etc. 2: 33% L. Specific instructional strategies/methodology. This category includes Writing Workshop, math manipulatives, content area reading, critical thinking, test taking skills, activity variety, etc. 1 :17% P. No gaps. This category includes any comment that indicated the beginning teacher had no gaps in training.1: 17%
California State University Channel Islands

18
Analysis of Candidate Assessment Data Findings from Key Assessment #1: Teaching Performance Assessment Instructional Planning: • Both performance assessment instruments - TPA Task 4, Spring 2007, and PACT, Fall 2008
- indicate MS candidates competence in this area is high. • Program implications: Ensure maintenance of current practice.
Instruction and Reflection: • 43 – 45% candidate competence were rated either a 2 or a 1 (i.e., minimally passing or
failing). • Program implications: More explicit attention to developing candidates’ pedagogical skills
(i.e., engaging students in learning and monitoring learning during instruction) and reflective abilities (i.e., monitoring student progress and reflecting on learning).
Academic Language: • Candidate competence in this area is average, with about half scoring in the high-end range
and half minimally passing. • Program implications: More explicit attention to developing candidates’ understanding of
and ability to support academic language is warranted.
Assessment: • Candidate competence in the area of assessment is average, with about half scoring in the
high-end range and half minimally passing. • Program implications: More explicit attention needs to be given to developing candidates’
abilities to analyze student work and to use assessment to inform teaching. Findings from Key Assessment #2: Student Teacher Evaluations Candidates’ strengths across cohorts:
• Professionalism: disposition, growth, and professional/legal/ethical obligations • Instructional planning • Positive rapport with students and positive social environment
Candidates’ areas for growth across cohorts: • Classroom organization: transitions, routines/procedures, clarity of expectations • Assessment: noticing patterns of understanding and errors; opportunity for students to
self assess; connects lesson assessment plan to learning outcomes. • Instructing and supporting all learners: student engagement; instructional strategies for
teaching all students; accommodating special learning needs including English learners and students with special needs
Program implications: • Ensure maintenance of current practice in the areas of instructional planning, facilitation
of professional disposition and growth, and establishing positive rapport/environments with students.
• More explicit attention to developing candidates’ abilities in the areas of classroom organization, assessment, and instructing/supporting all learners is warranted.
California State University Channel Islands

19
Findings from Key Assessment #3: Practice Teaching Experience Survey
• Data show candidates highly value and gain much from their student teaching experiences. This is consistent with qualitative data available on our candidates in the CSU System-wide exit survey.
• More experienced students’ comments highlight the essential shift in focus from “I” to “them”. The ultimate success of second semester candidates largely lies in their ability to see what each student knows and can do in order to plan what is next for each student to learn.
• Initial semester respondents were those who piloted PACT in Fall. This experience reflects in their focus on PACT, mathematics and specific needs of students
Program implications: • Continue current practice in securing placements that provide candidates with access to
diversity in the classroom • Use second-semester candidates’ responses as a means of helping first-semester
candidates to maximize their field experience and shift attention toward students. Findings from Key Assessment #4: Mock Interviews (Fall 2007)
• Two-thirds to three-quarters of our second-semester candidates were rated highly for their appearance, communication style, and résumé. This result correlates with the strength in professionalism noted in supervisors’ evaluations of student teaching (key assessment #2).
• One-third of candidates were rated highly for their use of pedagogical language and for ability to respond to questions to reveal deep pedagogical knowledge.
Program implications: also see findings from key assessments #1 and #2, noted above.
• Examine how all courses plan to ensure opportunities for candidates do learn and practice using pedagogical language and to better articulate their acquired pedagogical knowledge.
Findings from Key Assessment #5: CSU System-wide Exit Survey The Exit Survey data reveal that more than 80% of exiting Multiple Subject candidates believe that the CSUCI program has enabled them to confront many of the challenges they will face as they begin teaching. • Exiting students indicate that they are well prepared in all state adopted curriculum content
areas and in ways to assist the social as well as academic growth of students. • They have confidence in their abilities to effectively plan, organize and manage equitable
instructional activities by using multiple methods to assess students, to meet specific learning needs by employing a variety of teaching strategies, to manage behavior and use routines to manage time.
• The most valued source of learning pedagogical skills is from the fieldwork practicum and guidance received from cooperating teachers during student teaching experiences.
California State University Channel Islands

20
Although the CSU report notes that qualities of teacher preparation programs are often invisible to students while they are enrolled in them, more than 83% of CSUCI MS credential candidates were able to recognize the mandated qualities of the program: • The structure of the program gradually allows student to assume more responsibility. • Field placement sites are welcoming environments that provide good learning opportunities
and constructive advice for students. • The student body is diverse and cohort model fosters supportive relationships amongst
students. • While scheduling makes the course intense, students indicate the blend of course and field
work enables them to connect theory to practice and that the hard work reflects the reality of job of teaching.
Areas of deficit: • Graduates would value more preparation in teaching visual and performing arts and health
education. • Students did not think child and adolescent development, learning or motivation theory are
sufficiently addressed within the program. • Training in the use of technology, either as an instructional, research or management tool,
is underprovided. • Devoting seminar time to the implementation and completion of the CA TPAs was
regarded as both a waste of valuable time and poorly organized. Recommendations for program changes: • Creating course assignments that are more meaningful to practice • Restructuring and redesigning the seminars and some courses • Clearer explanation of and expectations for the TPA • Reconfiguring the time spent in the classroom prior to student teaching • A closer working relationship between cooperating teacher and university supervisor • More equitable treatment of and attention to part time and evening cohort students
Findings from Key Assessment #6: CSU System-wide One-Year-Out Surveys Data from the One-Year-Out Survey from both program graduates and their supervisors is closely attended to each year by the CSUCI faculty. Graduates, able to ground evaluation of their learning and experiences in practice, pinpoint both their gains as well as the gaps in the program. Graduates’ and supervisors’ suggestions factor into program development plans.
• 90 - 99% of the participating supervisors rated the Multiple Subject graduates in their schools as being ‘well or adequately prepared’ across the curriculum to assess, plan equitable instruction and to motivate K-3 grade learners, including those with special needs and English language learners and to reflect on their teaching.
• While only 81% to 84% of the first year teachers considered themselves to be ‘well or adequately prepared’ on the same dimensions.
California State University Channel Islands

21
Graduates’ responses reflect feelings of self-efficacy and confidence but also reveal anxieties created by particular situations. Their supervisors’ perspectives offered a more objective, broader view of the preparedness and training of the CSUCI graduates in relationship to other beginning teachers.
• 94% of the supervisor responded that the beginning teachers are ‘well or adequately prepared’ to use educational technology.
• 70% of MS graduates ranked technology use as one of their lowest areas of preparedness - lowest of all areas they were questioned about.
Possibly, supervisors’ familiarity with technology lags behind that of the beginning teachers affecting the benchmark of what constitutes skill and access.
Areas of convergence between the assessment of the first year teachers and their supervisors:
• 88% of supervisors and 85% of the first year teachers assessed the overall effectiveness of the CSUCI Multiple Subject Program as having ‘well or adequately prepared’ them.
• In terms of teaching subjects other than reading and math, 81% of supervisors and 78% of CSUCI graduates thought they were ‘well or adequately prepared’ by the program.
• Both constituent groups rated highly the first year teachers’ preparation for teaching K-3. However, 26% of both supervisors and program graduates did not assess the first year teachers as ‘well or adequately prepared’ to teach older 4-8th grade students as the Multiple Subject credential indicates.
California State University Channel Islands

22
IV. Use of Assessment Results to Improve Candidate and Program Performance The use of wide array of assessment instruments portrays what CSUCI Multiple Subject credential candidates can do at various stages of their initial professional development and examine different domains of skills, knowledge acquisition and performance. Based on commonalities across the data sets, the following adjustments, modifications and changes will take place beginning AY 2008-2009. Issue Proposed Changes/Plan of Action Data Source/s PACT – preparation of candidates
Piloted Spring 2008: To continue. PACT preparation for Elementary Mathematics task moved from Math Methods to Initial Student Teaching Seminar (EDMS 566). Prevents erosion of Math Methods content.
Key Assessment #1b Key Assessment #5 Key Assessment #6
PACT support Beginning Fall 2008: Advanced Student Teaching Seminar (EDMS 576) increased from 1 to 2 units. Allows time to support students in completing PACT while continuing job market preparation.
Solicited feedback from candidates. Key Assessment #5 Key Assessment #6
PACT-Academic Language and Reflection
Ongoing: More faculty members to become certified evaluators. Direct instruction about PACT and academic language to be incorporated into Methods coursework and seminars, and Reflection systematically introduced in prerequisite courses.
PACT Assessors meeting Key Assessment #1b Key Assessment #2 Key Assessment #6
PACT- Embedded Signature Assessments
Multiple Subject Program continue meeting to develop plans for the implementation of ESAs in core content courses.
Key Assessment #1
Methods Courses Beginning Fall 2008: Literacy 1 and Math Methods increased from 3 to 4 units. Additional time to ensure better coverage of content related to RICA and PACT.
Key Assessment #2 Key Assessment #5 Key Assessment #6
Use of Technology Early Fall 2008: Faculty retreat in to discuss technology in the program especially focusing on requiring technology based assignments in various forms and formats. Create technology plan matrix that identifies standards, desired skills and where in program skills are being taught, reinforced, and mastered.
Key Assessment #3 Key Assessment #4 Key Assessment #5 Key Assessment #6
Preparedness to teach subjects other than reading and math.
Early Fall 2008: Meet with faculty in to discuss how to reinforce and infuse students’ earlier exposure to visual and performing arts within the program.
Key Assessment #6 Key Assessment #5
California State University Channel Islands

23
Single Subject Program
Credentials awarded: Single Subject (English, Mathematics, Science) Single Subject Intern (English, Mathematics, Science)
Program Contact: Dr. Jeanne M. Grier
Phone: 805-437-8987
E-Mail: [email protected] I – Contextual Information The Teacher Credential Programs at CSU Channel Islands serve Ventura and southern Santa Barbara counties. All credential programs in the School of Education prepare candidates to teach children with English as a first or second language, understand and relate to diversity of languages and cultures, and meet the diverse needs of all students including those with special needs. The Single Subject program enrolled the first cohort of candidates in Spring 2004 in the content areas of mathematics, science, and English. Candidates enter the program with an undergraduate degree and verified subject matter competency. The single subject credential program is designed to prepare teachers for diverse classrooms in middle and high school settings in California. In 2007 the program consisted of six courses: one general methods class, two subject-specific methods classes, one secondary literacy class, and two classes on access to learning—one for special needs learners and one for English Language Learners. During each semester that candidates are enrolled in classes, they must have a supervised field placement in a middle or high school setting—with at least one placement in a “high needs” school district. Classes are taught in the first eight weeks of the semester while candidates are participant/observers in a middle or high school class in their content area one day per week. During the last eight weeks of the semester full-time candidates transition into full time student teaching while part-time candidates continue as participant/observers one day a week. All candidates complete two eight-week supervised student teaching assignments: the first in a middle school and the second in a high school. Candidates can complete the program full-time in two semesters or part-time in up to six semesters. A cohort model is used in the program for full-time candidates. Candidates in all subject areas enter the program each semester and take classes together with the exception of the two subject specific methods classes, which are taught by discipline. Part-time candidates begin two courses with one cohort but overlap courses with other cohorts to complete the program. Candidates who are hired to teach in local schools without a credential are teaching Interns and can complete the program in three or four semesters. For the first semester Interns are required to be part-time and take only two classes with a supervised field placement. Interns then take one or two classes for the remaining two or three semesters and complete a supervised student teaching in their own classroom. In 2007, twelve candidates (math = 10; science = 0; English = 2) were Interns for either one or both semesters.
California State University Channel Islands

24
Program Specific Candidate Information January 1, 2007 – December 31, 2007
Semester Number of Candidates Number of Completers/Graduates
Spring 28 (math = 10; science = 4; English = 14) 10 (math = 3; science = 1 ; English = 6)Fall 23 (math = 11; science = 3; English = 9) 9 (math = 4; science = 1; English = 4)
Changes Since Commission Approval of Current Program Document Major changes in the Single Subject Program since Spring 2004: Fall 2004
• Coursework re-sequenced to accommodate part-time candidates’ schedules • Program Portfolio is piloted using Taskstream • Schedule changed from 10 weeks of courses with 6 weeks of student teaching to 8 weeks
of courses with 8 weeks of student teaching Fall 2005
• Supervisors conducted two informal and four formal observations (increased from three) for a total of six visits to full-time student teachers
• Process for determining readiness for student teaching and program completion modified for revised program structure
• A formative and summative portfolio structure and process assessed candidate progress Fall 2006
• Lesson planning moved from prerequisite EDUC 520 and added to program course EDSS 530
Fall 2007
• Final cohort of exit portfolio completers graduated • PACT initially piloted with first semester student teachers • EDSS 540 offered as two sections—one for Single Subject candidates, and one for
Education Specialist Level I candidates • Two student teaching seminars (EDSS 575 and 585) increased from one unit to two units
to prepare candidates for PACT • English methods sequence (EDSS 533 and EDSS 543) renamed to align with the other
disciplines To be implemented in Spring 2009
• EDSS 515 Adolescent Development for Secondary Educators added as a prerequisite course to Single Subject program beginning Fall 2009
• History/Social Studies added as an additional credential area with two methods courses: EDSS 534 Teaching in History/Social Studies Middle Schools and EDSS 544 Teaching History/Social Studies in High Schools
• EDSS 540 removed from curriculum sequence for Single Subject Credential candidates and literacy components incorporated into high school methods courses
California State University Channel Islands

25
• High school methods courses (EDSS 541, 542, 543, 544) increased units from three to four to accommodate literacy content
II. Candidate Assessment/Performance and Program Effectiveness Information
This section identifies the data collected during Spring 2007 and Fall 2007 for the following Key Assessments:
#1 Midterm and Final Student Teaching Evaluations #2 Exit Portfolio or PACT #3 Single Subject Program End of Year Survey #4 CSU System-wide Exit Survey #5 CSU System-wide One Year Out Survey
Key Assessment #1: Midterm and Final Student Teaching Evaluations Description of the assessment Candidates are evaluated on the following categories:
1) Planning 2) Instruction 3) Management 4) Professional Characteristics
The following rating scale is used in the Midterm and Final evaluations:
3 Noteworthy evidence that the candidate meets this criterion 2 Considerable evidence that the candidate meets this criterion 1 Some evidence that the candidate meets this criterion 0 No evidence that the candidate meets this criterion N/A Not applicable or not observed
Data collection process The onsite cooperating teachers and the assigned university supervisors evaluate the single subject candidates at both midterm and end in each of the two student teaching experiences (EDSS 575: Middle School Student Teaching and EDSS 585: High School Student Teaching). Data presented represent cooperating teacher and university supervisor aggregated evaluations.
California State University Channel Islands

26
Summary of aggregated data EDSS 575: Student Teaching Middle School MIDTERM EVALUATIONS Planning Instruction Management Professional SP’07 EDSS 575 (n=8) 2.54 2.07 2.17 2.59 FA’07 EDSS 575 (n=4) 2.92 2.32 2.58 2.83 2.73 2.20 2.37 2.71 FINAL EVALUATIONS Planning Instruction Management Professional SP’07 EDSS 575 (n=7) 2.85 2.8 2.69 2.93 FA’07 EDSS 575 (n=7) 2.93 2.73 2.86 2.94 2.89 2.77 2.78 2.94 EDSS 585: Student Teaching High School MIDTERM EVALUATIONS Planning Instruction Management Professional SP’07 EDSS 585 (n=8) 2.81 2.66 2.63 2.98 FA’07 EDSS 585 (n=4) 2.85 2.42 2.62 2.99 2.83 2.54 2.63 2.99 FINAL EVALUATIONS Planning Instruction Management Professional SP’07 EDSS 585 (n=9) 2.88 2.69 2.63 2.88 FA’07 EDSS 585 (n=5) 2.90 2.89 2.98 2.99 2.89 2.79 2.81 2.94 This following table shows final evaluation data for candidates that entered the program in Spring 2007 and completed the program in Fall 2007. 2007 Completer Cohort Data--Final Student Teaching Evaluations
2.5
2.55
2.6
2.65
2.7
2.75
2.8
2.85
2.9
2.95
3
3.05
Plan
ning
Instru
ction
Manag
emen
t
Profes
siona
l
SP’07 EDSS 575(n=7)FA’07 EDSS 585(n=5)
California State University Channel Islands

27
Key Assessment #2: Exit Portfolio or PACT Description of the assessment: Single Subject Exit Portfolio The Single Subject Exit Portfolio was created in Fall 2004 and was completed by all graduates through Fall 2007. There are four Core Competencies (with multiple sub-elements) for which candidates collect artifacts and write reflective narratives:
I. Learning Environment II. Instructional Process III. Learning About Students IV. Professionalism
A rubric was developed that evaluated the reflective narratives on three criteria:
Knowledge, Skills, and Dispositions Connection to TPEs Writing: Grammar and Mechanics
All scorers were trained to assess candidates’ responses to the rubrics. Data collection process During the first student teaching seminar, candidates completed the portfolio section “Learning Environment” for formative feedback. Candidates submit their full portfolio at the end of their second student teaching semester as a summative assessment. Candidates submit all work into Taskstream, an on-line portfolio system that was customized for the portfolio requirements. Summary of aggregated data: Portfolio Completers (Fall 2007 & Spring 2007)
Rubric Criteria Core Competency N Ave Median Std Dev
Knowledge, Skills & Dispositions Learning Environment 21 2.10/3 2 0.62 Connected to TPEs Learning Environment 21 2.57/3 3 0.51 Writing: Grammar & Mechanics Learning Environment 21 1.86/3 2 0.57 Knowledge, Skills & Dispositions Instruction Process 20 2.35/3 2.5 0.75 Connected to TPEs Instruction Process 20 2.75/3 3 0.55 Writing: Grammar & Mechanics Instruction Process 20 2.10/3 2 0.72 Knowledge, Skills & Dispositions Professionalism 20 2.00/3 2 0.32 Connected to TPEs Professionalism 20 2.15/3 2 0.59 Writing: Grammar & Mechanics Professionalism 20 1.95/3 2 0.22 Knowledge, Skills & Dispositions Learning about Students 20 2.20/3 2 0.52 Connected to TPEs Learning about Students 20 2.90/3 3 0.31 Writing: Grammar & Mechanics Learning about Students 20 2.10/3 2 0.72
Description of Assessment: PACT The Performance Assessment of California Teachers (PACT) is an alternative to the California TPA and was developed by a consortium of public and private universities to meet the mandated Teacher Performance Assessment. PACT evaluates candidates on five tasks and a sixth criterion, all associated with a Teaching Event. The six categories are:
Task 1: Context Task 4: Assessment Task 2: Planning Task 5: Reflection Task 3: Instruction Academic Language
California State University Channel Islands

28
Data collection process In Fall 2007, the first semester student teaching cohort piloted PACT. In EDSS 571, the middle school student teaching seminar, the candidates received the overview of PACT and a schedule for distributing the five tasks over the course of the semester. The teaching event and related tasks were submitted for evaluation in mid-December. Candidates not completing the pilot submission will submit their Teaching Event in EDSS 581—either Spring 2008 or Fall 2008. Those data were not available at the time of this report. Summary of Aggregated Data The following table details the results of the five first-semester candidates who completed the entire PACT Teaching event in Fall 2007: three candidates in math, one in English, and one in science. Statistics by content area are omitted due to the low N, as well as to protect the anonymity of the candidates. PACT Results from Fall 2007 Pilot
Category N Ave Average for Group (%) Context (Task 1) 5 All candidates met 100 Planning (Task 2) 5 2.07/4 52 Instruction (Task 3) 5 1.83/4 46 Assessment (Task 4) 5 2.11/4 53 Reflection (Task 5) 5 2.25/4 56 Academic Language 5 1.67/4 42
Key Assessment #3: Single Subject Program End of Year Survey Description of the assessment At the end of each semester, candidates are asked to assess the program on 18 items related to their perception of preparation received thus far in the program. The following rating scale is used for the quantitative portion of the survey:
1=poorly prepared, 2=fairly prepared, 3= well prepared, 4= exceptionally well prepared Candidates also have the opportunity to include feedback on six open-ended questions and make additional comments. Demographic data related to candidate background and length of time in the program is also collected at this time. Data collection process The survey is given to candidates in EDSS 571 and EDSS 581 at the end of each semester.
California State University Channel Islands

29
Summary of aggregated data (Spring 2007 and Fall 2007) The candidates were asked “What is your level of preparation in each of the following areas? (NA=not applicable, 1=poorly prepared, 2=fairly prepared, 3= well prepared, 4= exceptionally well prepared). Their responses are as follows: N=37 candidates NA 1 2 3 4 Average 1. Lesson/daily planning 2 10 25 3.62 2. Long-term unit planning 3 3 15 15 3.08 3. Incorporating Content Standards into your lesson plans 2 8 27 3.62 4. Teaching literacy 2 3 5 9 18 3.2 5. Teaching mathematics 22 2 1 12 3.67 6. Teaching science 30 1 2 4 3.43 7. Teaching English 19 2 5 11 3.5 8. Teaching a diverse student population, including students with disabilities or special needs 1 1 2 13 20 3.44 9. Teaching English Language Learners 1 2 14 20 3.43 10. Teaching students with different learning styles 1 14 21 3.46 11. Learning about the background and culture of students 1 2 16 18 3.38 12. Assessment of student learning 3 10 24 3.57 13. Using a variety of teaching methods 1 9 27 3.46 14. Classroom management 1 6 11 19 3.30 15. Behavior management 3 4 14 16 3.16 16. Use of technology for teaching and learning 1 1 10 9 16 3.11 17. Communication with families 3 8 14 12 3.12 18. Reflecting on teaching 2 13 22 3.54 Candidates’ narrative responses to the following questions were consistent with the data above.
1. In what areas do you feel most strongly prepared to be a teacher and why? 2. What are your greatest concerns related to teaching? 3. Candidates were asked the following question, “What are the strengths of the Credential
Program? 4. What suggestions do you have for improving the coursework in the Credential Program? 5. What suggestions do you have for improving the field experiences and student teaching in the
Credential Program? 6. In what other ways would you like to see the program changed or improved for other students?
Key Assessment #4: CSU System-wide Exit Survey Description of the assessment Each year, the CSU Chancellor’s Office administers an on-line survey to all credential program graduates. Candidates rate the degree to which they were prepared on a lengthy list of items. Summary tables for the following areas related to the Single Subject Program are included:
CSU Coursework and Fieldwork in Learning to Teach [Table 25 A & B]
California State University Channel Islands

California State University Channel Islands
30
While all of this information is valuable, there is far too much to include in this report. We have chosen Tables 25 A & B: CSU Coursework and Fieldwork in Learning to Teach to focus on as this covers many areas that are pertinent to both candidate learning and program improvement. Additionally, candidates provided open-ended comments to several prompts. Due to the lengthiness of the responses, they are not included in this report, however, they were used to confirm and understand the numerical data. Data collection process At the end of each semester, graduating credential candidates are given a URL (www.csuexitsurvey.org) to complete a 30-minute on-line survey developed by the CSU Chancellor’s Office, along with a specific campus code. Data for each campus is aggregated by the system and reported to each campus.

31
Summary of aggregated data Table 25-A
CSU Coursework and Fieldwork in Learning to Teach: The Value and Helpfulness of Single Subject Programs When the 2006-07 Graduates Exiting these Programs Served as 7-12 Classroom Teachers During 2006-07
Evaluation Questions Answered by Graduates Exiting Single Subject Credential Programs in the CSU
This CSU Campus: Single Subject Programs
CSU System: Single Subject Programs
(1) (2) (3) (4) (5) (6) (7) (8) (9) (10) Based on your experience as a K-12 pre-service teacher, how valuable or helpful was instruction, support, and fieldwork in your Teaching Credential Program?
N Very or Some-what
A Little
Or Not
At All
Mean SD N
Very or
Some-what
A Little
Or Not
At All
Mean SD
A. How Valuable or Helpful was CSU Instruction in General Pedagogy?
1 Instruction in how children and adolescents grow and develop. 16 81.3% 18.8% 1.81 .403 2102 85.2% 14.8% 1.85 .356 2 Instruction in the implications of human learning and motivation. 18 94.4% 5.6% 1.94 .236 2113 86.3% 13.7% 1.86 .344 3 Instruction in school purposes, organization, issues and history. 18 94.4% 5.6% 1.94 .236 2090 82.7% 17.3% 1.83 .379 4 Instruction in methods of classroom teaching and management. 21 100.0% .0% 2.00 .000 2154 90.6% 9.4% 1.91 .292 5 Instruction in the teaching of English language learners (ELL). 21 100.0% .0% 2.00 .000 2156 86.6% 13.4% 1.87 .341 6 Instruction in cultural diversity and multicultural education. 21 100.0% .0% 2.00 .000 2159 88.5% 11.5% 1.88 .319 7 Instruction in teaching students with special learning needs. 21 95.2% 4.8% 1.95 .218 2145 82.0% 18.0% 1.82 .385 8 Instruction in using computer technology for classroom instruction. 21 85.7% 14.3% 1.86 .359 2101 79.8% 20.2% 1.80 .401 B. How Valuable or Helpful was CSU Program Information and Support?
1 Information and support provided in initial program orientation. 20 80.0% 20.0% 1.80 .410 2065 72.0% 28.0% 1.72 .449 2 Information, support, and solutions provided by the credentials
office. 19 84.2% 15.8% 1.84 .375 2042 70.8% 29.2% 1.71 .455
3 Information, support and advice provided by faculty advisor(s). 20 100.0% .0% 2.00 .000 2065 82.0% 18.0% 1.82 .384 4 Information provided in written materials (e.g., handbook,
catalogues, website). 20 95.0% 5.0% 1.95 .224 2084 75.6% 24.4% 1.76 .430
C. How Valuable or Helpful Were Fieldwork Assignments in CSU Programs?
1 My supervised teaching experiences in K-12 schools. 20 100.0% .0% 2.00 .000 2092 92.6% 7.4% 1.93 .262 2 My field work (e.g., school visits, observations, school-based course
assignments, etc.) and observations prior to supervised teaching. 20 100.0% .0% 2.00 .000 2105 86.7% 13.3% 1.87 .340 3 Discussions sponsored by the university during student teaching. 19 78.9% 21.1% 1.79 .419 1867 78.8% 21.2% 1.79 .409 4 Guidance and assistance from field supervisor(s) from the campus. 19 89.5% 10.5% 1.89 .315 2102 84.6% 15.4% 1.85 .361 5 Guidance and assistance from supervising teacher(s) in K-12 schools. 19 100.0% .0% 2.00 .000 2074 91.5% 8.5% 1.91 .279
California State University Channel Islands

California State University Channel Islands
32
Table 25-B CSU Coursework and Fieldwork in Learning to Teach: The Value and Helpfulness of Single Subject Programs
When the 2006-07 Graduates Exiting these Programs Served as 7-12 Classroom Teachers During 2006-07 Evaluation Questions Answered by Graduates Exiting Single Subject Credential Programs in the CSU
This CSU Campus: Single Subject Programs
CSU System: Single Subject Programs
(1) (2) (3) (4) (5) (6) (7) (8) (9) (10) Based on your experience as a K-12 pre-service teacher, how valuable or helpful was instruction, support, and fieldwork in your Teaching Credential Program?
N
Very or
Some-what
A Little Or Not At All
Mean SD N Very or Some-what
A Little Or Not At All
Mean SD
D. How Valuable or Helpful Was CSU Instruction in 7-12 Subject Pedagogy
1 Instruction in ways of teaching English classes in grades 7-12. 17 100.0
% .0% 2.00 .000 1328 80.7% 19.3% 1.81 .395
2 Instruction in ways of teaching Language Other than English classes in grades 7-12. 9 88.9% 11.1% 1.89 .333 993 67.3% 32.7% 1.67 .469
3 Instruction in ways of teaching Mathematics classes in grades 7-12. 9 100.0
% .0% 2.00 .000 828 68.2% 31.8% 1.68 .466
4 Instruction in ways of teaching Music classes in grades 7-12. 4 75.0% 25.0% 1.75 .500 574 51.6% 48.4% 1.52 .500 5 Instruction in ways of teaching Art classes in grades 7-12. 4 75.0% 25.0% 1.75 .500 578 52.2% 47.8% 1.52 .500 6 Instruction in ways of teaching Physical Education classes in
grades 7-12. 3 66.7% 33.3% 1.67 .577 637 58.4% 41.6% 1.58 .493 7 Instruction in ways of teaching Science (Biological Sciences)
classes in grades 7-12. 8 75.0% 25.0% 1.75 .463 631 56.7% 43.3% 1.57 .496 8 Instruction in ways of teaching Science (Physics) classes in grades
7-12. 6 66.7% 33.3% 1.67 .516 572 49.1% 50.9% 1.49 .500 9 Instruction in ways of teaching Science (Chemistry) classes in
grades 7-12. 6 83.3% 16.7% 1.83 .408 568 49.1% 50.9% 1.49 .500 10 Instruction in ways of teaching Science (Geosciences) classes in
grades 7-12. 6 50.0% 50.0% 1.50 .548 551 48.1% 51.9% 1.48 .500 11 Instruction in ways of teaching Health Science classes in grades 7-
12. 3 66.7% 33.3% 1.67 .577 623 53.8% 46.2% 1.54 .499 12 Instruction in ways of teaching Social Science classes in grades 7-
12. 3 66.7% 33.3% 1.67 .577 839 71.8% 28.2% 1.72 .450 13 Instruction in ways of teaching Agriculture classes in grades 7-12. 3 66.7% 33.3% 1.67 .577 485 41.0% 59.0% 1.41 .492 14 Instruction in ways of teaching Business classes in grades 7-12. 3 66.7% 33.3% 1.67 .577 488 43.4% 56.6% 1.43 .496 15 Instruction in ways of teaching Home Economics classes in grades
7-12. 3 66.7% 33.3% 1.67 .577 474 41.6% 58.4% 1.42 .493 16 Instruction in ways of teaching Industrial and Technology classes
in grades 7-12. 3 66.7% 33.3% 1.67 .577 506 45.8% 54.2% 1.46 .499

33
Key Assessment #5: CSU System-wide One-Year-Out Survey Description of the assessment The CSU Systemwide Evaluation of Teacher Preparation is an annual assessment of university graduates conducted by a central office of the CSU. It measures program effectiveness on three dimensions.
1. the extent to which K-12 teachers are prepared effectively for their most important teaching responsibilities
2. the extent to which CSU professional coursework and fieldwork that the new teachers complete are professionally valuable and helpful to them during their initial year K-12 teaching, and
3. the extent to which programs that the new teachers completed in the CSU match in quality the program characteristics and features that are identified in professional accreditation standards.
The results of the survey are reported to each campus and a comparison is made to the mean of all CSU campus responses. The data are used to examine the quality of the program and identify areas in need of improvement. Data collection process The method used includes the graduates and their school-site supervisors answering an extensive set of common and credential-specific questions at the end of the graduates’ first year of teaching. Questions that are thematically related are grouped into 26 composite scores that represent important topics for programs to consider. The composites are considerably more reliable than responses to any individual item. Validity and reliabilities studies have been completed on the survey.
California State University Channel Islands

lifo e Un
34
Ca rnia Stat iversity Channel Islands
Summary of Aggregated Data CI Composite Graphs for Year 7 System-wide One Year Out Report--Single Subject Credential Program Well or adequately prepared All CSU CSUCI A2 Supervisor Secondary Supervisors Assess the Overall Effectiveness of CSU Single Subject Cred. Programs 82% 100% A2 Teacher First-Year Single Subject Teachers Assess the Overall Effectiveness of Their CSU Credential Programs 73% 83% B3 Supervisor Secondary School Supervisors Assess CSU Preparation of Single Subject Teachers of English (7-12) 92% 100% B3 Teacher Single Subject Teachers of English Assess Their CSU Preparation for English Instruction (7-12) 75% 100% B4 Supervisor Secondary School Supervisors Assess CSU Preparation of Siqngle Subject Teachers of Math (7-12) 84% 100% B4 Teacher Single Subject Teachers of Math Assess Their CSU Preparation for Math Instruction (7-12) 79% 78% B5 Supervisor Secondary School Supervisors Assess CSU Preparation of Single Subject Teachers of Science (7-12) 90% 100% B5 Teacher Single Subject Teachers of Science Assess Their CSU Preparation for Science Instruction (7-12) 76% 95% B6 Supervisor Secondary School Supervisors Assess CSU Preparation of Single Subject Teachers of History (7-12) 91% n/a B6 Teacher Single Subject Teachers of History Assess Their CSU Preparation for History Instruction (7-12) 77% n/a B8 Supervisor Secondary School Supervisors Assess CSU Preparation to Teach Subjects Other than Four Core Subjects (7-12) 92% 100% B8 Teacher Single Subject Teachers Assess Their CSU Preparation to Teach Subjects Other than Four Core Subjects (7-12) 81% 100% B9 Supervisor Secondary School Supervisors Assess CSU Preparation to Develop Reading Skills in Content Classes (7-12) 76% 100% B9 Teacher Single Subject Teachers Assess Their CSU Preparation to Develop Reading Skills in Content Classes (7-12) 68% 86% C1 Supervisor School Supervisors Assess CSU Preparation of Teachers to Plan Instruction 84% 94% C1 Teacher First-Year Teaching Graduates of the CSU Assess Their Preparation to Plan Instruction 78% 90% C2 Supervisor School Supervisors Assess CSU Preparation of Teachers to Motivate Students 82% 92% C2 Teacher First-Year Teaching Graduates of the CSU Assess Their Preparation to Motivate Students 77% 84% C3 Supervisor School Supervisors Assess CSU Preparation of Teachers to Manage Instruction 81% 89% C3 Teacher First-Year Teaching Graduates of the CSU Assess Their Preparation to Manage Instruction 72% 82% C4 Supervisor School Supervisors Assess CSU Preparation of Teachers to Use Education Technology 85% 94% C4 Teacher First-Year Teaching Graduates of the CSU Assess Their Preparation to Use Education Technology 61% 70% C5 Supervisor School Supervisors Assess CSU Preparation of Teachers for Pedagogy Across the Curriculum 82% 93% C5 Teacher First-Year Teaching Graduates of the CSU Assess Their Preparation for Pedagogy Across the Curriculum 74% 82% C6 Supervisor School Supervisors Assess CSU Preparation of Teachers to Assess and Reflect on Instruction 81% 94% C6 Teacher First-Year Teaching Graduates of the CSU Assess Their Preparation to Assess and Reflect on Their Instruction 75% 86% D1 Supervisor School Supervisors Assess CSU Preparation of Teachers for Equity and Diversity in Teaching 79% 92% D1 Teacher First-Year Teaching Graduates of the CSU Assess Their Preparation for Equity and Diversity in Teaching 72% 84% D3 Supervisor Middle-Grade Supervisors Assess CSU Preparation of Teachers to Teach Middle-Grade Pupils (4-8) 81% 84% D3 Teacher Teaching Graduates in Grades 4-8 Assess Their CSU Preparation to Teach Middle-Grade Students 75% 84% D4 Supervisor High School Supervisors Assess CSU Preparation of Teachers to Teach High School Students (9-12) 82% 100% D4 Teacher Single Subject Teachers in Grades 9-12 Assess Their CSU Preparation to Teach High School Students 72% 78% D5 Supervisor School Supervisors Assess CSU Preparation of Teachers to Teach English Learners 80% 90% D5 Teacher First-Year Teaching Graduates of the CSU Assess Their CSU Preparation to Teach English Learners 75% 84% D7 Supervisor School Supervisors Assess CSU Preparation of MS-SS Teachers to Teach Special Learners in Inclusive Schools 79% 90% D7 Teacher First-Year MS-SS Teachers Assess Their CSU Preparation to Teach Special Learners in Inclusive Schools 69% 81% E1 Teacher CSU Teachers Assess the Overall Value of Professional Coursework in Their First Year of Teaching 75% 79% E2 Teacher CSU Teachers Assess the Overall Value of Credential Program Fieldwork in Their First Year of Teaching 81% 88%

35
III. Analysis of Candidate Assessment Data Key Assessment #1: Midterm and Final Student Teaching Evaluations Data from this key assessment indicates candidates are progressing in their abilities in the areas of planning, instruction, management, and professional characteristics in each student teaching experience (midterm to final) and over the course of the credential program (first semester to second semester). Candidates in their first semester of student teaching are expected to have a “2” or higher on 70% of the final evaluation items to be considered passing. Second semester candidates are expected to have a “2” or higher on 80% of the final evaluation items for a passing grade. All data indicate that single subject candidates are exceeding expectations of competence each semester. Key Assessment #2: Exit Portfolio or PACT Exit Portfolio Data from the exit portfolio indicates that students are meeting and in some cases, exceeding the minimum criteria for successfully completing the portfolio. The minimum standard for each Core Competency is an average of 1.67 across the three rubric criteria categories: knowledge, skills, and dispositions; connected to TPEs; and writing: grammar and mechanics. Candidates must score a “2” or higher in at least two of the criteria and may have no criteria score less than “1”. These data indicate that candidates do best on connecting the TPEs to their chosen portfolio artifacts across all categories. Making explicit connections to the TPEs has been an area of emphasis with the candidates throughout the program coursework. Candidates do less well on their writing, grammar, and mechanics in each of the Core Competency areas, although their skills are still above the minimum standards. Candidates scored highest in the area of Instructional Process and Learning about Students. These two areas are emphasized repeatedly in all of their program coursework and are the two areas in which candidates’ writing scores were the highest. Candidates’ lowest scores were in the area of Learning Environment and Professionalism. The Core Competency Learning Environment is submitted for formative feedback during their first semester. Often, candidate scores, although low, were considered passing and candidates did not attempt to revise their narratives. The Core Competency of Professionalism is an area candidates have in the past expressed difficulty in identifying appropriate artifacts that represent their professional qualities even though examples of artifacts are distributed each semester. Additionally, the data indicates that candidates had the most difficulty in writing about their learning environment and their professionalism. These two areas are less tangible to candidates as they deal with areas of their future plans and professional growth—something they may not have had time to fully develop in their two semesters of the credential program. PACT Data from the PACT Pilot semester indicate that the first semester student teachers successfully passed (a score of 2 or higher) four of the six PACT categories. Due to the low N, one student
California State University Channel Islands

36
who did not pass Task 3 (Instruction) lowered the passing rate for the entire group. However, in the category of Academic Language, three of the five candidates received scores of “1”. This result speaks more to the piloting nature of implementing PACT rather than candidate competence or program effectiveness. Single Subject program faculty had not been trained as evaluators at the time of guiding candidates through the pilot semester. Therefore, guidance on what the creators of PACT meant by “Academic Language” was not the same as how program faculty had interpreted the term. Key Assessment #3: Single Subject Program End of Year Survey Data from the End of Year Survey indicate candidates believe they are well prepared to teach. Items scoring closer to the “exceptionally well-prepared” end of the scale (3.5 or higher) were: lesson/daily planning; incorporating content standards into your lessons; teaching mathematics; teaching English; assessment of student learning; and reflecting on teaching. Items scoring closer to the “well-prepared” end of the scale (3.2 or lower) were: long-term unit planning; teaching literacy; behavior management; use of technology; and communication with families. The analysis of this section is difficult due to the data being entered by semester (Spring and Fall) rather than by candidates’ placement in the program (first vs. second semester). First versus second semester data would give us a better indication of what curricular pieces candidates had taken at the time of the survey rather than measuring their level of preparedness after experiencing the curriculum. For example, teaching literacy scored a 3.2 and is a second semester class. First semester student data would skew the result since they would not feel prepared at the time of the survey. However, use of technology and communication with families continues to be an area that is identified by candidates as an area for improvement. Candidates also commented on the redundancy of some of the program content. While most repetition is purposeful, the secondary literacy course (EDSS 540) is content that could be incorporated into other courses in the program making the literacy content more relevant to the subject matter areas. Key Assessment #4: CSU System-wide Exit Survey Candidate data collected from the exit survey provided some very useful feedback about how valuable candidates thought various program components were in their learning to teach process. In the area of General Pedagogy, six of the eight categories were ranked as very or somewhat helpful by 94.4% or higher of the candidates surveyed. The two areas ranking low for our campus were “Instruction in how children and adolescents grow and develop” and “Instruction in using computer technology for classroom instruction.” However, “Instruction in how children and adolescents grow and develop” was the only category in that section where CSUCI was not higher than the CSU average. In the area of Program Information and Support each of the items were rated higher than the CSU averages. The area scored lowest by CSUCI Single Subject graduates was “Information and support provided in initial program orientation” with 80% rating it as “very or somewhat helpful.” At CSUCI, we have a number of information sessions and orientations depending upon
California State University Channel Islands

37
where candidates are in the application and/or admission process. This question, then, may be confusing for some candidates. In the area of “Field Assignments in CSU Programs” candidates ranked the single subject program very high across all items, with the exception of “Discussion sponsored by the university during student teaching” which scored a 78.9% equivalent to the 78.8% CSU System average. Student comments varied in this data set, however, a recurring theme was the request to reduce redundancy in the program and incorporate the content of the secondary literacy course (EDSS 540) into another course—perhaps the content methods courses. Key Assessment #5: CSU System-wide One-Year-Out Survey The One-Year-Out Survey revealed that both CSUCI single subject graduates and their principals overall thought the first year teachers were well or very well prepared for their various teaching assignments. Out of 38 items, nine were rated at 100%, 25 items rated between 80 and 99%, and only four items were rated below 80%. Areas scoring 80% or lower at CSUCI were: B4—Single Subject Teachers of Math Assess their CSU Preparation for Math Instruction (7-12)
~78% C4—First-Year Teaching Graduates of the CSU Assess their Preparation to Use Education
Technology ~70% D4—Single Subject Teachers in Grades 9-12 Assess their CSU Preparation to Teach High
School Students ~78% E1—CSU Teachers Assess the Overall Value of Professional Coursework in their First Year of
Teaching ~79% However, in each of these areas, with the exception of B4, CSUCI ranked higher than the CSU average. The supervisors’ rating was higher than the graduates’ rating. This indicates that the graduates were performing well in their teaching assignments, yet, still felt they needed improvement in their own teaching. The B4 response is interesting because supervisors rated candidates’ preparation for math instruction higher than the candidates.
California State University Channel Islands

38
IV: Use of Assessment Results to Improve Candidate and Program Performance Issue Proposed Changes/Plan of Action Data Source/s PACT-Academic Language
Faculty members to become certified evaluators Incorporate more direct instruction about PACT and academic language in coursework and seminars
Key Assessment #2
Use of Technology Faculty retreat in early Fall 2008 to discuss technology in the program especially focusing on requiring assignments in various forms and formats using technology Create technology plan matrix that identifies desired skills and where in program skills are being taught, reinforced, and mastered
Key Assessment #3 Key Assessment #4 Key Assessment #5
Communication with Families
Meet with faculty in early Fall 2008 to discuss where family communication is being addressed and how Create a communication with families matrix that identifies desired skills and where in program skills are being taught, reinforced, and mastered
Key Assessment #3 Key Assessment #5
Adolescent Development
Creation of a prerequisite course for Single Subject Students
Key Assessment #4
EDSS 540 Secondary Literacy Course
Remove course from sequence and incorporate content into subject matter methods courses
Key Assessment #3 Key Assessment #4
California State University Channel Islands

39
Special Education Program Credentials awarded: Educational Specialist Mild/Moderate I Educational Specialist Mild/Moderate I Intern
Program Contact: Dr. Jill Leafstedt
Phone: 805-437-2792
E-Mail: [email protected] Report Preparers: Dr. Tiina Itkonen & Dr.Tim Rummel
[email protected] 805-437-3294 [email protected] 805-437-8429
I. Contextual Information The Education Specialist: Mild/Moderate Disabilities Credential Program is closely related to the Multiple Subject and Single Subject Credential Programs. The program builds on the content knowledge and pedagogical base that prepare teachers to serve the varied needs of our community. It is designed to contribute to the teaching profession by producing teachers who believe that all students have the ability to achieve high standards and who adapt their teaching to reach all students, who respect the diversity of all students; and incorporate these constructs into their daily teaching. Candidates complete the program in a variety of ways; as full-time, part-time or as an intern.
Program Specific Candidate Information
Semester Number of New Candidates Admitted
Number of Continuing Candidates Enrolled
Number of Completers/Graduates
Spring 2007 14 19 14 Fall 2007 16 15 11
Changes Since Commission Approval of Current Program Document. 1. Coursework
• Foundations of Special Education, SPED 541, was modified from 3 units to 2 units. This change allowed us to meet the standards for foundations, law, policy and ethics while allowing more room for an additional special education focused methods course. (Fall 2005)
• A new course Inclusionary Teaching Methods, SPED 544 (2 units) was added to the
curriculum. This addition has allowed candidates the opportunity to examine effective curriculum and instruction in inclusive settings. It also surveys a variety of core curricula across grade levels and content areas. (Fall 2005)
California State University Channel Islands
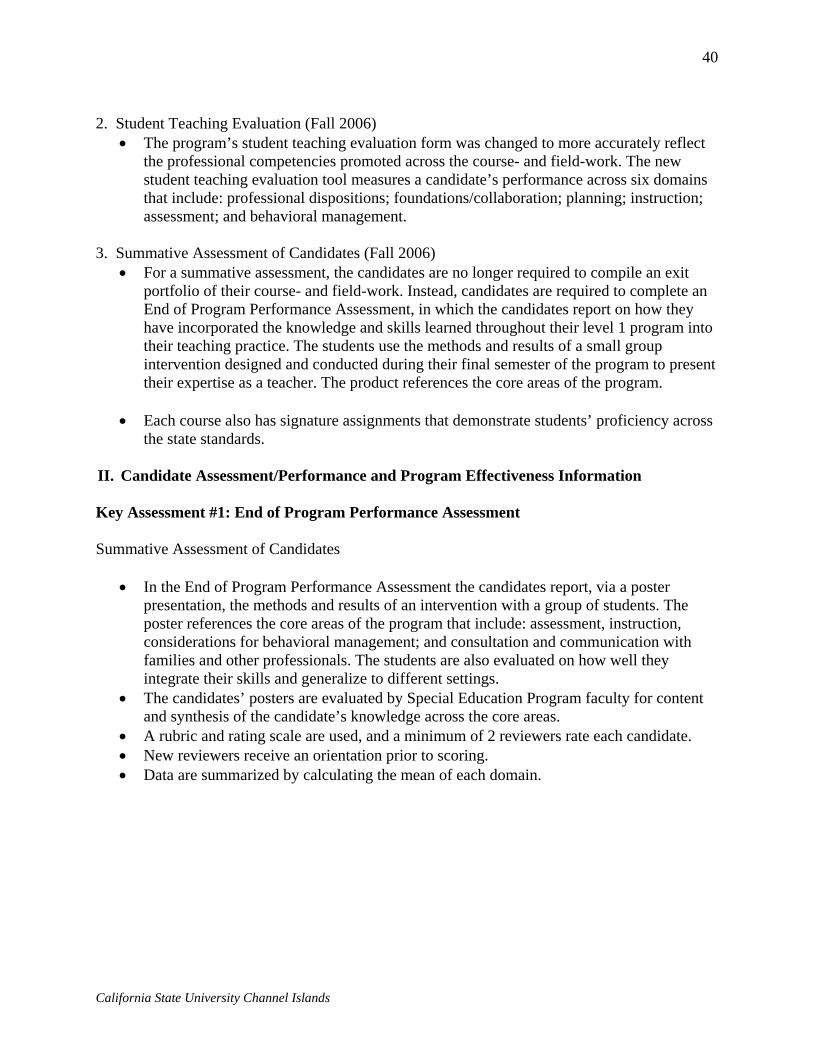
40
2. Student Teaching Evaluation (Fall 2006)
• The program’s student teaching evaluation form was changed to more accurately reflect the professional competencies promoted across the course- and field-work. The new student teaching evaluation tool measures a candidate’s performance across six domains that include: professional dispositions; foundations/collaboration; planning; instruction; assessment; and behavioral management.
3. Summative Assessment of Candidates (Fall 2006)
• For a summative assessment, the candidates are no longer required to compile an exit portfolio of their course- and field-work. Instead, candidates are required to complete an End of Program Performance Assessment, in which the candidates report on how they have incorporated the knowledge and skills learned throughout their level 1 program into their teaching practice. The students use the methods and results of a small group intervention designed and conducted during their final semester of the program to present their expertise as a teacher. The product references the core areas of the program.
• Each course also has signature assignments that demonstrate students’ proficiency across
the state standards. II. Candidate Assessment/Performance and Program Effectiveness Information Key Assessment #1: End of Program Performance Assessment Summative Assessment of Candidates
• In the End of Program Performance Assessment the candidates report, via a poster presentation, the methods and results of an intervention with a group of students. The poster references the core areas of the program that include: assessment, instruction, considerations for behavioral management; and consultation and communication with families and other professionals. The students are also evaluated on how well they integrate their skills and generalize to different settings.
• The candidates’ posters are evaluated by Special Education Program faculty for content and synthesis of the candidate’s knowledge across the core areas.
• A rubric and rating scale are used, and a minimum of 2 reviewers rate each candidate. • New reviewers receive an orientation prior to scoring. • Data are summarized by calculating the mean of each domain.
California State University Channel Islands

41
End of Program Performance Assessment
3.1
3.4
3.2
2.9
3.4
2.62.72.82.9
33.13.23.33.43.5
Syn
thes
is
Beh
avio
r
Met
hods
Com
mun
icat
ion
and
Con
sulta
tion
Ass
essm
ent
Content Area
Mea
n Sc
ore
Content Area
Key Assessment #2: CSU System-Wide Survey The CSU Systemwide Evaluation of Teacher Preparation is an annual assessment of university graduates from Multiple Subject, Single Subject and Educational Specialist Level I Programs conducted by a central office of the CSU. It measures program effectiveness on three dimensions.
1. the extent to which K-12 teachers are prepared effectively for their most important teaching responsibilities
2. the extent to which CSU professional coursework and fieldwork that the new teachers complete are professionally valuable and helpful to them during their initial year K-12 teaching, and
3. the extent to which programs that the new teachers completed in the CSU match in quality the program characteristics and features that are identified in professional accreditation standards.
The results of the survey are reported to each campus and a comparison is made to the mean of all CSU campus responses. The data are used to examine the quality of the program and identify areas in need of improvement. The method used includes the graduates and their school-site supervisors answering an extensive set of common and credential-specific questions at the end of the graduates’ first year of teaching. Questions that are thematically related are grouped into 26 composite scores that represent important topics for programs to consider. The composites are considerably more reliable than responses to any individual item. Validity and reliabilities studies have been completed on the survey.
California State University Channel Islands

42
Composite Findings of Preparation Effectiveness
1. First-Year Teachers Who Were Well and Adequately Prepared
as Assessed by Them and their Supervisor
All Candidates
Area Supervisor Composite
CSUCI %
Supervisor Composite
CSU %
Teacher Composite
CSUCI %
Teacher Composite
CSU %
Overall Program 93 78 81 72 Plan Instruction 92 79 86 78 Motivate Students 100 82 93 80 Manage Instruction 91 80 87 73 Use of Technology 96 77 56 55 Pedagogy Across Curriculum
95 79 83 75
Assessment and Reflection 97 82 88 79 Equity and Diversity 100 79 91 78 K-3 No
response 100 100 88
Middle School No response
100 96 73
High School No response
90 No response 54
English Learners 98 79 83 75 Special Education 95 80 84 78 Coursework 91 79 88 81
California State University Channel Islands

43
2. First-Year Teachers Who Were Well and Adequately Prepared
as Assessed by Them and their Supervisor
These Data Break Down the Preparedness of Former Interns (I) and Student Teachers (ST)
Note: CSUCI composites are on the first row in bold. CSU-wide composites are in parentheses (xx) on the second row.
Area SupervisorST %
SupervisorI
%
Teacher ST %
Teacher I
% Overall Program 86
(81) 99
(85) 71
(73) 90
(74) Language Arts (K-8) 75
(79) 100 (81)
50 (75)
90 (72)
Mathematics 75 (77)
100 (83)
55 (68)
76 (66)
Plan Instruction 84 (84)
100 (85)
78 (81)
91 (79)
Motivate Students 100 (84)
100 (86)
86 (82)
100 (83)
Manage Instruction 82 (81)
100 (85)
80 (75)
91 (77)
Use of Technology 92 (76)
100 (79)
38 (58)
55 (62)
Pedagogy Across Curriculum
89 (83)
100 (87)
71 (76)
93 (79)
Assessment and Reflection
94 (81)
100 (86)
77 (77)
100 (80)
Equity and Diversity 100 (82)
100 (85)
82 (79)
97 (79)
K-3 0 (87)
0 (89)
0 (80)
0 (75)
Middle School 0 (91)
0 (81)
0 (81)
94 (71)
High School 0 (84)
0 (87)
0 (81)
0 (81)
English Learners 97 (81)
100 (85)
83 (76)
96 (77)
Special Education 91 (81)
98 (87)
78 (75)
97 (80)
Coursework 88 (81)
93 (81)
81 (85)
92 (78)
California State University Channel Islands

44
Key Assessment #3: Summary of University Supervisor Final Student Teaching Ratings (SPED 571) Description The supervisors rate the student teacher at the completion of final student teaching. There are 6 composites in the rating form (professional disposition, foundation/collaboration, planning, introduction, assessment, and behavioral management). Each composite consists of 8-15 items. The data below are summaries of the forms. Data Analysis The percentages are calculated based on the number of students and the number of items in each category. For example: 24 students are included in Professional Dispositions and there are 14 items in the category. The total possible number of ranking is then 336. 96% of the rankings in this category (322) are in the Achieved (AC) column. Fourteen rankings are the in In Progress (IP) column.
Percentage of Field Supervisor Ratings on Teacher Behavior Composites
CATEGORY AC IP NI NO Professional Dispositions
(336)
96%
4%
0
0 Foundation/Collaboration
(207)
80%
14%
0
6% Planning
(276)
81%
15%
0
4% Introduction
(396)
84%
14%
0
2% Assessment
(180)
73%
20%
0
7% Behavioral Management
(171)
82%
15%
0
3% AC = Achieved IP = In progress NI = Needs improvement NO = Not observed III. Analysis of Candidate Assessment Data Strengths
- Candidates report actual student learning during their culminating project. Candidates demonstrate this well on the Intervention component of their culminating project (final candidate assessment).
California State University Channel Islands

45
- Overall preparation of candidates (1-year follow-up by supervisor and teacher has ratings that are well above CSU means)
- Strong link between course work and student teaching - Interns report being better prepared than student teachers - Candidates are rated by supervisors in final student teaching, as not needing improvement” in
any area. Areas for Improvement
- Integrate core areas (assessment, instruction, collaboration, behavioral supports) in final poster
- Develop a remediation strategy for candidates whose final posters are weak - Strengthen technology component (significantly lower preparedness percentages) - Strengthen content across curricula areas - Assessment is the weakest area in Key Assessment #3
IV: Use of Assessment Results to Improve Candidate and Program Performance
Areas of Strength Area Action Items Timeline Culminating project 1. Continue intervention approach in
culminating project
Each graduating cohort
Connection between course work and student teaching
1. Continue present practice on placing students in diverse settings each semester 2. Faculty and supervisors meet in the beginning of semester to go over courses and assignments 3. Provide syllabi for each field supervisor, to ensure that supervisors can guide course assignments in field placements
Before each semester First 2 weeks of semester First 2 weeks of semester
Areas of Improvement Area Action Items Timeline Culminating project 1. Develop guidelines to integrate the 4 core
areas in the final project to a greater, in-depth degree 2. Develop a remediation strategy for candidates whose final project (or sections of it) is/are weak
October 08 October 08
Technology 1. Faculty meeting to identify needs
August 19, 08
California State University Channel Islands

46
2. Develop an action plan 3. Implement action plan
September 08 Academic year 08-09
Content area knowledge
1. Discuss integrating content more deeply into all core courses with Multiple Subject, Single Subject and Education Specialist faculty
2. Modify course syllabi to reflect the
integration into existing courses and/or modify the program to include more content related courses
September 08
Assessment 1. Discuss assessments being done during student teaching with faculty, cooperating teachers and university supervisors.
2. Develop an action plan to more
systematically prepare candidates for assessment expectations during student teaching and internship.
3. Implement action plan
December 08
California State University Channel Islands

47
Special Education Program Credential awarded: Educational Specialist Mild/Moderate Level II Program Contact: Dr. Tiina Itkonen
Phone: 805-437-3294
E-Mail: [email protected] I. Contextual Information
Education Specialist Level 2 program is a state-mandated induction program for special education teachers, who hold a level 1 credential. The program consists of:
• Required course work (4 core courses, transition course) • Induction plan (Area of strength and need, and a specific plan to grow in each) • Non-university activities (60 hours of professional development activities) • Fieldwork tied to standards
The program began in 2005 with a two-year cohort. In Fall 2006, the second cohort started. First candidates graduated in Spring 2007. The program offers a 2-year and a 1-year plan of study. Program Specific Candidate Information Semesters Number of New
Candidates Admitted
Number of Continuing Candidates Enrolled
Number of Completers/Graduates
Spring 2007 1 16 11 Fall 2007 4 12 6
Changes Since Commission Approval of Current Program Document District Support Provider
• It has been difficult to recruit support providers without being able to compensate for their time. Although the program still tries and in some cases has been successful (e.g., when candidate is required to take BTSA by their district), a new support format was instituted in Spring 2007.
• Level 2 seminar is now run as a professional teacher circle with problem solving as the guiding force. Candidates bring real life issues to seminar, read relevant literature, problem solve and give each other guidance and ideas.
• Candidates are required to visit each other’s classrooms/programs. A candidate must choose a teacher whose area of strength is the candidate’s area of need on the induction plan.
• Candidates fill out a Teacher Circle Visitation form which asks: 1. What did I observe? 2. What did I learn? 3. How am I going to implement this in my classroom? The information is reviewed with the Level 2 Advisor.
California State University Channel Islands

48
• In some instances the candidate has visited a Level 2 graduate who has the specific expertise the candidate is working on. The teacher circles thus have expanded from current cohort to include previous cohorts.
University Support Provider
• The Level 2 advisor has taken the role of a university support provider and has weekly contact with the candidates through course work and/or seminar.
• University support provider does not visit candidates’ classes on a regular basis except when requested by the candidate, or if the Advisor determines a need based on course discussions.
• This decision was made for Fall 2006 after realizing in 2005-2006 that most candidates do not need classroom observations and formal feedback. The three university support providers agreed that candidates needed problem solving (learning to find solutions and network with peers).
Seminar 640
• It was changed from every semester to be required only during the first semester in Spring 2007. The planning during first semester in seminar was used in the real life problem solving that was occurring in the subsequent classes, so there was not a need for seminars each semester. Also the one unit class was moving students from part-time to full time tuition.
II. Candidate Assessment/Performance and Program Effectiveness Information
Key Assessment #1: Induction Portfolio Description
Candidates are assessed at the completion of the program using a portfolio. Portfolios include the following components:
• Induction plan for area of strength and need, developed during first semester • Reflection on growth for areas of strength and need, with specific evidence • Two artifacts for strength and need, to demonstrate performance • Standards and Competencies matrix to indicate performance across standards • Evidence of non-university activities
The Level 2 advisor works with students on their portfolios in the Final Induction Seminar (SPED 649). Feedback is given for each portfolio component. Assessment is two-fold: during portfolio development and assessing the final product. The development assessment is done in seminar by the seminar instructor. Final portfolio is reviewed by two faculty members.
Results Spring 07 1. Portfolio Development Assessment:
California State University Channel Islands

49
1. Reflection re-writes were required an average of 2.6 times (range, 1 to 10). Reasons: - lack of specific evidence (all candidates) - grammar and mechanics (5 candidates) - not a reflection (5 candidates)
2. Artifacts were asked to be changed (3 candidates): - Not thoughtful enough to show performance growth (turned in 2 conference
certificates). Candidates were asked to switch one of these to an example from their practice.
2. Final Portfolio Assessment: 1. Reflections All candidates met the criteria for reflection in each area:
a. Areas of strength and need are thoughtful reflections b. Specific evidence is provided from each: relevant course work, field work, non-
university activities c. Reflections indicate growth in professional practice
2. Artifacts All candidates met the criteria of artifacts illustrating growth in area/need. Artifacts included:
- IEPs with relevant sections highlighted, behavior support plans, photographs of classroom (e.g., re-arranged room for better use for instruction and classroom management), functional analysis assessment, policy paper, PowerPoint presentation to their school
3. Standards and competencies Four (4) candidates demonstrated distinguished performance on all standards and
competencies by: - Showing specific, explicit evidence in each competency on relevant
fieldwork and non-university activities Seven (7) candidates showed proficient performance on all standards and competencies
by: - Providing adequate evidence for each standard, in fieldwork and non-
university activities
4. Non-university activities All candidates met the 60 hours requirement by providing required evidence.
Results Fall 07
1. Portfolio Development Assessment: 1. Reflection re-writes were required an average of 3 times (range, 1 to 6). Reasons:
- lack of specific evidence (all candidates) - grammar and mechanics (2 candidates) - not a reflection (2 candidates)
2.Artifacts were asked to be changed (2 candidates):
California State University Channel Islands

50
- Not thoughtful enough to show performance growth (turned in—as in Spring--2 conference certificates). Candidates were asked to switch one of these to an example from their practice.
2. Final Portfolio Assessment: 1. Reflections All candidates met the criteria for reflection in each area:
a. Areas of strength and need are thoughtful reflections b. Specific evidence is provided from each: relevant course work, field work, non-
university activities c. Reflections indicate growth in professional practice
2. Artifacts All candidates met the criteria of artifacts illustrating growth in area/need. Artifacts
included: - Transition plan, behavior support plans, functional analysis assessment, policy
paper, power point presentation to their school, para-educator training packet, samples of student monitoring, data collection and summarized assessment
3. Standards and competencies
One (1) candidate demonstrated distinguished performance on all standards and competencies by:
- Showing specific, explicit evidence in each competency on relevant fieldwork and non-university activities
Five (5) candidates showed proficient performance on all standards and competencies by: - Providing adequate evidence for each standard, in fieldwork and non-
university activities
4. Non-university activities All candidates met the 60 hour requirement.
Key Assessment #2: FOCUS GROUPS Description
A focus group is conducted for the graduating cohort. The session is facilitated by a university faculty member who has not taught in the program and therefore is a “neutral” person. The facilitator takes notes. The general questions include (with specific probes provided in the protocol): 1. How has your practice evolved or changed in the past year(s) while enrolled in Level 2? 2. What has been most valuable in this program to you and why? 3. What was challenging in this program and why? 4. What aspects of this program would you recommend keeping the same? Why? 5. What changes to this program would you recommend? Why?
California State University Channel Islands

51
Responses are analyzed qualitatively through a content analysis and using the search capabilities in Word. In Fall 2007, the students first responded to the questions individually in writing, and then the focus group was held. By doing this, the program got more specific information from each candidate as well as from the cohort.
Results 1. Spring 07: Common Themes that Emerged The results for the two cohorts were separated to get information from the first cohort (2005-2007) and the second (2006-2007).
A. Cohort 2005-2007 (2-year program, 1 course a semester) 1. How has your practice evolved or changed in the past year(s) while enrolled in Level 2?
• Assessment of academics and behavior, using a lot more to guide teaching • Behavioral supports, more in depth understanding • Research-based approach in teaching and choosing curricula • Understanding of policies—can now do research and answer questions at the
school site
2.What has been most valuable in this program to you and why? • Courses themselves • Area of need (“Amazed at how much I have grown—my area of need has become my
passion” and “Identifying area of need—now it is a strength”) • Fortunate to take courses during OSEP writing regulations, we learned about how
policy process works and how it affects us • Class discussion and learning from peers • Applying research to practice • Being part of a cohort of fabulous teachers • This program has given me the tool to be a leader on my campus • Learning to read research and explain it to others • Cutting edge program 3. What was challenging in this program and why? • Induction plan unclear (requirements and timeline) • In some courses (Advanced assessment; advanced collaboration) did not learn
anything new (taught by part time faculty) • Connect course work • Tie everything to standards 4. What aspects of this program would you recommend keeping the same? Why? • Courses • Access to faculty
California State University Channel Islands

52
• Electronic course packs • Policy paper (“difficult but appreciated”) • Being able to submit work before due and get feedback • Menu of assignments and choices made it meaningful 5. What changes to this program would you recommend? Why? • Induction plan: link to standards and collect pieces at each class • Order of classes • New high incidence disabilities (autism, Aspergers) • Collaboration and strategies to work with general educators • Reading reflections were busy work
B. Cohort 2006-2007 (first 1-year program, 2 courses a semester)
1. How has your practice evolved or changed in the past year(s) while enrolled in Level 2?
• In depth understanding of behavioral supports • Stating need gave focus to learning. Now a strength • More confident in speaking to administrators now that understand IEP, law, and
policy
2.What has been most valuable in this program to you and why? • More aware of current policies and how they affect practice • Constructive feedback of assignments • Visitations to others’ classrooms • Discussion in class-problem solving approach and learning from peers • Instruction from core faculty—more in depth and challenging in a good way • Being treated professionally • Choice of assignments to fit own needs in classroom
3.What was challenging in this program and why? • Advanced collaboration and assessment not a cohesive learning experience • University offices are not open for evening students (cashiers, enrollment, bookstore,
disabled student services)
4.What aspects of this program would you recommend keeping the same? Why? • Courses • Menu of assignments and choices made it meaningful • Have the advisor lead induction
5. What changes to this program would you recommend? Why? • Include how to write grants • More on how to work with para educators • Keep credential office, bookstore, and registration open late • More information on and recommendations to good conferences • Offer Summer courses
California State University Channel Islands

53
Results
Fall 07: Common Themes that Emerged
1. How has your practice evolved or changed in the past year(s) while enrolled in Level 2? Individual • Increased participation in professional workshops • Increased awareness of education policies • More frequent and effective assessment • Better understanding of functions of behavior and behavioral supports • More varied teaching strategies Group • Increased confident to share law and policies with parents • Using varied teaching strategies • Increased reflection of own practice 2. What has been most valuable in this program to you and why? Individual • University support, supportive university • Reflecting on practice • Understanding policies • Classroom observations • Forum to exchange ideas and concerns Group • Support (university, county office) • Courses • Collaborative problem solving 3. What was challenging in this program? Individual • Papers • Technology course • Scheduling/time management • Lack of support at school site Group • Some assignments • Time management 4. What aspects of this program would you recommend keeping the same? Individual • Collaboration among candidates and exchange of ideas • Courses • Classroom observations/visitations • Scheduling
California State University Channel Islands

54
• Cohort model Group • Cohort model • Contemporary readings
5. What changes to this program would you recommend? Individual • None • Get rid of support provider • Add a class (on standards; on IEP writing for students who are below grade level
standards) • Class times • Location (bigger room; bigger desks) • Provide a reader • If doing level 2, should not need to do BTSA Group • Tie competency and standard matrix better to each course • More on-line courses • Use a reader instead of eReserves
III. Analysis of Candidate Assessment Data 1. Strengths (identified from both induction binder and focus group data)
• Induction plan: Candidates’ requirement to identify an area of need and strength; and build a specific plan to grow in each area.
• Teacher circle: Candidates learn problem solving and peer networking. • Peer visitations: Candidates learn from each others’ teaching practice. A visitor whose
area of need is the host teacher’s area of strength, gets an opportunity to observe the area in practice.
• Course content is current, grounded in best practice and state-of-the-art research and practice.
• Courses on policy, behavioral supports, and assessment. Candidates reported most growth in those content areas.
2. Areas for Improvement (identified from both induction binder and focus group data)
• Program assessment: (a) Need direct, more robust assessment measures on the induction portfolio (b) Break induction portfolio into components and assess each with a rubric:
reflection of strength and artifacts; reflection of need and artifacts; fieldwork; non-university activities.
(c) One year follow up of graduates (d) Employer survey upon level 2 completion
California State University Channel Islands

55
• Mentoring part time faculty: Data indicate that part time faculty use more traditional teaching methods which do not challenge the candidates to use inquiry, think critically, problem solve, and synthesize material.
• Program integration: The data indicate that there is somewhat of a disconnect between course work and the induction plan.
• Support provider: The situation with the difficulty in both obtaining support providers and in getting them to meet with university advisor needs to be resolved.
IV: Use of Assessment Results to Improve Candidate and Program Performance Areas of Strengths Area Action Items Timeline Induction plan 1. Integrate induction process to all courses as
appropriate according to the standards on which course is grounded 2. Collaborate with SELPA, BTSA, and county to disseminate their upcoming workshops information (related to non-university work)
Begin Fall 08 Contact each entity Fall 08; re- contact every 3 months Advisor disseminates to all instructors
Teacher circle 1. Infuse teacher circle (problem solving) to all courses, including those taught by part time faculty
Advisor to meet with all faculty beginning of each semester
Visitations 1. Continue the peer visitations
Continue as is
Course content /strong courses
1. Continue to update eReserves each semester to include most current research, recent policy changes, court rulings 2. Work with part time faculty to include a eReserve packet of current best practices to not only rely on a text book
Advisor to meet with all faculty in the beginning of semester to - explain the process with library - emphasize the need - help locate current material
California State University Channel Islands

56
Areas of Improvement Area Action Items Timeline Program assessment 1. Develop a rubric to assess the different areas
of the induction portfolio and the extent to which they meet standards - reflection on strength - reflection on need - induction plan and artifacts - fieldwork - non-university activities 2. Develop a one-year follow up survey 3. Schedule a cohort reunion and re-conduct focus group (“post test”) 4. Develop an employer/supervisor survey of graduates’ preparedness
Complete Fall 2008; pilot December 08 Fall 2008; pilot for Fall 07 cohort in 12/08 January 09 for Fall 07 cohort; May 09 for Spring 08 cohort Fall 08; send out Nov 08 for Fall 07 cohort
Mentoring part time faculty
1. Schedule a meeting with all faculty at the beginning of each semester to explain the course structure 2. Peer observations of part time faculty 3. On-going contact as needed (see program integration #1)
August/Sept 08 by advisor 1-2 per semester done by tenure track faculty
Program integration 1. In the beginning of semester meeting, coordinator/advisor will go over the induction plan. Faculty will identify pieces from fieldwork and non-university activities they can integrate to their course. Advisor/coordinator will follow up during semester in seminar. 2. Advisor will solicit student feedback on
Aug/Sept 08 and Jan 09 First 4 weeks of semester
Support provider situation
1. Schedule a meeting with BTSA to re-visit the topic
October 08
California State University Channel Islands

57
Educational Leadership Program Credential awarded: Preliminary Administrative Services Credential
Program Contact: Dr. Tim Rummel
Phone: 805-437-8429
E-Mail: [email protected] I. Contextual Information
When California State University Channel Islands opened in August, 2002, the School of Education, working closely with the Ventura County Superintendent of Schools and the Superintendents of local school districts, identified the preparation of school administrators as a primary need. In response to this need CSU Channels Islands submitted to the California Commission of Teacher Credentialing a program proposal for the Preliminary Administrative Services Credential that was approved in Fall, 2004. The Administrative Services Credential is embedded within a Master’s degree in Educational Leadership. The Educational Leadership Program admitted its first cohort in Fall, 2004 with additional cohorts being added each school year. Students for the fifth cohort are currently making application for admission and will begin classes in Fall, 2008. Candidates complete the program in two years as part-time candidates while they are employed in local school districts. Courses are taught by CSUCI faculty and local school administrators. Because of the campus’s limited financial resources in its earliest years, the Educational Leadership Program was initially offered through the Office of Extended Education as a self-supporting program. The first three cohorts enrolled in Extended Education with Cohort III completing course work in Spring, 2008. Beginning with Cohort IV in Fall 2007, the program is offered with state support within the School of Education. Course fees are therefore consistent with those set by CSU for graduate work.
Cohort Number of students Completers Cohort I Fall 2004 13 11 Cohort II Fall 2005 21 13 Cohort III Fall 2006 17 In Progress
Cohort I—One student withdrew in the fourth semester after passing the School Leaders Licensure Assessment and qualifying for the PASC. One student is in the process of completing the Masters of Education and the PASC. Cohort II—Five students withdrew after the first semester: one for health reasons, one at the recommendation of the supervising administrator and three to seek alternative paths to the PASC. One student passed the School Leaders Licensure Exam after completing all but one course in the program.
California State University Channel Islands

58
Two students are in the process of completing the Masters of Education and the PASC.
Changes in CSU Channel Islands Preliminary Administrative Services Credential Program.
In the past three years, there have been several major changes made to the Preliminary Administrative Services Credential Program (PASC). These changes include the following:
1. Change in Program Title from Principals Leadership Program to Education Leadership Program
In the developmental stages of the program and during the first years of implementation the Preliminary Administrative Services Credential (PASC) Program was called the Principals Leadership Program. This title emphasized the focus of the program in developing highly qualified entry level site administrators for the schools of Ventura County. While this focus in the program mission remains primary, the program, beginning in academic year 2007-2008, has now been renamed the Educational Leadership Program to recognize that the credential prepares candidates for a variety of educational leadership positions. This name also is consistent with programs offered throughout the California State University System.
2. Change in Program Schedule
In the initial program proposal the PASC Program was planned to be offered over four terms. After consulting with prospective students and faculty, the program was extended to a five term program. Candidates can then carry two academics courses each term and also work toward completion of EDPL 631-632 (Professional Development and Fieldwork) throughout the program. The course load of five terms provides working professional educators with a more balanced workload.
3. Change in Course Syllabus for EDPL 625 (Building a Collaborative Inclusive Learning Community)
In the initial program design, the program standards related to Special Education were to be addressed through seminars attached to EDPL 631-632 (Professional Development and Fieldwork). As the first cohort moved through the program it was determined that these standards were not being adequately addressed. Through a partnership with the Ventura County SELPA, a series of speakers (Special Education Directors) were integrated into EDPL 625. This plan was then further modified by changing the syllabus of EDPL 625 to include Special Education as a major component of the course. This course is now taught by a team of professionals that includes Mary Samples, Director of the Ventura County SELPA and Dr. Trudy Arriaga, Superintendent of Ventura Unified School District. The Special Education Standards compose one half of the course and the course prepares candidates to meet the important competencies related to Special Education and inclusive schools for all learners.
California State University Channel Islands

59
II. Candidate Assessment/Performance and Program Effectiveness Information
The chart below displays the assessments that the Educational Leadership Program uses to evaluate candidate progress/ performance and program effectiveness. Data is identified for each assessment and then summarized in charts that follow. Additional detailed data is available upon request.
Key Assessment #1 Course Grades
Assessment tool Description Data collected Course Grades Program standards are embedded in
each of the required courses. Instructors assess student performance on course work aligned with the standards. Rubrics for major assignments are used in each course.
Course grades are examined each term. Student performance at a ‘B’ level is required for program completion.
0
1
2
3
4
# of Candidates (12)
3.5 3.6 3.7 3.9 4GPA
Cohort I
GPA
Certificate ofEligibility
0
1
2
3
4
5
6
7
# of Candidates (15)
3.5 3.6 3.7 3.8 3.9 4
GPA
Cohort II
GPA
Certificate ofEligibility
California State University Channel Islands

60
Key Assessment #2 Supervising Administrator Evaluations
Supervising Administrator Evaluation and Recommendation
At the conclusion of the program the Supervising Administrator assesses each candidate on each standard and makes a recommendation on the performance of the candidate in meeting the Standards of the PASC.
Supervising Administrator evaluations and recommendations. As needed, candidates complete additional fieldwork to meet the standards of the program.
Supervising Administrator Evaluations—Cohort II 14 Candidates
(Includes one candidate who has not completed all program requirements.)
1. Candidate is able to promote to success of all students: by facilitation the development, implementation, and stewardship of a shared vision of learning that is supported by the school community. 1 Low 2 3 3.5 4 5 Exceptional
1 9 4 2. Candidate is able to promote the success of all students: by advocating, nurturing and
sustaining a school culture and instructional program conducive to student learning and staff professional growth. 1 Low 2 3 3.5 4 5 Exceptional
1 5 8 3. Candidate is able to promote the success of all students: by management of the organization,
operations and resources for a safe, efficient, and effective learning environment. 1 Low 2 3 3.5 4 5 Exceptional
3 3 8 4. Candidate is able to promote the success of all learners: by collaborating with families and
community members, responding to diverse community interests and needs, and mobilizing community resources. 1 Low 2 3 3.5 4 5 Exceptional
2 5 7 5. Candidate is able to promote the success of all learners: by modeling a personal code of
ethics and developing personal leadership capacity. 1 Low 2 3 3.5 4 5 Exceptional
3 3 8 6. Candidate is able to promote the success of all learners: by understanding, responding to, and
influencing the larger political, social, economic, legal, and cultural context. 1 Low 2 3 3.5 4 5 Exceptional
2 3 6 3
California State University Channel Islands

61
7. Candidate’s overall performance (grade) in field work experiences:
F Low D C B A Exceptional 4 10
Key Assessment #3 Reflective Essays
Portfolio: Reflective Essays
Reflective essays on each of the six standards are completed by each candidate. Standards are written to a prescribed outline.
Essays are evaluated based on defined rubric and each essay must meet a minimum satisfactory level. Candidates revise essays in a mastery learning format until they have achieved a satisfactory or exemplary level.
Reflective Essays—Cohort I 12 Candidates; Cohort II 13 Candidates Combined Satisfactory Satisfactory/Exceptional Exceptional
Standard 1 Shared Vision
15%
39%
46%
Standard 2 Instructive Leadership
8%
7%
85%
Standard 3 Organizational Management
23%
15%
62%
Standard 4 Collaboration with
Families and Community
15%
23%
62%
Standard 5
Ethical Behavior Personal Leadership Capacity
100%
Standard 6 Influencing Broader Context of Education
46%
39%
15%
Professional
Development Plan
15%
23%
62%
California State University Channel Islands

62
Key Assessment #4 Fieldwork
Portfolio: Matrix and Artifact Presentation
Each candidate prepares a portfolio organized around each standard. Candidates complete a matrix documenting learning for each sub-standard from course work, fieldwork and other learning experiences. Supporting fieldwork artifacts are aligned with the matrix.
The completed portfolio is evaluated using a prescribed rubric. Candidates revise the portfolio as needed to meet the standards of the rubric.
Fieldwork—Cohort I 12 Candidates; Cohort II 13 Candidates Combined
Satisfactory Satisfactory/Exceptional Exceptional Standard 1
Shared Vision
46%
16%
38% Standard 2
Instructive Leadership
8%
23%
69% Standard 3
Organizational Management
38%
62%
Standard 4 Collaboration with
Families and Community
23%
15%
62%
Standard 5 Ethical Behavior Personal
Leadership Capacity
31%
69%
Standard 6 Influencing Broader
Context of Education
77%
8%
15%
Professional Development Plan
15%
23%
62%
Key Assessment #5 Instructor/Course Evaluations
Student evaluation of courses/instructors
At the conclusion of each course candidates complete an anonymous evaluation of each course/instructor
Course/instructor evaluation forms
The results of Student Evaluations of Courses/instructors are provided to each instructor and also reviewed by the Program Coordinator. Concerns raised in the evaluations are discussed with instructors and improvement plans are developed. Based on evaluations, some instructors have not been invited to continue teaching the program.
California State University Channel Islands

63
III. Analysis of Candidate Assessment Data
As measured by program GPA, candidates are performing will in courses. GPA’s in Cohort II are stronger than in Cohort I. In both Cohorts I and II the candidates with the highest GPA are applying for the Certificate of Eligibility/PASC and applying for administrative positions. The ratings of individual Supervising Administrators show strong performance in school/site fieldwork. The reliability of these rankings remains a challenge given the one-to-one placement of candidates and the unique fieldwork responsibilities of each candidate. Candidates have the highest ratings in Standards 2, 3, and 5. Competency in these standards is most important at the entry level. Instructional Leadership, Organizational Management and Personal Ethics/Personal Leadership Capacity reflect an appropriate emphasis for entry level PASC candidates. Standards 2 and 5 are strong as evidenced in the reflective essays and fieldwork documentation. Standard 4 (Collaboration with Families and Communities) is strong as evidenced by the evaluation of Supervising Administrators, reflective essays, and fieldwork documentation. Standard 6 (Influencing the Broader Context of Education) is the lowest rated standard, however, this is explained by the candidates being in the earliest stages of administrative experience. Most teachers have little opportunity to influence the broader context of education. The program has not been in existence long enough to have a sufficient number candidates who are in administrative positions to provide feedback on preparation for practicing administrators. This data will become available over time using surveys and focus groups.
IV. Use of Assessment Results to Improve Candidate and Program Performance
The first recommendation is to strengthen the end of program assessment of candidates by closer coordination between the university fieldwork supervisor and the supervising administrators. To this end, additional staffing for fieldwork supervision has been added for Cohort IV. The addition of fieldwork supervisors will allow for further development rubrics/standards for all elements of the Portfolio. The supervisors will be trained on the rubrics for consistency across candidate ratings. This will also allow for increased communication with supervising administrators and give candidates multiple points of view about their performance on administrative tasks. As more candidates are employed in administrative positions the program evaluation will be strengthened by conducting surveys and focus groups of practicing administrators and their supervisors who have completed the program.
California State University Channel Islands

64
An informal review of the members Cohorts I, II and III suggests that the portfolio process can continue to be strengthened by providing on-going support for candidates in the second year of the program. Candidates would then be developing the portfolio over time and not waiting until the end of the program. Cohort IV candidates seeking a Masters of Education Degree and the PASC will have more options for a culminating project. Information gathered from these opportunities in research, project development, or a comprehensive exam will add to the evaluation data from the program. The program faculty completed a curriculum mapping project identifying the actual standards being taught in each course and the specific major assignments that support these standards. This information will be reviewed for the entire program providing information on possible gaps as well as overlap in the program. Gaps and overlaps will be discussed with the program faculty during the 2008-09 academic year and revisions made as appropriate.
California State University Channel Islands

65
Section B Institutional Summary and Plan of Action
Summary The teaching and administrative credential programs at California State University Channel Islands are well regarded in Ventura County and southern Santa Barbara counties. The educational community reports that our graduates are well prepared. We work together with the local school district personnel and the School of Education Advisory Committee to ensure that our candidates meet their expressed needs so that our children are receiving the most up-to-date education possible. Each program has specific strengths and areas for improvement. The faculty at CSUCI continuously strives to improve the delivery of its teacher and administrative preparation programs. The data provided in this report highlight a number of trends across programs. Strengths Generally the ratings of supervisors of our teacher credential candidates during the program and in the survey at the conclusion of their first year of teaching indicate that the candidates are well prepared for the responsibilities of teaching. All programs demonstrate particular strength for teachers working with English learners and students with special needs, teaching literacy, and in planning and professionalism. Administration candidates are particularly strong in instructive leadership, organizational management, and ethical behavior. Following a central theme of our credential programs, all candidates demonstrate very good reflective skills. We have our plans in place for using candidate assessment information for program improvement and have implemented this feedback loop. Areas for Improvement Building upon the work that has been begun, all programs are working to improve the way in which they capture formative and summative teacher performance data and use those data to improve candidate performance. The Multiple Subject and Single Subject programs must prepare sufficient number of evaluators for the successful implementation of PACT. The programs need to identify specific policies to determine how candidates will remediate their work if they do not meet the PACT standards. Through PACT assessments and other summative activities, each program has identified the need to better prepare the candidates on use of academic language. The integration of technology for teaching, learning, and administration must be expanded and more systematically integrated into the core curriculum for each credential. All teaching credential programs are ready to expand and improve the instruction of candidates’ assessment of students’ learning.
California State University Channel Islands

California State University Channel Islands
66
Action Plan 1. PACT implementation Faculty and staff will implement and expand
PACT process from pilot program to full implementation. Faculty will prepare PACT evaluators in all areas. Faculty will develop and implement clear policies and practices for candidates not passing TPA.
September 2008
2. Academic language Faculty will make the academic language of each content area more explicit to candidates. Candidates will use more academic language throughout the methods courses and in student teaching.
June 2009
3. Technology Faculty will identify specific technology for teaching, learning and administration that will be incorporated into each program. Candidates will use a variety of different technologies in their teaching and administrative tasks.
August 2008
4. Student assessment Faculty will create additional student assessment tasks for candidates to complete. Candidates will improve on their ability to assess student work and use the assessments to understand student learning to plan instruction, and to differentiate instruction and assignments appropriately.
June 2009