Commission file number: 1-14554 BANCO SANTANDER...
169
UNITED STATES SECURITIES AND EXCHANGE COMMISSION Washington, D.C. 20549 FORM 20-F (Mark One) REGISTRATION STATEMENT PURSUANT TO SECTION 12(b) OR (g) OF THE SECURITIES EXCHANGE ACT OF 1934 OR ANNUAL REPORT PURSUANT TO SECTION 13 OR 15(d) OF THE SECURITIES EXCHANGE ACT OF 1934 for the fiscal year ended December 31, 2007 OR TRANSITION REPORT PURSUANT TO SECTION 13 OR 15(d) OF THE SECURITIES EXCHANGE ACT OF 1934 Commission file number: 1-14554 BANCO SANTANDER-CHILE (d/b/a Santander, Banco Santander, Banco Santander Santiago, and Santander Santiago) (Exact name of Registrant as specified in its charter) SANTANDER-CHILE BANK (d/b/a Santander, Banco Santander, Santander Santiago Bank, and Santander Santiago) (Translation of Registrant’s name into English) Chile (Jurisdiction of incorporation) Bandera 140 Santiago, Chile Telephone: 011-562 320-2000 (Address of principal executive offices) Securities registered or to be registered pursuant to Section 12(b) of the Act: Title of each class Name of each exchange on which registered American Depositary Shares, each representing the right to receive 1,039 Shares of Common Stock without par value New York Stock Exchange Shares of Common Stock, without par value* New York Stock Exchange * Santander-Chile’s shares of common stock are not listed for trading, but only in connection with the registration of the American Depositary Shares pursuant to the requirements of the New York Stock Exchange. Securities registered or to be registered pursuant to Section 12(g) of the Act: None (Title of Class) Securities for which there is a reporting obligation pursuant to Section 15(d) of the Act: 7.375% Subordinated Notes due 2012 Indicate the number of outstanding shares of each class of common stock of Banco Santander-Chile at December 31, 2007, was: 188,446,126,794 Shares of Common Stock, without par value Indicate by check mark if the registrant is a well-known seasoned issuer, as defined in Rule 405 of the Securities Act. Yes No If this report is an annual or transition report, indicate by check mark if the registrant is not required to file reports pursuant to Section 13 or 15(d) of the Securities Exchange Act of 1934. Yes No Note – Checking the box above will not relieve any registrant required to file reports pursuant to Section 13 or 15(d) of the Securities Exchange Act of 1934 from their obligations under those Sections. Indicate by check mark whether the registrant (1) has filed all reports required to be filed by Section 13 or 15(d) of the Securities Exchange Act of 1934 during the preceding 12 months (or for such shorter period that the registrant was required to file such reports), and (2) has been subject to such filing requirements for the past 90 days.
Transcript of Commission file number: 1-14554 BANCO SANTANDER...
UNITED STATES SECURITIES AND EXCHANGE COMMISSION
Washington, D.C. 20549
FORM 20-F (Mark One)
REGISTRATION STATEMENT PURSUANT TO SECTION 12(b) OR (g) OF THE SECURITIES EXCHANGE ACT OF 1934
OR ANNUAL REPORT PURSUANT TO SECTION 13 OR 15(d) OF THE SECURITIES EXCHANGE
ACT OF 1934 for the fiscal year ended December 31, 2007
OR TRANSITION REPORT PURSUANT TO SECTION 13 OR 15(d) OF THE SECURITIES EXCHANGE
ACT OF 1934
Commission file number: 1-14554
BANCO SANTANDER-CHILE (d/b/a Santander, Banco Santander, Banco Santander Santiago, and Santander Santiago)
(Exact name of Registrant as specified in its charter)
SANTANDER-CHILE BANK (d/b/a Santander, Banco Santander, Santander Santiago Bank, and Santander Santiago)
(Translation of Registrant’s name into English)
Chile (Jurisdiction of incorporation)
Bandera 140 Santiago, Chile
Telephone: 011-562 320-2000 (Address of principal executive offices)
Securities registered or to be registered pursuant to Section 12(b) of the Act:
Title of each class Name of each exchange on which registered
American Depositary Shares, each representing the right to receive 1,039 Shares of Common Stock without par value
New York Stock Exchange
Shares of Common Stock, without par value* New York Stock Exchange
* Santander-Chile’s shares of common stock are not listed for trading, but only in connection with the registration of the American Depositary Shares pursuant to the requirements of the New York Stock Exchange.
Securities registered or to be registered pursuant to Section 12(g) of the Act: None
(Title of Class)
Securities for which there is a reporting obligation pursuant to Section 15(d) of the Act: 7.375% Subordinated Notes due 2012
Indicate the number of outstanding shares of each class of common stock of Banco Santander-Chile at December 31, 2007, was: 188,446,126,794 Shares of Common Stock, without par value
Indicate by check mark if the registrant is a well-known seasoned issuer, as defined in Rule 405 of the Securities Act. Yes No
If this report is an annual or transition report, indicate by check mark if the registrant is not required to file reports pursuant to Section 13 or 15(d) of the Securities Exchange Act of 1934.
Yes No
Note – Checking the box above will not relieve any registrant required to file reports pursuant to Section 13 or 15(d) of the Securities Exchange Act of 1934 from their obligations under those Sections. Indicate by check mark whether the registrant (1) has filed all reports required to be filed by Section 13 or 15(d) of the Securities Exchange Act of 1934 during the preceding 12 months (or for such shorter period that the registrant was required to file such reports), and (2) has been subject to such filing requirements for the past 90 days.

Yes No
Indicate by check mark whether the registrant is a large accelerated filer, an accelerated filer, or a non-accelerated filer. See definition of “accelerated filer and large accelerated filer” in Rule 12b-2 of the Exchange Act. (Check one):
Large accelerated filer Accelerated filer Non-Accelerated filer
Indicate by check mark which basis of accounting the registrant has used to prepare the financial statements included in this filing: U.S. GAAP
International Financial Reporting Standards as issued by the International Accounting Standards Board Other
If “Other” has been checked in response to the previous question, indicate by check mark which financial statement item the registrant has elected to
follow. Item 17 Item 18
If this is an annual report, indicate by check mark whether the registrant is a shell company (as defined in Rule 12b-2 of the Exchange Act).
Yes No

i
TABLE OF CONTENTS
Page
CAUTIONARY STATEMENT CONCERNING FORWARD-LOOKING STATEMENTS ......................................1 CERTAIN TERMS AND CONVENTIONS.................................................................................................................2 PRESENTATION OF FINANCIAL INFORMATION ................................................................................................4 PART I ..........................................................................................................................................................................5 ITEM 1. IDENTITY OF DIRECTORS, SENIOR MANAGEMENT AND ADVISORS ............................................5 ITEM 2. OFFER STATISTICS AND EXPECTED TIMETABLE...............................................................................5 ITEM 3. KEY INFORMATION ...................................................................................................................................5 ITEM 4. INFORMATION ON THE COMPANY ......................................................................................................21 ITEM 4A. UNRESOLVED STAFF COMMENTS.....................................................................................................37 ITEM 5. OPERATING AND FINANCIAL REVIEW AND PROSPECTS ...............................................................38 ITEM 6. DIRECTORS, SENIOR MANAGEMENT AND EMPLOYEES ................................................................99 ITEM 7. MAJOR SHAREHOLDERS AND RELATED PARTY TRANSACTIONS.............................................110 ITEM 8. FINANCIAL INFORMATION ..................................................................................................................113 ITEM 9. THE OFFER AND LISTING .....................................................................................................................114 ITEM 10. ADDITIONAL INFORMATION.............................................................................................................115 ITEM 11. QUANTITATIVE AND QUALITATIVE DISCLOSURES ABOUT MARKET RISK .........................136 ITEM 12. DESCRIPTION OF SECURITIES OTHER THAN EQUITY SECURITIES..........................................158 PART II .....................................................................................................................................................................159 ITEM 13. DEFAULTS, DIVIDEND ARREARAGES AND DELINQUENCIES ...................................................159 ITEM 14. MATERIAL MODIFICATIONS TO THE RIGHTS OF SECURITY HOLDERS AND USE OF
PROCEEDS........................................................................................................................................................159 ITEM 15. CONTROLS AND PROCEDURES.........................................................................................................159 ITEM 16. [RESERVED] ...........................................................................................................................................161 ITEM 16A. AUDIT COMMITTEE FINANCIAL EXPERT ....................................................................................161 ITEM 16B. CODE OF ETHICS................................................................................................................................161 ITEM 16C. PRINCIPAL ACCOUNTANT FEES AND SERVICES .......................................................................162 ITEM 16D. EXEMPTIONS FROM THE LISTING STANDARDS FOR AUDIT COMMITTEES .......................162 ITEM 16E. PURCHASES OF EQUITY SECURITIES BY THE ISSUER AND AFFILIATED PURCHASERS..162 PART III....................................................................................................................................................................162 ITEM 17. FINANCIAL STATEMENTS ..................................................................................................................162 ITEM 18. FINANCIAL STATEMENTS ..................................................................................................................162 ITEM 19. EXHIBITS ................................................................................................................................................162
1
CAUTIONARY STATEMENT CONCERNING FORWARD-LOOKING STATEMENTS
We have made statements in this Annual Report on Form 20-F that constitute forward looking statements within the meaning of the Private Securities Litigation Reform Act of 1995. These statements appear throughout this report and include statements regarding our intent, belief or current expectations regarding:
• asset growth and alternative sources of funding
• growth of our fee based business
• financing plans
• impact of competition
• impact of regulation
• exposure to market risks:
• interest rate risk
• foreign exchange risk
• equity price risk
• projected capital expenditures
• liquidity
• trends affecting:
• our financial condition
• our results of operation
The sections of this Annual Report which contain forward-looking statements include, without limitation, “Item 3: Key Information—Risk Factors,” “Item 4: Information on the Company—Strategy,” “Item 5: Operating and Financial Review and Prospects,” “Item 8: Financial Information—Legal Proceedings,” and “Item 11: Quantitative and Qualitative Disclosures About Market Risk.” Our forward-looking statements also may be identified by words such as “believes,” “expects,” “anticipates,” “projects,” “intends,” “should,” “could,” “may,” “seeks,” “aim,” “combined,” “estimates,” “probability,” “risk,” “VaR,” “target,” “goal,” “objective,” “future” or similar expressions.
You should understand that the following important factors, in addition to those discussed elsewhere in this Annual Report and in the documents which are incorporated by reference, could affect our future results and could cause those results or other outcomes to differ materially from those expressed in our forward looking statements:
• changes in capital markets in general that may affect policies or attitudes towards lending to Chile or Chilean companies
• changes in economic conditions
• the monetary and interest rate policies of the Central Bank
• inflation
• deflation
• unemployment
2
• unanticipated turbulence in interest rates
• movements in foreign exchange rates
• movements in equity prices or other rates or prices
• changes in Chilean and foreign laws and regulations
• changes in taxes
• competition, changes in competition and pricing environments
• our inability to hedge certain risks economically
• the adequacy of loss allowances
• technological changes
• changes in consumer spending and saving habits
• increased costs
• unanticipated increases in financing and other costs or the inability to obtain additional debt or equity financing on attractive terms
• changes in, or failure to comply with, banking regulations
• our ability to successfully market and sell additional services to our existing customers
• disruptions in client service
• natural disasters
• implementation of new technologies
• an inaccurate or ineffective client segmentation model
You should not place undue reliance on such statements, which speak only as of the date that they were made. The forward looking statements contained in this document speak only as of the date of this Annual Report, and we do not undertake to update any forward-looking statement to reflect events or circumstances after the date hereof or to reflect the occurrence of unanticipated events.
CERTAIN TERMS AND CONVENTIONS
As used in this Annual Report, “Santander-Chile”, “the Bank”, “we,” “our” and “us” mean Banco Santander-Chile and its consolidated subsidiaries, the bank resulting from the merger of Santiago and Old Santander-Chile.
When we refer to “Santiago” in this Annual Report, we refer to Banco Santiago and its consolidated subsidiaries prior to its merger with Old Santander-Chile. When we refer to “Old Santander-Chile” in this Annual Report, we refer to the former Banco Santander-Chile and its consolidated subsidiaries, which ceased to exist upon its merger into Santiago, effected on August 1, 2002.
When we refer to “Banco Santander Spain” or “Santander Spain”, we refer to our parent company Banco Santander, S.A.
As used in this Annual Report, the term “billion” means one thousand million (1,000,000,000).
In this Annual Report, references to “$”, “US$”, “U.S. dollars” and “dollars” are to United States dollars, references to “Chilean pesos,” “pesos” or “Ch$” are to Chilean pesos and references to “UF” are to Unidades de

3
Fomento. The UF is an inflation indexed Chilean monetary unit with a value in Chilean pesos that changes daily to reflect changes in the official Consumer Price Index (“CPI”) of the Instituto Nacional de Estadísticas (the Chilean National Institute of Statistics) for the previous month. See “Item 5: Operating and Financial Review and Prospects” and Note 1(d) to the Audited Consolidated Financial Statements.
In this Annual Report, references to the Audit Committee are to the Bank’s Comité de Directores y Auditoría.
In this Annual Report, references to “BIS” are to the Bank for International Settlement, and references to “BIS ratio” are to the capital adequacy ratio as calculated in accordance with the Basel Capital Accord.

4
PRESENTATION OF FINANCIAL INFORMATION
Currency and Accounting Principles
Santander-Chile is a Chilean bank and maintains its financial books and records in Chilean pesos and prepares its Audited Consolidated Financial Statements in conformity with generally accepted accounting principles in Chile and the rules of the Superintendencia de Bancos e Instituciones Financieras de Chile (the Superintendency of Banks and Financial Institutions, which is referred to herein as the “Superintendency of Banks”), which together differ in certain significant respects from generally accepted accounting principles in the United States (“U.S. GAAP”). References to “Chilean GAAP” in this Annual Report are to accounting principles generally accepted in Chile, as supplemented by the applicable rules of the Superintendency of Banks. See Note 28 to the Audited Consolidated Financial Statements of Santander-Chile as of December 31, 2006 and 2007, and for the years ended December 31, 2005, 2006 and 2007, contained elsewhere in this Annual Report (together with the notes thereto, the “Audited Consolidated Financial Statements”) for a description of the principal differences between Chilean GAAP and U.S. GAAP, as they relate to Santander-Chile, and a reconciliation to U.S. GAAP of net income and shareholders’ equity.
Pursuant to Chilean GAAP, amounts expressed in the Audited Consolidated Financial Statements and all other amounts included elsewhere throughout this Annual Report for all periods expressed in Chilean pesos are expressed in constant Chilean pesos as of December 31, 2007. See Note 1(c) to the Audited Consolidated Financial Statements.
Loans
Unless otherwise specified, all references herein (except in the Audited Consolidated Financial Statements) to loans are to loans and financial leases before deduction for loan loss allowance, and, except as otherwise specified, all market share data presented herein are based on information published periodically by the Superintendency of Banks. Non performing loans include loans for which either principal or interest is overdue, and which do not accrue interest. Restructured loans for which no payments are overdue are not ordinarily classified as non performing loans. Past due loans include, with respect to any loan, only the portion of principal and interest that is overdue for 90 or more days, and do not include the installments of such loan that are not overdue or that are overdue for less than 90 days, unless legal proceedings have been commenced for the entire outstanding balance according to the terms of the loan, in which case the entire loan is considered past due within 90 days after initiation of such proceedings. This practice differs from that normally followed in the United States, where the amount classified as past due would include the entire amount of principal and interest on any and all loans which have any portion overdue. See “Item 5: F. Selected Statistical Information—Classification of Loan Portfolio Based on the Borrower’s Payment Performance.”
According to the regulations established by the Superintendency of Banks, Santander-Chile is required to charge-off commercial loan installments no later than 24 months after being classified as past due, if unsecured, and if secured, no later than 36 months after being classified as past due. When an installment of a past due corporate loan (whether secured or unsecured) is charged-off, we must charge-off all installments which are overdue, notwithstanding our right to charge-off the entire amount of the loan. Once any amount of a loan is charged off, each subsequent installment must be charged off as it becomes overdue, notwithstanding our right to charge-off the entire amount of the loan. In the case of past due consumer loans, a similar practice applies, except that after the first installment becomes three months past due, Santander-Chile must charge-off the entire remaining part of the loan. We may charge-off any loan (whether commercial or consumer) before the first installment becomes overdue, but only in accordance with special procedures established by the Superintendency of Banks. Loans are charged off against the loan loss reserve to the extent of any required allowances for such loans; the remainder of such loans is charged off against income. See “Item 5: F. Selected Statistical Information—Analysis of Loan Loss Allowance.”
Outstanding loans and the related percentages of Santander-Chile’s loan portfolio consisting of corporate and consumer loans in the section entitled “Item 4: B. Business Overview” are categorized based on the nature of the borrower. Outstanding loans and related percentages of the loan portfolio of Santander-Chile consisting of corporate and consumer loans in the section entitled “Item 5: F. Selected Statistical Information” are categorized in accordance with the reporting requirements of the Superintendency of Banks, which are based on the type and term of loans.
5
Effect of Rounding
Certain figures included in this Annual Report and in the Audited Consolidated Financial Statements have been rounded for ease of presentation. Percentage figures included in this Annual Report have not in all cases been calculated on the basis of such rounded figures but on the basis of such amounts prior to rounding. For this reason, certain percentage amounts in this Annual Report may vary from those obtained by performing the same calculations using the figures in the Audited Consolidated Financial Statements. Certain other amounts that appear in this Annual Report may not sum due to rounding.
Economic and Market Data
In this Annual Report, unless otherwise indicated, all macro economic data related to the Chilean economy is based on information published by the Banco Central de Chile (the “Central Bank”), and all market share and other data related to the Chilean financial system is based on information published by the Superintendency of Banks and our analysis of such information. Information regarding the consolidated risk index of the Chilean financial system as a whole is not available.
Exchange Rates
This Annual Report contains translations of certain Chilean peso amounts into U.S. dollars at specified rates solely for the convenience of the reader. These translations should not be construed as representations that the Chilean peso amounts actually represent such U.S. dollar amounts, were converted from U.S. dollars at the rate indicated in preparing the audited consolidated financial statements, could be converted into U.S. dollars at the rate indicated, were converted or will be converted at all.
Unless otherwise indicated, all the U.S. dollar amounts at any year end or for any full year have been translated from Chilean pesos based on the interbank market rate published by Reuters at 1:30pm on the last business day of the year. The market rate informed by Reuters on December 31, 2007, was Ch$497.78 per US$1.00. Our subsidiaries use the first observed exchange rate published by the Central Bank of Chile for 2008 on Jan. 2, 2008. The observed exchange rate reported by the Central Bank on December 31, 2007, was Ch$495.82 per US$1.00 and Ch$496.89 on Jan. 2, 2008. The Federal Reserve Bank of New York does not report a noon buying rate for the Chilean peso. For more information on the observed exchange rate. See “Item 3: A. Selected Financial Data—Exchange Rates.”
PART I
ITEM 1. IDENTITY OF DIRECTORS, SENIOR MANAGEMENT AND ADVISORS
Not Applicable.
ITEM 2. OFFER STATISTICS AND EXPECTED TIMETABLE
Not Applicable.
ITEM 3. KEY INFORMATION
A. Selected Financial Data
The following table presents historical financial information about us as of the dates and for each of the periods indicated. The following table should be read in conjunction with, and is qualified in its entirety by reference to, our Audited Consolidated Financial Statements appearing elsewhere in this Annual Report. Our Audited Consolidated Financial Statements are prepared in accordance with Chilean GAAP, which differs in certain significant respects from U.S. GAAP. Note 28 to our Audited Consolidated Financial Statements provides a description of the material differences between Chilean GAAP and U.S. GAAP and a reconciliation to U.S. GAAP of net income for the years ended December 31, 2005, 2006 and 2007, and shareholders’ equity at December 31, 2006 and 2007.

6
At and for the years ended December 31,
2003 2004 2005 2006 2007 2007
(in millions of constant Ch$ of December 31, 2007)(1) (in thousands of
US$)(1)(2)
CONSOLIDATED INCOME STATEMENT DATA Chilean GAAP: Net interest revenue (3) ...................................................... 352,656 539,896 599,801 657,806 825,616 1,658,596 Provisions for loan losses................................................... (78,549) (91,809) (69,706) (132,175) (182,411) (366,449) Total fees and income from services, net........................... 130,303 137,527 151,813 174,643 192,925 387,571 Other operating income, net (3) ......................................... 185,832 15,838 (14,606) 20,030 (79,726) (160,163) Other income and expenses, net......................................... 2,338 (4,614) (23,553) (3,846) 6,423 12,904 Operating expenses ............................................................ (291,574) (305,004) (306,170) (332,293) (342,684) (688,425) Loss from price-level restatement...................................... (8,973) (13,623) (19,902) (14,807) (56,325) (113,152) Income before income taxes .............................................. 292,033 278,211 317,677 369,358 363,818 730,881 Income (taxes) benefits ...................................................... (50,889) (52,202) (54,671) (62,529) (55,171) (110,834) Net income ......................................................................... 241,144 226,009 263,006 306,829 308,647 620,047 Net income per share (7) .................................................... 1.28 1.20 1.40 1.63 1.64 0.00329 Net income per ADS (4)(7)................................................ 1,329.55 1,246.10 1,450.09 1,691.71 1,701.73 3.42 Dividends per share (5) ...................................................... 0.98 1.28 1.20 0.90 1.06 0.00106 Dividends per ADS (5)....................................................... 1,015.89 1,329.55 1,246.10 942.55 1,099.61 2.21 Weighted-average shares outstanding (in millions) .......... 188,446.1 188,446.1 188,446.1 188,446.1 188,446.1 — U.S. GAAP: Net interest income (6)....................................................... 328,930 510,003 606,874 678,572 807,291 1,621,783 Provision for loan losses .................................................... (99,945) (74,052) (70,835) (132,175) (191,189) (384,083) Net income ......................................................................... 208,220 226,160 248,011 253,468 227,604 457,235 Net income per Share (7) ................................................... 1.10 1.20 1.32 1.35 1.21 0.00243 Net income per ADS (4)(7)................................................ 1,148.02 1,246.93 1,367.41 1,397.50 1,254.90 2.52 Weighted-avg. shares outstanding (in millions) ............... 188,446.10 188,446.10 188,446.10 188,446.10 188,446.1 — Weighted-avg. ADS outstanding (in millions) ................. 181.373 181.373 181.373 181.373 181.373 — CONSOLIDATED BALANCE SHEET DATA Chilean GAAP: Cash and due from banks ................................................... 1,146,529 1,078,060 1,344,000 1,173,682 1,291,634 2,594,789 Investments (8) ................................................................... 2,229,537 2,261,837 1,369,429 1,090,920 1,819,266 3,654,759 Loans, net of allowances .................................................... 8,680,393 9,602,618 10,967,834 12,479,044 13,236,214 26,590,491 Loan loss allowances.......................................................... (195,998) (197,008) (162,234) (187,014) (232,766) (467,608) Derivatives (9).................................................................... — — 449,953 400,416 780,775 1,568,514 Other assets (3)................................................................... 333,402 475,492 659,445 803,730 1,094,841 2,199,447 Total assets (6) .................................................................. 12,723,280 13,722,924 14,790,662 15,947,792 18,222,730 36,608,000 Deposits .............................................................................. 6,439,090 7,670,933 8,860,279 10,091,122 10,821,355 21,739,232 Other interest-bearing liabilities......................................... 3,950,509 3,597,911 3,118,682 2,817,251 3,713,460 7,460,043 Derivatives (9).................................................................... — — 420,975 382,403 778,217 1,563,375 Shareholders' equity ........................................................... 1,185,353 1,172,996 1,186,962 1,337,992 1,438,042 2,888,911 U.S. GAAP: Total assets ......................................................................... 12,310,365 13,447,843 14,737,134 15,776,131 17,883,856 35,727,229 Long-term borrowings ....................................................... 2,793,310 2,052,132 1,566,415 1,703,576 2,597,095 5,217,355 Shareholders' equity ........................................................... 2,107,428 2,097,439 2,082,730 2,169,921 2,196,797 4,413,191 Goodwill ............................................................................. 866,526 866,526 866,526 866,526 866,526 1,740,782

7
At and for the year ended
December 31,
2003 2004 2005 2006 2007
CONSOLIDATED RATIOS Chilean GAAP:
Profitability and performance: Net interest margin (10) ............................................................................... 3.0% 4.5% 4.7% 4.7% 5.8% Return on average total assets (11) .............................................................. 1.8% 1.7% 1.8% 1.9% 1.9% Return on average shareholders’ equity (12) ............................................... 22.1% 20.2% 24.1% 24.8% 23.4%
Capital: Average shareholders’ equity as a percentage of average total assets ........ 8.1% 8.2% 7.4% 7.8% 8.0% Total liabilities as a multiple of shareholders’ equity.................................. 9.7 11.7 12.1 11.9 12.7
Credit Quality: Substandard loans as a percentage of total loans (13) ................................. 3.6% 3.7% 2.6% 2.9% 3.3% Allowance for loan losses as percentage of total loans ............................... 2.2% 2.0% 1.5% 1.5% 1.7% Past due loans as a percentage of total loans (14)........................................ 2.2% 1.5% 1.1% 0.8% 0.9%
Operating Ratios: Operating expenses/operating revenue (15)................................................. 43.6% 44.0% 41.5% 39.0% 36.5% Operating expenses/average total assets ..................................................... 2.2% 2.2% 2.1% 2.1% 1.9% Ratio of earnings to fixed charges (16):
Including interest on deposits ........................................................... 1.81 1.77 1.65 1.61 1.43 Excluding interest on deposits .......................................................... 2.34 2.26 2.46 2.56 2.22
U.S. GAAP(17): Profitability and performance:
Net interest margin (18) ................................................................................ 2.8% 4.3% 4.8% 4.8% 5.7% Return on average total assets (19) ............................................................... 1.6% 1.8% 1.7% 1.6% 1.4% Return on average shareholders’ equity (20) ................................................ 9.9% 10.8% 11.9% 11.7% 10.4% Ratio of earnings to fixed charges (16):
Including interest on deposits ........................................................... 1.83 1.87 1.71 1.60 1.38 Excluding interest on deposits .......................................................... 2.35 2.43 2.51 2.52 1.99
OTHER DATA
Inflation Rate(21) ......................................................................................... 1.1% 2.4% 3.7% 2.6% 7.8% Revaluation (devaluation) rate (Ch$/US$) at period end (21)..................... (15.9%) (6.6%) (8.1%) 3.9% (7.2%) Number of employees at period end ............................................................ 7,535 7,380 7,482 8,184 9,174 Number of branches and offices at period end (22)..................................... 345 315 364 413 467
(1) Except per share data, percentages and ratios, share numbers, employee numbers and branch numbers.
(2) Amounts stated in U.S. dollars at and for the year ended December 31, 2007, have been translated from Chilean pesos at the interbank market exchange rate of Ch$497.78 = US$1.00 as of December 31, 2007. See “Item 3: A. Selected Financial Data—Exchange Rates” for more information on the observed exchange rate.
(3) In accordance with Circular No. 3345 issued by the Superintendency of Banks, which became effective on June 30, 2006, the accounting standards for valuing financial instruments acquired for trading or investment purposes, including derivative instruments on the balance sheets, were amended. The new accounting standards require that these instruments be carried at their market or fair value, and the historical differences in valuation of such instruments recognized with respect to any dates prior to 2006 be adjusted directly against the Bank’s equity. Banks were required to adopt the new accounting standards set forth in Circular No. 3345 in preparing their financial statements at and for the six-months ended June 30, 2006, and going forward. In order to implement these new accounting standards, we have created a new line item “derivatives” under both “assets” and “liabilities” in our consolidated balance sheet, and reclassified certain other items within other assets, other liabilities, financial instruments, interest income, interest expenses and other operating income, net, in our consolidated balance sheet and income statement at and for the year ended December 31, 2006. For comparison purposes, we have also retrospectively reclassified these items at December 31, 2005, but did not retrospectively apply the new accounting standards to these items. We did not reclassify any of these items at any date or for any period prior to 2005. See “Item 5: A. Accounting Standards for Financial Investments and Derivatives.”
(4) 1 ADS = 1,039 shares of common stock.
(5) The dividends per share of common stock and per ADS are determined based on the previous year’s net income. The dividend per ADS is calculated on the basis of 1,039 shares per ADS.
(6) Net interest income and total assets on a U.S. GAAP basis have been determined by applying the relevant U.S. GAAP adjustments to net interest income and total assets presented in accordance with Article 9 of Regulation S-X. See Note 28 to our Consolidated Financial Statements at and for the years ended December 31, 2003 and 2004, and Note 28 of our

8
Consolidated Financial Statements for the year ended December 31, 2005, 2006 and 2007, included in our Annual Report on Form 20-F.
(7) Net income per share and per ADS in accordance with U.S. GAAP has been calculated on the basis of the weighted-average number of shares or ADSs, as applicable, outstanding during the period.
(8) Includes principally Chilean government securities, corporate securities, other financial investments and investment collateral under agreements to repurchase (reverse repo).
(9) For figures at December 31, 2006 and 2007, derivatives are valued at market price and classified as a separate line item on the balance sheet. Our derivatives holdings at December 31, 2005, have been reclassified from “other assets” and “other liabilities” to “derivatives”, but have not been marked to market as would be required under currently applicable accounting principles. At prior dates, derivatives are classified under “other assets” or “other liabilities”, and generally recorded at net notional amount. See “Item 5: A. Accounting Standards for Financial Investments and Derivatives” and Note 1 of our Consolidated Financial Statements.
(10) Net interest revenue divided by average interest earning assets (as presented in “Item 5: F. Selected Statistical Information”).
(11) Net income divided by average total assets (as presented in “Item 5: F. Selected Statistical Information”).
(12) Net income divided by average shareholders’ equity (as presented in “Item 5: F. Selected Statistical Information”).
(13) Substandard loans in the old rating system included all loans rated B- or worse. In the new loan risk classification system which took effect in 2004, substandard loans include all consumer and mortgage loans rated B- or worse and all commercial loans rated C2 or worse. See “Item 5: F. Selected Statistical Information—Analysis of Substandard Loans and Amounts Past Due.” Therefore, the historical figures in 2003 are not strictly comparable to figures in 2004, 2005, 2006 or 2007.
(14) Past due loans are loans the principal or interest amount of which is overdue for 90 or more days, and do not include the installments of such loans that are not overdue or that are less than 90 days overdue, unless legal proceedings have been commenced for the entire outstanding balance according to the terms of the loan.
(15) Operating revenue includes “Net interest revenue,” “Total fees and income from services, net” and “Other operating income, net.”
(16) For the purpose of computing the ratios of earnings to fixed charges, earnings consist of earnings before income tax and fixed charges. Fixed charges consist of gross interest expense and the proportion deemed representative of the interest factor of rental expense.
(17) The following ratios have been calculated using U.S. GAAP figures except for net interest margin. See footnote 18 regarding calculation of net interest margin.
(18) Net interest margin has been determined by applying the relevant U.S. GAAP adjustments to net interest income for the years ended December 31, 2003, 2004, 2005, 2006 and 2007, presented in accordance with Article 9 of Regulation S-X divided by average interest earning assets calculated on a Chilean GAAP basis. See Note 28(y) to our Consolidated Financial Statements at and for the years ended December 31, 2002, 2003 and 2004, and Note 28(v) of our Consolidated Financial Statements for the years ended December 31, 2005, 2006 and 2007.
(19) Net income divided by average total assets. Average total assets were calculated as an average of the beginning and ending balances for each year, and total assets on a U.S. GAAP basis have been determined by applying the relevant U.S. GAAP adjustments to total assets presented in accordance with Article 9 of Regulation S-X. See Note 28 to our Audited Consolidated Financial Statements.
(20) Average shareholders’ equity was calculated as an average of the beginning and ending balances for each year. Shareholders’ equity on a U.S. GAAP basis has been determined by applying the relevant U.S. GAAP adjustments to shareholders’ equity presented in accordance with Article 9 of Regulation S-X. See Note 28 to our Audited Consolidated Financial Statements.
(21) Based on information published by the Central Bank.
(22) Figures prior to 2005 do not include special payment centers.
Exchange Rates
Chile has two currency markets, the Mercado Cambiario Formal, or the Formal Exchange Market and the Mercado Cambiario Informal, or the Informal Exchange Market. According to Law 18,840, the organic law of the Central Bank, and the Central Bank Act (Ley Orgánica Constitucional del Banco Central de Chile), the Central Bank determines which purchases and sales of foreign currencies must be carried out in the Formal Exchange Market. Pursuant to Central Bank regulations which are currently in effect, all payments, remittances or transfers of foreign currency abroad which are required to be effected through the Formal Exchange Market may be effected with foreign currency procured outside the Formal Exchange Market. The Formal Exchange Market is comprised of the banks and other entities so authorized by the Central Bank. The conversion from pesos to U.S. dollars of all

9
payments and distributions with respect to the ADSs described in this Annual Report must be transacted at the spot market rate in the Formal Exchange Market. Current regulations require that the Central Bank be informed of certain transactions and that they be effected through the Formal Exchange Market.
Purchases and sales of foreign currencies performed may be legally carried out in the Informal Exchange Market. The Informal Exchange Market reflects transactions carried out at informal exchange rates by entities not expressly authorized to operate in the Formal Exchange Market. There are no limits imposed on the extent to which the rate of exchange in the Informal Exchange Market can fluctuate above or below the observed exchange rate. On December 31, 2007, and March 31, 2008, the exchange rate in the Informal Exchange Market as published by Reuters at 1:30pm on these days was Ch$497.78 and Ch$436.15, or 0.4% and -0.67%, respectively, more expensive than the published observed exchange rate for such date of Ch$495.82 and Ch$439.09, respectively, per US$1.00.
The following table sets forth the annual low, high, average and period end observed exchange rate for U.S. dollars for each of the following periods, as reported by the Central Bank. We make no representation that the Chilean peso or the U.S. dollar amounts referred to herein actually represent, could have been or could be converted into U.S. dollars or Chilean pesos, as the case may be, at the rates indicated, at any particular rate or at all.
Daily Observed Exchange Rate Ch$ Per US$(1)
Year Low(2) High(2) Average(3) Period End(4)
2003................................................................................. 593.10 758.21 691.54 599.42 2004................................................................................. 559.21 649.45 609.55 559.83 2005................................................................................. 509.70 592.75 559.86 514.21 2006................................................................................. 511.44 549.63 530.26 534.43 2007................................................................................. 493.14 548.67 522.69 495.82
Month December 2007 ............................................................... 495.49 506.79 499.28 495.82 January 2008 ................................................................... 463.58 498.05 480.90 465.30 February 2008 ................................................................. 458.02 476.44 467.22 458.02 March 2008 ..................................................................... 431.22 454.94 442.94 439.09 April 2008 ...................................................................... 433.98 459.16 446.43 459.16 May 2008 ........................................................................ 461.49 479.66 470.10 479.66 June 2008 (throughout June 25) ..................................... 479.54 505.11 490.32 505.11
Source: Central Bank.
(1) Nominal figures.
(2) Exchange rates are the actual low and high, on a day-by-day basis for each period.
(3) The average of monthly average rates during the year.
(4) As reported by the Central Bank the first business day of the following period.
Dividends
Under the current General Banking Law, a Chilean bank may only pay a single dividend per year (i.e., interim dividends are not permitted). Santander-Chile’s annual dividend is proposed by its Board of Directors and is approved by the shareholders at the annual ordinary shareholders’ meeting held the year following that in which the dividend is generated. For example, the 2007 dividend must be proposed and approved during the first four months of 2008. Following shareholder approval, the proposed dividend is declared and paid. Historically, the dividend for a particular year has been declared and paid no later than one month following the shareholders’ meeting. Dividends are paid to shareholders of record on the fifth day preceding the date set for payment of the dividend. The applicable record dated for the payment of dividends to holders of ADSs will, to the extent practicable, be the same.
Under the General Banking Law a bank must distribute cash dividends in respect of any fiscal year in an amount equal to at least 30% of its net income for that year, as long as the dividend does not result in the infringement of minimal capital requirements. The balances of our distributable net income are generally retained for use in our business (including for the maintenance of any required legal reserves). Although our Board of Directors currently intends to pay regular annual dividends, the amount of dividend payments will depend upon,

10
among other factors, our then current level of earnings, capital and legal reserve requirements, as well as market conditions, and there can be no assurance as to the amount or timing of future dividends.
Dividends payable to holders of ADSs are net of foreign currency conversion expenses of the Bank of New York as depositary (the “Depositary”) and will be subject to the Chilean withholding tax currently at the rate of 35% (subject to credits in certain cases as described in “Item 10: E. Taxation—Material Tax Consequences of Owning Shares of Our Common Stock or ADSs).
Under the Foreign Investment Contract (as defined herein), the Depositary, on behalf of ADS holders, is granted access to the Formal Exchange Market to convert cash dividends from Chilean pesos to U.S. dollars and to pay such U.S. dollars to ADS holders outside Chile, net of taxes, and no separate registration by ADS holders is required. In the past, Chilean law required that holders of shares of Chilean companies who were not residents of Chile to register as foreign investors under one of the foreign investment regimes contemplated by Chilean law in order to have dividends, sale proceeds or other amounts with respect to their shares remitted outside Chile through the Formal Exchange Market. On April 19, 2001, the Central Bank deregulated the Exchange Market eliminating the need to obtain approval from the Central Bank in order to remit dividends, but at the same time this eliminated the possibility of accessing the Formal Exchange Market. These changes do not affect the current Foreign Investment Contract, which was signed prior to April 19, 2001, which grants access to the Formal Exchange Market with prior approval of the Central Bank. See “Item 10: D. Exchange Controls.”
The following table presents dividends declared and paid by us in nominal terms in the following years:
Year Dividend
Ch$ mn (1) Per share
Ch$/share (2) Per ADR
Ch$/ADR (3) % over
earnings (4)
2004 206,975 1.10 1,141.16 100 2005 198,795 1.05 1,096.06 100 2006 155,811 0.83 859.06 65 2007 185,628 0.99 1,023.46 65 2008 200,620 1.06 1,106.12 65
(1) Million of nominal pesos.
(2) Calculated on the basis of 188,446 million shares.
(3) Calculated on the basis of 1,039 shares per ADS.
(4) Calculated by dividing dividend paid in the year by net income for the previous year.
B. Capitalization and Indebtedness
Not applicable.
C. Reasons for the Offer and Use of Proceeds
Not applicable.
D. Risk Factors
You should carefully consider the following risk factors, as well as all the other information presented in this Annual Report before investing in securities issued by us. The risks and uncertainties described below are not the only ones that we face. Additional risks and uncertainties that we do not know about or that we currently think are immaterial may also impair our business operations. Any of the following risks, if they actually occur, could materially and adversely affect our business, results of operations, prospects and financial condition.
We are subject to market risks that are presented both in this subsection and in “Item 5: Operating and Financial Review and Prospects” and “Item 11: Quantitative and Qualitative Disclosures about Market Risk.”

11
Risks Associated with Our Business
Increased competition and industry consolidation may adversely affect results of our operations.
The Chilean market for financial services is highly competitive. We compete with other Chilean private sector domestic and foreign banks, with Banco del Estado, a public sector bank, with department stores and the larger supermarket chains that make consumer loans and sell other financial products to a large portion of the Chilean population. The lower middle to middle income segments of the Chilean population and the small and medium sized corporate segments have become the target markets of several banks, and competition in these segments is likely to increase. As a result, net interest margins in these segments are likely to decline. Although we believe that demand for financial products and services from individuals and for small and medium sized companies will continue to grow during the remainder of the decade, we cannot assure you that net interest margins will be maintained at their current levels.
We also face competition from non-bank and non-finance competitors (principally department stores and the larger supermarket chains) with respect to some of our credit products, such as credit cards, consumer loans and insurance brokerage. In addition, we face competition from non-bank finance competitors, such as leasing, factoring and automobile finance companies, with respect to credit products, and from mutual funds, pension funds and insurance companies, with respect to savings products. For the time being, banks continue to be the main suppliers in Chile for leasing, factoring and mutual funds, and the insurance sales business has seen rapid growth.
The increase in competition within the Chilean banking industry in recent years has led to, among other things, consolidation in the industry. We expect the trends of increased competition and consolidation to continue and result in the formation of new large financial groups. Consolidation, which can result in the creation of larger and stronger competitors, may adversely affect our financial condition and results of operations by decreasing the net interest margins we are able to generate. In addition, Law No. 19,769 allows insurance companies to participate and compete with banks in the residential mortgage and credit card businesses.
Our allowances for impairment losses may not be adequate to cover our future actual losses to our loan portfolio.
At December 31, 2007, our allowance for impairment losses on loans was Ch$232,766 million, and the ratio of our allowance for impairment losses to total loans was 1.73%. The amount of allowances is based on our current assessment of and expectations concerning various factors affecting the quality of our loan portfolio. These factors include, among other things, our borrowers’ financial conditions, repayment abilities and repayment intentions, the realizable value of any collateral, the prospects for support from any guarantor, Chile’s economy, government macroeconomic policies, interest rates and legal and regulatory environment. Many of these factors are beyond our control. If our assessment of and expectations concerning the above mentioned factors differ from actual developments, or if the quality of our loan portfolio deteriorates or the future actual losses exceed our estimates, our allowance for impairment losses may not be adequate to cover actual losses and we may need to make additional provisions for impairment losses, which may materially and adversely affect our results of operations and financial condition.
Our exposure to individuals and small businesses could lead to higher levels of past due loans, allowances for loan losses and charge-offs.
A substantial number of our customers consist of individuals (approximately 42.7% of the value of the total loan portfolio at December 31, 2007) and, to a lesser extent, small and medium sized companies (those with annual sales of less than US$2.2 million) which comprised approximately 15.8% of the value of the total loan portfolio at December 31, 2007. As part of our business strategy, we seek to increase lending and other services to small companies and individuals. Small companies and individuals are, however, more likely to be adversely affected by downturns in the Chilean economy than large corporations and high income individuals. In addition, at December 31, 2007, our residential mortgage loans, both, financed by mortgage bonds and otherwise totaled Ch$3,328,786 million, representing 24.7% of our total loans (27.1% of total loans excluding contingent loans. See “Item 5: F. Selected Statistical Information—Loan Portfolio” and “Item 5: F. Selected Statistical Information—Loans by Economic Activity” for a description and presentation of residential mortgages in the balance sheet). If the economic conditions and real estate market in Chile experience a significant downturn, our asset quality, results of operations and financial condition may be materially and adversely affected. Economic activities in Chile may slow down in

12
2008 given the volatility of international markets and the possible slow down of the world economic growth as a result of the credit crisis that is affecting the U.S. economy. At the same time, higher energy costs and a restrictive interest rate environment due to higher inflation could also negatively affect the economy. As a result of these factors, in the future we may experience higher levels of past due loans, which could result in higher provisions for loan losses. There can be no assurance that the levels of past due loans and subsequent write offs will not be materially higher in the future.
If we are unable to maintain the quality of our loan portfolio, our financial condition and results of operations may be materially and adversely affected.
At December 31, 2007, our past due loans were Ch$116,654 million, and the ratio of our past due loans to total loans was 0.87%. For additional information on our asset quality, see “Item 5: F. Selected Statistical Information—Analysis of Substandard Loans and Amounts Past Due.” We seek to continue to improve our credit risk management policies and procedures. However, we cannot assure you that our credit risk management policies, procedures and systems are free from any deficiency. Failure of credit risk management policies may result in an increase in level of non performing loans and adversely affect the quality of our loan portfolio. In addition, the quality of our loan portfolio may also deteriorate due to various other reasons, including factors beyond our control. If such deterioration were to occur, it would materially and adversely affect our financial conditions and results of operations.
The value of the collateral securing our loans may not be sufficient, and we may be unable to realize the full value of the collateral securing our loan portfolio.
The value of the collateral securing our loan portfolio may significantly fluctuate or decline due to factors beyond our control, including macroeconomic factors affecting Chile’s economy. However, we may not have current information on the value of collateral, which may result in an inaccurate assessment for impairment losses of our loans secured by such collateral. If this were to occur, we may need to make additional provisions to cover actual impairment losses of our loans, which may materially and adversely affect our results of operations and financial condition.
Additionally, there are certain provisions under Chilean law that may affect our ability to foreclose or liquidate residential mortgages granted to us by our customers if the affected real estate has been declared as “family property” by a court. Also, foreclosure will be extremely limited if any party using the real estate has filed with a court a petition requesting that such real estate be declared as family property.
The growth of our loan portfolio may expose us to increased loan losses.
From December 31, 2002, to December 31, 2007, our aggregate loan portfolio (on an unconsolidated combined basis) grew by 45.6% in real terms to Ch$13,468,981 million (US$27.2 billion), while our consumer loan portfolio grew by 143.7% in nominal terms to Ch$2,003,125 million (US$4,040 million), excluding lines of credit and calculated in accordance with the loan classification system of the Superintendency of Banks. Because the method of classification of loans used by the Superintendency of Banks for its public information differs in minor respects from that used by us for internal accounting purposes, the foregoing figures may differ from the figures included in our financial statements. The further expansion of our loan portfolio (particularly in the consumer, small and mid sized companies and real estate segments) can be expected to expose us to a higher level of loan losses and require us to establish higher levels of provisions for loan losses.
Our loan portfolio may not continue to grow at the same rate.
There can be no assurance that in the future our loan portfolio will continue to grow at the same or similar rates as the historical growth rate. A reversal of the rate of growth of the Chilean economy, a slowdown in the growth of customer demand, an increased in market competition or changes in governmental regulations, could adversely affect the rate of growth of our loan portfolio and our risk index and, accordingly, increase our required allowances for loan losses.

13
The effectiveness of our credit risk management is affected by the quality and scope of information available in Chile.
In assessing customers’ creditworthiness, we rely largely on the credit information available from our own internal databases, the Superintendency of Banks, Dicom (a nationwide credit bureau) and other sources. Due to limitations on the availability of information and the developing information infrastructure in Chile, our assessment of the credit risks associated with a particular customer may not be based on complete, accurate or reliable information. In addition, although we have been improving our credit scoring systems to better assess borrowers’ credit risk profiles, we cannot assure you that our credit scoring systems collect complete or accurate information reflecting the actual behavior of customers or that their credit risk can be assessed correctly. Without complete, accurate and reliable information, we have to rely on other publicly available resources and our internal resources, which may not be effective. As a result, our ability to effectively manage our credit risk may be materially and adversely affected.
Fluctuations in the rate of inflation may affect our results of operations.
Inflation in Chile gained momentum in 2007. In 2007, inflation reached 7.8% compared to 2.6% in 2006. High levels of inflation in Chile could adversely affect the Chilean economy and have an adverse effect on our business, financial condition and results of operations.
Our assets and liabilities are denominated in Chilean pesos, UF and foreign currencies. The UF is revalued in monthly cycles. On each day in the period beginning the tenth day of the current month through the ninth day of the succeeding month, the nominal peso value of the UF is indexed up (or down in the event of deflation) in order to reflect a proportional amount of the change in the Chilean Consumer Price Index during the prior calendar month. For more information regarding the UF see “Item 5: F. Selected Statistical Information—Average Balance Sheets, Income Earned from Interest-Earning Assets And Interest Paid on Interest Bearing Liabilities.” Although we currently benefit inflation in Chile, due to the current structure of our assets and liabilities (i.e., a significant portion of our loans are indexed to the inflation rate, but there are no corresponding features in deposits, or other funding sources that would increase the size of our funding base), there can be no assurance that our business, financial condition and result of operations in the future will not be adversely affected by changing levels of inflation, including from extended periods of inflation that adversely affect economic growth or periods of deflation.
Our results of operations are affected by interest rate volatility.
Our results of operations depend to a great extent on our net interest revenue. In 2007, net interest revenue represented 87.9% of our operating revenue. Changes in market interest rates could affect the interest rates earned on our interest earning assets differently from the interest rates paid on our interest bearing liabilities leading to a reduction in our net interest revenue or result in a decrease in customer’s demand for our loan or deposit products. Interest rates are highly sensitive to many factors beyond our control, including the reserve policies of the Central Bank, deregulation of the financial sector in Chile, domestic and international economic and political conditions and other factors. Any changes in interest rates could adversely affect our business, our future financial performance and the price of our securities. The following table shows the yields on the Chilean government’s 90-day notes as reported by the Central Bank of Chile at year end for the last five years.
Year Period-end
90 day note (%)
2003 2.58 2004 2.32 2005 4.75 2006 5.10 2007 6.15
Source: Central Bank.

14
Since our principal sources of funds are short-term deposits, a sudden shortage of funds could cause an increase in costs of funding and an adverse effect on our revenues. The restrictions on the exposure of Chilean pension funds may affect our access to funding.
Customer deposits are our primary source of funding. At December 31, 2007, 79.5% of our customer deposits had remaining maturities of one year or less, or were payable on demand. A significant portion of our assets have longer maturities, resulting in a mismatch between the maturities of liabilities and the maturities of assets. If a substantial number of our depositors withdraw their demand deposits or do not roll over their time deposits upon maturity, our liquidity position, results of operations and financial condition may be materially and adversely affected. We cannot assure you that in the event of a sudden or unexpected shortage of funds in the banking system, any money markets in which we operate will be able to maintain levels of funding without incurring high funding costs or the liquidation of certain assets. If this were to happen, our results of operations and financial condition may be materially and adversely affected.
Chilean regulations impose restrictions on the share of assets that a Chilean pension fund management company (Administrador de Fondos de Pension, an “AFP”) may allocate to a single issuer, which is currently 7% per fund managed by an AFP (including any securities issued by the issuer and any bank deposits with the issuer). If the exposure of an AFP to a single issuer exceeds the 7% limit, the AFP is required to reduce its exposure below the limit within three years. At December 31, 2007, the aggregate exposure of AFPs to us was approximately US$7.7 billion or 6.5% of their total assets, and the largest exposure of a single AFP to us was 7.2% of its total assets. If the exposure of any AFP to us exceeds the regulatory limit, we would need to seek alternative sources of funding, which could be more expensive and, as a consequence, may have a material adverse effect on our financial condition and results of operations.
Pension funds must also comply with other investment limits. Recently approved legislation in Chile (Reformas al Mercado de Capitales II (also known as MK2) relaxed the limits on making investments abroad in order to permit pension funds to further diversify their investment portfolios. In 2007, the limit on making investments abroad was increased from 30% to 45%. In 2009 this limit will increase to 60% and in 2011 it will reach 80%. As a result, pension funds may change the composition of their portfolios, including reducing their deposits with local banks. At December 31, 2007, 32.7% of the Bank’s time deposits were from AFPs. Although the legislation referred to above is intended to promote a gradual relaxation of the investment limits, and we may be able to substitute the reduced institutional funds with retail deposits, there can be no assurance that this occurrence will not have a material adverse impact on our business, financial condition and results of operations.
We may be unable to meet requirements relating to capital adequacy.
We are required by the General Banking Law to maintain regulatory capital of at least 8% of our risk-weighted assets, net of required loan loss allowance and deductions, and paid in capital and reserves (“basic capital”) of at least 3% of our total assets, net of required loan loss allowances. As a result of the merger between Old Santander-Chile and Santiago, we were required to maintain a minimum regulatory capital to risk weighted assets ratio of 12%, which was reduced to 11% as of January 1, 2005. At December 31, 2007, the ratio of our basic capital to total assets, net of loan loss allowance, was 6.0%, and the ratio of our regulatory capital to risk weighted assets, net of loan loss allowance and deductions, was 12.2%. Certain developments could affect our ability to continue to satisfy the current capital adequacy requirements applicable to us, including:
• the increase of risk-weighted assets as a result of the expansion of our business;
• the failure to increase our capital correspondingly;
• losses resulting from a deterioration in our asset quality;
• declines in the value of our investment instrument portfolio;
• changes in accounting rules;
• and changes in the guidelines regarding the calculation of the capital adequacy ratios of banks in Chile. In 2010, the Chilean banks will most likely adopt the guidelines set forth under Basel II with adjustments incorporated by the Superintendency of Banks. This should result in a different level of minimum capital

15
required to be maintained by the Bank. No assurance can be given that this will not have a material impact on the Bank’s capitalization ration.
We may also be required to raise additional capital in the future in order to maintain our capital adequacy ratios above the minimum required levels. Our ability to raise additional capital may be limited by numerous factors, including: our future financial condition, results of operations and cash flows; any necessary government regulatory approvals; our credit ratings; general market conditions for capital raising activities by commercial banks and other financial institutions; and domestic and international economic, political and other conditions.
If we require additional capital in the future, we cannot assure you that we will be able to obtain such capital on favorable terms, in a timely manner or at all. Furthermore, the Superintendency of Banks may increase the minimum capital adequacy requirements applicable to us. Accordingly, although we currently meet the applicable capital adequacy requirements, we may face difficulties in meeting these requirements in the future. If we fail to meet the capital adequacy requirements, we may be required to take corrective actions. These measures could materially and adversely affect our business reputation, financial condition and results of operations. In addition, if we are unable to raise sufficient capital in a timely manner, the growth of our loan portfolio and other risk weighted assets may be restricted, and we may face significant challenges in implementing our business strategy. As a result, our prospects, results of operations and financial condition could be materially and adversely affected.
Our business is highly dependant on proper functioning and improvement of information technology systems.
Our business is highly dependant on the ability of our information technology systems to accurately process a large number of transactions across numerous and diverse markets and products in a timely manner. The proper functioning of our financial control, risk management, accounting, customer service and other data processing systems is critical to our business and our ability to compete effectively. We have backup data for our key data processing systems that could be used in the event of a catastrophe or a failure of our primary systems, and have established alternative communication networks where available. However, we do not operate all of our redundant systems on a real time basis and cannot assure you that our business activities would not be materially disrupted if there were a partial or complete failure of any of these primary information technology systems or communication networks. Such failures could be caused by, among other things, software bugs, computer virus attacks or conversion errors due to system upgrading. In addition, any security breach caused by unauthorized access to information or systems, or intentional malfunctions or loss or corruption of data, software, hardware or other computer equipment, could have a material adverse effect on our business, results of operations and financial condition.
Our ability to remain competitive and achieve further growth will depend in part on our ability to upgrade our information technology systems and increase our capacity on a timely and cost effective basis. Any substantial failure to improve or upgrade information technology systems effectively or on timely basis could materially and adversely affect our competitiveness, results of operations and financial condition.
Operational problems or errors can have a material adverse impact on our business, financial condition and results of operations.
Santander-Chile, like all large financial institutions, is exposed to many types of operational risks, including the risk of fraud by employees and outsiders, failure to obtain proper internal authorizations, failure to properly document transactions, equipment failures and errors by employees. Fraud or other misconduct by employees or third parties may be difficult to detect and prevent and could subject us to financial losses and sanctions imposed by governmental authorities as well as seriously harm our reputation. Although Santander-Chile maintains a system of operational controls, there can be no assurance that operational problems or errors will not occur and that their occurrence will not have a material adverse impact on our business, financial condition and results of operations.
Banking regulations may restrict our operations and thereby adversely affect our financial condition and results of operations.
We are subject to regulation by the Superintendency of Banks. In addition, we are subject to regulation by the Central Bank with regard to certain matters, including reserve requirements and interest rates and foreign exchange mismatches and market risks . During the Chilean financial crisis of 1982 and 1983, the Central Bank and the Superintendency of Banks strictly controlled the funding, lending and general business matters of the banking industry in Chile.
16
Pursuant to the Ley General de Bancos, Decreto con Fuerza de Ley No. 3 de 1997, or the General Banking Law, all Chilean banks may, subject to the approval of the Superintendency of Banks, engage in certain businesses other than commercial banking depending on the risk associated with such business and the financial strength of the bank. Such additional businesses include securities brokerage, mutual fund management, securitization, insurance brokerage, leasing, factoring, financial advisory, custody and transportation of securities, loan collection and financial services. The General Banking Law also applies to the Chilean banking system a modified version of the capital adequacy guidelines issued by the Basel Committee on Banking Regulation and Supervisory Practices and limits the discretion of the Superintendency of Banks to deny new banking licenses. There can be no assurance that regulators will not in the future impose more restrictive limitations on the activities of banks, including us, than those currently in effect. Any such change could have a material adverse effect on our financial condition or results of operations.
Historically, Chilean banks have not paid interest on amounts deposited in checking accounts. However, since June 1, 2002, the Central Bank allows banks to pay interest on checking accounts. Currently, there are no applicable restrictions on the interest that may be paid on checking accounts. We have begun to pay interest on some checking accounts under certain conditions. If competition or other factors lead us to pay higher interest rates on checking accounts, to relax the conditions under which we pay interest or to increase the number of checking accounts on which we pay interest, any such change could have a material adverse effect on our financial condition or results of operations.
We must maintain higher regulatory capital to risk-weighted assets than other banks in Chile. The merger of Old Santander-Chile and Santiago required a special regulatory preapproval of the Superintendency of Banks, which was granted on May 16, 2002. The resolution granting this preapproval imposed a mandatory minimum regulatory capital to risk weighted assets ratio of 12% for the merged bank compared to the 8% minimum for other banks in Chile. Effective January 1, 2005, the Superintendency of Banks lowered our minimum regulatory capital to risk weighted assets ratio to 11%. Although we have not failed in the past to comply with our capital maintenance obligations, there can be no assurance that we will be able to do so in the future.
Beginning January 1, 2009, Chilean banks will adopt accounting standards more congruent with International Accounting Standards and we will be restating 2008 figures under these new accounting principles. Although the exact impact of this change is still under discussion, there can be no assurance that this will not have a material impact on our financial condition or results of operation.
We are subject to regulatory inspections and examinations.
We are also subject to various inspections, examinations, inquiries, audits and other regulatory requirements by Chilean regulatory authorities. We cannot assure you that we will be able to meet all the applicable regulatory requirements and guidelines, or that we will not be subject to sanctions, fines and other penalties in the future as a result of non compliance. If sanctions, fines and other penalties are imposed on us for failure to comply with applicable requirements, guidelines or regulations, our business, financial condition, results of operations and our reputation and ability to engage in business may be materially and adversely affected.
Risks Relating to Chile
Our growth and profitability depend on the level of economic activity in Chile.
A substantial amount of our loans are to borrowers doing business in Chile. Accordingly, the recoverability of these loans in particular, our ability to increase the amount of loans outstanding and our results of operations and financial condition in general, are dependent to a significant extent on the level of economic activity in Chile. Our results of operations and financial condition could be affected by changes in economic or other policies of the Chilean government, which has exercised and continues to exercise a substantial influence over many aspects of the private sector, or other political or economic developments in Chile. We cannot assure you that the Chilean economy will continue to grow in the future or that those future developments in or affecting Chile’s exports will not materially and adversely affect our business, financial condition or results of operations.

17
Economic and political problems encountered by other countries may adversely affect the Chilean economy, our results of operations and the market value of our securities.
The prices of securities issued by Chilean companies, including banks, are to varying degrees influenced by economic and market considerations in other countries. We cannot assure you that future developments in or affecting the Chilean economy, including consequences of economic difficulties in other markets, will not materially and adversely affect our business, financial condition or results of operations.
We are directly exposed to risks related to the weakness and volatility of the economic and political situation in other parts of the world, mainly, the United States, Europe, China, Brazil and Argentina. A significant economic deterioration in one of these countries or regions could result in lower economic growth in Chile, lower loan growth, an increase our loan allowances, and therefore, this could affect our financial results, our results of operations and the price of our securities. The recent cuts in gas exports from Argentina to Chile could also adversely affect economic growth in Chile as the prices of alternate sources of energy have risen strongly in recent periods and this may increase inflation rates in Chile. Chile is also involved in an international litigation with Peru regarding maritime borders.
At December 31, 2007, approximately 3.1% of our loans were held abroad and 0.37% of our loans were comprised of loans to companies in Latin American countries. We cannot assure you that crisis and political uncertainty in other Latin American countries will not have an adverse effect on Chile, the price of our securities or our business.
Currency fluctuations could adversely affect our financial condition and results of operations and the value of our securities.
Any future changes in the value of the Chilean peso against the U.S. dollar could affect the dollar value of our securities. The peso has been subject to large devaluations and appreciations in the past and could be subject to significant fluctuations in the future. Our results of operations may be affected by fluctuations in the exchange rates between the peso and the dollar despite our policy and Chilean regulations relating to the general avoidance of material exchange rate exposure. In order to avoid material exchange rate exposure, we enter into forward exchange transactions. The following table shows the value of the Chilean peso relative to the U.S. dollar as reported by the Central Bank at year end for the last four years.
Year Exchange rate (Ch$)
Year-end Devaluation (Revaluation) (%)
2003 599.42 (15.9%) 2004 559.83 (6.6%) 2005 514.21 (8.1%) 2006 534.43 3.9% 2007 495.82 (7.2%)
2008 (as per June 11) 485.61 (2.1%)
Source: Central Bank.
We may decide to change our policy regarding exchange rate exposure. Regulations that limit such exposures may also be amended or eliminated. Greater exchange rate risk will increase our exposure to the devaluation of the peso, and any such devaluation may impair our capacity to service foreign currency obligations and may, therefore, materially and adversely affect our financial condition and results of operations. Notwithstanding the existence of general policies and regulations that limit material exchange rate exposures, the economic policies of the Chilean government and any future fluctuations of the peso against the dollar could affect our financial condition and results of operations.
Furthermore, Chilean trading in the shares underlying our ADSs will be conducted in pesos. Cash distributions with respect to our shares of common stock are received in Chilean pesos by the Depositary which then will convert such amounts to U.S. dollars at the then prevailing exchange rate for the purpose of making payments in respect of our ADSs. If the value of the Chilean peso falls relative to the U.S. dollar, the dollar value of our ADSs and any distributions to be received from the Depositary will be reduced. In addition, the Depositary will incur customary current conversion costs (to be borne by the holders of our ADSs) in connection with the conversion and subsequent distribution of dividends or other payments.

18
Chile’s banking regulatory and capital markets environment is continually evolving and may change.
Changes in banking regulations may materially and adversely affect the bank’s business, financial condition and results of operations. Chilean laws, regulations, policies and interpretations of laws relating to the banking sector and financial institutions are continually evolving and changing. In 2007 regulations governing the Chilean capital markets were approved (Reformas al Mercado de Capitales II; also known as MK2). These modifications, among other things, modified certain provisions set forth in the General Banking Law. Under new legislation, the limit in terms of regulatory capital that banks are allowed to grant unsecured loans to one individual or entity was increased to 10% of regulatory capital and 30% of the regulatory capital of the bank if the amount that exceeds said 10% corresponds to loans secured by collateral with an aggregate value equal to or higher than such excess. Previously, these limits were set at 5% and 25%, respectively. Although any such increase may increase our lending activity, it may also increase the risks associated with the growth of our loan portfolio and increase competition as the number of banks that can compete in the corporate segment increases as they are less constrained by this requirement. See “Item 3: Risk Factors—Risks Associated with Our Business—The growth of our loan portfolio may expose us to increased loan losses.”
In addition, changes in the investment limits abroad on behalf of Chilean pension funds and the modification to minimum capital requirements to be introduced in line with Basel II requirements may materially and adversely affect the bank’s business, financial condition and results of operations. See “Item 3: Risk Factors—Risks Associated with Our Business—Since our principal sources of funds are short-term deposits, a sudden shortage of funds could cause an increase in costs of funding and an adverse effect on our revenues. The restrictions on the exposure of Chilean pension funds may affect our access to funding” and “—We may be unable to meet requirements relating to capital adequacy.”
A worsening of labor relations in the Chile could impact our business.
Labor relations in industries such as the copper and salmon industry have worsened leading to prolonged work stoppage, which has affected their respective output. As of December 31, 2007, on a consolidated basis we had 9,174 employees of which 41.1% were unionized. In March 2007, a new collective bargaining agreement became effective that will expire on March 1, 2011, but this may be negotiated ahead of schedule if management and union agree to. We generally apply the terms of our collective bargaining agreement to unionized and non-unionized employees. We have traditionally enjoyed good relations with our employees and their unions, but we cannot assure you that in the future a strengthening of cross-industry labor movements will not materially and adversely affect our business, financial condition or results of operations.
Any downgrading of Chile debt credit rating for domestic and international debt by international credit rating agencies may adversely affect our business, our future financial performance, stockholder’s equity and the price of our shares and ADSs.
Our ratings are equivalent to the Chilean sovereign ratings. In 2007, Moody’s and Standard and Poor’s improved their rating for the Republic of Chile and also for us. Any adverse revisions to Chile’s credit ratings for domestic and international debt by international rating agencies may adversely affect our ratings, and our business, future financial performance, stockholder’s equity and the price of our equity shares and ADSs.
Chile has different corporate disclosure and accounting standards than those you may be familiar with in the United States.
We prepare our financial statements in accordance with Chilean GAAP, which requires management to make estimates and assumptions with respect to certain matters that are inherently uncertain. The consolidated financial statements include various estimates and assumptions, including but not limited to the adequacy of the allowance for loan losses, estimates of the fair value of certain financial instruments, the selection of useful lives of certain assets and the valuation and recoverability of goodwill and deferred taxes. We evaluate these estimates and judgments on an ongoing (mark-to-market) basis. Management bases its estimates and judgments on historical experience and on various other factors that are believed to be reasonable under the circumstances. Actual results in future periods could differ from those produced by such estimates and assumptions, and if these differences were significant enough, our reported results of operations would be affected materially.
Accounting, financial reporting and securities disclosure requirements in Chile differ from those in the United States. Accordingly, the information about us available to you will not be the same as the information available to

19
shareholders of a U.S. financial institution. There are also material differences between Chilean and U.S. accounting and financial reporting standards. As a result, Chilean financial statements and reported earnings generally differ from those reported based on U.S. accounting and reporting standards.
As a regulated financial institution, we are required to submit to the Superintendency of Banks unaudited unconsolidated balance sheets and income statements, excluding any note disclosure, prepared in accordance with Chilean GAAP and the rules of the Superintendency of Banks on a monthly basis. Such disclosure differs in a number of significant respects from information generally available in the United States with respect to U.S. financial institutions.
The securities laws of Chile, which govern open or publicly listed companies such as us, have as a principal objective promoting disclosure of all material corporate information to the public. Chilean disclosure requirements, however, differ from those in the United States in some material respects. In addition, although Chilean law imposes restrictions on insider trading and price manipulation, applicable Chilean laws are different from those in the United States and in certain respects the Chilean securities markets are not as highly regulated and supervised as the U.S. securities markets.
Our status as a controlled company and a foreign private issuer exempts us from certain of the corporate governance standards of the New York Stock Exchange (“NYSE”), limiting the protections afforded to investors.
We are a “controlled company” and a “foreign private issuer” within the meaning of the NYSE corporate governance standards. Under the NYSE rules, a controlled company is exempt from certain NYSE corporate governance requirements. In addition, a foreign private issuer may elect to comply with the practice of its home country and not to comply with certain NYSE corporate governance requirements, including the requirements that (1) a majority of the Board of Directors consist of independent directors, (2) a nominating and corporate governance committee be established that is composed entirely of independent directors and has a written charter addressing the committee's purpose and responsibilities, (3) a compensation committee be established that is composed entirely of independent directors and has a written charter addressing the committee's purpose and responsibilities and (4) an annual performance evaluation of the nominating and corporate governance and compensation committees be undertaken. We currently use these exemptions and intend to continue using these exemptions. Accordingly, you will not have the same protections afforded to shareholders of companies that are subject to all NYSE corporate governance requirements.
Chile imposes controls on foreign investment and repatriation of investments that may affect your investment in, and earnings from, our ADSs.
Equity investments in Chile by persons who are not Chilean residents have generally been subject to various exchange control regulations which restrict the repatriation of the investments and earnings therefrom. In April 2001, the Central Bank eliminated the regulations that affected foreign investors except that investors are still required to provide the Central Bank with information related to equity investments and conduct such operations within Chile’s Formal Exchange Market. The ADSs are subject to a contract, dated May 17, 1994, among the Depositary, us and the Central Bank (the “Foreign Investment Contract”) that remains in full force and effect. The ADSs continue to be governed by the provisions of the Foreign Investment Contract subject to the regulations in existence prior to April 2001. The Foreign Investment Contract grants the Depositary and the holders of the ADSs access to the Formal Exchange Market, which permits the Depositary to remit dividends it receives from us to the holders of the ADSs. The Foreign Investment Contract also permits ADS holders to repatriate the proceeds from the sale of shares of our common stock withdrawn from the ADR facility, or that have been received free of payment as a consequence of spin offs, mergers, capital increases, wind ups, share dividends or preemptive rights transfers, enabling them to acquire the foreign currency necessary to repatriate earnings from such investments. Pursuant to Chilean law, the Foreign Investment Contract cannot be amended unilaterally by the Central Bank, and there are judicial precedents (although not binding with respect to future judicial decisions) indicating that contracts of this type may not be abrogated by future legislative changes or resolutions of the Advisory Council of the Central Bank. Holders of shares of our common stock, except for shares of our common stock withdrawn from the ADS facility or received in the manner described above, are not entitled to the benefits of the Foreign Investment Contract, may not have access to the Formal Exchange Market, and may have restrictions on their ability to repatriate investments in shares of our common stock and earnings therefrom.
20
Holders of ADSs are entitled to receive dividends on the underlying shares to the same extent as the holders of shares. Dividends received by holders of ADSs will be paid net of foreign currency exchange fees and expenses of the Depositary and will be subject to Chilean withholding tax, currently imposed at a rate of 35.0% (subject to credits in certain cases). If for any reason, including changes in Chilean law, the Depositary were unable to convert Chilean pesos to U.S. dollars, investors would receive dividends and other distributions, if any, in Chilean pesos.
We cannot assure you that additional Chilean restrictions applicable to holders of our ADSs, the disposition of the shares underlying them or the repatriation of the proceeds from such disposition or the payment of dividends will not be imposed in the future, nor can we advise you as to the duration or impact of such restrictions if imposed.
ADS holders may not be able to effect service of process on, or enforce judgments or bring original actions against, us, our directors or our executive officers, which may limit the ability of holders of ADSs to seek relief against us.
We are a Chilean corporation. None of our directors are residents of the United States and most of our executive officers reside outside the United States. In addition, a substantial portion of our assets and the assets of our directors and executive officers are located outside the United States. As a result, it may be difficult for ADS holders to effect service of process outside Chile upon us or our directors and executive officers or to bring an action against us or such persons in the United States or Chile to enforce liabilities based on U.S. federal securities laws. It may also be difficult for ADS holders to enforce in the United States or in Chilean courts money judgments obtained in United States courts against us or our directors and executive officers based on civil liability provisions of the U.S. federal securities laws. If a U.S. court grants a final money judgment in an action based on the civil liability provisions of the federal securities laws of the United States, enforceability of this money judgment in Chile will be subject to the obtaining of the relevant "exequatur" (i.e., recognition and enforcement of the foreign judgment) according to Chilean civil procedure law currently in force, and consequently, subject to the satisfaction of certain factors. The most important of these factors are the existence of reciprocity, the absence of a conflicting judgment by a Chilean court relating to the same parties and arising from the same facts and circumstances and the Chilean courts’ determination that the U.S. courts had jurisdiction, that process was appropriately served on the defendant and that enforcement would not violate Chilean public policy. Failure to satisfy any of such requirements may result in non-enforcement of your rights.
We cannot assure you of the accuracy or comparability of facts, forecasts and statistics contained in this report with respect to Chile, its economy and global banking industries.
Facts, forecasts and statistics in this document relating to Chile, Chile’s economy and Chilean global banking industries, including market share information, are derived from various official and other publicly available sources generally believed to be reliable. However, we cannot guarantee the quality and reliability of such official and other sources of materials. In addition, these facts, forecasts and statistics have not been independently verified by us and, therefore, we make no representation as to the accuracy of such facts, forecasts and statistics, which may not be consistent with other information compiled within or outside of Chile and may not be complete or up to date. We have taken reasonable care in reproducing or extracting the information from such sources. However, because of possible flawed or ineffective methodologies underlying the published information or discrepancies between the published information and market practice and other problems, these facts, forecasts or statistics may be inaccurate and may not be comparable from period to period or to facts, forecasts or statistics produced for other economies, and you should not unduly rely upon them.
Risks Relating to our ADSs
There may be a lack of liquidity and market for our shares and ADSs.
The ADSs are listed and traded on the NYSE. The common stock is listed and traded on the Santiago Stock Exchange, the Chile Electronic Stock Exchange and the Valparaiso Stock Exchange, which we refer to collectively as the Chilean Stock Exchanges, although the trading market for the common stock is small by international standards. At December 31, 2007, we had 188,446,126,794 shares of common stock outstanding. The Chilean securities markets are substantially smaller, less liquid and more volatile than major securities markets in the United States. According to Article 14 of the Ley de Mercado de Valores, Ley No. 18,045, or the Chilean Securities Market Law, the Superintendencia de Valores y Seguros, or the Superintendency of Securities and Insurance, may suspend the offer, quotation or trading of shares of any company listed on one or more Chilean Stock Exchanges for up to 30

21
days if, in its opinion, such suspension is necessary to protect investors or is justified for reasons of public interest. Such suspension may be extended for up to 120 days. If, at the expiration of the extension, the circumstances giving rise to the original suspension have not changed, the Superintendency of Securities and Insurance will then cancel the relevant listing in the registry of securities. In addition, the Santiago Stock Exchange may inquire as to any movement in the price of any securities in excess of 10% and suspend trading in such securities for a day if it deems necessary.
Although the common stock is traded on the Chilean Stock Exchanges, there can be no assurance that a liquid trading market for the common stock will continue. Approximately 23.09% of our outstanding common stock is held by the public (i.e., shareholders other than Banco Santander Spain and its affiliates), including our shares that are represented by ADSs trading on the NYSE. A limited trading market in general and our concentrated ownership in particular may impair the ability of an ADS holder to sell in the Chilean market shares of common stock obtained upon withdrawal of such shares from the ADR facility in the amount and at the price and time such holder desires, and could increase the volatility of the price of the ADSs.
You may be unable to exercise preemptive rights.
The Ley Sobre Sociedades Anónimas, Ley No. 18,046 and the Reglamento de Sociedades Anónimas, which we refer to collectively as the Chilean Companies Law, and applicable regulations require that whenever we issue new common stock for cash, we grant preemptive rights to all of our shareholders (including holders of ADSs), giving them the right to purchase a sufficient number of shares to maintain their existing ownership percentage. Such an offering would not be possible unless a registration statement under the U.S. Securities Act of 1933 (“Securities Act”), as amended, were effective with respect to such rights and common stock or an exemption from the registration requirements thereunder were available.
Since we are not obligated to elect to make a registration statement available with respect to such rights and the common stock, you may not be able to exercise your preemptive rights. If a registration statement is not filed or an applicable exemption is not available, the Depositary will sell such holders’ preemptive rights and distribute the proceeds thereof if a premium can be recognized over the cost of any such sale.
You may have fewer and less well defined shareholders’ rights than with shares of a company in the United States.
Our corporate affairs are governed by our estatutos, or by-laws, and the laws of Chile. Under such laws, our shareholders may have fewer or less well defined rights than they might have as shareholders of a corporation incorporated in a U.S. jurisdiction. For example, under legislation applicable to Chilean banks, our shareholders would not be entitled to appraisal rights in the event of a merger or other business combination undertaken by us.
ITEM 4. INFORMATION ON THE COMPANY
A. History and Development of the Company
Overview
We are the largest bank in Chile in terms of total assets, total deposits, loans and shareholders’ equity. At December 31, 2007, we had total assets of Ch$18,222,730 million (US$36,608 million), loans net of allowances outstanding of Ch$13,236,214 million (US$26,590 million), deposits of Ch$10,821,355 million (US$21,739 million) and shareholders’ equity of Ch$1,438,042 million (US$2,889 million). As of December 31, 2007, we employed 9,174 people (on a consolidated basis) and had the largest private branch network in Chile with 467 branches (includes payment centers Santander SuperCaja and auxiliary tellers). Our headquarters are located in Santiago and we operate in every major region of Chile.
We provide a broad range of commercial and retail banking services to our customers, including Chilean peso and foreign currency denominated loans to finance a variety of commercial transactions, trade financing, foreign currency forward contracts, credit lines and a variety of retail banking services, including mortgage financing. We seek to offer our customers a wide range of products while providing high levels of service. In addition to our traditional banking operations, we offer a variety of financial services including financial leasing, financial advisory services, mutual fund management, securities brokerage, insurance brokerage and investment management.

22
The legal predecessor of Santander-Chile was Banco Santiago (“Santiago”). Santiago was incorporated by public deed dated September 7, 1977 granted at the Notary Office of Alfredo Astaburuaga Gálvez. Santiago received its permission to incorporate and function as a bank by Resolution No. 118 of the Superintendency of Banks on October 27, 1977. Santiago’s by-laws were approved by Resolution No. 103 of the Superintendency of Banks on September 22, 1977. In January 1997, Santiago merged with Banco O’Higgins with Santiago being the surviving entity. In 1999, Santiago became a controlled subsidiary of Banco Santander Spain. As of June 30, 2002, Santiago was the second largest private sector bank in Chile in terms of total assets, deposits, loans and shareholders’ equity.
Old Santander-Chile was established as a subsidiary of Banco Santander Spain in 1978. In 1982, Old Santander-Chile acquired a significant portion of the assets and liabilities of Banco Español-Chile, a domestic bank that had become insolvent. In July 1996, Old Santander-Chile was merged into Banco Osorno y la Unión becoming “Banco Santander-Chile”, the third largest private bank in terms of outstanding loans at that date.
On August 1, 2002, Santiago and Old Santander Chile merged, whereby the latter ceased to exist and Santander-Chile (formerly known as Santiago) being the surviving entity.
Our principal executive offices are located at Bandera 140, Santiago, Chile. Our telephone number is +562-320-2000 and our website is www.santandersantiago.cl. None of the information contained on our website is incorporated by reference into, or forms part of, this Annual Report. Our agent for service of process in the United States is Puglisi & Associates.
Relationship with Banco Santander Spain
We believe that our relationship with our controlling shareholder, Banco Santander Spain, offers us a significant competitive advantage over our peer Chilean banks. Banco Santander Spain is one of the largest financial groups in Latin America, in terms of total assets measured on a region-wide basis. It is the largest financial group in Spain and is a major player elsewhere in Europe, including the United Kingdom through its Abbey subsidiary and Portugal, where it is the third-largest banking group. Through Santander Consumer it also operates a leading consumer finance franchise in the United States as well as in Germany, Italy, Spain, and several other European countries.
Our relationship with Banco Santander Spain provides us with access to the group’s client base, while its multinational focus allows us to offer international solutions to our clients’ financial needs. We also have the benefit of selectively borrowing from Banco Santander Spain’s product offerings in other countries as well as benefiting from their know-how in systems management. We believe that our relationship with Banco Santander Spain will also enhance our ability to manage credit and market risks by adopting policies and know-how developed by Banco Santander Spain. Our internal auditing function has been strengthened and is more independent from management as a result of the addition of an internal auditing department that concurrently reports directly to our Audit Committee and the audit committee of Banco Santander Spain. We believe that this structure leads to improved monitoring and control of our exposure to operational risks.
Banco Santander Spain’s support includes the assignment of managerial personnel to key supervisory areas of Santander-Chile, like Risks, Auditing, Accounting and Financial Control. Santander-Chile does not pay any management fees to Banco Santander Spain in connection with these support services.
B. Organizational Structure
Banco Santander Spain controls Santander-Chile through its holdings in Teatinos Siglo XXI Inversiones Ltda. and Santander-Chile Holding, which are controlled subsidiaries. This gives Banco Santander Spain control over 76.91% of the shares of the Bank and actual participation when excluding minority shareholders that participate in Santander Chile Holding is 76.74%.
Shareholder Number of Shares Percentage Teatinos Siglo XXI Inversiones Ltda. ....................... 78,108,391,607 41.45% Santander Chile Holding ........................................... 66,822,519,695 35.46%

23
Management Team
The chart below sets forth the names and areas of responsibility of our senior commercial managers.
Commercial Structure
Joaquin Quirante
Manager Banca Global
Wholesale Banking
Treasury
Andrés Heusser
Manager Banca Empresas
Middle Market (Santiago), Real Estate &
Large Corporations
Claudio Melandri
Manager Banca Comercial
Middle Market (Regions), Middle-upper income individuals,
Small businesses & Institutional lending
José Luis Silva
Manager Santander Banefe
Middle - lower income individuals
Oscar von Chrismar
Chief Executive Officer
Mauricio Larrain
President
The chart below sets forth the names and areas of responsibilities of our operating managers.
PresidentMauricio Larraín
Strategic Planning
Raimundo Monge
Credit Risk
José Manuel Manzano
Financial Controller
Guillermo Sabater
Human Resources
Francisco Murillo
Accounting
Roberto JaraCEO
Oscar von Chrismar
Internal Audit
Ignacio Centenera
Legal Counsel
Gonzalo Romero
Operations &
Administration
Juan Fernandez
C. Business Overview
We have 467 total branches, 256 of which operated under the Santander brand name, 109 under the Santander Banefe brand name, 42 that operate under the brand name SuperCaja, 18 that operate under the BancaPrime brand name and 42 auxiliary and payment centers. We provide a full range of financial services to corporate and individual customers. We divide our clients into the following segments: (i) Retail, (ii) Institutional, (iii) Middle-market, and (iv) Global Banking and Market.
The Retail segment is comprised of the following sub-segments:
Lower-middle to middle-income (Santander Banefe), consisting of individuals with monthly income between Ch$120,000 (US$241) and Ch$400,000 (US$ 805), which are served through our Santander Banefe branch network. This segment accounts for 4.7% of our loans at December 31, 2007. This segment offers customers a range of products, including consumer loans, credit cards, auto loans, residential mortgage loans, debit card accounts, savings products, mutual funds and insurance brokerage.
Middle- and upper-income, consisting of individuals with a monthly income greater than Ch$400,000 (US$805). Clients in this segment account for 38.0% of our loans at December 31, 2007, and are offered a range of products, including consumer loans, credit cards, auto loans, commercial loans, foreign trade financing, residential mortgage loans, checking accounts, savings products, mutual funds and insurance brokerage.
24
Small businesses, consisting of small companies with annual sales less than Ch$1,200 million (US$2.4 million). At December 31, 2007, small companies represented approximately 15.8% of our total loans outstanding. Customers in this segment are offered a range of products, including commercial loans, leasing, factoring, foreign trade, credit cards, mortgage loans, checking accounts, savings products, mutual funds and insurance brokerage.
The Institutional segment is comprised of:
Institutional organizations, such as universities, government agencies, municipalities and regional governments. At December 31, 2007, these clients represented 1.7% of our total loans outstanding and offer customers a range of products, including commercial loans, leasing, factoring, foreign trade, credit cards, mortgage loans, checking accounts, cash management, savings products, mutual funds and insurance brokerage.
The Middle-market segment is comprised of mid-sized companies, companies in the real estate sector and large companies as follows:
Mid-sized companies, consisting of companies with annual sales over Ch$1,200 million (US$2.4 million) and up to Ch$3,500 million (US$7.0 million). Customers in this segment are offered a wide range of products, including commercial loans, leasing, factoring, foreign trade, credit cards, mortgage loans, checking accounts, cash management, treasury services, financial advisory, savings products, mutual funds and insurance brokerage. At December 31, 2007, these clients represented 8.3% of our total loans outstanding.
Real estate, including all companies in the real estate sector. At December 31, 2007, these clients represented 4.8% of our total loans outstanding. To clients in the real estate sector we offer apart from traditional banking services, specialized services for financing primarily residential projects in order to increase the sale of residential mortgage loans.
Large companies, consisting of companies with annual sales over Ch$3,500 million (US$7.0 million). Customers in this segment are offered a wide range of products, including commercial loans, leasing, factoring, foreign trade, credit cards, mortgage loans, checking accounts, cash management, treasury services, financial advisory, savings products, mutual funds and insurance brokerage. At December 31, 2007, these clients represented 8.5% of our total loans outstanding.
The Global Banking and Markets segment is comprised of:
Wholesale banking, consisting of companies that are foreign multinationals or part of a large Chilean economic group with sales over Ch$3,500 million (US$7.0 million). At December 31, 2007, these clients represented 16.6% of our total loans outstanding. Customers in this segment are offered a wide range of products, including commercial loans, leasing, factoring, foreign trade, mortgage loans, checking accounts, cash management, treasury services, financial advisory, savings products, mutual funds and insurance brokerage.
The Treasury Division provides sophisticated financial products mainly to companies in the wholesale banking and the middle market segments. This includes products such as short-term financing and funding, securities brokerage, interest rate and foreign currency derivatives, securitization services and other tailor made financial products. The Treasury division also manages the Bank’s trading positions as well as the non-trading investment portfolio.
The table below sets forth our lines of business and certain statistical information relating to each of them for the year ended December 31, 2007. Please see Note 28(y) to our Audited Consolidated Financial Statements for details of revenue by business segment in the last three years.

25
At and for the year ended December 31, 2007 (in millions of constant Ch$ as of December 31, 2007)
Segment Loans Net interest
revenue Fees Net loan loss
allowances (1)
Financial transactions, net
(2) Net segment
contribution (3) Individuals 5,744,801 452,136 123,877 (148,771) - 427,242
Santander Banefe 633,299 152,625 27,631 (71,692) - 108,564 Middle-upper income 5,111,502 299,511 96,246 (77,079) - 318,678
SMEs 2,133,312 160,909 37,596 (31,510) - 166,995 Institutional 228,716 12,048 2,041 (29) - 14,060 Total Retail 8,106,829 625,093 163,514 (180,310) - 608,297 Middle-market 2,914,782 89,095 14,856 (612) - 103,339
Mid-sized companies 1,116,642 37,438 7,962 (1,325) - 44,075 Real estate 649,250 15,145 1,491 (300) - 16,336 Large companies 1,148,890 36,512 5,403 1,013 - 42,928
Global Banking and Markets 2,269,392 87,189 13,635 215 12,639 113,678 Wholesale 2,242,510 44,268 8,297 400 52,965 Treasury 26,882 42,921 5,338 (185) 12,639 60,713
Others (4) 177,977 24,239 920 (1,704) (46,952) (23,497) Total 13,468,980 825,616 192,925 (182,411) (34,313) 801,817 Other operating income (45,413) Other income and expenses 6,423 Operating expenses (342,684) Price level restatement (56,325) Net income before taxes 363,818
(1) Includes gross provisions for loan losses, net of releases on recoveries.
(2) Includes the net gains from trading, net mark-to-market gains and net foreign exchange transactions.
(3) Equal to the sum of net interest revenue, net fee income and net financial transactions, minus net provision for loan losses.
(4) Includes contribution of other Bank subsidiaries and other non-segmented items such as interbank loans. Financial transactions, net included in Others is the results from inflation and interest rate hedging.
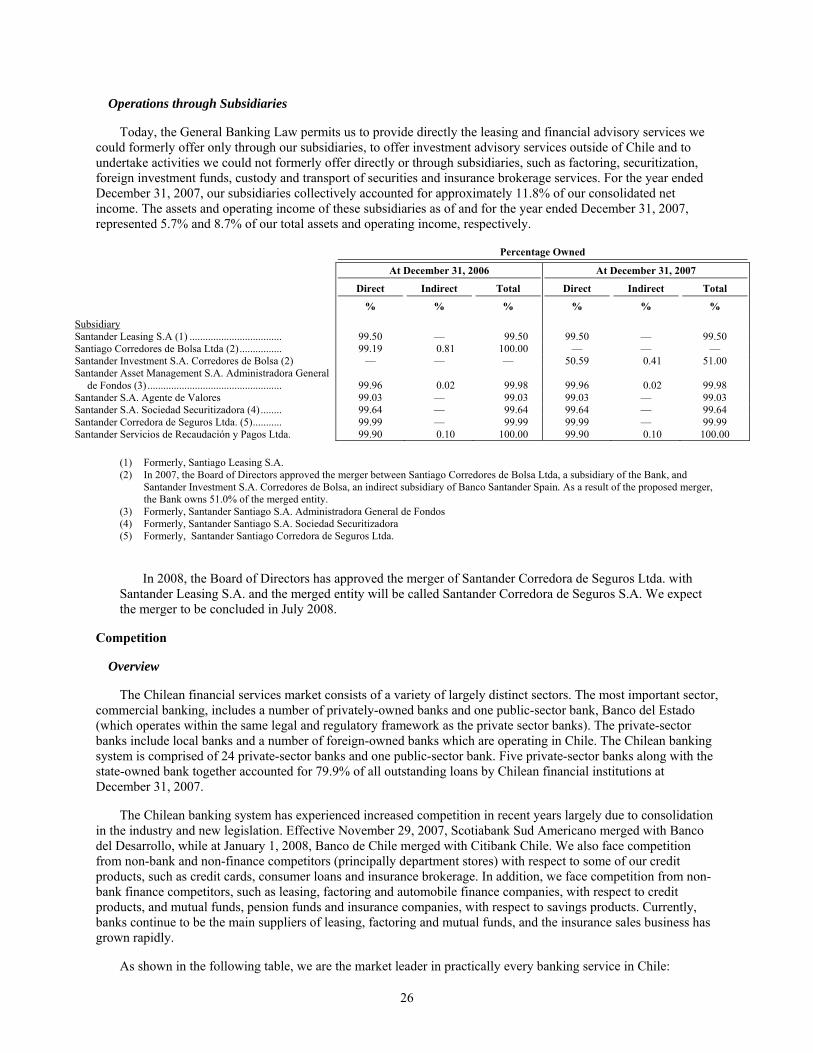
26
Operations through Subsidiaries
Today, the General Banking Law permits us to provide directly the leasing and financial advisory services we could formerly offer only through our subsidiaries, to offer investment advisory services outside of Chile and to undertake activities we could not formerly offer directly or through subsidiaries, such as factoring, securitization, foreign investment funds, custody and transport of securities and insurance brokerage services. For the year ended December 31, 2007, our subsidiaries collectively accounted for approximately 11.8% of our consolidated net income. The assets and operating income of these subsidiaries as of and for the year ended December 31, 2007, represented 5.7% and 8.7% of our total assets and operating income, respectively.
Percentage Owned
At December 31, 2006 At December 31, 2007
Direct Indirect Total Direct Indirect Total
% % % % % %
Subsidiary Santander Leasing S.A (1) ................................... 99.50 — 99.50 99.50 — 99.50 Santiago Corredores de Bolsa Ltda (2)................ 99.19 0.81 100.00 — — — Santander Investment S.A. Corredores de Bolsa (2) — — — 50.59 0.41 51.00 Santander Asset Management S.A. Administradora General
de Fondos (3) ................................................... 99.96 0.02 99.98 99.96 0.02 99.98 Santander S.A. Agente de Valores 99.03 — 99.03 99.03 — 99.03 Santander S.A. Sociedad Securitizadora (4) ........ 99.64 — 99.64 99.64 — 99.64 Santander Corredora de Seguros Ltda. (5)........... 99.99 — 99.99 99.99 — 99.99 Santander Servicios de Recaudación y Pagos Ltda. 99.90 0.10 100.00 99.90 0.10 100.00
(1) Formerly, Santiago Leasing S.A. (2) In 2007, the Board of Directors approved the merger between Santiago Corredores de Bolsa Ltda, a subsidiary of the Bank, and
Santander Investment S.A. Corredores de Bolsa, an indirect subsidiary of Banco Santander Spain. As a result of the proposed merger, the Bank owns 51.0% of the merged entity.
(3) Formerly, Santander Santiago S.A. Administradora General de Fondos (4) Formerly, Santander Santiago S.A. Sociedad Securitizadora (5) Formerly, Santander Santiago Corredora de Seguros Ltda.
In 2008, the Board of Directors has approved the merger of Santander Corredora de Seguros Ltda. with Santander Leasing S.A. and the merged entity will be called Santander Corredora de Seguros S.A. We expect the merger to be concluded in July 2008.
Competition
Overview
The Chilean financial services market consists of a variety of largely distinct sectors. The most important sector, commercial banking, includes a number of privately-owned banks and one public-sector bank, Banco del Estado (which operates within the same legal and regulatory framework as the private sector banks). The private-sector banks include local banks and a number of foreign-owned banks which are operating in Chile. The Chilean banking system is comprised of 24 private-sector banks and one public-sector bank. Five private-sector banks along with the state-owned bank together accounted for 79.9% of all outstanding loans by Chilean financial institutions at December 31, 2007.
The Chilean banking system has experienced increased competition in recent years largely due to consolidation in the industry and new legislation. Effective November 29, 2007, Scotiabank Sud Americano merged with Banco del Desarrollo, while at January 1, 2008, Banco de Chile merged with Citibank Chile. We also face competition from non-bank and non-finance competitors (principally department stores) with respect to some of our credit products, such as credit cards, consumer loans and insurance brokerage. In addition, we face competition from non-bank finance competitors, such as leasing, factoring and automobile finance companies, with respect to credit products, and mutual funds, pension funds and insurance companies, with respect to savings products. Currently, banks continue to be the main suppliers of leasing, factoring and mutual funds, and the insurance sales business has grown rapidly.
As shown in the following table, we are the market leader in practically every banking service in Chile:

27
Market Share at December 31,
2006
Market Share at December 31,
2007
Rank as of at December 31,
2007
Commercial loans ........................................................................ 18.7% 17.5% 2 Consumer loans ........................................................................... 26.7 26.2 1 Mortgage loans (residential and general purpose) ....................... 24.2 23.4 1 Residential mortgage loans.......................................................... 25.9 24.8 2 Foreign trade loans (loans for export, import and contingent)..... 21.5 22.0 1 Total loans ................................................................................... 22.3 21.1 1 Deposits (1) ................................................................................. 22.0 21.3 1 Mutual funds (assets managed) ................................................... 22.1 21.5 2 Credit card accounts .................................................................... 35.8 36.0 1 Checking Accounts (1) ................................................................ 27.1 27.9 1 Branches (2)................................................................................. 20.3 20.2 1 ATM locations (3) ....................................................................... 28.6 30.8 1
Source: Superintendency of Banks
(1) Net of clearance.
(2) According to latest data available as of November 2007.
(3) According to latest data available as of December 2007. Excluding special-service payment centers.
(4) According to latest data available as of September 2007.
Our market share in Chile’s commercial loan market decreased from December 31, 2006, to December 31, 2007, and we ranked the second in this market at December 31, 2007. This is primarily due to our reduction of relatively low yielding large corporate portfolio.
The following tables set out certain statistics comparing our market position to that of our peer group, defined as the five largest banks in Chile in terms of shareholders’ equity as of December 31, 2007.
Loans
As of December 31, 2007, our loan portfolio was the largest among Chilean banks. Our loan portfolio on a stand-alone basis represented 21.1% of the market for loans in the Chilean financial system at such date. The following table sets forth our and our peer group’s market shares in terms of loans at the dates indicated.
At December 31, 2007 At December 31, 2006
Loans Ch$ million US$ million Market Share
Market Share
Santander-Chile.................................................. 13,442,328 27,111 21.1% 22.3% Banco de Chile ................................................... 11,761,218 23,721 18.5 18.0 Banco del Estado................................................ 8,187,822 16,514 12.8 13.3 Banco de Crédito e Inversiones.......................... 7,877,412 15,888 12.4 12.4 BBVA, Chile...................................................... 5,310,119 10,710 8.3 8.1 Corpbanca .......................................................... 4,345,435 8,764 6.8 6.3 Others................................................................. 12,810,762 25,838 20.1 19.6 Chilean financial system .................................... 63,735,096 128,545 100.0% 100.0%
Source: Superintendency of Banks
Deposits
On a stand alone basis, we had a 21.3% market share in deposits, ranking the first place among banks in Chile at December 31, 2007. Deposit market share is based on total time and demand deposits at the respective dates. The following table sets forth our and our peer group’s market shares in terms of deposits at the dates indicated.
At December 31, 2007 At December 31, 2006
Deposits Ch$ million US$ million Market Share
Market Share
Santander-Chile.................................................. 10,799,111 21,780 21.3% 22.1%

28
At December 31, 2007 At December 31, 2006
Deposits Ch$ million US$ million Market Share
Market Share
Banco de Chile ................................................... 8,669,331 17,485 17.1 17.7 Banco del Estado................................................ 7,713,725 15,558 15.2 15.4 Banco de Crédito e Inversiones.......................... 6,279,831 12,666 12.4 12.6 BBVA, Chile...................................................... 4,113,902 8,297 8.1 8.0 Corpbanca .......................................................... 2,755,194 5,557 5.4 4.6 Others................................................................. 10,375,646 20,926 20.5 19.5 Chilean financial system .................................... 50,706,740 102,268 100.0% 100.0%
Source: Superintendency of Banks
Shareholders’ equity
With Ch$1,438,042 million (US$2,889 million) in shareholders’ equity, at December 31, 2007, we were the largest commercial bank in Chile in terms of shareholders’ equity. The following table sets forth our and our peer group’s shareholders’ equity at December 31, 2006 and 2007.
At December 31, 2007 At December
31, 2007
Equity(1) Ch$ million US$ million Market Share
Market Share
Santander-Chile...................................................................... 1,438,042 2,889 20.7% 21.8% Banco de Chile ....................................................................... 1,051,393 2,121 15.2 14.6 Banco del Estado.................................................................... 582,492 1,175 8.4 8.9 Banco de Crédito e Inversiones.............................................. 703,934 1,420 10.1 10.3 BBVA, Chile.......................................................................... 366,748 740 5.3 5.2 Corpbanca .............................................................................. 484,674 978 7.0 7.6 Others..................................................................................... 2,312,462 4,664 33.3 31.5 Chilean financial system ........................................................ 6,939,745 13,997 100.0% 100.0%
Source: Superintendency of Banks.
(1) Percentage of total shareholders’ equity of all Chilean banks.
Efficiency
For the year ended December 31, 2007, we were the most efficient bank in our peer group. The following table sets forth our and our peer group’s efficiency ratio (defined as operating expenses as a percentage of operating revenue, which is aggregate of net interest revenue, fees and income from services (net) and other operating income (net) for the year indicated.
Efficiency ratio
As of December 31, 2007
As of December 31, 2006
% % Santander-Chile ............................................................................................................................ 37.9% 40.6% Banco de Chile ............................................................................................................................. 45.8 51.1 Banco del Estado .......................................................................................................................... 57.0 59.0 Banco de Crédito e Inversiones .................................................................................................... 51.1 53.7 BBVA, Chile ................................................................................................................................ 62.7 66.6 Corpbanca..................................................................................................................................... 42.4 50.1 Chilean financial system............................................................................................................... 48.7% 52.1%
Source: Superintendency of Banks, on a stand alone basis

29
Return on average equity
As of December 31, 2007, we were the second most profitable bank in our peer group (as measured by return on average equity) and the most capitalized bank as measured by the BIS ratio. The following table sets forth our and our peer group’s return on average equity for the year ended December 31, 2006 and 2007, and BIS ratio at the dates indicated:
Return on average equity
at December 31, BIS Ratio
at December 31,
2007 2006 2007 2006
% % % % Santander-Chile ................................................................... 23.4% 24.8% 12.2% 12.6% Banco de Chile..................................................................... 27.7 25.5 10.7 10.7 Banco del Estado ................................................................. 9.2 9.9 10.8 11.1 Banco de Crédito e Inversiones ........................................... 21.7 22.6 10.4 10.3 BBVA, Chile ....................................................................... 9.8 10.0 10.3 10.3 Corpbanca............................................................................ 11.6 9.5 11.3 13.6 Chilean Financial System .................................................... 16.0% 16.7% 12.2% 12.5%
Source: Superintendency of Banks, except Santander-Chile. Calculated by dividing annual net income by monthly average equity. For Santander-Chile, the average equity is calculated on a daily basis by the Bank (see “Item 5: F. Selected Statistical Information—Average Balance Sheets, Income Earned from Interest-Earning Assets And Interest Paid on Interest Bearing Liabilities”).
Asset Quality
At December 31, 2007, on a stand alone basis, we had the second lowest loan loss allowance to total loans ratio in our peer group. The following table sets forth our and our peer group’s loan loss allowance to total loans ratio as defined by the Superintendency of Banks at the dates indicated.
Loan Loss allowances/total loans
at December 31,
2007 2006
% % Santander-Chile ................................................................................................................... 1.71% 1.46%Banco de Chile .................................................................................................................... 1.34 1.48 Banco del Estado ................................................................................................................. 1.97 1.67 Banco de Crédito e Inversiones ........................................................................................... 1.32 1.27 BBVA, Chile ....................................................................................................................... 0.99 1.14 Corpbanca............................................................................................................................ 1.27 1.40 Chilean financial system...................................................................................................... 1.58% 1.48%
Source: Superintendency of Banks
D. Regulation and Supervision
General
In Chile, only banks may maintain checking accounts for their customers, conduct foreign trade operations, and together with non-banking financial institutions, accept time deposits. The principal authorities that regulate financial institutions in Chile are the Superintendency of Banks and the Central Bank. Chilean banks are primarily subject to the General Banking Law and secondarily, to the extent not inconsistent with this statute, the provisions of the Chilean Companies Law governing public corporations, except for certain provisions which are expressly excluded.

30
The modern Chilean banking system dates from 1925 and has been characterized by periods of substantial regulation and state intervention, as well as periods of deregulation. The most recent period of deregulation commenced in 1975 and culminated in the adoption of a series of amendments to General Banking Law. That law, amended most recently in 2001, granted additional powers to banks, including general underwriting powers for new issues of certain debt and equity securities and the power to create subsidiaries to engage in activities related to banking, such as brokerage, investment advisory and mutual fund services, administration of investment funds, factoring, securitization products and financial leasing services.
The Central Bank
The Central Bank is an autonomous legal entity created by the Chilean Constitution. It is subject to the Chilean Constitution and its own ley orgánica constitucional, or organic constitutional law. To the extent not inconsistent with the Chilean Constitution or the Central Bank’s organic constitutional law, the Central Bank is also subject to private sector laws (but in no event is it subject to the laws applicable to the public sector). It is directed and administered by a Board of Directors composed of five members designated by the President of Chile, subject to the approval of the Senate.
The legal purpose of the Central Bank is to maintain the stability of the Chilean peso and the orderly functioning of Chile’s internal and external payment system. The Central Bank’s powers include setting reserve requirements, regulating the amount of money and credit in circulation, establishing regulations and guidelines regarding finance companies, foreign exchange (including the Formal Exchange Market) and banks’ deposit-taking activities.
The Superintendency of Banks
Banks are supervised and controlled by the Superintendency of Banks, an independent Chilean governmental agency. The Superintendency of Banks authorizes the creation of new banks and has broad powers to interpret and enforce legal and regulatory requirements applicable to banks and financial companies. Furthermore, in case of noncompliance with such legal and regulatory requirements, the Superintendency of Banks has the ability to impose sanctions. In extreme cases, it can appoint, with the prior approval of the Board of Directors of the Central Bank, a provisional administrator to manage a bank. It must also approve any amendment to a bank’s by-laws or any increase in its capital.
The Superintendency of Banks examines all banks from time to time, generally at least once a year. Banks are also required to submit their financial statements monthly to the Superintendency of Banks, and a bank’s financial statements are published at least four times a year in a newspaper with countrywide coverage. In addition, banks are required to provide extensive information regarding their operations at various periodic intervals to the Superintendency of Banks. A bank’s annual financial statements and the opinion of its independent auditors must also be submitted to the Superintendency of Banks.
Any person wishing to acquire, directly or indirectly, 10.0% or more of the share capital of a bank must obtain the prior approval of the Superintendency of Banks. Absent such approval, the acquiror of shares so acquired will not have the right to vote. The Superintendency of Banks may only refuse to grant its approval, based on specific grounds set forth in the General Banking Law.
According to Article 35bis of the General Banking Law, the prior authorization of the Superintendency of Banks is required for:
• the merger of two or more banks;
• the acquisition of all or a substantial portion of a banks’ assets and liabilities by another bank;
• the control by the same person, or controlling group, of two or more banks; or
• a substantial increase in the existing control of a bank by a controlling shareholder of that bank.
Such prior authorization is required solely when the acquiring bank or the resulting group of banks would own a significant market share in loans, defined by the Superintendency of Banks to be more than 15.0% of all loans in the Chilean banking system. The intended purchase, merger or expansion may be denied by the Superintendency of

31
Banks; or, if the acquiring bank or resulting group would own a market share in loans determined to be more than 20.0% of all loans in the Chilean banking system, the purchase, merger, or expansion may be conditioned on one or more of the following:
• that the bank or banks maintain regulatory capital higher than 8.0% and up to 14.0% of their risk-weighted assets;
• that the technical reserve established in article 65 of the General Banking Law be applicable when deposits exceed one and a half times the resulting bank’s paid-in capital and reserves; or
• that the margin for interbank loans be reduced to 20.0% of the resulting bank’s regulatory capital.
If the acquiring bank or resulting group would own a market share in loans determined by the Superintendency of Banks to be more than 15% but less than 20%, the authorization will be conditioned on the bank or banks maintaining a regulatory capital not lower than 10% of their risks-weighted assets for the period specified by the Superintendency of Banks, which may not be less than one year. The calculation of the risk-weighted assets is based on a five-category risk classification system applied to a bank’s assets that is based on the Basel Committee recommendations.
Pursuant to the regulations of the Superintendency of Banks, the following ownership disclosures are required:
• a bank is required to inform the Superintendency of Banks of the identity of any person owning, directly or indirectly, 5.0% or more of such banks’ shares;
• holders of ADSs must disclose to the Depositary the identity of beneficial owners of ADSs registered under such holders’ names;
• the Depositary is required to notify the bank as to the identity of beneficial owners of ADSs which such Depositary has registered and the bank, in turn, is required to notify the Superintendency of Banks as to the identity of the beneficial owners of the ADSs representing 5.0% or more of such banks’ shares; and
• bank shareholders who individually hold 10.0% or more of a bank’s capital stock and who are controlling shareholders must periodically inform the Superintendency of Banks of their financial condition.
Limitations on Types of Activities
Chilean banks can only conduct those activities allowed by the General Banking Law: making loans, accepting deposits and, subject to limitations, making investments and performing financial services. Investments are restricted to real estate for the bank’s own use, gold, foreign exchange and debt securities. Through subsidiaries, banks may also engage in other specific financial service activities such as securities brokerage services, equity investments, securities, mutual fund management, investment fund management, financial advisory and leasing activities. Subject to specific limitations and the prior approval of the Superintendency of Banks and the Central Bank, Chilean banks may own majority or minority interests in foreign banks.
Since June 1, 2002, Chilean banks are allowed to offer a new checking account product that pays interest. The Superintendency of Banks also stated that these accounts may be subject to minimum balance limits and different interest rates depending on average balances held in the account and that banks may also charge fees for the use of this new product. For banks with a solvency score of less than A the Central Bank has also imposed additional caps to the interest rate that can be paid.
On June 5, 2007, pursuant to Law 20.190, new regulations became effective authorizing the banks to operate with a more full range of derivatives such as, futures, options, swaps, forwards and other derivative instruments or contracts subject to specific limitations established by the Central Bank of Chile. Previously, Banks were able to operate with derivatives, but subject to more restrictive guidelines.

32
Deposit Insurance
The Chilean government guarantees up to 90.0% of the principal amount of certain time and demand deposits and savings accounts held by natural persons with a maximum value of UF120 per person (Ch$2,354,719 or US$4,749 at December 31, 2007) per calendar year in the entire financial system.
Reserve Requirements
Deposits are subject to a reserve requirement of 9.0% for peso and foreign currency-denominated demand deposits and 3.6% for UF, peso and foreign currency-denominated time deposits (with terms of less than one year). For purposes of calculating the reserve obligation, banks are authorized to deduct daily from their foreign currency denominated liabilities, the balance in foreign currency of certain loans and financial investments held outside of Chile, the most relevant of which include:
• cash clearance account, which should be deducted from demand deposit for calculating reserve requirement;
• certain payment orders issued by pension providers;
• the amount set aside for “technical reserve” (as described below), which can be deducted from reserve requirement.
The Central Bank has statutory authority to require banks to maintain reserves of up to an average of 40.0% for demand deposits and up to 20.0% for time deposits (irrespective, in each case, of the currency in which they are denominated) to implement monetary policy. In addition, to the extent that the aggregate amount of the following types of liabilities exceeds 2.5 times the amount of a bank’s regulatory capital, a bank must maintain a 100% “technical reserve” against them: demand deposits, deposits in checking accounts, or obligations payable on sight incurred in the ordinary course of business, and in general all deposits unconditionally payable immediately.
Minimum Capital
Under the General Banking Law, a bank is required to have a minimum of UF800,000 (approximately Ch$15,698 million and US$31.6 million as of December 31, 2007) of paid-in capital and reserves, regulatory capital of at least 8% of its risk weighted assets, net of required allowances, and paid in capital and reserves of at least 3% of its total assets, net of required allowances.
Regulatory capital is defined as the aggregate of:
• a bank’s paid-in capital and reserves, excluding capital attributable to subsidiaries and foreign branches or capital básico;
• its subordinated bonds, valued at their placement price (but decreasing by 20.0% for each year during the period commencing six years prior to maturity), for an amount up to 50.0% of its basic capital; and
• its voluntary allowances for loan losses for an amount of up to 1.25% of risk weighted-assets.
Capital Adequacy Requirements
According to the General Banking Law, each bank should have regulatory capital of at least 8.0% of its risk-weighted assets, net of required allowances. The calculation of risk weighted assets is based on a five-category risk classification system for bank assets that is based on the Basel Committee recommendations. As of 2009, the third pillar of Basel II should become effective in Chile, which includes the implementation of capital limits with market risk and operational risk-weighted assets. These changes must be approved by Congress as it involves a modification to the General Banking Law.
Banks should also have capital básico, or basic capital, of at least 3.0% of their total assets, net of allowances. Basic capital is defined as a bank’s paid-in capital and reserves and is similar to Tier 1 capital except that it does not include net income for the period.
33
Starting in 2008, banks will be able to include net income for the period as basic capital, net of a 30% deduction for minimum dividends accrued.
Within the scope of Basel II in Chile, further changes in regulation may occur. See “Risk Factors—Risks Relating to Chile—Chile’s banking regulatory and capital markets environment is continually evolving and may change.”
Lending Limits
Under the General Banking Law, Chilean banks are subject to certain lending limits, including the following material limits:
• A bank may not extend to any entity or individual (or any one group of related entities), except for another financial institution, directly or indirectly, unsecured credit in an amount that exceeds 10.0% of the bank’s regulatory capital, or in an amount that exceeds 30.0% of its regulatory capital if the excess over 10.0% is secured by certain assets with a value equal to or higher than such excess. This limits were raised from 5.0% and 25.0%, respectively, in 2007 by the Reformas al Mercado de Capitales II (also known as MK2). In the case of financing infrastructure projects built by government concession the 10.0% ceiling for unsecured credits is raised to 15.0% if secured by a pledge over the concession, or if granted by two or more banks or finance companies which have executed a credit agreement with the builder or holder of the concession;
• a bank may not extend loans to another financial institution subject to the General Banking Law in an aggregate amount exceeding 30.0% of its regulatory capital;
• a bank may not directly or indirectly grant a loan whose purpose is to allow an individual or entity to acquire shares of the lender bank;
• a bank may not lend, directly or indirectly, to a director or any other person who has the power to act on behalf of the bank; and
• a bank may not grant loans to related parties (including holders of more than 1.0% of its shares) on more favorable terms than those generally offered to non-related parties. Loans granted to related parties are subject to the limitations described in the first bullet point above. In addition, the aggregate amount of loans to related parties may not exceed a bank’s regulatory capital.
In addition, the General Banking Law limits the aggregate amount of loans that a bank may grant to its employees to 1.5% of its regulatory capital, and provides that no individual employee may receive loans in excess of 10.0% of this 1.5% limit. Notwithstanding these limitations, a bank may grant to each of its employees a single residential mortgage loan for personal use once during such employee’s term of employment.
Allowance for Loan Losses
Chilean banks are required to provide to the Superintendency of Banks detailed information regarding their loan portfolio on a monthly basis. The Superintendency of Banks examines and evaluates each financial institution’s credit management process, including its compliance with the loan classification guidelines. Banks are classified into four categories: 1, 2, 3 and 4. Each bank’s category depends on the models and methods used by the bank to classify its loan portfolio, as determined by the Superintendency of Banks. Category 1 banks are those banks whose methods and models are satisfactory to the Superintendency of Banks. Category 1 banks will be entitled to continue using the same methods and models they currently have in place. A bank classified as a category 2 bank will have to maintain the minimum levels of reserves established by the Superintendency of Banks while its Board of Directors will be made aware of the problems detected by the Superintendency of Banks and required to take steps to correct them. Banks classified as categories 3 and 4 will have to maintain the minimum levels of reserves established by the Superintendency of Banks until they are authorized by the Superintendency of Banks to do otherwise. We are classified in category 1.
Under our loan classification categories loans are divided into: (i) consumer loans (including loans granted to individuals for the purpose of financing the purchase of consumer goods or payment of services); (ii) residential mortgage loans (including loans granted to individuals for the purchase, construction or improvements of residential

34
real estate, in which the value of the property covers at least 100% of the amount of the loan); and (iii) commercial loans (includes all loans other than consumer loans and residential mortgage loans). A detailed description of the models established for determining loan loss allowances s discussed in “Item 5: F. Selected Statistical Information—Classification of Loan Portfolio” and in Note 1 of our Audited Consolidated Financial Statements.
Capital Markets
Under the General Banking Law, banks in Chile may purchase, sell, place, underwrite and act as paying agents with respect to certain debt securities. Likewise, banks in Chile may place and underwrite certain equity securities. Bank subsidiaries may also engage in debt placement and dealing, equity issuance advice and securities brokerage, as well as in financial leasing, mutual fund and investment fund administration, investment advisory services and merger and acquisition services. These subsidiaries are regulated by the Superintendency of Banks and, in some cases, also by the Superintendency of Securities and Insurance, the regulator of the Chilean securities market, open-stock corporations and insurance companies.
Legal Provisions Regarding Banking Institutions with Economic Difficulties
The General Banking Law provides that if specified adverse circumstances exist at any bank, its Board of Directors must correct the situation within 30 days from the date of receipt of the relevant financial statements. If the Board of Directors is unable to do so, it must call a special shareholders’ meeting to increase the capital of the bank by the amount necessary to return the bank to financial stability. If the shareholders reject the capital increase, or if it is not effected within the term and in the manner agreed to at the meeting, or if the Superintendency of Banks does not approve the Board of Directors’ proposal, the bank will be barred from increasing its loan portfolio beyond that stated in the financial statements presented to the Board of Directors and from making any further investments in any instrument other than in instruments issued by the Central Bank. In such a case, or in the event that a bank is unable to make timely payment in respect of its obligations, or if a bank is under provisional administration of the Superintendency of Banks, the General Banking Law provides that the bank may receive a two-year term loan from another bank. The terms and conditions of such a loan must be approved by the directors of both banks, as well as by the Superintendency of Banks, but need not be submitted to the borrowing bank’s shareholders for their approval. In any event, a creditor bank cannot grant interbank loans to an insolvent bank in an amount exceeding 25.0% of the creditor bank’s regulatory capital. The Board of Directors of a bank that is unable to make timely payment of its obligations must present a reorganization plan to its creditors in order to capitalize the credits, extend their respective terms, condone debts or take other measures for the payment of the debts. If the Board of Directors of a bank submits a reorganization plan to its creditors and such arrangement is approved, all subordinated debt issued by the bank, whether or not matured, will be converted by operation of law into common stock in the amount required for the ratio of regulatory capital to risk-weighted assets not to be lower than 12.0% . If a bank fails to pay an obligation, it must notify the Superintendency of Banks, which shall determine if the bank is solvent.
Dissolution and Liquidation of Banks
The Superintendency of Banks may establish that a bank should be liquidated for the benefit of its depositors or other creditors when such bank does not have the necessary solvency to continue its operations. In such case, the Superintendency of Banks must revoke a bank’s authorization to exist and order its mandatory liquidation, subject to agreement by the Central Bank. The Superintendency of Banks must also revoke a bank’s authorization if the reorganization plan of such bank has been rejected twice. The resolution by the Superintendency of Banks must state the reason for ordering the liquidation and must name a liquidator, unless the Chilean Superintendency of Banks assumes this responsibility. When a liquidation is declared, all checking accounts and other demand deposits received in the ordinary course of business, are required to be paid by using existing funds of the bank, its deposits with the Central Bank or its investments in instruments that represent its reserves. If these funds are insufficient to pay these obligations, the liquidator may seize the rest of the bank’s assets, as needed. If necessary and in specified circumstances, the Central Bank will lend the bank the funds necessary to pay these obligations. Any such loans are preferential to any claims of other creditors of the liquidated bank.
Obligations Denominated in Foreign Currencies
Foreign currency denominated obligations of Chilean banks are subject to various limits and obligations. The regulations of the Central Bank do not permit the difference, whether positive or negative, between a bank’s assets and liabilities denominated in any foreign currency (including assets and liabilities denominated in U.S. dollars but

35
payable in pesos, as well as those denominated in pesos and indexed to the U.S. dollar exchange rate) to exceed 20% of the bank’s paid-in capital and reserves; except in the case where the balance of such assets exceeds the balance of such liabilities and the excess difference does not exceed the bank’s allowances and reserves denominated in such foreign currency (excluding profits to be remitted abroad). Santander-Chile must also comply with various regulatory and internal limits regarding exposure to movements in foreign exchange rates (See “Item 11: Quantitative and Qualitative Disclosures About Market Risks”).
Investments in Foreign Securities
Under current Chilean banking regulations, banks in Chile may grant loans to foreign individuals and entities and invest in certain securities of foreign issuers. Chilean banks may only invest in equity securities of foreign banks and certain other foreign companies which may be affiliates of the bank or which would be complementary to the bank’s business if such companies were incorporated in Chile. Banks in Chile may also invest in debt securities traded in formal secondary markets. Such debt securities must be (1) securities issued or guaranteed by foreign sovereign states or their central banks or other foreign or international financial entities, and (2) bonds issued by foreign companies. A Bank may invest up to 5% of its regulatory capital in securities of foreign issuers. Such securities must have a minimum rating as follows.
Table 1
Rating Agency Short Term Long Term Moody’s ...................................................................................... P2 Baa3 Standard and Poor’s .................................................................... A3 BBB- Fitch IBCA.................................................................................. F2 BBB- Duff & Phelps ............................................................................. D2 BBB- Thomson Bank Watch................................................................. TBW2 BBB
In the event that the sum of the investments in foreign securities which have a: (i) rating below that indicated in
Table 1 above, and equal or exceeds the ratings mentioned in the Table 2 below; and (ii) loans granted to other entities resident abroad exceed 20% (and 30% for banks with a BIS ratio equal or exceeding 10%), of the regulatory capital of such bank, the excess is subject to a mandatory reserve of 100%.
Table 2
Rating Agency Short Term Long Term Moody’s....................................................................................... P2 Ba3 Standard and Poor’s ..................................................................... A3 BB- Fitch IBCA .................................................................................. F2 BB- Duff & Phelps .............................................................................. D2 BB- Thomson Bank Watch ................................................................. TBW2 B
In addition, banks may invest in foreign securities for an additional amount equal to a 70% of their regulatory
capital which ratings are equal or exceeds those mentioned in the following Table 3. This limit constitutes an additional margin and it is not subject to the 100% mandatory reserve.
Additionally, a Chilean Bank may invest in foreign securities whose rating is equal or exceeds those mentioned in the following Table 3 in: (i) term deposits with foreign banks; and (ii) securities issued or guaranteed by sovereign states or their central banks or those securities issued or guaranteed by foreign entities within the Chilean State; such investment will be subject to the limits by issuer up to 30% and 50%, respectively, of the regulatory capital of the Chilean bank that makes the investment.
Table 3
Rating Agency Short Term Long Term Moody’s ...................................................................................... P1 Aa3 Standard and Poor’s..................................................................... A1+ AA- Fitch IBCA .................................................................................. F1+ AA- Duff & Phelps.............................................................................. D1+ AA- Thomson Bank Watch ................................................................. TBW1 BB

36
Chilean banks may invest in securities without ratings issued or guaranteed by sovereign states or their central
banks and structured notes issued by investment banks with a rating equal or above that in the immediately preceding Table 3, which return is linked with a corporate or sovereign note with a rating equal or above that in Table 2.
Subject to specific conditions, a bank may grant loans in U.S. dollars to subsidiaries or branches of Chilean companies located abroad, to companies listed on foreign stock exchanges authorized by the Central Bank and, in general, to individuals and entities domiciled abroad, as long as the Central Bank is kept informed of such activities.
New Regulations Regarding Market Risk
In 2005, the Superintendency of Banks introduced new market risk limits and measures for Chilean banks. On an unconsolidated basis the Bank must separate its balance sheet into two separate categories: trading portfolio (Libro de Negociación) and non-trading, or permanent, portfolio (Libro de Banca). The trading portfolio as defined by the Superintendency of Banks includes all instruments that are valued for accounting purposes at market prices, free of any restrictions or immediate sale and frequently bought and sold by the Bank or maintained with the intention of selling them in the short-term in order to profit from short-term price variations. The non-trading portfolio is defined as all instruments in the balance sheet not considered in the trading portfolio (See Item 11: Quantitative and Qualitative Disclosure about Market Risk—Market Risk).
U.S. Anti-Money Laundering, Anti-Terrorist Financing, and Foreign Corrupt Practices Act Regulations
The Bank, as a foreign private issuer whose securities are registered under the Exchange Act, is subject to the U.S. Foreign Corrupt Practices Act (“FCPA Act”). The FCPA Act generally prohibits such issuers and their directors, officers, employees and agents from using any means or instrumentality of U.S. interstate commerce in furtherance of any offer or payment of money to any foreign official or political party for the purpose of influencing a decision of such person in order to obtain or retain business. It also requires that the issuer maintain books and records and a system of internal accounting controls sufficient to provide reasonable assurance that accountability of assets is maintained and accurate financial statements can be prepared. Penalties, fines and imprisonment can be imposed for violations of the FCPA Act.
Furthermore, the Bank is subject to a variety of U.S. anti-money laundering and anti-terrorist financing laws and regulations, such as the Bank Secrecy Act of 1970, as amended, and the USA PATRIOT ACT of 2001, as amended, and a violation of such laws and regulations may result in substantial penalties, fines and imprisonment.
E. Property, Plants and Equipment
We are domiciled in Chile and own our principal executive offices located at Bandera 140, Santiago, Chile. We also own nine other buildings in the vicinity of our headquarters and we rent seven other buildings. At December 31, 2007, we owned the locations at which 43% of our branches were located. The remaining branches operate at rented locations. We believe that our existing physical facilities are adequate for our needs.
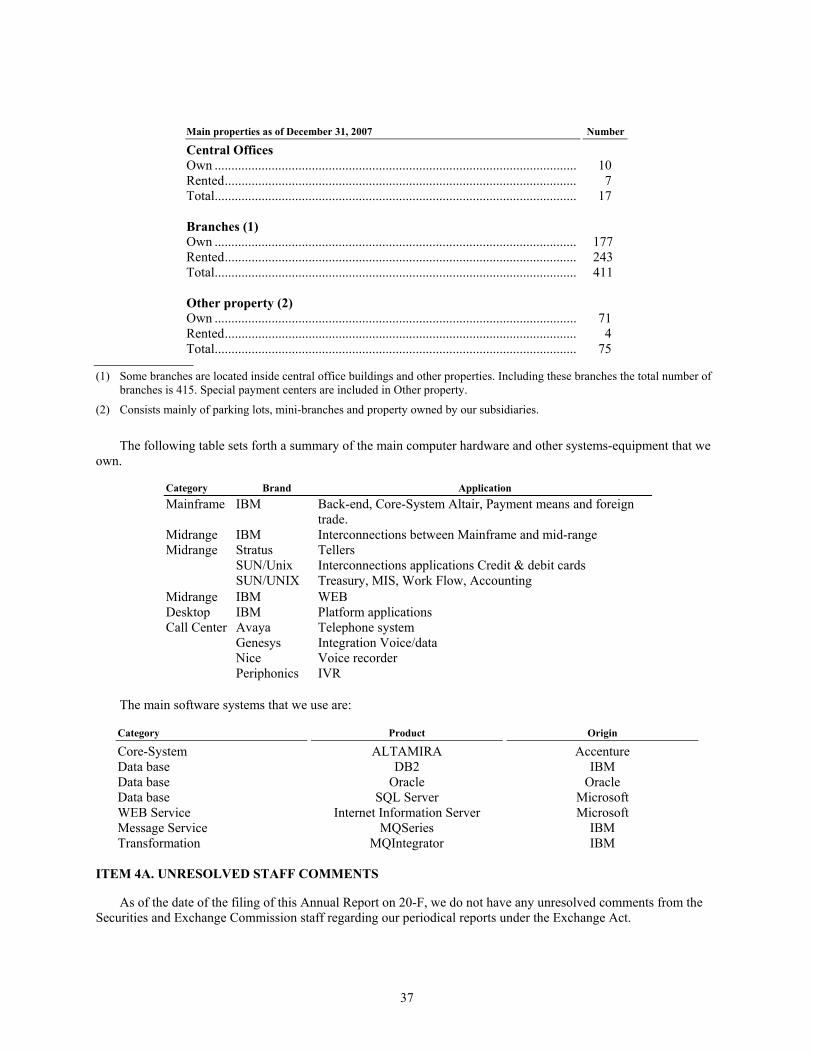
37
Main properties as of December 31, 2007 Number
Central Offices Own ............................................................................................................ 10 Rented......................................................................................................... 7 Total............................................................................................................ 17 Branches (1) Own ............................................................................................................ 177 Rented......................................................................................................... 243 Total............................................................................................................ 411 Other property (2) Own ............................................................................................................ 71 Rented......................................................................................................... 4 Total............................................................................................................ 75
(1) Some branches are located inside central office buildings and other properties. Including these branches the total number of branches is 415. Special payment centers are included in Other property.
(2) Consists mainly of parking lots, mini-branches and property owned by our subsidiaries.
The following table sets forth a summary of the main computer hardware and other systems-equipment that we
own.
Category Brand Application Mainframe IBM Back-end, Core-System Altair, Payment means and foreign
trade. Midrange IBM Interconnections between Mainframe and mid-range Midrange Stratus
SUN/Unix SUN/UNIX
Tellers Interconnections applications Credit & debit cards Treasury, MIS, Work Flow, Accounting
Midrange IBM WEB Desktop IBM Platform applications Call Center Avaya
Genesys Nice Periphonics
Telephone system Integration Voice/data Voice recorder IVR
The main software systems that we use are:
Category Product Origin
Core-System ALTAMIRA Accenture Data base DB2 IBM Data base Oracle Oracle Data base SQL Server Microsoft WEB Service Internet Information Server Microsoft Message Service MQSeries IBM Transformation MQIntegrator IBM
ITEM 4A. UNRESOLVED STAFF COMMENTS
As of the date of the filing of this Annual Report on 20-F, we do not have any unresolved comments from the Securities and Exchange Commission staff regarding our periodical reports under the Exchange Act.

38
ITEM 5. OPERATING AND FINANCIAL REVIEW AND PROSPECTS
A. Accounting Standards for Financial Investments and Derivatives
In accordance with Circular No. 3345 issued by the Superintendency of Banks, which became effective on June 30, 2006, the accounting standards for valuing financial instruments acquired for trading or investment purposes, including derivative instruments on the balance sheets, were amended. The new accounting standards require that these instruments be carried at their market or fair value, and the historical differences in valuation of such instruments recognized with respect to any dates prior to 2006 be adjusted directly against the Bank’s equity.
The following table summarizes the primary changes to the accounting standards as a result of our implementation of Circular No. 3345.
Before changes to accounting principles
After changes to accounting principles
• foreign exchange forward contracts
• valued at closing spot exchange rate, initial discount/premium amortized over the life of contract
• forward contracts between U.S. dollars and Ch$/UF
• valued at closing spot exchange rate, initial discount/premium amortized over the life of contract
Derivatives
• interest rate swaps • difference between interest income/expense recorded in net income in the period when agreement is settled in cash;
• fair value and revaluation gains or losses are not recognized
• net nominal amounts are recorded under “other assets” or “other liabilities”
recognized at fair value; trading contracts:
• recorded at market/fair value on the balance sheet
• revaluation gains or losses recorded as gains or losses from trading activities
hedge contracts: • fair value hedges: hedged
assets and liabilities are also recognized at fair value; revaluation gains or losses on both derivatives and hedged items are recognized as “gains/losses from trading activities” on the income statement
• cash flow hedges: effective portion of revaluation gains or losses on hedged risk recognized in shareholders’ equity (such amount is recognized in income statement when the offsetting changes hedged affect income statement); ineffective portion of revaluation gains or losses recognized in income statement

39
Before changes to accounting principles
After changes to accounting principles
• non-permanent investments (Trading instruments)
• recognized at fair value on balance sheet; revaluation gains or losses and realized gains or losses are recognized in income statements under “gains/losses from trading activities”; interest income and indexation adjustments are reported as “interest revenue”
• No changes
• permanent investments (Available-for-Sale investment instruments)
• line item “available-for-sale” portfolio changed from “permanent”
Other financial investments
• recognized at fair value on balance sheet; revaluation gains or losses are reported under shareholders’ equity, and recognized in income statement under “gains/losses from trading activities” when sold or impaired
• Held-to-maturity investment instruments
• N/A • New category; recorded at cost plus accrued interest and adjustments, less allowance for impairment
The net effect of the accounting changes on our net income for the year ended December 31, 2006, was a gain
of Ch$13,516 million. For comparison purposes, we have also retrospectively reclassified these items for the years ended December 31, 2004 and 2005, but did not retrospectively apply the new accounting standards to these items. As a result, our results of operations and financial condition at and for the year ended December 31, 2006 and 2007, are not entirely comparable to those at any prior periods reported by us.
In connection with our implementation of the new accounting standards, for the year ended December 31, 2006 and 2007, interest revenue and interest expense no longer include the translation gain or loss of financial assets and liabilities indexed to foreign currencies. Such gain or loss is now classified as results of foreign exchange transactions. Amounts reported for the years ended December 31, 2004 and 2005, have been reclassified on a comparable basis. Gains or losses on investments in mutual funds have also been reclassified from net interest income to other operating income as a part of these new accounting standards. For the years ended December 31, 2004 and 2005, this line item has also been reclassified.
For the year ended December 31, 2006 and 2007, gains and losses on forward transactions have been classified as net gains (losses) on trading activities. In prior periods, such transactions were not marked to market and the difference between the interest paid and received on a specified notional amount was recorded under “foreign exchange transactions, net”. Such amounts for the years ended December 31, 2004 and 2005, have been reclassified to net gains (losses) on trading activities in order to be more comparable to the results for the year ended December 31, 2006 and 2007, but have not been retroactively adjusted to reflect the fair value of these instruments.
B. Critical Accounting Policies
We prepare our financial statements in accordance with Chilean GAAP, which requires management to make estimates and assumptions with respect to certain matters that are inherently uncertain. We also reconcile our financial statements to U.S. GAAP (see Note 28 to our Audited Consolidated Financial Statements) and are required to make estimates and assumptions in this reconciliation process. Certain critical accounting policies, in particular those relating to goodwill and intangible assets, are only applicable for U.S. GAAP purposes. Our consolidated financial statements include various estimates and assumptions, including but not limited to the adequacy of the allowance for loan losses, estimates of the fair value of certain financial instruments, the selection of useful lives of

40
certain assets and the valuation and recoverability of goodwill. We evaluate these estimates and assumptions on an ongoing basis. Management bases its estimates and assumptions on historical experience and on various other factors that are believed to be reasonable under the circumstances. Actual results in future periods could differ from those estimates and assumptions, and if these differences were significant enough, our reported results of operations would be affected materially.
We believe that the following are the more critical judgment areas or involve a higher degree of complexity in the application of the accounting policies that currently affect our financial condition and results of operations.
Derivative activities
At December 31, 2006 and 2007, derivatives are valued at market price on the balance sheet and the net unrealized gain (loss) on derivatives is classified as a separate line item on the income statement. In prior periods, the notional amounts were carried off the balance sheet. Our derivative holdings at December 31, 2005, have been reclassified from “other assets” and “other liabilities” to “derivatives”, but have not been marked to market as would be required under currently applicable accounting principles.
Pursuant to the new accounting standards, banks must mark to market derivatives. A derivative financial instrument held for trading purposes must be marked to market and the unrealized gain or loss recognized in the income statement. New accounting standards have also been adopted for derivatives held for hedging purposes with effect for the six months ended June 30, 2006, and thereafter, changes in book value of hedged items are included in the mark-to-market and trading line items, except to the extent set forth below.
The Superintendency of Banks recognizes three kinds of hedge accounting: (i) cash flow hedges, (ii) fair value hedges and (iii) hedging of foreign investments.
• When a cash flow hedge exists, the fair value movements on the part of the hedging instrument that is effective are recognized in equity. Any ineffective portion of the fair value movement on the hedging instrument is recognized in the income statement.
• When a fair value hedge exists, the fair value movements on the hedging instrument and the corresponding fair value movements on the hedged item are recognized in the income statement. Hedged items in the balance sheet are presented at their market value in 2006.
• When a hedge of foreign investment exposure exists (i.e. investment in a foreign branch), the fair value movements on the part of the hedging instrument that is effective are recognized in equity. Any ineffective portion of the fair value movement on the hedging instrument is recognized in the income statement.
We enter into forward contracts for our own account and for the accounts of our customers. The values of the forward contracts are marked to market on a monthly basis and the revaluation gain or loss is recognized in the line item mark-to-market and trading activities. Previously, they were classified as foreign exchange transactions, except gains or losses on UF/Ch$ forwards, which were classified as net interest income.
Allowance for loan losses
Chilean banks are required to maintain loan loss allowances in amounts determined in accordance with the regulations issued by the Superintendency of Banks. Under these regulations, we must classify our portfolio into various categories of payment capability. The minimum amount of required loan loss allowances is determined based on fixed percentages of estimated loan losses assigned to each category. As of January 1, 2006, we have improved our credit scoring systems for consumer and mortgage loans. The new credit scoring system considers both the length of time by which the loan is overdue and the borrower’s risk profile, which includes the borrower’s overall indebtedness and credit behavior under the obligations to third parties. (See “Item 5: F. Selected Statistical Information—Loan Portfolio—Classification of Loan Portfolio.”
In 2006, we improved our internal provisioning models by not only focusing on non-performance, but introducing statistical models that take into account a borrower’s credit history and indebtedness levels. Group ratings that determine loan loss allowances based only on non-performance are being phased out and replaced by statistical scoring systems. Commencing in December 2006, we no longer analyze large commercial loans on a group basis. All large commercial loans have since been rated on an individual basis. For large commercial loans,
41
leasing and factoring, we assign a risk category level to each borrower and his respective loans. We consider the following risk factors in classifying a borrower’s risk category: (i) the borrower’s industry or sector, (ii) owners or managers, (iii) financial condition, (iv) payment ability and (v) payment behavior. Further improvements were made in 2007, mainly the back testing period used in determining a client’s risk profile was expanded from 12 to 21 months. For a detailed description of the models we use to determine loan loss allowances for commercial loans. See “Item 5: F. Selected Statistical Information—Loan Portfolio—Classification of Loan Portfolio—Allowances for large commercial loans.” Group assessment for loan loss allowances is permitted for a large number of borrowers whose individual loan amounts are relatively insignificant. Currently, we use group analysis to determine loan loss allowances for certain types of loans, such as loans to small- and mid-sized companies and commercial loans to individuals. (See “Item 5: F. Selected Statistical Information—Loan Portfolio—Classification of Loan Portfolio—Allowances for group evaluations on small- and mid-sized commercial loans.”)
Goodwill and Intangible Assets with Indefinite Useful Lives
Under U.S. GAAP, we have significant intangible assets consisting of goodwill and trademarks. We record all assets and liabilities acquired in purchase acquisitions, including goodwill and other acquired intangibles, at their fair value. These include amounts pushed down from Santander Chile Holding, S.A. and Teatinos Siglo XXI, S.A., each a direct or indirect subsidiary of Banco Santander Spain, and, together, our majority shareholders. In 2006, we decided to change our branding strategy to increasing the use of the brand “Santander” and phasing out the brand “Santiago” in a 5 year period. In 2007 we completed the phasing out of the “Santiago” brand ahead of schedule in accordance with policy set by our parent company in 2007 regarding the Santander brand worldwide. As a result, we have decided to fully amortize the brand “Santiago” in 2007.
Goodwill and indefinite lived assets are no longer amortized over their estimated useful lives using straight line and accelerated methods, and are subject to at least an annual impairment review. The initial goodwill and intangibles recorded and subsequent impairment analysis requires management to make subjective judgments concerning estimates of how the acquired asset will perform in the future using a discounted cash flow analysis. Additionally, estimated cash flows may extend beyond ten years and, by their nature, are difficult to determine. Events and factors that may significantly affect the estimates include, among others, competitive forces, customer behavior and attrition, changes in revenue growth trends, cost structures and technology and changes in interest rates and specific industry or market sector conditions. For a further discussion of accounting practices for goodwill and intangible assets with indefinite useful lives under U.S. GAAP. See Note 28 to our Audited Consolidated Financial Statements.
Differences between Chilean and United States Generally Accepted Accounting Principles
Accounting principles generally accepted in Chile vary in certain important respects from the accounting principles generally accepted in the United States. Such differences involve certain methods for measuring the amounts shown in the consolidated financial statements, as well as additional disclosures required by accounting principles generally accepted in the United States and the accounting treatment of the merger.
Note 28 to our Audited Consolidated Financial Statements presents a description of the significant differences between Chilean GAAP and U.S. GAAP. Note 28(ad) sets forth recent accounting pronouncements under U.S. GAAP.
C. Operating Results
Chilean Economy
All of our operations and substantially all of our customers are located in Chile. Accordingly, our financial condition and results of operations are substantially dependent upon economic conditions prevailing in Chile. In 2007, Chile’s GDP growth accelerated to 5.1% compared to 4.0% in 2006. The strength of the global economy in 2007 continued to benefit Chile’s economy despite the rise in international oil prices. The export sector’s GDP increased by 9.2% in 2007. Exports totaled US$43.9 billion and increased 23.5%. This positive external scenario has also led to strong growth of internal consumption and investment demand that grew 7.8% in 2007 and 6.0% in 2006. The average unemployment rate decreased to 7.5% in 2007 compared to 8.0% in 2006 and 9.3% in 2005. GDP growth in 2007 was hampered by the rising costs of energy due to higher oil prices, the restraints to energy supply provoked by a strong drought and the virtual elimination of gas exports from Argentina which has led to a strong

42
rise in electricity production costs, especially in the second half of 2007. The chart below graphs GDP growth by sector.
GDP growth in 2007 by Sector
Source: Banco Central de Chile
CPI Inflation in 2007 spiked upward reaching 7.8% compared to 2.6% in 2006 and 3.7% in 2005. The strong rise in international oil prices and the impact on utility prices and staple goods caused by the prolonged drought, explain this rise in inflation. As a result, the Central Bank accelerated the pace of interest rate increases in the past year. The overnight interbank rate set by the Central Bank as of June 2008 was set at 6.75%, 150 basis points higher than the rate at year-end 2006. This rise in interest rates also led to a 2.1% appreciation of the Chilean peso against the U.S. dollar. Long-term real interest rates on the other hand descended in 2007. The yield on the Chilean Central Bank’s 10-year note in real terms was 2.98% compared to 3.02% as of December 31, 2006. This trend also reversed in 2008 as inflation increased yields on long-term notes have risen significantly. The real yield on Chilean 10 year notes increased from 2.98% at December 31, 2007 to 3.40% as of June 11, 2008.
Despite these developments in 2007 at the macroeconomic level, economic activities in Chile may slow down in 2008 given the volatility of international markets and the possible slow down of the world economic growth given the possible recession that may affect the U.S. economy. GDP growth in 2008 in Chile is expected to slowdown to approximately 4% as a result of higher energy costs, a slow down in the global economy as a result of the credit crisis and the higher interest rate environment due to higher inflation.
Impact of Inflation
Inflation impacts our results of operations. High levels of inflation in Chile could adversely affect the Chilean economy and have an adverse effect on our business, financial condition and results of operations. Negative inflation rates also negatively impact our results. In 2007, the inflation rate in Chile was 7.8% compared to 2.6% in 2006 and 3.7% in 2005. There can be no assurance that Chilean inflation will not change significantly from the current level. Although we currently benefit from moderate levels of inflation in Chile, due to the current structure of our assets and liabilities (i.e., a significant portion of our loans are indexed to the inflation rate, but there are no corresponding features in deposits or other funding sources that would increase the size of our funding base), there can be no assurance that our business, financial condition and result of operations in the future will not be adversely affected by changing levels of inflation. In summary:
• UF-denominated assets and liabilities. Our assets and liabilities are denominated in Chilean pesos, UF and foreign currencies. The UF is revalued in monthly cycles. On each day in the period beginning the tenth day of the current month through the ninth day of the succeeding month, the nominal peso value of the UF is indexed up (or down in the event of deflation) in order to reflect a proportional amount of the change in

43
the Chilean Consumer Price Index during the prior calendar month. One UF equaled to Ch$17,974.81 at December 31, 2005, Ch$18,336.38 at December 31, 2006, and Ch$19,622.66 at December 31, 2007. The effect of any changes in the nominal peso value of our UF-denominated assets and liabilities is reflected in our results of operations as an increase (or decrease, in the event of deflation) in interest revenue and expense, respectively. Our net interest revenue will be positively affected by an inflationary environment to the extent that our average UF-denominated assets exceed our average UF-denominated liabilities. Our net interest revenue will be negatively affected by inflation in any period in which our average UF-denominated liabilities exceed our average UF-denominated assets. Our average UF-denominated assets exceeded our average UF-denominated liabilities by Ch$2,871,535 million in 2007 compared to Ch$2,758,228 million in 2006. See “Item 5: F. Selected Statistical Information—Average Balance Sheets, Income Earned from Interest-Earning Assets And Interest Paid on Interest Bearing Liabilities.” In general, the Bank has more UF-denominated financial assets than UF-denominated financial liabilities. In the year ended December 31, 2007, the interest gained on interest earning assets denominated in UF increased 71.5% compared to 2006 as a result of the higher inflation rates in 2007 and 2006 and the larger amount of assets over liabilities denominated in UFs. The interest paid on these liabilities increased by 130.4% during this period.
• Price level restatement. Chilean GAAP requires that financial statements be restated to reflect the full effects of loss in the purchasing power of the Chilean peso on the financial position and results of operations of reporting entities. The Bank must adjust its capital, fixed assets and other non financial assets for variations in price levels. Since the Bank’s capital is generally larger than the sum of fixed and other non financial assets, in an inflationary economy, the Bank would record a loss from price level restatement. For the year ended December 31, 2007, the loss from price level restatement totaled Ch$56,325 million compared to Ch$14,807 million in 2006. The inflation rate used for calculating price level restatement was 7.44% in 2007 and 2.12% in 2006.
• Inflation hedge. A key component of our asset and liability policy is the management of interest rate risk. The Bank’s assets generally have a longer maturity than our liabilities. As the Bank’s mortgage portfolio grows, the maturity gap tends to rise as these loans, which are denominated in UF, have a longer maturity than the average maturity of our funding base. As most of long term financial instruments and mortgage loans are denominated in UF and most deposits in nominal pesos, the increase in mortgage lending increments the Bank’s exposure to inflation and to interest rate risk. The size of this gap is limited by internal and regulatory guidelines in order to avoid excessive potential losses due to strong shifts in interest rates (see “Item 11: Quantitative and Qualitative Disclosures About Market Risk”). In order to keep this duration gap below regulatory limits the Bank issues long term bonds denominated in UF or interest rate swaps. The financial cost of the bonds is recorded as interest expense, but the financial cost of these swaps is included in the net results from trading and marks to market. In 2007, the financial cost of the swaps taken in order to hedge for inflation and interest rate risk totaled Ch$42,465 million compared to Ch$12,899 million in 2006. This higher cost was a direct result of the higher inflation rate in these two periods.
At December 31, Inflation sensitive income 2006 2007 % Change (In million of constant Chilean pesos at
December 31, 2007) Interest gained on UF assets.......... 468,001 802,579 71.5% Interest paid on UF liabilities ........ (191,746) (441,703) 130.4% Inflation/ interest rate risk hedge (12,899) (42,465) 229.2% Price level restatement .................. (14,807) (56,325) 280.4% Net Gain ........................................ 248,549 262,086 5.4%
• Peso denominated assets and liabilities. Interest rates prevailing in Chile during any period primarily reflect the inflation rate during the period and the expectations of future inflation. The sensitivity of our peso denominated interest earning assets and interest bearing liabilities to changes to such prevailing rates varies. (See “Item 5: C. Operating Results—Interest Rates”). We maintain a substantial amount of non interest bearing peso denominated demand deposits. Because such deposits are not sensitive to inflation, any decline in the rate of inflation would adversely affect our net interest margin on inflation indexed assets

44
funded with such deposits, and any increase in the rate of inflation would increase the net interest margin on such assets. (See “Item 11: Quantitative and Qualitative Disclosures About Market Risk”). The ratio of the average of such demand deposits to average interest-earning assets was 16.4%, 13.9% and 15.3% for the years ended December 31, 2005, 2006 and 2007, respectively.
Interest Rates
Interest rates earned and paid on our assets and liabilities reflect, to a certain degree, inflation, expectations regarding inflation, changes in short term interest rates set by the Central Bank and movements in long term real rates. The Central Bank manages short term interest rates based on its objectives of balancing low inflation and economic growth. Because our liabilities generally reprice sooner than our assets, changes in the rate of inflation or short term rates in the economy are reflected in the rates of interest paid by us on our liabilities before such changes are reflected in the rates of interest earned by us on our assets. Therefore, when short term interest rates fall, our net interest margin is positively impacted, but when short term rates increase, our interest margin is negatively affected. At the same time, our net interest margin tends to be adversely affected in the short term by a decrease in inflation rates since generally our UF-denominated assets exceed our UF-denominated liabilities. (See “Item 5: C. Operating Results—Impact of Inflation—Peso-denominated Assets and Liabilities”). An increase in long term rates has a positive effect on our net interest margin, because our interest earning assets generally have longer tenors than our interest bearing liabilities. In addition, because our peso denominated liabilities have relatively short repricing periods, they are generally more responsive to changes in inflation or short term rates than our UF-denominated liabilities. As a result, during periods when current inflation or expected inflation exceeds the previous period’s inflation, customers often switch funds from UF-denominated deposits to peso denominated deposits, which generally bear higher interest rates, thereby adversely affecting our net interest margin.
Foreign Exchange Fluctuations
The Chilean government’s economic policies and any future changes in the value of the Chilean peso against the U.S. dollar could adversely affect our financial condition and results of operations. The Chilean peso has been subject to significant devaluation in the past and may be subject to significant fluctuations in the future. In 2005, the Chilean peso appreciated by 8.1% against the dollar. In 2006, the Chilean peso depreciated by 3.9% against the U.S. dollar and in 2007 the peso appreciated 7.2% against the U.S. dollar. (See “Item 3: A. Selected Financial Data—Exchange Rates”). A significant portion of our assets and liabilities are denominated in foreign currencies, principally the U.S. dollar, and we historically have maintained and may continue to maintain material gaps between the balances of such assets and liabilities. Because such assets and liabilities, as well as interest earned or paid on such assets and liabilities, and gains and losses realized upon the sale of such assets, are translated to Chilean pesos in preparing our financial statements, our reported income is affected by changes in the value of the Chilean peso relative to foreign currencies (principally the U.S. dollar).
Foreign currencies denominated obligations of Chilean banks are subject to various limits and obligations. The regulations of the Central Bank do not permit the difference, whether positive or negative, between a bank’s assets and liabilities denominated in any foreign currency (including assets and liabilities denominated in U.S. dollars but payable in Chilean pesos, as well as those denominated in Chilean pesos and indexed to the U.S. dollar exchange rate) to exceed 20% of the Bank’s paid in capital and reserves; except in the case where the balance of such assets exceeds the balance of such liabilities and the excess difference does not exceed the Bank’s allowances and reserves denominated in such foreign currency (excluding profits to be remitted abroad). The Bank also uses a sensitivity analysis to limit the potential loss in net interest income resulting from fluctuations of interest rates on U.S. dollar denominated assets and liabilities and a VaR model to limit foreign currency trading risk (see “Item 11: Quantitative and Qualitative Disclosures About Market Risk”).
Results of Operations for the Years Ended December 31, 2005, 2006 and 2007
The following discussion is based upon and should be read in conjunction with the Audited Consolidated Financial Statements. The Audited Consolidated Financial Statements have been prepared in accordance with Chilean GAAP (including the rules of the Superintendency of Banks relating thereto), which differ in certain significant respects from U.S. GAAP. Note 26 to the Audited Consolidated Financial Statements describes the principal differences between Chilean GAAP and U.S. GAAP and includes a reconciliation to U.S. GAAP of our net income for the years ended December 31, 2005, 2006 and 2007, and of our shareholders’ equity at December 31,

45
2006 and 2007. The Audited Consolidated Financial Statements have been restated in constant Chilean pesos of December 31, 2007. See Note 1(c) to the Audited Consolidated Financial Statements.
Introduction
The following table sets forth the principal components of our net income for the years ended December 31, 2005, 2006 and 2007.
For the year ended December 31, % Change
2005 2006 2007 2007 2005/2006 2006/2007
(in millions of constant Ch$ as of
December 31, 2007) (in ths.
of US$)(1) CONSOLIDATED INCOME
STATEMENT DATA Chilean GAAP: Interest income and expense
Interest revenue..................................... 1,093,557 1,255,814 1,665,527 3,345,910 14.8% 32.6% Interest expense .................................... (493,756) (598,008) (839,911) (1,687,314) 21.1% 40.5%
Net interest revenue ...................... 599,801 657,806 825,616 1,658,596 9.7% 25.5% Provision for loan losses ............................. (69,706) (132,175) (182,411) (366,449) 89.6% 38.0% Fees and income from services
Fees and other services income ............ 186,286 213,081 237,927 477,976 14.4% 11.7% Other services expense ......................... (34,473) (38,438) (45,002) (90,405) 11.5% 17.1%
Total fees and income from services, net .............................. 151,813 174,643 192,925 387,571 15.0% 10.5%
Other operating income, net Net gain (loss) from trading and
brokerage.......................................... (67,224) 107,775 (126,738) (254,606) —% —%Foreign exchange transactions, net ....... 77,766 (52,332) 92,425 185,674 —% —%Others, net............................................. (25,148) (35,413) (45,413) (91,231) 40.8% 28.2%
Total other operating income, net............................................. (14,606) 20,030 (79,726) (160,163) —% —%
Other income and expenses Non-operating income, net ................... (24,152) (4,528) 9,799 19,686 (81.3%) —%Income attributable to investments
in other companies ........................... 745 844 (1,321) (2,654) 13.3% —%Losses attributable to minority
interest.............................................. (146) (162) (2,055) (4,128) 11.0% 1,168.5% Total other income and
expenses ................................... (23,553) (3,846) 6,423 12,904 (83.7%) —%Operating expenses
Personnel salaries and expenses............ (152,749) (171,605) (176,095) (353,761) 12.3% 2.6% Administrative and other expenses ....... (110,359) (119,202) (121,546) (244,177) 8.0% 2.0% Depreciation and amortization.............. (43,062) (41,486) (45,043) (90,488) (3.7%) 8.6% Total operating expenses (306,170) (332,293) (342,684) (688,426) 8.5% 3.1%
Loss from price-level restatement (19,902) (14,807) (56,325) (113,152) (25.6%) 280.4% Income before income taxes ....................... 317,677 369,358 363,818 730,881 16.3% (1.5%)Income taxes................................................ (54,671) (62,529) (55,171) (110,834) 14.4% (11.8%)Net income................................................... 263,006 306,829 308,647 620,047 16.7% 0.6%
(1) Amounts stated in U.S. dollars at and for the year ended December 31, 2007, have been translated from Chilean pesos at the exchange rate of Ch$497.78 = US$1.00 as of December 31, 2007. See “Item 3: A. Selected Financial Data—Exchange Rates” for more information on exchange rate.
2007 and 2006. Net income for the year ended December 31, 2007, increased by 0.6% to Ch$308,647 million
compared to Ch$306,829 million for the year ended December 31, 2006. Our net interest income increased by 25.5% to Ch$825,616 million for the year ended December 31, 2007, compared to 2006, and fee income grew by 10.5% to Ch$192,925 million in 2007 compared to 2006. Net interest revenue growth was led by an increase in net interest revenue from our retail banking and middle-market segments, the improved funding mix and the higher

46
inflation rate in 2007 compared to 2006. The average balance of our interest-earning assets increased by 1.0% in 2007 compared to 2006. Our net interest margin increased 110 basis points to 5.8% compared to 4.7% in 2006.
These results were partially offset by a 38.0% increase in provision for loan losses which was mainly due to loan growth in higher yielding, but riskier retail segments. At the same time the Bank continued to improve its provisioning model for consumer loans. Specifically, in 2007 the Bank lengthened the time period used for statistically determining the risk level of consumer loans from 12 to 21 months of history. As a result, in 2007 the Bank recognized a one-time provision expense of Ch$14,444 million. Increased gross provisions for loan losses were partially offset by a 53.8% rise in loan loss recoveries which was mainly driven by the gains recorded from two large sales of charged-off loans performed in 2007. These sales totaled an extraordinary gain of Ch$23,517 million in 2007.
Furthermore, total other operating income in 2007 totaled a loss of Ch$79,726 million compared to a gain of Ch$20,030 million in 2006. This loss was mainly due to a 30.1% rise in other operating losses resulting from higher sales force and client expenses. At the same time, the results from trading and mark-to-market totaled a loss of Ch$34,313 million compared to a gain of Ch$55,443 million in 2006. This was mainly due to a loss of Ch$42,465 million from inflation hedging which partially offsets the higher gain from net interest revenue due to the positive impact of higher inflation rates.
Operating expenses increased 3.1% in 2007 and the efficiency ratio improved to 36.5% in 2007 from 39.0% in 2006. In 2006, operating expenses include a one-time expense of Ch$9,263 million as a result of our payment of an end of negotiation bonus in conjunction with the signing of the new collective bargaining agreement in the fourth quarter of 2006. Excluding this item, operating expenses increased 6.1% driven by the increase in the Bank’s headcount, client base and distribution network.
Non-operating income totaled a gain of Ch$6,423 million compared to a loss of Ch$3,846 million. This better result was mainly due to lower level of provisions for other contingencies and a decrease in charge-offs of repossessed assets.
Income tax expenses declined 11.8% in 2007 compared to 2006 as a result of increased tax deferrals.
Finally, the loss from price level restatement increased 280.4% to Ch$56,325 million due to the higher inflation rate in 2007 compared to 2006.
2006 and 2005. Net income for the year ended December 31, 2006, increased by 16.7% compared to the year ended December 31, 2005, primarily reflecting the growth of the Chilean economy, which continued to fuel loan growth and banking activities, especially in the higher yielding retail banking segments, which in turn has led to the growth of our net interest revenue and fee income. Our net interest revenue increased by 9.7% and fee income grew by 15.0% in 2006 compared to 2005. Net interest revenue growth was led by an increase in net interest revenue from our retail banking and middle-market segments. Net interest revenue from the retail banking segment increased by 24.2% in 2006 compared to 2005. The average balance of our interest-earning assets increased by 10.6% in 2006 compared to 2005. As a result, our net interest margin remained stable at 4.7% in 2006 compared to 2005. Total net fee income increased by 15.0% for the year ended December 31, 2006, compared to 2005. Fees from the retail banking segment increased by 38.8% in 2006 compared to 2005, mainly due to increases in fees from checking accounts, lines of credit and insurance brokerage and credit card fees.
The increases in net interest revenue and fee income were partially offset by an 89.6% increase in provisions for loan losses for the year ended December 31, 2006, compared to 2005, primarily due to an 80.3% increase in net provision expense in the retail banking segment.
Operating expenses in 2006 increased by 8.5% compared to 2005, which was primarily due to a 12.3% rise in personnel salaries and expenses as a result of our payment of an end of negotiation bonus in conjunction with the signing of the new collective bargaining agreement in the fourth quarter of 2006. Administrative expenses increased by 8.0% for the same periods, reflecting an increase in expenses as a result of the expansion of our distribution network. Our efficiency ratio, despite higher costs, continued to improve, reaching a record low of 39.0% for the year ended December 31, 2006, compared to 41.5% in 2005.
We recorded a net gain of Ch$20,030 million for the year ended December 31, 2006, under total other operating income, net, compared to a loss of Ch$14,606 million for 2005. Results in 2006 included a gain from trading

47
activities of Ch$13,516 million as a result of our adoption of the new accounting standards for valuing financial instruments. See “Item 5: A. Accounting Standards for Financial Investments and Derivatives.”
The net loss recorded in other income and expenses, net, decreased by 83.7% in 2006 compared to 2005, primarily due to a lower level of provisions for other contingencies.
Net interest revenue
Year Ended December 31, % Change
2005 2006 2007 2005/2006 2006/2007
(in millions of constant Ch$ as of December 31, 2007,
except percentages) Total individuals....................................... 299,148 357,178 452,136 19.4% 26.6% SMEs ........................................................ 100,625 139,515 160,909 38.6% 15.3% Institutional lending.................................. 7,134 10,218 12,048 43.2% 17.9% Total retail ................................................ 406,907 506,911 625,093 24.6% 23.3% Total middle-market ................................. 57,300 79,312 89,095 38.4% 12.3% Global banking & markets........................ 112,082 67,632 87,189 (39.7%) 28.9% Other......................................................... 23,512 3,951 24,239 (83.2%) 513.4% Net interest revenue.................................. 599,801 657,806 825,616 9.7% 25.5% Average interest-earning assets ................ 12,711,098 14,052,350 14,192,078 10.6% 1.0% Average non-interest-bearing demand
deposits................................................. 2,090,323 1,958,651 2,171,605 (6.3%) 10.9% Net interest margin (1).............................. 4.7% 4.7% 5.8% Average shareholders’ equity and
average non-interest-bearing demand deposits to total average interest-earning assets 25.0% 22.7% 24.6%
(1) Net interest margin is net interest revenue divided by average interest-earning assets.
2006 and 2007. In 2007, net interest revenue increased 25.5% compared to 2006, totaling Ch$825,616 million.
During this period, the Bank focused on increasing spreads in various business segments in order to improve profitability. At the same time, an improved funding mix and higher inflation also boosted net interest revenue. As a result, the Bank’s net interest margin increased 110 basis points to 5.8%. The average nominal rate earned on loans (excluding past due and contingent loans) was 13.2% in 2007 compared to 10.3% earned on interest-earning assets in 2006. The average real rate earned on loans was 4.9% in 2007 compared to 2.1% in 2006. The gross nominal spread (nominal rate earned on interest earning assets minus nominal rate paid on interest bearing liabilities) increased 70 basis points in 2007 to 3.9%. The gross real spread (real rate earned on interest earning assets minus the real rate paid on interest bearing liabilities) 170 basis points in 2007, reaching 4.4%.
(%) Year Ended December 31, 2006 Year Ended December 31, 2007
Avg. Real Rate Avg. Nominal Rate Avg. Real Rate Avg. Nominal Rate
Average loans (1) 2.1% 10.3% 4.9% 13.3% Average interest earning assets 7.3% 8.9% 3.0% 11.7% Average liabilities 4.6% 5.7% (1.4%) 7.8% Spread (2) 2.7% 3.2% 4.4% 3.9%
(1) Excludes contingent and past due loans (2) Avg. interest earning assets and Avg. liabilities
The increase in net interest revenue was primarily attributable to an increase in net interest revenue from various business segments in line with the Bank’s strategy of increasing spreads across the board in anticipation of higher future funding costs as rates rise in a higher inflationary environment. During the year the Bank also raised spreads in order to maintain adequate profitability taking into account the higher credit risk involved, especially in the retail segments.

48
Net interest revenue from the retail banking segment increased by 23.3% to Ch$625,093 million in 2007, with increases of 26.6% in the individuals segment and 15.3% in the SMEs segment. Loans to higher yielding retail banking segments increased by 4.9% in 2007 compared to 2006.
Net interest revenue from the middle-market segment increased by 12.3%, primarily due to the Bank’s focus on improving profitability by rising spreads, albeit with lower loan growth in the year. Loans in the middle-market segment increased 1.3% in the year.
In Global Banking & Markets net interest revenue increased 28.9%, primarily due to the higher short-term interest rate and inflation rate environment which increased the yield of the Bank’s fixed income portfolio. The Bank’s average financial investment portfolio decreased 17.3%, but interest earned on this portfolio increased 14.1%.
The higher inflation rate in 2007 compared to 2006 also had a positive effect on the growth rate of net interest revenue and margins. In 2007, the inflation rate in Chile was 7.8% compared to 2.6% in 2006. Our net interest revenue will be positively affected by an inflationary environment to the extent that our average UF-denominated assets exceed our average UF-denominated liabilities. Our net interest revenue will be negatively affected by inflation in any period in which our average UF-denominated liabilities exceed our average UF-denominated assets. Our average UF-denominated assets exceeded our average UF-denominated liabilities by Ch$2,871,535 million in 2007 compared to Ch$2,758,228 million in 2006. See “Item 5: C. Operating Results—Impact of Inflation” for a quantitative disclosure of the impact of inflation on our results.
An improved funding mix also helped to sustain margins despite a higher short-term interest rate environment. The ratio of the average balance of free funds (non interest bearing demand deposits and shareholders’ equity) to the average balance of interest earning assets also increased from 13.9% in 2006 to 15.3% in 2007. Therefore, as short-term rates increased and inflation also rose, the return on average free funds expanded.
Year Central Bank
reference rate (%) Period-end
90 day note (%)
2005 4.50 4.75 2006 5.00 5.10 2007 6.00 6.15
Source: Banco Central de Chile
The principal factors negatively affecting the net interest margin was the increase in short term interest rates. As interest-bearing liabilities generally have shorter terms than interest earning assets, a rise in short term rates has a negative effect on our funding costs. The higher inflation rate accelerated the pace of short-term interest rate increases in the year. The overnight interbank rate set by the Central Bank increased 100 basis points in 2007. The average 90 day Central Bank rate, a benchmark rate for deposits, increased in nominal terms from 4.83% in 2006 to 5.18% in 2007.
2005 and 2006. Net interest revenue for the year ended December 31, 2006, increased by 9.7% compared to 2005, mainly reflecting a 10.6% increase in average interest-earning assets.
The increase in net interest revenue was primarily attributable to an increase in net interest revenue from our retail banking and middle-market segments. Net interest revenue from the retail banking segment increased by 24.2% with increases of 19.4% in the individuals segment and 38.6% in the SMEs segment. Loans to higher yielding retail banking segments increased by 20.7% in 2006 compared to 2005. Net interest revenue from the middle-market segment increased by 38.4%, primarily due to a 14% increase in the average balance of the loans and increased net interest spread in this segment. In the global banking and markets segments, net interest revenue decreased 39.7%, primarily due to lower interest income from the Treasury primarily reflecting the Bank’s strategy of shifting the asset mix to higher yielding assets. Total financial investments decreased by 20.3% from December 31, 2005, to December 31, 2006. The average balance of financial investments decreased by 31.0% from 2005 to 2006.
This change in asset mix was the principal factor positively affecting the net interest margin. The increase in average interest-earning assets was primarily attributable to a 15.0% increase in average balance of loans. This growth in lending was driven by the stable economic environment and an increase in our market share in retail lending. Our total loan market share decreased by 30 basis points from 22.6% as of December 31, 2005, to 22.3% as

49
of December 31, 2006. Market share in lending to individuals increased from 25.2% as of December 31, 2005, to 26.2% as of December 31, 2006, led by a 101 basis point increase in residential mortgage lending and a 111 basis point increase in consumer lending market share.
At the same time, higher interest rates on short-term debt also helped to increase margins in 2006, notwithstanding the decline in long-term rates.
The principal factors negatively affecting the net interest margin were the decrease in inflation rates, the increase in short term interest rates and a decrease in the ratio of the average balances of non interest bearing demand deposits and shareholders’ equity to interest earning assets.
Inflation in 2006, measured by the annual variation of the UF, was 2.01% in 2006 compared to 3.8% in 2005. As a result, the nominal rate earned on UF-denominated interest-earning assets declined from 8.6% in 2005 to 7.0% in 2006. See “Item 5: C. Operating Results—Impact of Inflation” for a quantitative disclosure of the impact of inflation on our net interest income.
As interest-bearing liabilities generally have shorter terms than interest earning assets, a rise in short term rates has a negative effect on our funding costs. The Central Bank’s overnight reference rate reached 5.25% as of December 31, 2006, compared to 4.5% as of December 31, 2005. The average 90 day Central Bank rate, a benchmark rate for deposits, increased in nominal terms from 3.53% in 2005 to 4.83% in 2006. The average nominal rate paid on interest-bearing liabilities increased from 5.3% in 2005 to 5.7% in 2006. The average nominal rate paid on time deposits, which represented 64.8% of our average interest-bearing liabilities in 2006, increased from 4.7% in 2005 to 5.6% in 2006.
As short term interest rates increased, so did the attractiveness of time deposits, thereby increasing the costs of our funding mix. Average balance of time deposits increased by 23.2% in 2006 compared to 2005. Average balance of time deposits represented 64.8% of our average interest-bearing liabilities in 2006, compared to 60.2% in 2005. In addition, we lengthened the maturities of time deposits with institutional investors in order to partially offset the negative effects caused by the rising short-term interest rate environment.
The ratio of the average balance of free funds (non interest bearing demand deposits and shareholders’ equity) to the average balance of interest earning assets also decreased from 25.0% in 2005 to 22.7% in 2006, primarily as a result of the increase in short-term rates. This was partially offset by the increase in the spread earned on the free funds as a result of the rising interest rate environment.
Provision for loan losses
Under our loan classification categories loans are divided into: (i) consumer loans (including loans granted to individuals for the purpose of financing the purchase of consumer goods or payment of services); (ii) residential mortgage loans (including loans granted to individuals for the purchase, construction or improvements of residential real estate, in which the value of the property covers at least 100% of the amount of the loan); and (iii) commercial loans (includes all loans other than consumer loans and residential mortgage loans).
In 2006, we improved our internal provisioning models by not only focusing on non-performance, but introducing statistical models that take into account a borrower’s credit history and indebtedness levels. Group ratings that determine loan loss allowances based only on non-performance are being phased out and replaced by statistical scoring systems. Commencing in December 2006, we no longer analyze large commercial loans on a group basis. All large commercial loans have since been rated on an individual basis. For large commercial loans, leasing and factoring, we assign a risk category level to each borrower and his respective loans. We consider the following risk factors in classifying a borrower’s risk category: the borrower’s industry or sector, owners or managers, financial condition, payment ability and payment behavior.
Group assessment for loan loss allowances is permitted for a large number of borrowers whose individual loan amounts are relatively insignificant. Currently, we use group analysis to determine loan loss allowances for certain types of loans, such as loans to small- and mid-sized companies and commercial loans to individuals.
Commencing in 2006, we improved and modified the methodology for analyzing consumer and mortgage loans. All consumer and mortgage loans are assigned a provisioning level on an individual borrower basis using a more automated and sophisticated statistical model which considers a borrower’s credit history, including any

50
defaults on obligations to other creditors, as well as the overdue periods with respect to loans granted by us. Once the borrower’s rating is determined, the allowance for consumer or mortgage loans is calculated based on the risk category and the respective provisioning ratio which is directly related to the aging of the loan. Further enhancements were implemented in 2007. The Bank now differentiates between old and new clients when determining a client’s risk profile for consumer loans. All loans are assigned a provision at the moment a loan is granted depending on the risk profile of the client. Secondly, the time period used for statistically considering a consumer loan mature, in order to determine the risk level of consumer loans, was extended from 12 to 21 months of history. All loans are assigned a provision at the moment a loan is granted.
For a detailed description of the models we use to determine loan loss allowances, see “Item 5: F. Selected Statistical Information—Loans by Economic Activity—Classification of Loan Portfolio.”
For statistical information with respect to our substandard loans and reserves for probable loan losses, see “Item 5: F. Selected Statistical Information—Analysis of Substandard Loans and Amounts Past Due” and “Item 5: F. Selected Statistical Information—Analysis of Loan Loss Allowances,” as well as Note 7 to the Audited Consolidated Financial Statements. The amount of provision charged to income in any period consists of net provisions established for possible loan losses, net of recoveries on loans previously charged off.
The following table sets forth, for the years indicated, certain information relating to our provision expenses.
Year Ended December 31, % Change
2005 2006 2007 2005/2006 2006/2007
(in millions of constant Ch$ as of December 31, 2007,
except percentages) Provision expenses..................................... 29,733 (28,594) (59,047) —% 106.5% Charge-offs ................................................ (150,021) (154,150) (201,124) 2.8% 30.5% Recoveries for loans previously
charged off ............................................. 50,582 50,569 77,760 (0.0%) 53.8% Provision expenses, net .............................. (69,706) (132,175) (182,411) 89.6% 38.0% Year-end loans ........................................... 11,130,068 12,666,058 13,468,980 13.8% 6.3% Substandard loans (1)................................. 291,743 371,184 438,585 27.2% 18.2% Past-due loans ............................................ 116,894 99,445 116,654 (14.9%) 17.3% Loan loss allowance ................................... 162,234 187,014 232,766 15.3% 24.5% Substandard loans / Year-end loans ........... 2.6% 2.9% 3.3% Past due loans / Year-end loans.................. 1.1% 0.8% 0.9% Expected loan loss ratio (2)........................ 1.5% 1.5% 1.7% Coverage ratio (3) ...................................... 138.8% 188.1% 199.5%
(1) Substandard loans are all mortgage and consumer loans rated B- or worse and all commercial loans rated C2 or worse. In the new loan rating system, substandard loans include all consumer and mortgage loans rated B- or worse and all commercial loans rated C2 or worse.
(2) Loan loss allowance divided by year end loans.
(3) Loan loss allowance divided by past due loans.
2007 and 2006. Net provision expenses for loan losses totaled Ch$182,411 million for the year ended December
31, 2007, an increase of 38.0% compared to 2006, primarily due to an increase in provision expense and charge-offs. Provision expense rose 106.5% to Ch$59,047 million in 2007 compared to 2006. This growth in provision expenses was due to:
(i) the Bank recognized an extraordinary provision expense of Ch$14,444 million directly related to the further improvements made to the provisioning model for consumer loans. Specifically, the time period used for statistically considering a consumer loan mature, in order to determine the risk level of consumer loans, was extended from 12 to 21 months of history. For a detailed description of the models we use to determine loan loss allowances, see “Item 5: F. Selected Statistical Information—Loan by Economic Activity—Classification of Loan Portfolio;” and
(ii) the increase in the Bank’s expected loan loss ratio from 1.5% in 2006 to 1.7% in 2007 in line with the increase in retail lending which is higher yielding, but requires higher provision expense. The expected loan loss ratio is calculated according to the guidelines set by the Superintendency of Banks and our Board. This ratio is the

51
main determinant of loan loss allowances. Loan loss allowances must be equal to the loan loss ratio multiplied by total loans; and
(iii) loan growth. The Bank’s provisioning model based on risk profiles requires every loan to have a provision attached according to risk profile or rating. Therefore as the loan book grows provision expenses increases.
Charge-offs increased by 30.5% in 2007 compared to 2006, primarily as a result of the growth of our consumer loan portfolio, for which credit risk is higher and loans are requested to be written off within much shorter periods than the rest of the loan portfolio. Charge-offs of the consumer loan portfolio increased by 50.2% to Ch$165,029 million. The segment of the Bank which has experienced the largest deterioration in asset quality has been the middle income individual segment. This segment has been hit by the rise in inflation, as this affects a larger portion of their income levels (food, schools, health, mortgage, etc.) This was partially offset by the 14.7% decrease in charge-offs in the mortgage loan portfolio and the 19.1% decline in charge-offs in the commercial loan portfolio.
The following table shows charge-offs by Santander-Chile by type of loan:
Year Ended December 31, % Change
2005 2006 2007 2005/2006 2006/2007
(in millions of constant Ch$ as of December 31, 2007,
except percentages) Consumer loans...................................... 73,214 109,853 165,029 50.0% 50.2% Mortgage loans....................................... 7,858 6,220 5,308 (20.8%) (14.7%)Commercial loans................................... 68,949 38,077 30,787 (44.8%) (19.1%)Total charge-offs .................................... 150,021 154,150 201,124 2.8% 30.5%
Recoveries on loans previously charged off increased 53.8% in 2007 compared to 2006. This rise was mainly due to two large sales of loans previously charged off in the year. These sales resulted in a gain of Ch$25,792 million.
Overall asset quality indicators remained healthy in 2007. The ratio of past due loans as a percentage of total loans reached 0.9% compared to 0.8% at year-end 2006. Total substandard loans as a percentage of total loans increased from 2.9% at year-end 2006 to 3.3% at year-end 2007, mainly due to the change in loan mix towards higher yielding retail loans, which generally present relatively higher risk than other retail loans. The coverage ratio of past due loans increased from 188.1% at year-end 2006 to 199.5% at year-end 2007.
The following table sets forth, for the years indicated, the components of our net provision expenses.
Year Ended December 31, % Change
2005 2006 2007 2005/2006 2006/2007
(in millions of constant Ch$ as of December 31, 2007,
except percentages) Total individuals (56,143) (109,323) (148,771) 94.7% 36.1% SMEs (16,908) (22,390) (31,510) 32.4% 40.7% Institutional lending (17) 516 (29) --% --% Total retail (73,068) (131,197) (180,310) 79.6% 37.4% Total middle-market 1,196 (774) (612) --% (20.9%) Global banking & markets 2,106 755 215 (64.2%) (71.5%) Other (1) 60 (959) (1,704) --% 77.7% Provision expense, net (69,706) (132,175) (182,411) 89.6% 38.0%
(1) Consists primarily of additional allowances on loans which are not assigned to any of the above types or segments, if any, and provisions for repossessed assets.
Provision expense increased by 37.4% in the retail banking segment, mainly as a result of the growth of our
retail loan portfolio, for which credit risk is higher and provisions are required to be made within much shorter periods than the rest of the loan portfolio. The segment of the Bank which has experienced the largest deterioration in asset quality has been the middle income individual segment. This segment has been hit by the rise in inflation, as

52
this affects a larger portion of their income levels (food, schools, health, mortgage, etc.) Net provision expense in the rest of the segments remained relatively stable, reflecting the generally healthy credit quality indicators in those segments.
We expect provisions for loan losses to increase in future periods in line with the overall growth of our loan portfolio and our increased lending to small companies and individuals which poses a higher risk of default than lending to traditional corporate and commercial customers. See “Item 3: D. Risk Factors—Risks Associated with our Business—Our exposure to individuals and small businesses could lead to higher levels of past due loans, allowances for loan losses and charge-offs” and “—The growth of our loan portfolio may expose us to increased loan losses.”
2006 and 2005. Net provision expenses for loan losses increased 89.6% compared to 2005, primarily due to increase in provision expense and charge-offs. Provision expense increased by 79.6% in the retail banking segment, mainly as a result of the growth of our retail loan portfolio, for which credit risk is higher and provisions are required to be made within much shorter periods than the rest of the loan portfolio. Charge-off of the consumer loan portfolio increased by 50.0% in 2006 compared to 2005. Provision expense in the SME segment increased in line with loan growth in this segment. Net provision expense in the rest of the segments remained relatively stable, reflecting the generally healthy credit quality indicators in those segments.
The Bank’s risk index or expected loan loss ratio, which is calculated according to the guidelines, set by the Superintendency of Banks and our Board, increased from 1.46% in 2005 to 1.48% in 2006. This index is the main determinant of loan loss allowances. Loan loss allowances must be equal to the risk index multiplied by total loans. As the loan portfolio increased by 13.8% in 2006 and the risk index rose 2 basis points, required loan loss allowances rose 15.3%. See “Item 5: F. Selected Statistical Information—Loan by Economic Activity—Classification of Loan Portfolio.”
Charge-offs increased by 2.8% in 2006 compared to 2005, primarily as a result of the growth of our consumer loan portfolio, for which credit risk is higher and loans become loss within much shorter periods than the rest of the loan portfolio. Charge-offs of the consumer loan portfolio increased by 50.0%. This was partially offset by the 44.8% decrease in charge-offs in the commercial loan portfolio. In 2005, the Bank charged off various commercial loans that had been previously restructured and that bear no interest. See “Item 5: F. Selected Statistical Information—Analysis of Loan Loss Allowances” and “Item 5: F. Selected Statistical Information—Classification of Loan Portfolio Based on the Borrower’s Payment Performance.” These loans were already classified as D2 and were 90% provisioned for. Therefore, this increase in charge-offs was offset by the subsequent release of provisions recorded in 2005.
In addition, recoveries on loans previously charged off remained effectively stable in 2006 compared to 2005. Our recovery department is currently being reorganized and expanded in order to keep up with the growth in our retail lending business.
Overall asset quality indicators remained healthy in 2006. Past due loans at December 31, 2006, decreased by 14.9% compared to December 31, 2005. Past due loans as a percentage of total loans decreased from 1.05% at December 31, 2005, to 0.79% at December 31, 2006. Substandard loans increased by 27.2%, primarily due to an increase in substandard consumer loans, which rose mainly as a result of loan growth in this product. Total substandard loans as a percentage of total loans increased from 2.62% at year-end 2005 to 2.93% at year-end 2006, mainly due to the change in loan mix towards higher yielding retail loans, which generally present relatively higher risk than other retail loans.
Fee income
The following table sets forth certain components of our income from services (net of fees paid to third parties directly connected to providing those services, principally fees relating to credit card processing and ATM network administration) in the years ended December 31, 2005, 2006 and 2007.
Year ended December 31, % Change
2005 2006 2007 2005/2006 2006/2007
(in million of constant Ch$ as of December 31, 2007,
except percentages) Checking accounts & lines of credit ....................... 45,586 57,729 57,674 26.6% (0.1%)

53
Year ended December 31, % Change
2005 2006 2007 2005/2006 2006/2007
(in million of constant Ch$ as of December 31, 2007,
except percentages) Mutual fund services............................................... 20,709 21,530 29,654 4.0% 37.7% Collection and administration of insurance
policies................................................................ 22,130 24,962 29,096 12.8% 16.6% Credit cards............................................................. 15,167 20,037 22,965 32.1% 14.6% Automatic teller cards ............................................. 14,890 15,333 16,222 3.0% 5.8% Insurance brokerage................................................ 9,032 12,245 12,006 35.6% (2.0%) Stock brokerage ...................................................... 1,777 1,497 7,261 (15.8%) 385.0% Sales and purchase of foreign currencies ................ 7,111 6,400 5,640 (10.0%) (11.9%) Office banking ........................................................ 1,483 2,796 2,823 88.5% 1.0% Letters of credit, guarantees, pledges and other
contingent loans .................................................. 3,026 2,710 2,645 (10.4%) (2.4%) Payment agency services ........................................ 3,095 2,870 2,549 (7.3%) (11.2%) Underwriting........................................................... 2,560 1,445 1,480 (43.6%) 2.4% Bank drafts and fund transfers ................................ 277 670 306 141.9% (54.3%) Savings accounts..................................................... 262 272 237 3.8% (12.9%) Custody and trust services ...................................... 699 392 (121) (43.9%) (130.9%) Other ....................................................................... 4,009 3,755 2,488 (6.3%) (33.7%) Total........................................................................ 151,813 174,643 192,925 15.0% 10.5%
2006 and 2007. Total net fee income increased by 10.5% to Ch$192,925 million for the year ended December
31, 2007, compared to 2006. The positive economic environment and the growth of the Bank’s client base led to an overall increase in the usage and penetration of bank products in 2007. The Bank’s total retail banking client base increased by 14.1% in 2007, totaling 2.8 million clients. The number of retail clients with a checking account increased by 13.8% in 2007, reaching 565 thousand. Retail clients (excluding Santander Banefe) who are cross sold, which are defined as clients with a checking account who also uses at least four other banking products, increased by 16.2% at December 31, 2007, compared to December 31, 2006. In Santander Banefe, the number of cross sold clients (clients who also use at least two other products) rose by 18.0% at December 31, 2007, compared to December 31, 2006.
Fees from checking accounts and lines of credit decreased 0.1% in 2007 compared to 2006. In the beginning of 2007, Chile introduced a regulatory change that prohibited banks from charging certain fees to checking account holders for bad check clearance. In the future we do not rule out further regulatory changes that may have a significant impact on fees from our checking accounts and lines of credit. However, our market share in checking accounts continued to rise reaching 27.9% as of November 2007 compared to 27.1% as of November 2006. In 2007, the Bank opened 34.8% of all new checking accounts in Chile.
Fees from our mutual fund asset management subsidiary increased by 37.7%. Total assets under management increased by 25.8% to Ch$2,632,654 million (US$5.3 billion) at December 31, 2007, compared to December 31, 2006.
Fees from collection and administration of insurance policies increased by 16.6% for the year ended December 31, 2007, compared to 2006, primarily due to the growth of our retail loan book that has led to an increase in collection of insurance premiums on these loans on behalf of insurance companies. This growth was partially offset by the 2.0% decrease in insurance brokerage fees mainly due increased competition in this business segment.
Credit card fees increased by 14.6% in 2007 compared to 2006. We were the market leader in bank credit card accounts, with a 36.0% market share at year-end 2007 compared to 35.8% market share as of December 31, 2006. The number of our credit card customer accounts increased by 16.2% to 1,102,630 at December 31, 2007, compared to December 31, 2006. The transaction volumes of credit cards issued by us, measured in UFs, increased by 12.5% in 2007 compared to 2006. The rise in credit card fees is partially offset by the other credit card expenses reflected in “Other operating losses, net.”
The 5.8% rise in ATM fees was mainly driven by the increase in the number of ATMs installed by the Bank. As of December 31, 2007, the Bank had 2,004 ATMs compared to 1,588 ATMs as of December 31, 2006. The rise in ATMs was offset by increased competition in order to obtain favorable ATM locations.
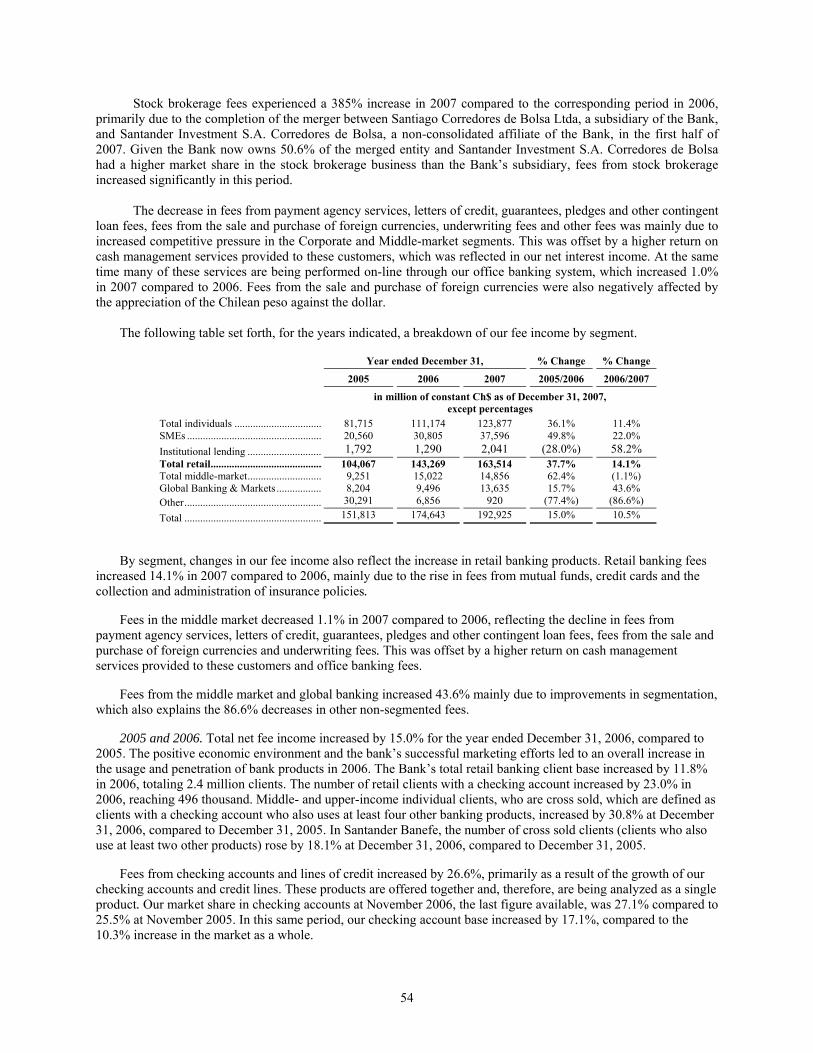
54
Stock brokerage fees experienced a 385% increase in 2007 compared to the corresponding period in 2006, primarily due to the completion of the merger between Santiago Corredores de Bolsa Ltda, a subsidiary of the Bank, and Santander Investment S.A. Corredores de Bolsa, a non-consolidated affiliate of the Bank, in the first half of 2007. Given the Bank now owns 50.6% of the merged entity and Santander Investment S.A. Corredores de Bolsa had a higher market share in the stock brokerage business than the Bank’s subsidiary, fees from stock brokerage increased significantly in this period.
The decrease in fees from payment agency services, letters of credit, guarantees, pledges and other contingent
loan fees, fees from the sale and purchase of foreign currencies, underwriting fees and other fees was mainly due to increased competitive pressure in the Corporate and Middle-market segments. This was offset by a higher return on cash management services provided to these customers, which was reflected in our net interest income. At the same time many of these services are being performed on-line through our office banking system, which increased 1.0% in 2007 compared to 2006. Fees from the sale and purchase of foreign currencies were also negatively affected by the appreciation of the Chilean peso against the dollar.
The following table set forth, for the years indicated, a breakdown of our fee income by segment.
Year ended December 31, % Change % Change
2005 2006 2007 2005/2006 2006/2007
in million of constant Ch$ as of December 31, 2007,
except percentages Total individuals ................................. 81,715 111,174 123,877 36.1% 11.4% SMEs ................................................... 20,560 30,805 37,596 49.8% 22.0% Institutional lending ............................ 1,792 1,290 2,041 (28.0%) 58.2% Total retail........................................... 104,067 143,269 163,514 37.7% 14.1% Total middle-market............................ 9,251 15,022 14,856 62.4% (1.1%) Global Banking & Markets ................. 8,204 9,496 13,635 15.7% 43.6% Other.................................................... 30,291 6,856 920 (77.4%) (86.6%)
Total .................................................... 151,813 174,643 192,925 15.0% 10.5%
By segment, changes in our fee income also reflect the increase in retail banking products. Retail banking fees increased 14.1% in 2007 compared to 2006, mainly due to the rise in fees from mutual funds, credit cards and the collection and administration of insurance policies.
Fees in the middle market decreased 1.1% in 2007 compared to 2006, reflecting the decline in fees from payment agency services, letters of credit, guarantees, pledges and other contingent loan fees, fees from the sale and purchase of foreign currencies and underwriting fees. This was offset by a higher return on cash management services provided to these customers and office banking fees.
Fees from the middle market and global banking increased 43.6% mainly due to improvements in segmentation, which also explains the 86.6% decreases in other non-segmented fees.
2005 and 2006. Total net fee income increased by 15.0% for the year ended December 31, 2006, compared to 2005. The positive economic environment and the bank’s successful marketing efforts led to an overall increase in the usage and penetration of bank products in 2006. The Bank’s total retail banking client base increased by 11.8% in 2006, totaling 2.4 million clients. The number of retail clients with a checking account increased by 23.0% in 2006, reaching 496 thousand. Middle- and upper-income individual clients, who are cross sold, which are defined as clients with a checking account who also uses at least four other banking products, increased by 30.8% at December 31, 2006, compared to December 31, 2005. In Santander Banefe, the number of cross sold clients (clients who also use at least two other products) rose by 18.1% at December 31, 2006, compared to December 31, 2005.
Fees from checking accounts and lines of credit increased by 26.6%, primarily as a result of the growth of our checking accounts and credit lines. These products are offered together and, therefore, are being analyzed as a single product. Our market share in checking accounts at November 2006, the last figure available, was 27.1% compared to 25.5% at November 2005. In this same period, our checking account base increased by 17.1%, compared to the 10.3% increase in the market as a whole.

55
Fees from collection and administration of insurance policies increased by 12.8% for the year ended December 31, 2006, compared to 2005, primarily due to the growth of our mortgage loan book and lower than estimated claim rates, which results in higher administration fees paid by insurers to us.
Fees from our mutual fund asset management subsidiary increased by 4.0%. Total assets under management increased by 35.9% at December 31, 2006, compared to December 31, 2005.
Credit card fees increased by 32.1% in 2006 compared to 2005. We were the market leader in bank credit card accounts, with a 35.8% market share as of December 31, 2006. The transaction volumes of credit cards issued by us, measured in UFs, increased by 12.9% in 2006 compared to 2005. The number of our credit card customer accounts increased by 16.0% to 948,918 at December 31, 2006, compared to December 31, 2005. The rise in credit card fees is partially offset by the other credit card expenses reflected in “Other operating losses, net.”
The 3.0% rise in ATM fees was mainly driven by the increase in the number of ATMs installed by the Bank. As of December 31, 2006, the Bank had 1,588 ATMs compared to 1,422 as of December 31, 2005. The rise in ATMs was offset by increased competition in order to obtain ATM locations with large retailers.
Insurance brokerage fees increased by 35.6% for the year ended December 31, 2006, compared to 2005. This was mainly as a result of an industry-wide expansion of insurance brokerage business as banks have successfully introduced simple and low cost insurance products to the market.
The decrease in fees from payment agency services, letters of credit, guarantees, pledges and other contingent loan fees, fees from the sale and purchase of foreign currencies, underwriting fees and other fees was mainly due to increased competitive pressure in the Corporate and Middle-market segments. This was offset by an increase in the sales of derivatives and other treasury services, which were included in “Other operating income” and a higher return on cash management services provided to these customers, which was reflected in our net interest income.
Office banking fees increased by 88.6% in 2006 compared to 2005 as the Bank has also sought to increase the coverage and pricing of its on-line corporate banking services in order to offset the decrease in collection fees.
By segment, changes in our fee income also reflects the increase in retail banking products. Retail banking fees increased by 37.7% in 2006 compared to 2005, mainly due to the rise in fees from checking accounts, lines of credit, insurance brokerage and credit cards.
Fees from the middle market increased by 62.4% in 2006 compared to 2005, led by the increase in office banking services and the reclassification of the fees from the mutual fund asset management from “other” fee income to fees from the middle market in 2006.
Fees from global banking and markets increased 15.7%, reflecting the increase in treasury services and office banking.
Other operating income (expenses), net
The following table sets forth information regarding our other operating income (expenses), net in the years ended December 31, 2005, 2006 and 2007.
Year ended December 31, % Change % Change
2005 2006 2007 2005/2006 2006/2007 (in millions of constant Ch$ as of December 31, 2007, except percentages)
Net gains from trading and mark-to-market..................... (67,224) 107,775 (126,738) --% --% Foreign exchange transactions, net .................................. 77,766 (52,332) 92,425 --% --% Sub-total, market related income ..................................... 10,542 55,443 (34,313) 425.9% --% Other operating losses, net ............................................... (25,148) (35,413) (45,413) 40.8% 28.2% Total other operating income ........................................... (14,606) 20,030 (79,726) --% --%
2006 and 2007. Total other operating income, net, amounted to a loss of Ch$79,726 million for the year ended
December 31, 2007, compared to a gain of Ch$20,030 million in 2006. Total other operating income, net, consists primarily of (i) the results of our Treasury Department’s trading and hedging activities and financial transactions with customers as well the results of our Financial Management division, and (ii) other operating income and

56
expenses primarily relating to repossessed assets that have not been charged-off, sales force expenses and other expenses relating to the Bank’s marketing and promotional efforts.
Net gains from trading activities and mark-to-market adjustments and foreign exchange transactions totaled a loss of Ch$34,313 million compared to a gain of Ch$55,443 million in 2006. This line item in 2007 included: (i) a loss of Ch$131,020 million from mark-to-market adjustments of our derivatives portfolio and, (ii) a gain of Ch$4,282 million from mark-to-market adjustments and realized gains made in the securities portfolio. The net result from foreign exchange transactions totaled a gain of Ch$92,425 million in 2007. These results mainly included the translation gain or loss of assets and liabilities denominated in foreign currencies (excluding derivatives), which was largely offset by the hedged positions with derivatives. Our exposure to the foreign currency market is limited by guidelines of the Central Bank and our Market Risk Department (see “Item 11: Quantitative and Qualitative Disclosures about Market Risk”).
In order to more easily comprehend the market related income, we present the following table that separates the results between Treasury and Financial Management.
At December 31, Market related income 2006 2007 % Change (In million of constant Chilean pesos at
December 31, 2007) Treasury .............................................. 64,585 12,639 (80.4%) Financial Management ........................ (9,142) (46,952) 413.6% Total market related income................ 55,443 (34,313) --%
The 80.4% decrease in market related income from our Treasury Division was mainly due to: (i) a one-time
gain of Ch$13,516 million recognized in 2006 as a result of the adoption of new accounting standards reflecting recognizing financial instruments at fair value, which resulted in a gain from trading activities and (ii) lower gains from our market making and proprietary trading results. The Bank’s trading positions were negatively affected by the movements of real interest rates, especially in the fourth quarter of 2007. This was partially offset by the results of Santander Global Connect, which includes foreign exchange and derivatives products sold to clients.
The area of Financial Management (Gestión Financiera) carries out the function of managing the structural interest rate risk, the structural position in inflation indexed assets and liabilities, shareholders’ equity and liquidity. The aim of Financial Management is to inject stability and recurrence into the net interest income of commercial activities and to assure the Bank complies with internal and regulatory limits regarding liquidity, regulatory capital, reserve requirements and market risk. The 413.6% increase in the loss recognized by Financial Management was mainly due to derivatives that hedge for inflation and interest rate risk. In 2007, the financial cost of the swaps taken in order to hedge for inflation and interest rate risk totaled Ch$42,465 million compared to Ch$12,899 million in 2006. This higher cost was a direct result of the higher inflation rate in these two periods (see “Item 5: C. Operating Results—Impact of Inflation”). As the Bank’s mortgage portfolio grows, the maturity gap tends to rise as these loans, which are denominated in UF, have a longer maturity than the average maturity of our funding base. As most of long term financial instruments and mortgage loans are denominated in UF and most deposits in nominal pesos, the increase in mortgage lending increments the Bank’s exposure to inflation and to interest rate risk. The size of this gap is limited by internal and regulatory guidelines in order to avoid excessive potential losses due to strong shifts in interest rates (see “Item 11: Quantitative and Qualitative Disclosures About Market Risk”). In order to keep this duration gap below regulatory limits the bank issues long term bonds denominated in UF or interest rate swaps. The financial cost of the bonds is recorded as interest expense, but the financial cost of these swaps is included in the net results from trading and mark-to-market.
In 2007, other operating losses, net, increased by 28.2% to Ch$45,413 million compared to 2006. Total sales force expenses increased 30.0% mainly as a result of our sales efforts in retail banking. Expenses relating to our credit card business increased by 70.0% to Ch$9,172 million for the year ended December 31, 2007, compared to 2006, primarily as a result of higher expenses related to promotions to augment credit card usage. These increased costs were offset by increased fees from our credit cards.
Customer service expenses, which consist primarily of expenses paid to third parties for transporting funds for corporate customers as part of cash management agreements, and the costs of our call center, increased by 24.0% to Ch$14,505 million in 2007 compared to 2006. This was offset by positive performance of our cash management

57
business. We generate fees for collection and corporate e-banking services and generate interest income on the floating balances of these clients. The growth of these expenses also reflects the shift towards more efficient sales channels such as our call center compared to the outsourced sales force.
The results from the sales and expenses in maintaining repossessed assets increased 215.9% to Ch$2,859 million.
2005 and 2006. Total other operating income, net, amounted to a gain of Ch$20,030 million for the year ended December 31, 2006, compared to a loss in 2007. Total other operating income, net, consists primarily of (i) the results of our Treasury Department’s trading and hedging activities and financial transactions with customers, and (ii) other operating income and expenses primarily relating to repossessed assets that have not been charged-off, sales force expenses and other expenses relating to the Bank’s marketing and promotional efforts.
Net gains from trading activities and mark-to-market adjustments and foreign exchange transactions, net for the years ended December 31, 2006 and 2005, are not strictly comparable since 2006 figures include the mark-to-market adjustments of derivatives. In accordance with Circular No. 3345 issued by the Superintendency of Banks, effective January 1, 2006, the accounting standards for valuing financial instruments acquired for trading or investment purposes, including derivative instruments, were amended. In summary, we must record our derivatives portfolio at fair value, and hedge accounting was introduced. (See “Item 5: A. Accounting Standards for Financial Investments and Derivatives” and “—B. Critical Accounting Policies”). Results in 2006 included a gain of Ch$13,516 million following the adoption of new accounting standards reflecting recognizing financial instruments at fair value, which resulted in a gain from trading activities. If we had applied the new accounting standards for the year ended December 31, 2005, the net effect on our results would have been a gain of Ch$7,527 million (this figure has been calculated based on the adjustment under US GAAP for hedge accounting. See Note 26(m)-Derivatives).
In 2006, other operating losses, net, increased by 40.8% compared to 2005. This was primarily due to our increased business activities, which resulted in increases in credit card related expenses and other customer related expenses. Expenses relating to our credit card business increased by 117.7% for the year ended December 31, 2006, compared to 2005, primarily as a result of relatively higher premium rates on fraud insurance covering some of our new cards and an increase in the membership fees paid to Transbank, the company collectively owned by major banks in Chile which runs credit card payment networks in Chile. These increased costs were offset by increased fees from our credit cards.
Customer service expenses, which consist primarily of expenses paid to third parties for transporting funds for corporate customers as part of cash management agreements, and the costs of our call center, increased by 105.0% in 2006 compared to 2005. This was offset by positive performance of our cash management business. We generate fees for collection and corporate e banking services and generate interest income on the floating balances of these clients. The growth of these expenses also reflects the shift towards more efficient sales channels such as our call center compared to the outsourced sales force.
The results from the sales and expenses in maintaining repossessed assets decreased by 78.2% in 2006 compared to 2005.
Other income and expenses, net
The following table sets forth information regarding our operating expenses in the years ended December 31, 2005, 2006 and 2007.
Year ended December 31, % Change % Change
2005 2006 2007 2005/2006 2006/2007
(in millions of constant Ch$ as of December 31, 2007,
except percentages) Non-operating income (loss), net ................................... (24,152) (4,528) 9,799 (81.3%) --% Income attributable to investments in other
companies .................................................................. 745 844 (1,321) 13.3% --% Losses attributable to minority interest .......................... (146) (162) (2,055) 11.0% 1,168.5% Total ............................................................................... (23,553) (3,846) 6,423 (83.7%) --%

58
2006 and 2007. Other income and expenses, net, totaled Ch$6,423 million in 2007 compared to a loss of Ch$3,846 million in 2006. This variation was mainly due to: (i) a 35.7% increase in recovery of previous year expenses, which totaled Ch$9,113 million, (ii) a gain of Ch$2,080 million recognized from the sale of a share the Bank held in the Santiago Stock Exchange and the sale of 17,000 shares of Mastercard, (iii) a 45.4% decrease in charge-offs of repossessed assets, (iv) a 92.8% decrease in provisions for other contingencies. These contingencies are mainly related to non credit risks, including non specific contingencies, tax contingencies and other non credit contingencies or impairments. In 2007, these provisions totaled Ch$504 million.
This was partially offset by the Ch$1,321 million loss recognized by the Bank in income attributable to investment in other companies. This loss was mainly due to a Ch$2,505 million loss recognized by the company Administrador Financiero Transantiago S.A. The Bank owns 20% of this company that is in charge of busfare clearing and financial management services for Santiago’s new transportation network. This network was completely overhauled in 2007, resulting in inefficient service that affected this company’s results. The larger losses attributable to minority interest was mainly due to the merger between Santiago Corredores de Bolsa Ltda, a subsidiary previously owned 100% by the Bank, and Santander Investment S.A. Corredores de Bolsa, an indirect subsidiary of Banco Santander Spain in 2007. As a result of the proposed merger, the Bank owns 51.0% of the merged entity. (See Note 17 to our Audited Consolidated Financial Statements).
2005 and 2006. The net loss recorded in other income and expenses, net, decreased by 83.7% in 2006 compared to 2005, primarily due to a lower level of provisions for other contingencies. These contingencies are mainly related to non credit risks, including non specific contingencies, tax contingencies and other non credit contingencies or impairments. In 2006, these provisions decreased 67.8% compared to 2005. The lower non-operating loss was also due to a lower level of charge-offs of repossessed assets that decreased 36.2% compared to 2005. This was partially offset by a 52.6% decrease in gains from the sales of repossessed assets previously charged off. (See Note 17 to our Audited Consolidated Financial Statements).
Operating expenses
The following table sets forth information regarding our operating expenses in the years ended December 31, 2005, 2006 and 2007.
Year ended December 31, % Change
2005 2006 2007 2005/2006 2006/2007
(in millions of constant Ch$ as of December 31, 2007,
except percentages) Personnel salaries and expenses ............................. (152,749) (171,605) (176,095) 12.3% 2.6% Administrative expenses ........................................ (110,359) (119,202) (121,546) 8.0% 2.0% Depreciation and amortization ............................... (43,062) (41,486) (45,043) (3.7%) 8.6% Total ....................................................................... (306,170) (332,293) (342,684) 8.5% 3.1% Efficiency ratio(1) .................................................. 41.5% 39.0% 36.5%
(1) The efficiency ratio is the ratio of total operating expenses to total operating revenue. Total operating revenue consists of net interest revenue, income from services, net, and other operating income, net.
2006 and 2007. Operating expenses in 2007 increased by 3.1% compared to 2006. The 2.6% rise in personnel salaries and expenses was mainly due to the 16.6% rise in average headcount in 2007 compared to 2006. This was offset by the end of negotiation bonus paid in conjunction with the signing of the new collective bargaining agreement in the fourth quarter of 2006. This new collective bargaining agreement became effective on March 1, 2007, and will expire on March 1, 2011. As a part of this process, an end of negotiation bonus was paid, which resulted in a one-time cost of Ch$9,263 million in 2006. Excluding this item personnel expenses increased 8.5% and total operating expenses increased 6.1%.
Administrative expenses increased 2.0% in 2007 compared to 2006 mainly as a result of large expenses related to our expansion of the distribution network. This also explain the rise in depreciations and amortizations. Our efficiency ratio, despite higher costs, continued to improve, reaching a record low of 36.5% for the year ended December 31, 2007, compared to 39.0% in 2006. We expect personnel, administrative expenses and depreciation to grow at a higher pace in future periods as a result of our strategy to expand our retail banking business and higher

59
inflation as wages are indexed to CPI. The pace of expansion of our branch and ATM network in the medium-term may vary with fluctuations in the outlook of the Chilean economy.
2005 and 2006. Operating expenses in 2006 increased by 8.5% compared to 2005. The 12.3% rise in personnel salaries and expenses was mainly due to the above mentioned end of negotiation bonus paid in conjunction with the signing of the new collective bargaining agreement in the fourth quarter of 2006. Personnel costs also grew as a result of the 5.4% rise in average headcount in 2006 compared to 2005 and an increase in bonuses paid to business teams for reaching business targets. Our efficiency ratio, despite higher costs, continued to improve, reaching a record low of 39.0% for the year ended December 31, 2006, compared to 41.5% in 2005. Administrative expenses increased by 8.0% for the same periods, reflecting an increase in expenses as a result of the expansion of our distribution network. Depreciation and amortization expenses decreased by 3.7% in 2006 compared to 2005. In the fourth quarter of 2005, the Bank accelerated the depreciation of obsolete IT projects, which resulted in the decline in depreciation expense in 2006. Our efficiency ratio, representing operating expenses divided by operating income, improved from 41.5% in 2005 to a record low of 39.0% in 2006.
Loss from price level restatement
2006 and 2007. The loss from price level restatement totaled Ch$56,325 million in 2007, an increase of 280.4% compared to 2006. We must adjust our capital, fixed assets and other assets for the variations in price levels. Because our capital is larger than the sum of our fixed and other assets, price level restatement usually results in a loss and fluctuates with the inflation rate. The inflation rate used for calculating price level restatement increased in 2007 compared to 2006 (7.44% in 2007 and 2.12% in 2006), resulting in a higher loss from price level restatement. The higher loss from price level restatement is also partially offset by the positive impact of inflation on net interest income. (See “Item 5: C. Operating Results—Impact of Inflation”).
2005 and 2006. The loss from price level restatement decreased 25.6% compared to 2005. We must adjust our capital, fixed assets and other assets for the variations in price levels. Because our capital is larger than the sum of our fixed and other assets, price level restatement usually results in a loss and fluctuates with the inflation rate. The inflation rate used for calculating price level restatement decreased in 2006 compared to 2005 (2.12% in 2006 and 3.62% in 2005), resulting in a lower loss from price level restatement. This was partially offset by an increase in the gap between equity and other assets as we decreased our dividend payment in 2006. The lower loss from price level restatement is also partially offset by the negative impact on net interest income due to lower inflation rates.
Income tax
Our income tax expense decreased by 11.8% to Ch$55,171 million for the year ended December 31, 2007, compared to 2006, primarily due to higher gain from deferred taxes in the year. In 2007 the Bank recognized Ch$11,487 million in deferred tax gains compared to a tax expense of Ch$3,030 million from deferred taxes in 2006. The effective tax rate for 2007 was 15.2% and 16.9% in 2006. The statutory corporate tax rate was 17% (see Note 20 of our Consolidated Financial Statements).
2005 and 2006. Our income tax expense increased by 14.4% for the year ended December 31, 2006, compared to 2005, primarily due to a 16.3% growth of income before taxes. The effective tax rate for 2006 was 16.9%, compared to 17.2% for 2005. The statutory corporate tax rate was 17%.

60
D. New Accounting Format in 2008
Circular No. 3410 issued by the Superintendency of Banks, which became effective on January 1, 2008, dictated new accounting formats for financial statements. The new accounting formats are congruent with International Accounting Standards, but do not imply a change in accounting standards. Banks are required to adopt the new accounting formats in 2008. The main changes are presented in the table below. These changes do not involve a change to accounting principles and will not impact net income compared to figures that have been presented in the twelve month period ended December 31, 2006 and 2007. Beginning January 1, 2009, Chilean banks will adopt accounting standards more congruent with International Accounting Standards.
Main changes Income statement
Previous format Items that were re-classified
New format Where items have been reclassified
Net interest income 1 Interest income contingent operations 2 Interest income trading portfolio
5 Interest income derivatives for hedging
Provision expense 3 Provisions for repossessed assets 4 Sale of charge-off loans
Fee income 1 Interest income contingent operations
Market related income
5 Interest income derivatives for hedging 2 Interest income trading portfolio 4 Sale of charge-off loans
Other op. expenses 6 Sales force expenses 3 Provisions for repossessed assets
Operating expenses 6 Sales force expenses in administrative
expenses Main changes Balance sheet
Previous format Items that change
New format What change will be
Assets Liabilities
1 Contingent loans
2 Past due loans
3 Loan loss allowances
4 Shareholders’ Equity
1 Contingent loans are held off balance sheet
2 Included in each loan product. Not
disclosed separately. We disclose it for information purposes
3 Loans are presented net of loan loss
allowances. We disclose it separately for information purposes
4 Shareholders’ Equity will include a
provision for future dividends of 30% of net income. Liabilities will also include a
new item “Provision for dividends”. Shareholders’ equity also includes
minority interests

61
E. Liquidity and Capital Resources
Sources of Liquidity
Santander-Chile’s liquidity depends upon its (i) capital, (ii) reserves and (iii) financial investments, including investments in government securities. To cover any liquidity shortfalls and to augment its liquidity position, Santander-Chile has established lines of credit with foreign and domestic banks and also has access to Central Bank borrowings.
The following table sets forth our contractual obligations and commercial commitments by time remaining to maturity. The Bank as of the date of the filing of this 20-F has no significant purchase obligations. At December 31, 2007, the scheduled maturities of our contractual obligations and of other commercial commitments, including accrued interest, were as follows:
Contractual Obligations Due within 1
year
Due after 1year but
within 3 years
Due after 3years but
within 6 years
Due after 6 years Total 2007
(in millions of constant Ch$ as of December 2007) Deposit and other obligations (1) ............................. 6,270,194 1,528,645 77,128 11,913 7,887,880Mortgage finance bonds ........................................... 57,428 92,792 115,631 168,424 434,275Subordinated bonds .................................................. - - 133,679 364,537 498,216Bonds ....................................................................... - 337,120 319,292 568,595 1,225,007Chilean Central Bank borrowings: - - - - -Credit lines for renegotiations of Loans ................... 3,972 - - - 3,972Other Central Bank borrowings................................ 142,370 - - - 142,370Borrowings from domestic financial
institutions ........................................................... - - - - -Investments sold under agreements to
Repurchase........................................................... 166,281 - - - 166,281Foreign borrowings.................................................. 608,875 357,018 129,578 - 1,095,471Derivatives............................................................... 90,982 158,554 148,674 380,007 778,217Other obligations...................................................... 137,439 4,943 4,022 1,464 147,868
Total cash obligations .............................. 7,477,541 2,479,072 928,004 1,494,940 12,379,557
(1) Excludes demand deposit accounts and saving accounts.
Operational Leases
Certain bank premises and equipment are leased under various operating leases. Future minimum rental commitments as of December 31, 2007, under non-cancelable leases are as follows:
As of December 31, 2007
(in millions of constant Ch$ as
of December 31, 2007) Due within 1 year ..................................................................................................................... 10,093 Due after 1 year but within 2 years........................................................................................... 7,073 Due after 2 years but within 3 years ......................................................................................... 5,238 Due after 3 years but within 4 years ......................................................................................... 3,477 Due after 4 years but within 5 years ......................................................................................... 1,559 Due after 5 years....................................................................................................................... 402
Total.......................................................................................................................... 27,842 Other Commercial Commitments
At December 31, 2007, the scheduled maturities of other commercial commitments, including accrued interest, were as follows:

62
Other Commercial Commitments Due within 1
year
Due after 1year but
within 3 years
Due after 3years but
within 6 years
Due after 6 years Total 2007
(in millions of constant Ch$ as of December 2007) Letters of credit ........................................................ 193,996 19,388 23,277 - 236,661Guarantees................................................................ 586,546 28,398 12,698 - 627,642Other commercial commitments .............................. 325,135 915 - 326,050
Total other commercial commitments.............. 1,105,677 48,701 35,975 - 1,190,353 Capital and Reserves
We currently have regulatory capital in excess of the minimum requirement under the current Chilean regulations. According to the General Banking Law, a bank should have regulatory capital of at least 8% of its risk weighted assets, net of required loan loss allowances, and paid in capital and reserves (i.e., the basic capital, as defined above) of at least 3% of its total assets, net of required loan loss allowances. For these purposes, the regulatory capital of a bank is the sum of (1) the bank’s basic capital, (2) subordinated bonds issued by the bank valued at their placement price for an amount up to 50% of its basic capital; provided that the value of the bonds shall decrease by 20% for each year that elapses during the period commencing six years prior to their maturity, and (3) its voluntary allowances for loan losses, for an amount of up to 1.25% of its risk weighted assets. The merger of Old Santander-Chile and Santiago required a special regulatory preapproval of the Superintendency of Banks, which was granted on May 16, 2002. The resolution granting this preapproval imposed a regulatory capital to risk weighted assets ratio of 12% for the merged bank. This indicator was reduced to 11% by the Superintendency of Banks effective January 1, 2005. For purposes of weighing the risk of a bank’s assets, the General Banking Law considers five different categories of assets, based on the nature of the issuer, the availability of funds, the nature of the assets and the existence of collateral securing such assets.
The following table sets forth our regulatory capital at the dates indicated. See Note 13 to our financial statements for a description of the minimum capital requirements.
As of December 31,
2006 2007
(in millions of constant Ch$ as of December 31,
2007, except percentages) Base net capital .................................................................................. 1,031,163 1,129,395 3% of total assets net of provisions ..................................................... (495,637) (560,816) Excess over minimum required equity ................................................ 535,526 568,579 Base net capital as a percentage of the total assets, net of
provisions........................................................................................ 6.2% 6.0%Regulatory capital ............................................................................... 1,524,308 1,602,43211% of risk-weighted assets ................................................................ (1,326,302) (1,439,641)Excess over minimum required equity ................................................ 198,006 162,791Regulatory capital as a percentage of risk-weighted assets ................. 12.6% 12.2% In 2009, the Superintendence of Banks and the Chilean Congress should approve new capital requirements for Chilean banks in line with Basel II accord, which among other amendments require banks to set aside capital for market and operational risks. This could have a significant impact on minimum capital requirements. Financial Investments
The following table sets forth our investment in Chilean government and corporate securities and certain other financial investments at the dates indicated. Financial investments that have a secondary market are carried at market value. All other financial investments are carried at acquisition cost, plus accrued interest and indexation readjustments, as applicable.

63
a) Trading
As of December 31,
2006 2007
(in millions of constant Ch$ as of
December 31, 2007)
Central Bank and Government Securities Central Bank securities............................................................................ 409,626 804,086 Chilean Treasury Bonds .......................................................................... 43,536 117,240 Other securities........................................................................................ 383 -
Subtotal ............................................................................................ 453,545 921,326 Others Financial Securities
Time deposits in Chilean financial institutions ....................................... 3,819 10,039 Mortgage finance bonds .......................................................................... 24,914 32,713 Chilean financial institutions bonds ........................................................ 47 7,742 Chilean corporate bonds.......................................................................... 24,240 11,541 Other Chilean securities .......................................................................... 7,805 15,343 Other foreign securities ........................................................................... 172,667 6,927
Subtotal ............................................................................................ 233,492 84,305 Total .......................................................................................... 687,037 1,005,631
b) Available for sale
As of December 31,
2006 2007
(in millions of constant Ch$ as of
December 31, 2007)
Central Bank and Government Securities Central Bank securities............................................................................ 83,522 336,866Chilean Treasury Bonds .......................................................................... 670 109,194Other securities........................................................................................ 19,909 -
Subtotal ............................................................................................ 104,101 446,060Others Financial Securities
Mortgage finance bonds .......................................................................... 239,239 273,010Central Bank and Government Foreign Securities .................................. - 60,565Other Foreign securities .......................................................................... 27,444 -
Subtotal ............................................................................................ 266,683 333,575Total .......................................................................................... 370,784 779,635
c) Held-to-maturity
No financial investments were classified as held-to-maturity as of December 31, 2006 and 2007.
The following table sets forth an analysis of our investments at December 31, 2007, by remaining maturity and the weighted average nominal rates of such investments.
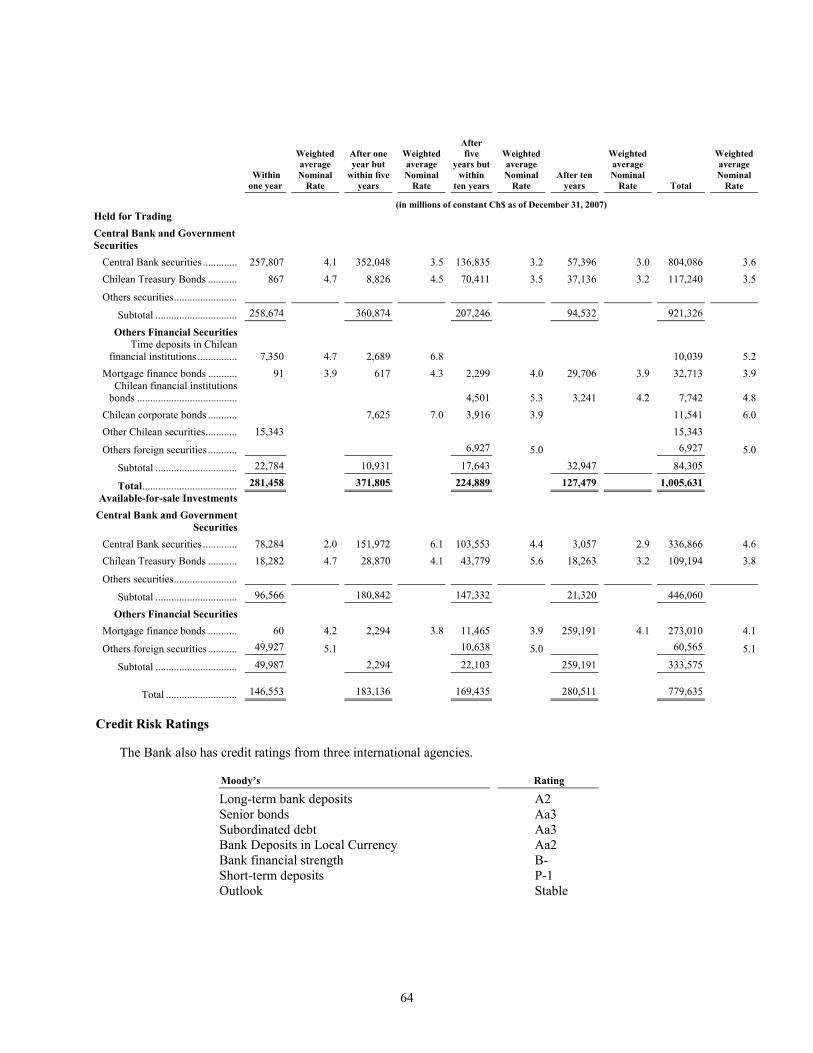
64
Within one year
Weighted average Nominal
Rate
After one year but
within five years
Weighted average Nominal
Rate
After five
years but within
ten years
Weighted average Nominal
Rate After ten
years
Weighted average Nominal
Rate Total
Weighted average Nominal
Rate
(in millions of constant Ch$ as of December 31, 2007) Held for Trading Central Bank and Government Securities
Central Bank securities ............. 257,807 4.1 352,048 3.5 136,835 3.2 57,396 3.0 804,086 3.6Chilean Treasury Bonds ........... 867 4.7 8,826 4.5 70,411 3.5 37,136 3.2 117,240 3.5
Others securities........................
Subtotal ............................... 258,674 360,874 207,246 94,532 921,326
Others Financial Securities Time deposits in Chilean
financial institutions ............... 7,350 4.7 2,689 6.8 10,039 5.2Mortgage finance bonds ........... 91 3.9 617 4.3 2,299 4.0 29,706 3.9 32,713 3.9
Chilean financial institutions bonds ...................................... 4,501 5.3 3,241 4.2 7,742 4.8
Chilean corporate bonds ........... 7,625 7.0 3,916 3.9 11,541 6.0Other Chilean securities............ 15,343 15,343
Others foreign securities ........... 6,927 5.0 6,927 5.0
Subtotal ............................... 22,784 10,931 17,643 32,947 84,305
Total.................................... 281,458 371,805 224,889 127,479 1,005,631Available-for-sale Investments
Central Bank and Government Securities
Central Bank securities ............. 78,284 2.0 151,972 6.1 103,553 4.4 3,057 2.9 336,866 4.6Chilean Treasury Bonds ........... 18,282 4.7 28,870 4.1 43,779 5.6 18,263 3.2 109,194 3.8
Others securities........................
Subtotal ............................... 96,566 180,842 147,332 21,320 446,060
Others Financial Securities Mortgage finance bonds ........... 60 4.2 2,294 3.8 11,465 3.9 259,191 4.1 273,010 4.1
Others foreign securities ........... 49,927 5.1 10,638 5.0 60,565 5.1
Subtotal ............................... 49,987 2,294 22,103 259,191 333,575
Total ........................... 146,553 183,136 169,435 280,511 779,635
Credit Risk Ratings
The Bank also has credit ratings from three international agencies.
Moody’s Rating
Long-term bank deposits A2 Senior bonds Aa3 Subordinated debt Aa3 Bank Deposits in Local Currency Aa2 Bank financial strength B- Short-term deposits P-1 Outlook Stable
65
Standard & Poor’s Rating
Long-term Foreign Issuer Credit A+ Long-term Local Issuer Credit A+ Short-term Foreign Issuer Credit A-1 Short-term Local Issuer Credit A-1 Outlook Stable
Fitch Rating
Foreign Currency Long-term Debt A+ Local Currency Long-term Debt A+ Foreign Currency Short-term Debt F1 Local Currency Short-term Debt F1 Individual rating B Outlook Stable
Working Capital
As a bank, we satisfy our working capital needs through general funding, the majority of which derives from deposits and other borrowings from the public. (See “Item 5: E. Liquidity and Capital Resources—Deposits and Other Borrowings”). In our opinion, our working capital is sufficient for our present needs.
Liquidity Management
Liquidity management seeks to ensure that, even under adverse conditions, we have access to the funds necessary to cover client needs, maturing liabilities and capital requirements. Liquidity risk arises in the general funding for our financing, trading and investment activities. It includes the risk of unexpected increases in the cost of funding the portfolio of assets at appropriate maturities and rates, the risk of being unable to liquidate a position in a timely manner at a reasonable price and the risk that we will be required to repay liabilities earlier than anticipated.
Our general policy is to maintain liquidity adequate to ensure our ability to honor withdrawals of deposits, make repayments of other liabilities at maturity, extend loans and meet our own working capital needs. Our minimum amount of liquidity is determined by the statutory reserve requirements of the Central Bank. Deposits are subject to a statutory reserve requirement of 9% for demand deposits and 3.6% for Chilean peso, UF-denominated and foreign currency denominated time deposits with a term of less than a year. (See “Item 4: D. Regulation and Supervision”). The Central Bank has statutory authority to increase these percentages to up to 40% for demand deposits and up to 20% for time deposits. In addition, a 100% special reserve (reserva técnica) applies to demand deposits, deposits in checking accounts, other demand deposits received or obligations payable on sight and incurred in the ordinary course of business, other than deposits unconditionally payable immediately or within a term of less than 30 days and other time deposits payable within 10 days. This special reserve requirement applies to the amount by which the total of such deposits exceeds 2.5 times the amount of a bank’s regulatory capital. Interbank loans are deemed to have a maturity of more than 30 days, even if payable within the following 10 days.
The Central Bank also requires us to comply with the following liquidity limits:
• Our total liabilities with maturities of less than 30 days cannot exceed our total assets with maturities of less than 30 days by an amount greater than our capital. This limit must be calculated in local currency and foreign currencies together as one gap.
• Our total liabilities with maturities of less than 90 days cannot exceed our total assets with maturities of less than 90 days by more than twice of our capital. This limit must be calculated in local currency and foreign currencies together as one gap.
We have set other liquidity limits and ratios that minimize liquidity risk. See “Item 11: Quantitative and Qualitative Disclosure About Market Risk.”

66
Cash Flow
The tables below set forth our main sources of cash. The subsidiaries are not an important source of cash flow for us and therefore have no impact on our ability to meet our cash obligations. No legal or economic restrictions exist on the ability of subsidiaries to transfer funds to us in the form of loans or cash dividends as long as these subsidiaries abide by the regulations of the Ley de Sociedad Anónimas regarding loans to related parties and minimum dividend payments.
Year ended December 31,
2005 2006 2007
(in millions of constant Ch$ as of
December 31, 2007) Net cash provided by operating activities....................................................... 358,433 467,772 547,980
Cash provided by operating activities increased by Ch$80,208 million in 2007 compared to 2006 despite net income only rising by Ch$1,818 million as increases in business activity was partially offset by an increase in two relevant non-cash expenses: (i) provision for loan losses and (ii) price level restatement.
The Ch$109,339 million rise in cash provided by operating activities in 2006 compared to 2005 was mainly due to an increase in business activity and a decrease in the net change in interest accruals in the same period.
Year ended December 31,
2005 2006 2007
(in millions of constant Ch$ as of
December 31, 2007) Net cash provided by (used in) investing activities ........................................ (733,299) (1,284,454) (1,588,064)
Net cash used in investing activities in 2007 totaled Ch$1,588,064 million compared to Ch$1,284,454 million due to a higher growth of interest earning assets in 2007 compared to 2006.
Year ended December 31,
2005 2006 2007
(in millions of constant Ch$ as of
December 31, 2007) Net cash provided by (used in) financing activities........................................ 637,121 653,626 1,156,430
In 2007, the net case from financing activities increased Ch$502,804 million compared to 2006 due to larger proceeds from bonds issued in the year.

67
Deposits and Other Borrowings
The following table sets forth our average daily balance of liabilities for the years ended December 31, 2005, 2006 and 2007, in each case together with the related average nominal interest rates paid thereon.
Year ended December 31,
2005 2006 2007
Average Balance
% of Total Average
Liabilities
Average Nominal
Rate Average Balance
% of TotalAverage
Liabilities
Average Nominal
Rate Average Balance
% of TotalAverage
Liabilities
Average Nominal
Rate
(in millions of constant Ch$ as of December 31, 2007, except percentages) Savings accounts ................... 126,896 0.9% 4.3% 113,724 0.7% 1.3% 97,873 0.6% 6.2%Time deposits ........................ 5,578,890 37.7% 4.7% 6,878,120 43.5% 5.6% 7,221,846 43.6% 7.5%Central Bank borrowings ...... 138,754 0.9% 3.7% 90,359 0.6% 5.1% 115,129 0.7% 5.6%Repurchase agreements......... 567,134 3.8% 5.0% 586,667 3.7% 4.9% 596,131 3.6% 6.5%Mortgage finance bonds........ 881,875 6.0% 9.4% 621,444 3.9% 7.5% 473,126 2.9% 12.4%Other interest bearing
liabilities ........................... 1,966,217 13.2% 5.6% 2,318,502 14.7% 6.2% 2,256,925 13.6% 8.4%Subtotal interest bearing
liabilities ........................... 9,259,766 62.5% 5.3% 10,608,816 67.1% 5.7% 10,761,030 65.0% 7.8%Non-interest bearing
liabilities Non-interest bearing
deposits ............................. 2,090,323 14.1% 1,958,651 12.4% 2,171,605 13.1%Contingent liabilities ............. 960,937 6.5% 1,020,384 6.5% 1,050,692 6.3%Other non-interest bearing
liabilities ........................... 1,407,631 9.5% 989,257 6.2% 1,248,080 7.6%Shareholders’ equity.............. 1,090,930 7.4% 1,235,728 7.8% 1,317,199 8.0%Subtotal non-interest
bearing liabilities .............. 5,549,821 37.5% 5,204,020 32.9% 5,787,576 35.0%
Total liabilities ............. 14,809,587 100.0% 15,812,836 100.0% 16,548,606 100.0%
Our most important source of funding is our time deposits. Average time deposits represented 43.6% of our
average total liabilities and shareholders’ equity in 2007. Our current funding strategy is to continue to utilize all sources of funding in accordance with their costs, their availability and our general asset and liability management strategy. Special emphasis is being placed on lengthening the maturities of time deposits with institutional clients and increasing in general our deposits from retail customers. We also intend to continue to broaden our customer deposit base and to emphasize core deposit funding. We have also followed the strategy in 2007 of increasing senior and subordinated bonds to increase the duration of liabilities and fund the growth of the mortgage portfolio. We believe that broadening our deposit base by increasing the number of account holders has created a more stable funding source.
Composition of Deposits and Other Commitments
The following table sets forth the composition of our deposits and similar commitments at December 31, 2005, 2006 and 2007.
At December 31,
2005 2006 2007
(in millions of constant Ch$ as of December 31,
2007) Checking accounts............................................................................. 1,597,407 1,787,172 1,984,910Other demand liabilities .................................................................... 733,272 820,027 880,903Savings accounts ............................................................................... 120,056 108,351 97,155Time deposits .................................................................................... 6,360,653 7,315,038 7,790,725Other commitments (1) ..................................................................... 48,892 60,534 67,662
Total ........................................................................................... 8,860,280 10,091,122 10,821,355
(1) Includes primarily leasing accounts payable relating to purchases of equipment.

68
Maturity of Deposits
The following table sets forth information regarding the currency and maturity of our deposits at December 31, 2007, expressed in percentages of our total deposits in each currency category. UF-denominated deposits are similar to peso-denominated deposits in all respects, except that the principal is readjusted periodically based on variations in the Chilean consumer price index.
Ch$ UF Foreign
Currencies Total
Demand deposits ........................................................... 2.0 - - 0.9 Savings accounts ........................................................... - 2.8 - 1.2 Time deposits: Maturing within 3 months ............................................. 62.1 19.8 84.7 47.6 Maturing after 3 but within 6 months............................ 11.8 16.5 14.8 14.2 Maturing after 6 but within 12 months.......................... 13.4 25.1 0.4 16.3 Maturing after 12 months.............................................. 10.7 35.8 0.1 19.8
Total time deposits ................................................. 98.0 97.2 100.0 97.9 Total deposits.................................................. 100.0 100.0 100.0 100.0
The following table sets forth information regarding the maturity of our outstanding time deposits in excess of
US$100,000 at December 31, 2007.
Ch$ UF Foreign
Currencies Total
(in millions of constant Ch$ as of December 31, 2007)
Time deposits: Maturing within 3 months...................................... 1,728,761 627,472 940,327 3,296,560Maturing after 3 but within 6 months..................... 372,583 556,665 175,689 1,104,937Maturing after 6 but within 12 months................... 448,138 792,832 4,252 1,245,222Maturing after 12 months....................................... 333,326 1,094,374 212 1,427,912
Total time deposits.......................................... 2,882,808 3,071,343 1,120,480 7,074,631 Short-term Borrowings
The principal categories of our short-term borrowings are amounts borrowed under foreign trade lines of credit, domestic interbank loans, Central Bank borrowings and repurchase agreements. The table below presents the amounts outstanding at each year-end indicated and the weighted-average nominal interest rate for each such year by type of short-term borrowing.
As of December 31,
2005 2006 2007
Balance
Weighted-Average Nominal Interest
Rate Balance
Weighted-Average Nominal Interest
Rate Balance
Weighted-Average Nominal Interest
Rate
(in millions of constant Ch$ as of December 31, 2007, except for rate data) Balances under repurchase
agreements................................. 54,616 1.8% 21,412 4.9% 166,281 6.5%Central Bank borrowings .............. 190,038 2.1% 144,418 5.1% 142,370 5.6%Domestic interbank
borrowings................................. 2,774 1.6% - - - -Borrowings under foreign
trade credit lines ........................ 1,134,485 4.0% 771,397 7.7% 608,875 13.4%Total short-term
borrowings.......................... 1,381,913 2.4% 937,227 6.6% 917,526 10.9%

69
The following table shows the average balance and the average nominal rate for each short-term borrowing category for the years indicated.
For the year Ended December 31,
2005 2006 2007
Average Balance
Average Nominal
Interest RateAverage Balance
Average Nominal
Interest Rate Average Balance
Average Nominal
Interest Rate
(in millions of constant Ch$ as of December 31, 2007, except for rate data) Balances under repurchase
agreements................................. 567,134 5.0% 586,667 4.9% 596,131 6.5% Central Bank borrowings .............. 138,754 3.7% 90,359 5.1% 115,129 5.6% Domestic interbank
borrowings................................. 45,726 3.6% 52,961 5.1% -- -- Borrowings under foreign
trade credit lines ........................ 342,528 9.6% 1,230,766 5.4% 1,095,196 13.4% Total short-term
borrowings.......................... 1,094,142 5.0% 1,960,753 6.9% 1,806,456 10.6%
The following table presents the maximum month-end balances of our principal sources of short-term borrowings during the years indicated.
Maximum 2005
Month-End Balance
Maximum 2006
Month-End Balance
Maximum 2007
Month-End Balance
(in millions of constant Ch$ as of December 31, 2007)Balances under repurchase agreements .............................................. 636,914 469,654 201,600 Central Bank borrowings.................................................................... 406,858 327,222 427,568 Domestic interbank borrowings.......................................................... 47,170 4,058 4,822 Borrowings under foreign trade credit lines ....................................... 540,581 1,887,354 1,423,567
Total short-term borrowings........................................................ 1,631,523 2,688,288 2,057,557 Total Borrowings
Our long-term and short-term borrowings are summarized below. Borrowings are generally classified as short-term when they have original maturities of less than one year or are due on demand. All other borrowings are classified as long-term, including the amounts due within one year on such borrowings. The following table sets forth, at the dates indicated, the components of our borrowings.

70
December 31, 2007
Long-term Short-term Total
(in millions of constant Ch$ as of December 31, 2007) Central Bank borrowings .................................................. - 142,370 142,370Credit lines for renegotiations of loans ............................. - 3,972 3,972Balances under repurchase agreements............................. - 166,281 166,281Mortgage finance bonds.................................................... 376,847 57,428 434,275Other borrowings: bonds................................................... 1,225,007 - 1,225,007Subordinated bonds........................................................... 498,216 - 498,216Foreign borrowings ........................................................... 486,596 608,875 1,095,471Other obligations............................................................... 10,429 137,439 147,868
Total borrowings........................................................ 2,597,095 1,116,365 3,713,460
December 31, 2006
Long-term Short-term Total
(in millions of constant Ch$ as of December 31, 2006) Central Bank borrowings .................................................. - 144,418 144,418Credit lines for renegotiations of loans (a)........................ - 5,458 5,458Balances under repurchase agreements............................. - 21,412 21,412Mortgage finance bonds (b) .............................................. 499,288 70,365 569,653Other borrowings: bonds (c) ............................................. 606,513 1,225 607,738Subordinated bonds (d) ..................................................... 483,611 43,292 526,903Foreign borrowings (e)...................................................... 101,303 771,397 872,700Other obligations (f).......................................................... 12,863 56,106 68,969
Total borrowings........................................................ 1,703,578 1,113,673 2,817,251
(a) Credit lines for renegotiations of loans
Central Bank borrowings include credit lines for the renegotiations of loans and other Central Bank borrowings. These credit lines were provided by the Central Bank for the renegotiations of loans due to the need to refinance debts as a result of the economic recession and crisis of the banking system in the early 1980’s. The lines for the renegotiations, which are considered long-term, are related with mortgage loans linked to the UF index and bore a real annual interest rate of 3.0% and 3.0% as of December 31, 2006 and 2007, respectively. The following table sets forth, at the dates indicated, our credit lines for renegotiations of loans.
At December 31,
2006 2007
(in millions of constant Ch$ as of
December 31, 2007) Total credit lines for renegotiations of loans .................................. 5,458 3,972
The maturities of the outstanding amounts due under these credit lines, which are considered long-term, are as
follows:
At December 31, 2007
(in millions of constant Ch$ as of
December 31, 2007)
Due within 1 year ........................................................................... 3,972 Total ............................................................................................... 3,972
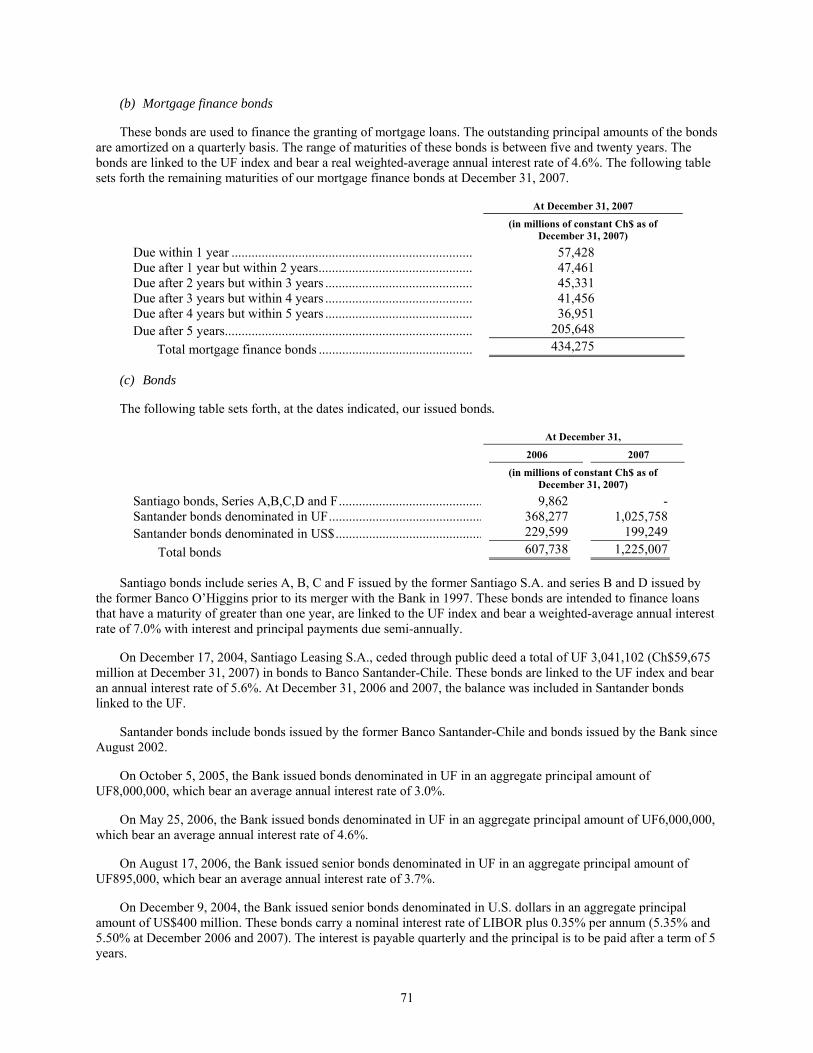
71
(b) Mortgage finance bonds
These bonds are used to finance the granting of mortgage loans. The outstanding principal amounts of the bonds are amortized on a quarterly basis. The range of maturities of these bonds is between five and twenty years. The bonds are linked to the UF index and bear a real weighted-average annual interest rate of 4.6%. The following table sets forth the remaining maturities of our mortgage finance bonds at December 31, 2007.
At December 31, 2007
(in millions of constant Ch$ as of
December 31, 2007) Due within 1 year ........................................................................ 57,428 Due after 1 year but within 2 years.............................................. 47,461 Due after 2 years but within 3 years ............................................ 45,331 Due after 3 years but within 4 years ............................................ 41,456 Due after 4 years but within 5 years ............................................ 36,951 Due after 5 years.......................................................................... 205,648
Total mortgage finance bonds .............................................. 434,275
(c) Bonds
The following table sets forth, at the dates indicated, our issued bonds.
At December 31,
2006 2007
(in millions of constant Ch$ as of
December 31, 2007) Santiago bonds, Series A,B,C,D and F........................................... 9,862 - Santander bonds denominated in UF.............................................. 368,277 1,025,758 Santander bonds denominated in US$............................................ 229,599 199,249
Total bonds 607,738 1,225,007
Santiago bonds include series A, B, C and F issued by the former Santiago S.A. and series B and D issued by the former Banco O’Higgins prior to its merger with the Bank in 1997. These bonds are intended to finance loans that have a maturity of greater than one year, are linked to the UF index and bear a weighted-average annual interest rate of 7.0% with interest and principal payments due semi-annually.
On December 17, 2004, Santiago Leasing S.A., ceded through public deed a total of UF 3,041,102 (Ch$59,675 million at December 31, 2007) in bonds to Banco Santander-Chile. These bonds are linked to the UF index and bear an annual interest rate of 5.6%. At December 31, 2006 and 2007, the balance was included in Santander bonds linked to the UF.
Santander bonds include bonds issued by the former Banco Santander-Chile and bonds issued by the Bank since August 2002.
On October 5, 2005, the Bank issued bonds denominated in UF in an aggregate principal amount of UF8,000,000, which bear an average annual interest rate of 3.0%.
On May 25, 2006, the Bank issued bonds denominated in UF in an aggregate principal amount of UF6,000,000, which bear an average annual interest rate of 4.6%.
On August 17, 2006, the Bank issued senior bonds denominated in UF in an aggregate principal amount of UF895,000, which bear an average annual interest rate of 3.7%.
On December 9, 2004, the Bank issued senior bonds denominated in U.S. dollars in an aggregate principal amount of US$400 million. These bonds carry a nominal interest rate of LIBOR plus 0.35% per annum (5.35% and 5.50% at December 2006 and 2007). The interest is payable quarterly and the principal is to be paid after a term of 5 years.

72
During 2007, the Bank issued senior bonds in the local market for a total of UF 34 million (Ch$667,170 million as of December 31, 2007). Below is a detail of the bonds issued.
Senior bonds 2007
Series Amount Maturity Interest rate (%) O UF 5,000,000 4 years 3.30% per year , simple P UF 3,000,000 7 years 3.50% per year, simple Q UF 2,000,000 9 years 3.70% per year, simple R UF 2,000,000 20 years 3.90% per year, compounded S UF 2,000,000 30 years 4.10% per year, compounded T UF 5,000,000 4 years 3.30% per year, simple U UF 5,000,000 6 years 3.70% per year, simple V UF 5,000,000 10 years 3.90% per year, simple W UF 5,000,000 10 years 4.10% per year, simple UF 34,000,000
The maturities of these bonds are as follows:
As of December 31, 2007
(in millions of constant Ch$ as of
December 31, 2007) Due within 1 year ........................................................................ - Due after 1 year but within 2 years.............................................. 199,249 Due after 2 years but within 3 years ............................................ 137,872 Due after 3 years but within 4 years ............................................ 209,543 Due after 4 years but within 5 years ............................................ 9,390 Due after 5 years.......................................................................... 668,953
Total bonds........................................................................... 1,225,007
(d) Subordinated bonds
The following table sets forth, at the dates indicated, the balances of our subordinated bonds.
As of December 31,
2006 2007
(in millions of constant Ch$ as of
December 31, 2007) Santiago bonds denominated in US$ (1) ........................................ 45,880 - Santander bonds denominated in US$ (2) (3)................................. 292,433 263,676 Santiago Bonds linked to the UF (4) .............................................. 52,664 47,401 Santander Bonds linked to the UF (5) (6) (7) ................................. 135,926 187,139
Total subordinated bonds ........................................................ 526,903 498,216
(1) On July 17, 1997, the former Banco Santiago issued subordinated bonds denominated in U.S. dollars in an aggregate principal amount of US$300 million. The bonds carry a nominal interest rate of 7.0% per annum, with semi-annual interest payments and one repayment of principal after a term of 10 years. These were paid in full in 2007.
(2) On January 16, 2003, the Bank completed the voluntary exchange for its new subordinated bonds, which will mature in 2012. A total of US$221,961,000 in principal of the Santiago bonds was offered and redeemed by the Bank. The bonds carry a nominal interest rate of 7.375% per annum, with semi-annual interest payments and one repayment of principal after a term of 10 years.
(3) On December 9, 2004, the Bank issued subordinated bonds denominated in U.S. dollars in an aggregate principal amount of US$300 million. These bonds carry a nominal interest rate of 5.375% per annum, with semi-annual interest payments and one repayment of principal after a term of 10 years.

73
(4) The Series C and E Bonds outstanding as of December 31, 2005 and 2006, are intended for the financing of loans with a maturity of greater than one year. They are linked to the UF index and carry an annual interest rate of 7.5% and 6.0% respectively, with interest and principal payments due semi-annually.
(5) Includes Series C, D and E Bonds, which are linked to the UF index and carry an annual interest rate of 7.0%, with interest and principal payments due semi-annually.
(6) During 2006, the Bank issued subordinated bonds denominated in UF in an aggregate principal amount of UF5,000,000, which bear an average annual rate of 4.4%.
(7) During 2007, the Bank issued subordinated bonds in the local market for a total of UF 4 million (Ch$78,491 million as of December 31, 2007). Below is a detail of the bonds issued.
Subordinated bonds Series Amount Maturity Interest rate (%) Z UF 2,000,000 25 años No interest X UF 2,000,000 25 años 4.00% per year, simple UF 4,000,000
The maturities of these bonds, which are considered long-term, are as follows.
As of December 31, 2007
(in millions of constant Ch$ as of
December 31, 2007) Due within 1 Year ....................................................................... - Due after 1 year but within 2 years.............................................. - Due after 2 years but within 3 years ............................................ - Due after 3 years but within 4 years ............................................ 17,349 Due after 4 years but within 5 years ............................................ 116,330 Due after 5 years.......................................................................... 364,537
Total subordinated bonds ..................................................... 498,216
(e) Foreign borrowings
These are short-term and long-term borrowings from foreign banks. The maturities of these borrowings are as follows.
As of December 31, 2007
(in millions of constant Ch$ as of
December 31, 2007) Due within 1 Year ....................................................................... 608,875 Due after 1 year but within 2 years.............................................. 241,588 Due after 2 years but within 3 years ............................................ 115,430 Due after 3 years but within 4 years ............................................ 129,578 Due after 4 years but within 5 years ............................................ - Due after 5 years.......................................................................... -
Total foreign borrowings...................................................... 1,095,471
The foreign borrowings are denominated principally in U.S. dollars, and are principally used to fund the Bank’s foreign trade loans, and bear an annual average interest rate of 5.3% and 1.3% at December 31, 2006 and 2007, respectively.
(f) Other obligations
Other obligations are summarized as follows.
As of December 31, 2007
(in millions of constant Ch$ as of
December 31, 2007) Due within 1 Year ....................................................................... 38,808

74
As of December 31, 2007
(in millions of constant Ch$ as of
December 31, 2007) Due after 1 year but within 2 years.............................................. 2,785 Due after 2 years but within 3 years ............................................ 2,158 Due after 3 years but within 4 years ............................................ 1,915 Due after 4 years but within 5 years ............................................ 1,294 Due after 5 years.......................................................................... 2,277
Total long term obligations .................................................. 49,237 Amounts due to credit card operators.......................................... 23,497 Acceptance of letters of credit ..................................................... 75,134
Total short-term obligations ................................................. 98,631 Total other obligations ......................................................... 147,868
Other Off-Balance Sheet Arrangements and Commitments
We are party to transactions with off balance sheet risk in the normal course of our business. These transactions expose us to credit risk in addition to amounts recognized in the consolidated financial statements.
These transactions include commitments to extend credit not otherwise accounted for as contingent loans, such as overdraft protection and credit card lines of credit. Such commitments are agreements to lend to a customer at a future date, subject to the customer compliance with the contractual terms. The aggregate amount of these commitments was Ch$2,480,684 million at December 31, 2007, which will be financed with our deposit base. Since a substantial portion of these commitments is expected to expire without being drawn upon, the total amount of commitments does not necessarily represent our actual future cash requirements. We use the same credit policies in making commitments to extend credit as we do for granting loans. In the opinion of our management, our outstanding commitments do not represent an unusual credit risk.
From time to time, the Bank enters into agreements to securitize certain assets by selling those assets to unconsolidated and unaffiliated entities, which then sell debt securities secured by those assets. These sales are non recourse to the Bank. However, in the past, the Bank has occasionally purchased a subordinated bond issued by the unconsolidated entity. At December 31, 2007, we did not hold any of these subordinated bonds in our investment portfolio.
Asset and Liability Management
Please refer to “Item 11: Quantitative and Qualitative Disclosure about Market Risk—Asset and Liability Management” regarding our policies with respect to asset and liability management.
Capital Expenditures
The following table reflects capital expenditures in each of the three years ended December 31, 2005, 2006 and 2007:
For the Year Ended December 31,
2005 2006 2007
(in millions of constant Ch$ as of December 31, 2007) Land and Buildings ........................................................... 6,105 10,892 12,872 Machinery and Equipment ................................................ 11,398 8,352 8,512 Furniture and Fixtures....................................................... 4,097 4,410 4,987 Vehicles ............................................................................ 929 898 390 Other ................................................................................. 1,035 2,437 3,362
Total........................................................................... 23,564 26,989 30,123
The increase in capital expenditures in 2007 compared to 2006 was mainly due to the investment in branches and ATMs. In 2008, we expect a similar level of investment in expanding our distribution network.
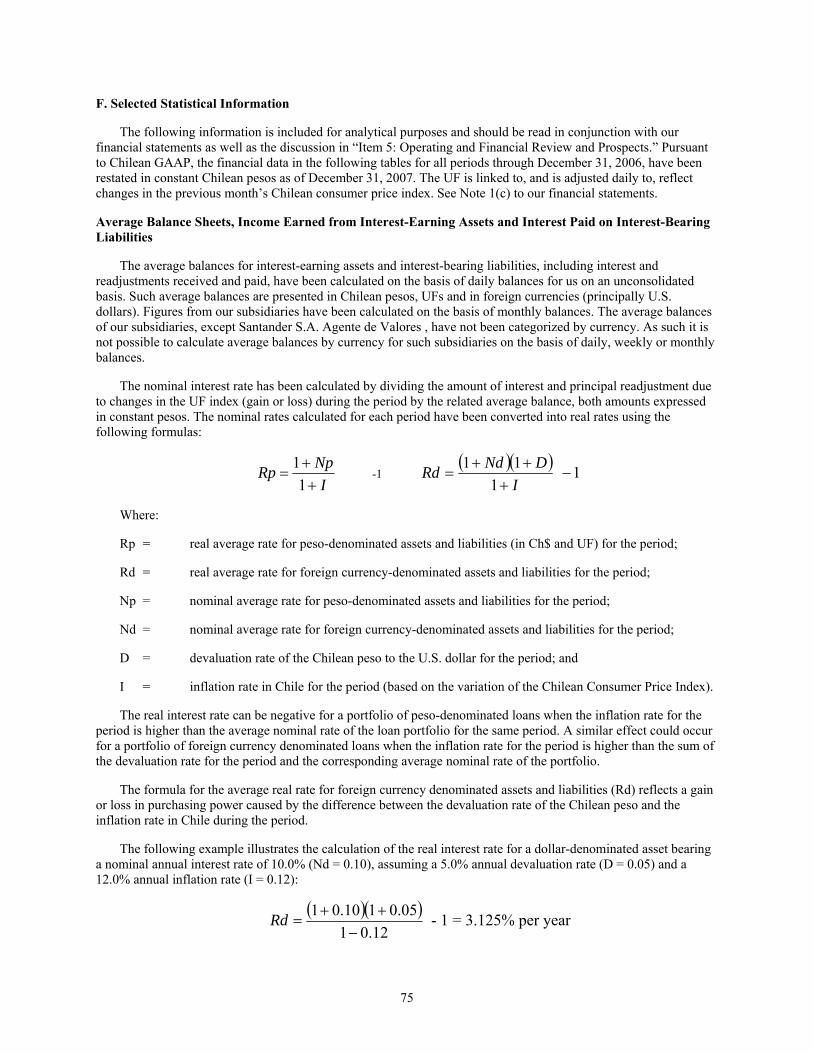
75
F. Selected Statistical Information
The following information is included for analytical purposes and should be read in conjunction with our financial statements as well as the discussion in “Item 5: Operating and Financial Review and Prospects.” Pursuant to Chilean GAAP, the financial data in the following tables for all periods through December 31, 2006, have been restated in constant Chilean pesos as of December 31, 2007. The UF is linked to, and is adjusted daily to, reflect changes in the previous month’s Chilean consumer price index. See Note 1(c) to our financial statements.
Average Balance Sheets, Income Earned from Interest-Earning Assets and Interest Paid on Interest-Bearing Liabilities
The average balances for interest-earning assets and interest-bearing liabilities, including interest and readjustments received and paid, have been calculated on the basis of daily balances for us on an unconsolidated basis. Such average balances are presented in Chilean pesos, UFs and in foreign currencies (principally U.S. dollars). Figures from our subsidiaries have been calculated on the basis of monthly balances. The average balances of our subsidiaries, except Santander S.A. Agente de Valores , have not been categorized by currency. As such it is not possible to calculate average balances by currency for such subsidiaries on the basis of daily, weekly or monthly balances.
The nominal interest rate has been calculated by dividing the amount of interest and principal readjustment due to changes in the UF index (gain or loss) during the period by the related average balance, both amounts expressed in constant pesos. The nominal rates calculated for each period have been converted into real rates using the following formulas:
INpRp
++
=1
1 -1
( )( )I
DNdRd+
++=
111
1−
Where:
Rp = real average rate for peso-denominated assets and liabilities (in Ch$ and UF) for the period;
Rd = real average rate for foreign currency-denominated assets and liabilities for the period;
Np = nominal average rate for peso-denominated assets and liabilities for the period;
Nd = nominal average rate for foreign currency-denominated assets and liabilities for the period;
D = devaluation rate of the Chilean peso to the U.S. dollar for the period; and
I = inflation rate in Chile for the period (based on the variation of the Chilean Consumer Price Index).
The real interest rate can be negative for a portfolio of peso-denominated loans when the inflation rate for the period is higher than the average nominal rate of the loan portfolio for the same period. A similar effect could occur for a portfolio of foreign currency denominated loans when the inflation rate for the period is higher than the sum of the devaluation rate for the period and the corresponding average nominal rate of the portfolio.
The formula for the average real rate for foreign currency denominated assets and liabilities (Rd) reflects a gain or loss in purchasing power caused by the difference between the devaluation rate of the Chilean peso and the inflation rate in Chile during the period.
The following example illustrates the calculation of the real interest rate for a dollar-denominated asset bearing a nominal annual interest rate of 10.0% (Nd = 0.10), assuming a 5.0% annual devaluation rate (D = 0.05) and a 12.0% annual inflation rate (I = 0.12):
( )( )12.01
05.0110.01−
++=Rd - 1 = 3.125% per year

76
In the example, since the inflation rate was higher than the devaluation rate, the real rate is lower than the nominal rate in dollars. If, for example, the annual devaluation rate were 15.0%, using the same numbers, the real rate in Chilean pesos would be 12.9%, which is higher than the nominal rate in U.S. dollars. Using the same numbers, if the annual inflation rate were greater than 15.5%, the real rate would be negative.
Contingent loans (consisting of guarantees and open and unused letters of credit) have been treated as interest-earning assets. Although the nature of the income derived from such assets is similar to a fee, Chilean banking regulations require that such income be accounted for as interest revenue. As a result of this treatment, the comparatively low rates of interest earned on these assets have a distorting effect on the average interest rate earned on total interest-earning assets.
The real rate for contingent loans has been stated as the nominal rate, since we do not have an effective funding obligation for these loans. The foreign exchange gains or losses on foreign currency-denominated assets and liabilities have not been included in interest revenue or expense. Similarly, interest on financial investments does not include trading gains or losses on these investments. Interest is not recognized during periods in which loans are past due. However, interest received on past due loans includes interest on such loans from the original maturity date.
Non-performing loans that are overdue for 90 days or less have been included in each of the various categories of loans, and therefore affect the various averages. Non-performing loans consist of loans as to which either principal or interest is overdue (i.e., non accrual loans) and restructured loans earning no interest. Non-performing loans that are overdue for 90 days or more are shown as a separate category of loans (“Past due loans”). Interest and/or indexation readjustments received on all non-performing U.S. dollar-denominated loans during the periods are included as interest revenue. However, all peso-denominated loans that are classified as non-performing do not accrue interest or indexation adjustments as interest revenue.
Included in interbank deposits are checking accounts maintained in the Central Bank and foreign banks. Such assets have a distorting effect on the average interest rate earned on total interest-earning assets because currently balances maintained in Chilean peso amounts do not earn interest, and the only balances held in a foreign currency that earn interest are those maintained in U.S. dollars, but those only earn interest on the amounts that are legally required to be held for liquidity purposes. Additionally, this account includes interest earned by overnight investments. Consequently, the average interest earned on such assets is comparatively low. We maintain these deposits in these accounts to comply with statutory requirements and to facilitate international business, rather than to earn income.
The monetary gain or loss on interest-earning assets and interest-bearing liabilities is not included as a component of interest revenue or interest expense because inflation effects are taken into account in the calculation of real interest rates.
The average balances for 2005 have been reclassified for comparative purposes in line with the changes made to the financial statements for those years under the new accounting standards adopted in 2006 regarding Financial Investments and Derivatives.

77
The following tables show, by currency of denomination, average balances and, where applicable, interest amounts and real rates for our assets and liabilities for the years ended December 31, 2005, 2006 and 2007.
Year ended December 31,
2005 2006 2007
Average Balance
Interest Earned
Average Real Rate
Average Nominal Rate
Average Balance
Interest Earned
Average Real Rate
Average Nominal Rate
Average Balance
Interest Earned
Average Real Rate
Average Nominal Rate
ASSETS Interest-earning assets Interbank deposits Ch$ ........................................... 41,521 1,800 0.7% 4.3% 24,313 1,338 3.3% 5.5% - - - -UF............................................. 11,129 802 3.5% 7.2% 7,063 470 4.4% 6.7% - - - -Foreign currencies.................... - - - - - - - - - - - -
Subtotal.................................. 52,650 2,602 1.3% 4.9% 31,376 1,808 3.6% 5.8% - - - -Financial investments Ch$ ........................................... 550,403 32,314 2.2% 5.9% 717,843 47,625 4.4% 6.6% 648,790 55,849 1.1% 8.6%UF............................................. 662,601 58,255 5.0% 8.8% 600,713 49,398 6.0% 8.2% 644,669 84,436 5.3% 13.1%Foreign currencies.................... 1,358,066 45,276 (8.3%) 3.3% 1,104,673 64,510 7.7% 5.8% 710,387 44,080 (8.3%) 6.2%
Subtotal.................................. 2,571,070 135,845 (2.6%) 5.3% 2,423,229 161,533 6.3% 6.7% 2,003,846 184,365 (0.9%) 9.2%Commercial Loans Ch$ ........................................... 3,326,667 463,999 10.0% 13.9% 3,982,715 616,584 13.1% 15.5% 4,238,656 698,148 8.4% 16.5%UF............................................. 4,168,931 361,501 4.9% 8.7% 5,169,911 362,434 4.8% 7.0% 5,525,904 656,830 4.1% 11.9%Foreign currencies.................... 688,105 27,470 (7.8%) 4.0% 734,250 43,724 7.8% 6.0% 838,385 49,181 (8.6%) 5.9%
Subtotal.................................. 8,183,703 852,970 5.9% 10.4% 9,886,876 1,022,742 8.4% 10.3% 10,602,945 1,404,159 4.8% 13.2%Mortgage loans Ch$ ........................................... 568 37 2.7% 6.4% 496 40 5.8% 8.0% 2,785 233 0.9% 8.4%UF............................................. 813,557 88,247 7.0% 10.8% 590,000 52,629 6.7% 8.9% 426,195 58,176 5.8% 13.7%Foreign currencies.................... - - - - - - - - - - -
Subtotal.................................. 814,125 88,284 7.0% 10.8% 590,496 52,669 6.7% 8.9% 428,980 58,409 5.7% 13.6%Contingent loans Ch$ ........................................... 163,467 2,079 (2.3%) 1.3% 218,149 2,976 (0.7%) 1.4% 252,616 3,088 (5.8%) 1.2%UF............................................. 241,950 2,352 (2.6%) 1.0% 286,722 3,070 (1.0%) 1.1% 275,980 3,137 (5.9%) 1.1%Foreign currencies.................... 553,038 1,054 (11.1%) 0.2% 513,165 957 2.0% 0.2% 519,060 893 (13.5%) 0.2%
Subtotal.................................. 958,455 5,485 (7.4%) 0.6% 1,018,036 7,003 0.5% 0.7% 1,047,656 7,118 (9.6%) 0.7%Past due loans Ch$ ........................................... 54,744 8,371 11.3% 15.3% 50,673 10,059 17.4% 19.8% 59,170 11,476 11.1% 19.4%UF............................................. 74,895 - (3.5%) - 49,976 - (2.1%) - 47,511 - (6.9%) -Foreign currencies.................... 1,456 - (11.3%) - 1,688 - 1.8% - 1,970 - (13.6%) -
Subtotal.................................. 131,095 8,371 2.6% 6.4% 102,337 10,059 7.6% 9.8% 108,651 11,476 2.8% 10.6%Total interest-earning
assets Ch$ ........................................... 4,137,370 508,600 8.4% 12.3% 4,994,189 678,622 11.2% 13.6% 5,202,017 768,794 6.8% 14.8%UF............................................. 5,973,063 511,157 4.8% 8.6% 6,704,385 468,001 4.8% 7.0% 6,920,259 802,579 3.9% 11.6%Foreign currencies.................... 2,600,665 73,800 (8.8%) 2.8% 2,353,776 109,191 6.5% 4.6% 2,069,802 94,154 (9.7%) 4.5%
Subtotal.................................. 12,711,098 1,093,557 3.2% 8.6% 14,052,350 1,255,814 7.3% 8.9% 14,192,078 1,665,527 3.0% 11.7%

78
Year ended December 31,
2005 2006 2007
Average Balance
Interest Earned
AverageReal Rate
AverageNominal
Rate AverageBalance
Interest Earned
AverageReal Rate
AverageNominal
Rate AverageBalance
Interest Earned
AverageReal Rate
Average Nominal
Rate
(in millions of constant Ch$ as of December 31, 2007, except for rate data) NON-INTEREST-EARNING ASSETS Cash Ch$...................................................................... 640,148 - - - 369,839 - - - 394,673 - - - UF ....................................................................... - - - - - - - - - - - - Foreign currencies .............................................. 15,664 - - - 15,260 - - - 17,595 - - -
Subtotal...................................................... 655,812 - - - 385,099 - - - 412,268 - - - Reserves for loan losses - - - - - - Ch$...................................................................... (184,069) - - - (166,397) - - - (205,786) - - - UF ....................................................................... - - - - - - - - - - - - Foreign currencies .............................................. - - - - - - - - - - - -
Subtotal...................................................... (184,069) - - - (166,397) - - - (205,786) - - - Fixed Assets - - - - - - Ch$...................................................................... 215,563 - - - 244,451 - - - 237,476 - - - UF ....................................................................... - - - - - - - - - - - - Foreign currencies .............................................. - - - - - - - - - - - -
Subtotal...................................................... 215,563 - - - 244,451 - - - 237,476 - - - Other assets - - - - - - Ch$...................................................................... 246,925 - - - 732,896 - - - 556,310 - - - UF ....................................................................... 23,756 - - - 30,769 - - - 341,174 - - - Foreign currencies .............................................. 1,140,502 - - - 533,668 - - - 1,015,086 - - -
Subtotal...................................................... 1,411,183 - - - 1,297,333 - - - 1,912,570 - - - Total non-interest earning assets - - - - - - Ch$...................................................................... 918,567 - - - 1,180,789 - - - 982,673 - - - UF ....................................................................... 23,756 - - - 30,769 - - - 341,174 - - - Foreign currencies .............................................. 1,156,166 - - - 548,928 - - - 1,032,681 - - -
Total........................................................... 2,098,489 - - - 1,760,486 - - - 2,356,528 - - - TOTAL ASSETS Ch$...................................................................... 5,055,937 508,600 - - 6,174,978 678,622 - - 6,184,690 768,794 - - UF ....................................................................... 5,996,819 511,157 - - 6,735,154 468,001 - - 7,261,433 802,579 - - Foreign currencies .............................................. 3,756,831 73,800 - - 2,902,704 109,191 - - 3,102,483 94,154 - -
Total........................................................... 14,809,587 1,093,557 - - 15,812,836 1,255,814 - - 16,548,606 1,665,527 - -
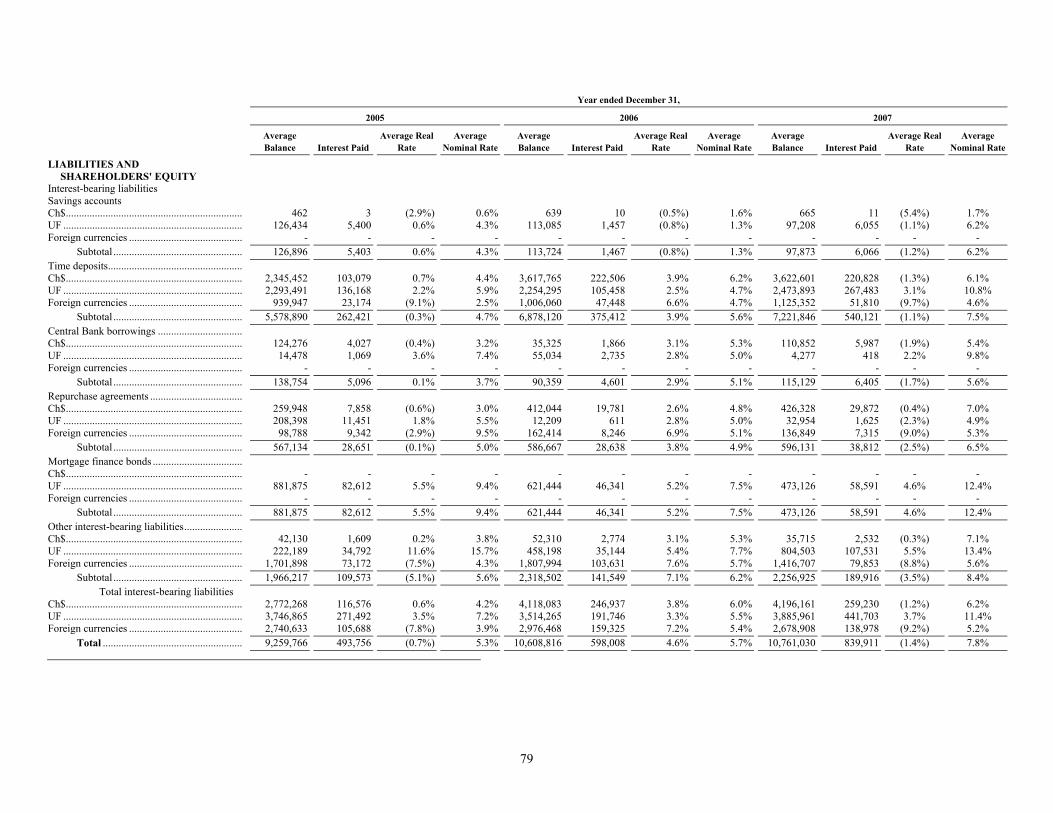
79
Year ended December 31,
2005 2006 2007
Average Balance Interest Paid
Average Real Rate
Average Nominal Rate
Average Balance Interest Paid
Average Real Rate
Average Nominal Rate
Average Balance Interest Paid
Average Real Rate
Average Nominal Rate
LIABILITIES AND SHAREHOLDERS' EQUITY
Interest-bearing liabilities Savings accounts Ch$................................................................... 462 3 (2.9%) 0.6% 639 10 (0.5%) 1.6% 665 11 (5.4%) 1.7% UF .................................................................... 126,434 5,400 0.6% 4.3% 113,085 1,457 (0.8%) 1.3% 97,208 6,055 (1.1%) 6.2% Foreign currencies ........................................... - - - - - - - - - - - -
Subtotal ................................................. 126,896 5,403 0.6% 4.3% 113,724 1,467 (0.8%) 1.3% 97,873 6,066 (1.2%) 6.2% Time deposits................................................... Ch$................................................................... 2,345,452 103,079 0.7% 4.4% 3,617,765 222,506 3.9% 6.2% 3,622,601 220,828 (1.3%) 6.1% UF .................................................................... 2,293,491 136,168 2.2% 5.9% 2,254,295 105,458 2.5% 4.7% 2,473,893 267,483 3.1% 10.8% Foreign currencies ........................................... 939,947 23,174 (9.1%) 2.5% 1,006,060 47,448 6.6% 4.7% 1,125,352 51,810 (9.7%) 4.6%
Subtotal ................................................. 5,578,890 262,421 (0.3%) 4.7% 6,878,120 375,412 3.9% 5.6% 7,221,846 540,121 (1.1%) 7.5% Central Bank borrowings ................................ Ch$................................................................... 124,276 4,027 (0.4%) 3.2% 35,325 1,866 3.1% 5.3% 110,852 5,987 (1.9%) 5.4% UF .................................................................... 14,478 1,069 3.6% 7.4% 55,034 2,735 2.8% 5.0% 4,277 418 2.2% 9.8% Foreign currencies ........................................... - - - - - - - - - - - -
Subtotal ................................................. 138,754 5,096 0.1% 3.7% 90,359 4,601 2.9% 5.1% 115,129 6,405 (1.7%) 5.6% Repurchase agreements ................................... Ch$................................................................... 259,948 7,858 (0.6%) 3.0% 412,044 19,781 2.6% 4.8% 426,328 29,872 (0.4%) 7.0% UF .................................................................... 208,398 11,451 1.8% 5.5% 12,209 611 2.8% 5.0% 32,954 1,625 (2.3%) 4.9% Foreign currencies ........................................... 98,788 9,342 (2.9%) 9.5% 162,414 8,246 6.9% 5.1% 136,849 7,315 (9.0%) 5.3%
Subtotal ................................................. 567,134 28,651 (0.1%) 5.0% 586,667 28,638 3.8% 4.9% 596,131 38,812 (2.5%) 6.5% Mortgage finance bonds .................................. Ch$................................................................... - - - - - - - - - - - - UF .................................................................... 881,875 82,612 5.5% 9.4% 621,444 46,341 5.2% 7.5% 473,126 58,591 4.6% 12.4% Foreign currencies ........................................... - - - - - - - - - - - -
Subtotal ................................................. 881,875 82,612 5.5% 9.4% 621,444 46,341 5.2% 7.5% 473,126 58,591 4.6% 12.4% Other interest-bearing liabilities...................... Ch$................................................................... 42,130 1,609 0.2% 3.8% 52,310 2,774 3.1% 5.3% 35,715 2,532 (0.3%) 7.1% UF .................................................................... 222,189 34,792 11.6% 15.7% 458,198 35,144 5.4% 7.7% 804,503 107,531 5.5% 13.4% Foreign currencies ........................................... 1,701,898 73,172 (7.5%) 4.3% 1,807,994 103,631 7.6% 5.7% 1,416,707 79,853 (8.8%) 5.6%
Subtotal ................................................. 1,966,217 109,573 (5.1%) 5.6% 2,318,502 141,549 7.1% 6.2% 2,256,925 189,916 (3.5%) 8.4% Total interest-bearing liabilities
Ch$................................................................... 2,772,268 116,576 0.6% 4.2% 4,118,083 246,937 3.8% 6.0% 4,196,161 259,230 (1.2%) 6.2% UF .................................................................... 3,746,865 271,492 3.5% 7.2% 3,514,265 191,746 3.3% 5.5% 3,885,961 441,703 3.7% 11.4% Foreign currencies ........................................... 2,740,633 105,688 (7.8%) 3.9% 2,976,468 159,325 7.2% 5.4% 2,678,908 138,978 (9.2%) 5.2%
Total ..................................................... 9,259,766 493,756 (0.7%) 5.3% 10,608,816 598,008 4.6% 5.7% 10,761,030 839,911 (1.4%) 7.8%

80
Year ended December 31,
2005 2006 2007
Average Balance Interest Paid
Average Real Rate
Average Nominal Rate
Average Balance Interest Paid
Average Real Rate
Average Nominal Rate
Average Balance Interest Paid
Average Real Rate
Average Nominal Rate
(in millions of constant Ch$ as f December 31, 2007, except for rate data) NON-INTEREST-BEARING
LIABILITIES
Non-interest-bearing demand deposits Ch$........................................................... 2,090,323 - - - 1,958,610 - - - 2,171,559 - - - UF ............................................................ - - - - 37 - - - 25 - - - Foreign currencies ................................... - - - - 4 - - - 21 - - - Subtotal .................................................... 2,090,323 - - - 1,958,651 - - - 2,171,605 - - -
Contingent obligations Ch$........................................................... 163,466 - - - 218,149 - - - 252,616 - - - UF ............................................................ 241,950 - - - 286,722 - - - 275,980 - - - Foreign currencies ................................... 555,521 - - - 515,513 - - - 522,096 - - - Subtotal .................................................... 960,937 - - - 1,020,384 - - - 1,050,692 - - -
Other non-interest-bearing liabilities Ch$........................................................... 738,720 - - - 650,520 - - - 918,851 - - - UF ............................................................ 454,110 - - - 175,902 - - - 227,932 - - - Foreign currencies ................................... 214,801 - - - 162,835 - - - 101,297 - - - Subtotal .................................................... 1,407,631 - - - 989,257 - - - 1,248,080 - - -
Shareholders’ equity Ch$........................................................... 1,090,930 - - - 1,235,728 - - - 1,317,199 - - - UF ............................................................ - - - - - - - - - - - - Foreign currencies ................................... - - - - - - - - - - - - Subtotal .................................................... 1,090,930 - - - 1,235,728 - - - 1,317,199 - - -
Total non-interest-bearing liabilities and shareholders’ equity
Ch$........................................................... 4,083,439 - - - 4,063,007 - - - 4,660,225 - - - UF ............................................................ 696,060 - - - 462,661 - - - 503,937 - - - Foreign currencies ................................... 770,322 - - - 678,352 - - - 623,414 - - - Total ........................................................ 5,549,821 - - - 5,204,020 - - - 5,787,576 - - -
TOTAL LIABILITIES AND SHAREHOLDERS’ EQUITY
Ch$........................................................... 6,855,707 116,576 8,181,090 246,937 8,856,386 259,230 UF ............................................................ 4,442,925 271,492 3,976,926 191,746 4,389,898 441,703 Foreign currencies ................................... 3,510,955 105,688 3,654,820 159,325 3,302,322 138,978 Total ......................................................... 14,809,587 493,756 15,812,836 598,008 16,548,606 839,911
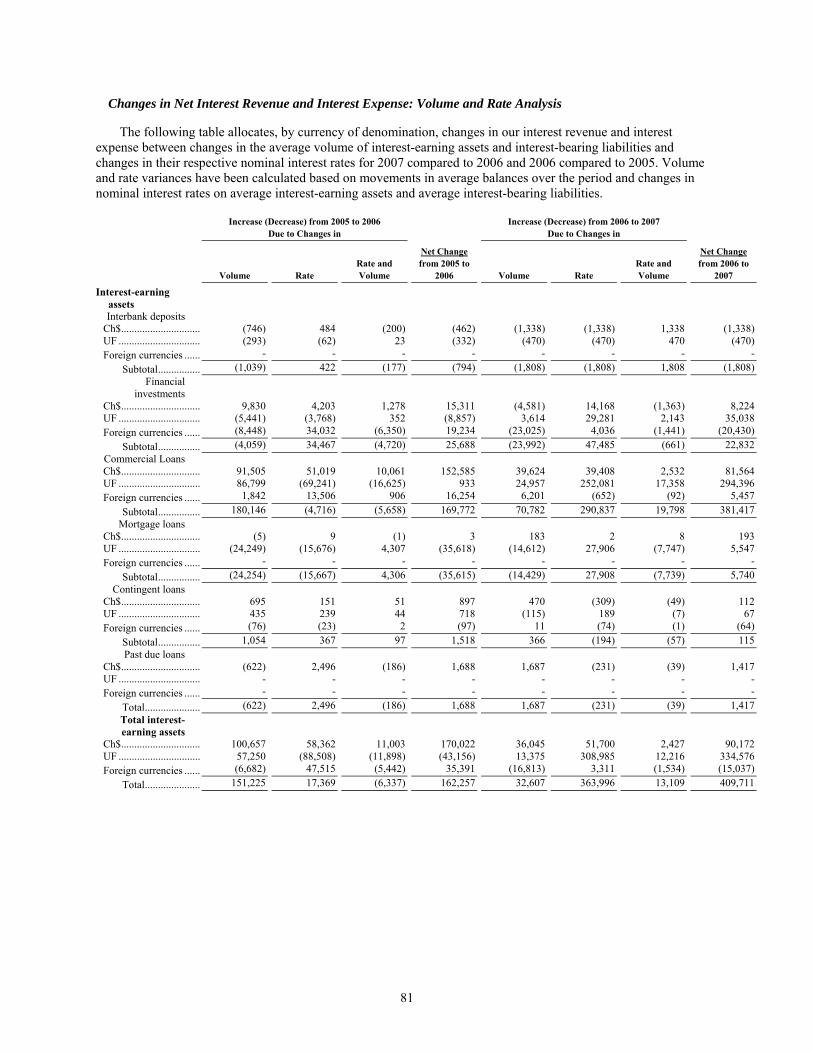
81
Changes in Net Interest Revenue and Interest Expense: Volume and Rate Analysis
The following table allocates, by currency of denomination, changes in our interest revenue and interest expense between changes in the average volume of interest-earning assets and interest-bearing liabilities and changes in their respective nominal interest rates for 2007 compared to 2006 and 2006 compared to 2005. Volume and rate variances have been calculated based on movements in average balances over the period and changes in nominal interest rates on average interest-earning assets and average interest-bearing liabilities.
Increase (Decrease) from 2005 to 2006
Due to Changes in Increase (Decrease) from 2006 to 2007
Due to Changes in
Volume Rate Rate and Volume
Net Change from 2005 to
2006 Volume Rate Rate and Volume
Net Change from 2006 to
2007
Interest-earning assets Interbank deposits
Ch$.............................. (746) 484 (200) (462) (1,338) (1,338) 1,338 (1,338)UF ............................... (293) (62) 23 (332) (470) (470) 470 (470)Foreign currencies ...... - - - - - - - -
Subtotal................ (1,039) 422 (177) (794) (1,808) (1,808) 1,808 (1,808)Financial
investments Ch$.............................. 9,830 4,203 1,278 15,311 (4,581) 14,168 (1,363) 8,224UF ............................... (5,441) (3,768) 352 (8,857) 3,614 29,281 2,143 35,038Foreign currencies ...... (8,448) 34,032 (6,350) 19,234 (23,025) 4,036 (1,441) (20,430)
Subtotal................ (4,059) 34,467 (4,720) 25,688 (23,992) 47,485 (661) 22,832Commercial Loans Ch$.............................. 91,505 51,019 10,061 152,585 39,624 39,408 2,532 81,564UF ............................... 86,799 (69,241) (16,625) 933 24,957 252,081 17,358 294,396Foreign currencies ...... 1,842 13,506 906 16,254 6,201 (652) (92) 5,457
Subtotal................ 180,146 (4,716) (5,658) 169,772 70,782 290,837 19,798 381,417Mortgage loans
Ch$.............................. (5) 9 (1) 3 183 2 8 193UF ............................... (24,249) (15,676) 4,307 (35,618) (14,612) 27,906 (7,747) 5,547Foreign currencies ...... - - - - - - - -
Subtotal................ (24,254) (15,667) 4,306 (35,615) (14,429) 27,908 (7,739) 5,740Contingent loans
Ch$.............................. 695 151 51 897 470 (309) (49) 112UF ............................... 435 239 44 718 (115) 189 (7) 67Foreign currencies ...... (76) (23) 2 (97) 11 (74) (1) (64)
Subtotal................ 1,054 367 97 1,518 366 (194) (57) 115Past due loans
Ch$.............................. (622) 2,496 (186) 1,688 1,687 (231) (39) 1,417UF ............................... - - - - - - - -Foreign currencies ...... - - - - - - - -
Total..................... (622) 2,496 (186) 1,688 1,687 (231) (39) 1,417Total interest-earning assets
Ch$.............................. 100,657 58,362 11,003 170,022 36,045 51,700 2,427 90,172UF ............................... 57,250 (88,508) (11,898) (43,156) 13,375 308,985 12,216 334,576Foreign currencies ...... (6,682) 47,515 (5,442) 35,391 (16,813) 3,311 (1,534) (15,037)
Total..................... 151,225 17,369 (6,337) 162,257 32,607 363,996 13,109 409,711

82
Increase (Decrease) from 2005 to 2006
Due to Changes in Increase (Decrease) from 2006 to 2007
Due to Changes in
Volume Rate Rate and Volume
Net Change from 2005 to
2006 Volume Rate Rate and Volume
Net Change from 2006 to
2007
Interest-bearing liabilities Savings accounts
Ch$.............................. 1 4 2 7 0 1 0 2UF ............................... (570) (3,771) 398 (3,943) (205) 5,587 (784) 4,598Foreign currencies ...... - - - - - - - -
Subtotal................ (569) (3,767) 400 (3,936) (205) 5,588 (784) 4,600Time deposits
Ch$.............................. 55,916 41,175 22,336 119,427 297 (1,972) (3) (1,678)UF ............................... (2,327) (28,877) 494 (30,711) 10,273 138,281 13,470 162,025Foreign currencies ...... 1,630 21,156 1,488 24,274 5,626 (1,129) (134) 4,363
Subtotal................ 55,219 33,454 24,318 112,990 16,196 135,180 13,333 164,710Central Bank
borrowings Ch$.............................. (2,882) 2,539 (1,817) (2,161) 3,990 42 89 4,121UF ............................... 2,995 (349) (979) 1,666 (2,523) 2,649 (2,443) (2,317)Foreign currencies ...... - - - - - - - -
Subtotal................ 113 2,190 (2,796) (495) 1,467 2,691 (2,354) 1,804Repurchase agreements
Ch$.............................. 4,598 4,621 2,704 11,923 686 9,090 315 10,091UF ............................... (10,780) (1,016) 957 (10,840) 1,039 (9) (15) 1,014Foreign currencies ...... 6,017 (4,326) (2,786) (1,096) (1,298) 436 (69) (931)
Subtotal................ (165) (721) 875 (13) 427 9,517 231 10,174Mortgage finance
bonds Ch$.............................. - - - - - - - -UF ............................... (24,397) (16,850) 4,976 (36,271) (11,060) 30,617 (7,307) 12,250Foreign currencies ...... - - - - - - -
Subtotal................ (24,397) (16,850) 4,976 (36,271) (11,060) 30,617 (7,307) 12,250Other interest-
bearing liabilities Ch$.............................. 389 625 151 1,165 (880) 933 (296) (243)UF ............................... 36,956 (17,750) (18,855) 351 26,561 26,099 19,726 72,386Foreign currencies ...... 4,561 24,379 1,520 30,460 (22,428) (1,723) 373 (23,778)
Subtotal................ 41,906 7,254 (17,184) 31,976 3,253 25,309 19,803 48,365Total interest-
bearing liabilities Ch$.............................. 58,022 48,964 23,376 130,361 4,093 8,094 105 12,292UF ............................... 1,877 (68,613) (13,009) (79,748) 24,085 203,224 22,647 249,956Foreign currencies ...... 12,208 41,209 222 53,638 (18,100) (2,416) 170 (20,346)
Total..................... 72,107 21,560 10,589 104,251 10,078 208,902 22,922 241,902

83
Interest-Earning Assets: Net Interest Margin
The following table analyzes, by currency of denomination, the levels of average interest-earning assets and net interest earned by Santander-Chile, and illustrates the comparative margins obtained, for each of the years indicated in the table.
Year ended December 31,
2005 2006 2007
( in millions of constant Ch$ as of December 31, 2007, except percentages) Total average interest-earning assets Ch$ .................................................................................. 4,137,370 4,994,189 5,202,017 UF.................................................................................... 5,973,063 6,704,385 6,920,259 Foreign currencies ........................................................... 2,600,665 2,353,776 2,069,802 Total................................................................................. 12,711,098 14,052,350 14,192,078
Net interest earned (1) Ch$ .................................................................................. 392,024 431,685 509,564 UF.................................................................................... 239,665 276,255 360,876 Foreign currencies ........................................................... (31,888) (50,134) (44,824) Total................................................................................. 599,801 657,806 825,616
Net interest margin (2) Ch$ .................................................................................. 9.5% 8.6% 9.8% UF.................................................................................... 4.0% 4.1% 5.2% Foreign currencies ........................................................... (1.2%) (2.1%) (2.2%) Total................................................................................. 4.7% 4.7% 5.8%
Net interest margin, excluding contingent loans (2) (3)
Ch$ .................................................................................. 9.9% 9.0% 10.3% UF.................................................................................... 4.2% 4.3% 5.4% Foreign currencies ........................................................... (1.6%) (2.7%) (2.9%) Total................................................................................. 5.1% 5.0% 6.3%
(1) Net interest earned is defined as interest revenue earned less interest expense incurred.
(2) Net interest margin is defined as net interest earned divided by average interest-earning assets.
(3) Pursuant to Chilean GAAP, Santander-Chile also includes contingent loans as interest-earning assets. See “Item 5: F. Selected Statistical Information—Loan Portfolio—Contingent Loans.”
Return on Equity and Assets; Dividend Payout
The following table presents certain information and selected financial ratios for Santander-Chile for the years indicated.
Year ended December 31,
2005 2006 2007
(in millions of constant Ch$ as of December 31, 2007, except for percentages) Net income....................................................................... 263,006 306,829 308,647 Average total assets ......................................................... 14,809,587 15,812,836 16,548,606 Average shareholders’ equity .......................................... 1,090,930 1,235,728 1,317,199 Net income as a percentage of:
Average total assets ..................................................... 1.8% 1.9% 1.9% Average shareholders’ equity ...................................... 24.1% 24.8% 23.4%
Average shareholders’ equity as a percentage of: Average total assets ..................................................... 7.4% 7.8% 8.0%
Declared cash dividend.................................................... 170,952 199,439 n/a Dividend payout ratio, based on net income.................... 65% 65% n/a
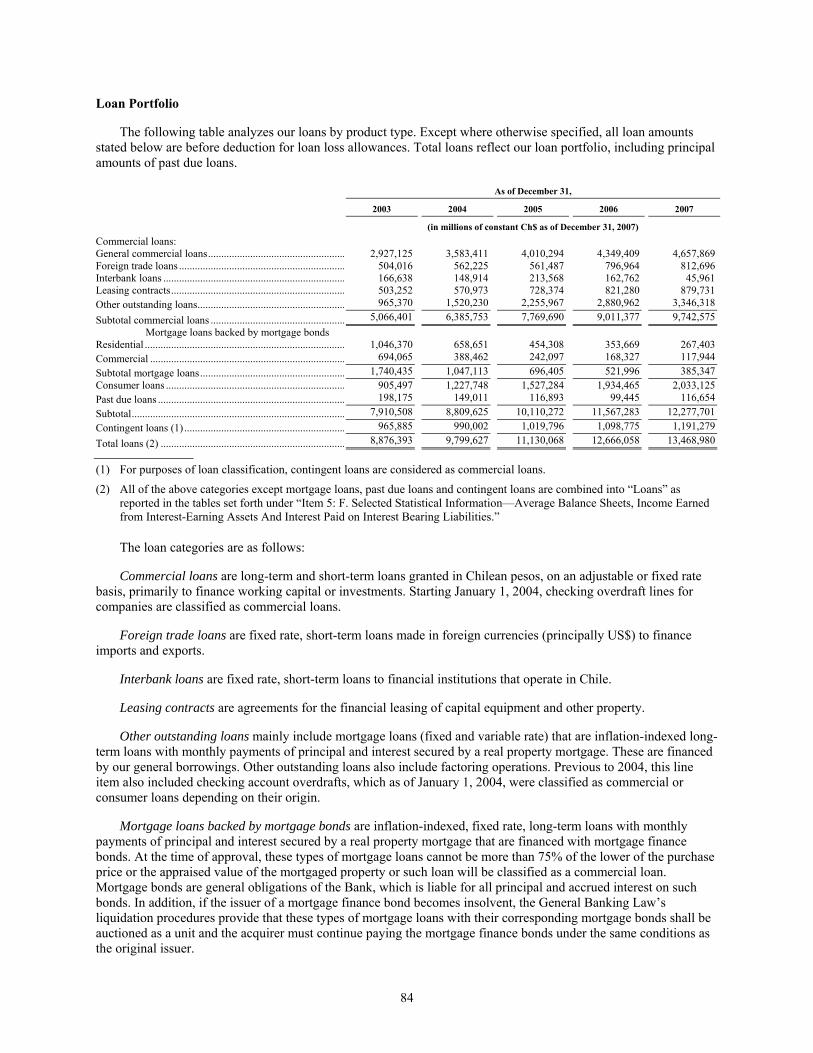
84
Loan Portfolio
The following table analyzes our loans by product type. Except where otherwise specified, all loan amounts stated below are before deduction for loan loss allowances. Total loans reflect our loan portfolio, including principal amounts of past due loans.
As of December 31,
2003 2004 2005 2006 2007
(in millions of constant Ch$ as of December 31, 2007) Commercial loans: General commercial loans.................................................... 2,927,125 3,583,411 4,010,294 4,349,409 4,657,869 Foreign trade loans ............................................................... 504,016 562,225 561,487 796,964 812,696 Interbank loans ..................................................................... 166,638 148,914 213,568 162,762 45,961 Leasing contracts.................................................................. 503,252 570,973 728,374 821,280 879,731 Other outstanding loans........................................................ 965,370 1,520,230 2,255,967 2,880,962 3,346,318
Subtotal commercial loans ................................................... 5,066,401 6,385,753 7,769,690 9,011,377 9,742,575 Mortgage loans backed by mortgage bonds
Residential ............................................................................ 1,046,370 658,651 454,308 353,669 267,403 Commercial .......................................................................... 694,065 388,462 242,097 168,327 117,944 Subtotal mortgage loans....................................................... 1,740,435 1,047,113 696,405 521,996 385,347 Consumer loans .................................................................... 905,497 1,227,748 1,527,284 1,934,465 2,033,125 Past due loans ....................................................................... 198,175 149,011 116,893 99,445 116,654 Subtotal................................................................................. 7,910,508 8,809,625 10,110,272 11,567,283 12,277,701 Contingent loans (1) ............................................................. 965,885 990,002 1,019,796 1,098,775 1,191,279
Total loans (2) ...................................................................... 8,876,393 9,799,627 11,130,068 12,666,058 13,468,980
(1) For purposes of loan classification, contingent loans are considered as commercial loans.
(2) All of the above categories except mortgage loans, past due loans and contingent loans are combined into “Loans” as reported in the tables set forth under “Item 5: F. Selected Statistical Information—Average Balance Sheets, Income Earned from Interest-Earning Assets And Interest Paid on Interest Bearing Liabilities.”
The loan categories are as follows:
Commercial loans are long-term and short-term loans granted in Chilean pesos, on an adjustable or fixed rate basis, primarily to finance working capital or investments. Starting January 1, 2004, checking overdraft lines for companies are classified as commercial loans.
Foreign trade loans are fixed rate, short-term loans made in foreign currencies (principally US$) to finance imports and exports.
Interbank loans are fixed rate, short-term loans to financial institutions that operate in Chile.
Leasing contracts are agreements for the financial leasing of capital equipment and other property.
Other outstanding loans mainly include mortgage loans (fixed and variable rate) that are inflation-indexed long-term loans with monthly payments of principal and interest secured by a real property mortgage. These are financed by our general borrowings. Other outstanding loans also include factoring operations. Previous to 2004, this line item also included checking account overdrafts, which as of January 1, 2004, were classified as commercial or consumer loans depending on their origin.
Mortgage loans backed by mortgage bonds are inflation-indexed, fixed rate, long-term loans with monthly payments of principal and interest secured by a real property mortgage that are financed with mortgage finance bonds. At the time of approval, these types of mortgage loans cannot be more than 75% of the lower of the purchase price or the appraised value of the mortgaged property or such loan will be classified as a commercial loan. Mortgage bonds are general obligations of the Bank, which is liable for all principal and accrued interest on such bonds. In addition, if the issuer of a mortgage finance bond becomes insolvent, the General Banking Law’s liquidation procedures provide that these types of mortgage loans with their corresponding mortgage bonds shall be auctioned as a unit and the acquirer must continue paying the mortgage finance bonds under the same conditions as the original issuer.

85
Consumer loans are loans to individuals, granted in Chilean pesos, generally on a fixed rate basis, to finance the purchase of consumer goods or to pay for services. They also include credit card balances subject to interest charges. Starting January 1, 2004, checking overdraft lines for individuals are classified as commercial loans.
Past due loans include, with respect to any loan, the amount of principal or interest that is overdue for 90 days or more, and does not include the installments of such loan that are not overdue or that are overdue for less than 90 days, unless legal proceedings have been commenced for the entire outstanding balance according to the terms of the loan.
Contingent loans consist of guarantees granted by us in Ch$, UF and foreign currencies (principally US$), as well as open and unused letters of credit. (Unlike U.S. GAAP, Chilean GAAP requires such loans to be included on a bank’s balance sheet.)
Any collateral provided generally consists of a mortgage on real estate, a pledge of marketable securities, a letter of credit or cash. The existence and amount of collateral generally vary from loan to loan.
Maturity and Interest Rate Sensitivity of Loans
The following table sets forth an analysis by type and time remaining to maturity of our loans at December 31, 2007.
Due 1 year or less Due after 1 year but
up to 5 years Due after 5 years Total balance at
December 31, 2007
(in millions of constant Ch$ as of December 31, 2007) Commercial loans ...................................... 2,146,710 1,536,883 974,276 4,657,869Consumer loans ......................................... 1,191,066 816,253 25,806 2,033,125Mortgage loans .......................................... 48,036 156,504 180,807 385,347Leasing contacts ........................................ 235,717 444,719 199,295 879,731Foreign trade loans .................................... 673,000 89,800 49,896 812,696Interbank loans .......................................... 45,961 - - 45,961Other outstanding loans ............................. 435,082 597,263 2,313,973 3,346,318Past due loans ............................................ 116,654 - - 116,654
Subtotal ......................................... 4,892,226 3,641,422 3,744,053 12,277,701Contingent loans ........................................ 942,382 236,443 12,454 1,191,279
Total loans..................................... 5,834,608 3,877,865 3,756,507 13,468,980
The following tables present the interest rate sensitivity of outstanding loans due after one year at December 31, 2006, (not including contingent loans). (See also “Item 5: C. Operating Results—Interest Rates.”)
At
December 31, 2007
(in millions of constant Ch$ as of
December 31, 2007)
Variable Rate Ch$ .......................................................................................................................................................... 18,687UF............................................................................................................................................................ 1,283,968Foreign currencies ................................................................................................................................... 383
Subtotal ...................................................................................................................................... 1,303,038Fixed Rate Ch$ .......................................................................................................................................................... 2,023,781UF............................................................................................................................................................ 3,919,620Foreign currencies ................................................................................................................................... 139,036
Subtotal ...................................................................................................................................... 6,082,437Total ........................................................................................................................................... 7,385,475

86
Loans by Economic Activity
The following table sets forth, at the dates indicated, an analysis of our loan portfolio based on the borrower’s principal economic activity. Loans to individuals for business purposes are allocated to their economic activity. The table does not reflect outstanding contingent loans.
As of December 31,
2006 2007
Loan Portfolio % of Total Loan Portfolio % of Total (in millions of constant Ch$ as of December 31, 2007, except for percentages)
Agriculture, Livestock, Agribusiness, Fishing
Agriculture and livestock.................................. 326,793 2.8 370,891 3.0Fruit .................................................................. 110,749 0.9 112,594 0.9Forestry and wood extraction............................ 113,676 1.0 66,830 0.5Fishing .............................................................. 102,224 0.9 109,733 0.9
Subtotal ............................................... 653,442 5.6 660,048 5.3Mining and Petroleum Mining and quarries .......................................... 46,379 0.4 51,488 0.4Natural gas and crude oil extraction ................. 35,618 0.3 107,029 0.9
Subtotal ............................................... 81,997 0.7 158,517 1.3Manufacturing Tobacco, food and beverages............................ 151,565 1.3 170,135 1.4Textiles, clothing and leather goods ................. 57,839 0.5 52,686 0.4Wood and wood products ................................. 71,543 0.7 71,459 0.6Paper, printing and publishing .......................... 69,414 0.6 120,723 1.0Oil refining, carbon and rubber......................... 119,586 1.0 104,184 0.8Production of basic metal, non minerals,
machine and equipment ................................ 139,893 1.2 154,848 1.3Other manufacturing industries......................... 37,488 0.3 43,726 0.4
Subtotal ............................................... 647,328 5.6 717,761 5.9Electricity, Gas and Water Electricity, gas and water.................................. 99,232 0.9 88,984 0.7
Subtotal ............................................... 99,232 0.9 88,984 0.7Construction Residential buildings ........................................ 399,274 3.4 398,218 3.2Other constructions ........................................... 389,036 3.4 380,438 3.1
Subtotal ............................................... 788,310 6.8 778,656 6.3Commerce Wholesale ......................................................... 406,531 3.5 426,665 3.5Retail, restaurants and hotels ............................ 553,041 4.8 659,244 5.4
Subtotal ............................................... 959,572 8.3 1,085,909 8.9Transport, Storage and
Communications Transport and storage........................................ 296,778 2.6 303,739 2.5Communications ............................................... 139,445 1.2 176,331 1.4
Subtotal ............................................... 436,223 3.8 480,070 3.9Financial Services, Insurance and Real
Estate Financial insurance and companies 658,189 5.7 566,862 4.6Real estate and other services provided to
companies ..................................................... 353,414 3.0 348,126 2.8Subtotal ............................................... 1,011,603 8.7 914,988 7.4
Community, Social and Personal Services
Community, social and personal services ......... 1,927,487 16.7 2,007,192 16.4Subtotal ............................................... 1,927,487 16.7 2,007,192 16.4
Consumer Credit ............................................... 1,954,622 16.9 2,056,790 16.8Residential Mortgage Loans ............................. 3,007,467 26.0 3,328,786 27.1

87
As of December 31,
2006 2007
Loan Portfolio % of Total Loan Portfolio % of Total
Total ........................................... 11,567,283 100.0 12,277,701 100.0
At December 31, 2007, foreign country loans totaled Ch$417,596 million, representing 2.3% of our total assets. No single foreign country represents more than 1% of our assets.
Credit Review Process
The Risk Division, our credit analysis and risk management group, is largely independent of our Commercial Division. Risk evaluation teams interact regularly with our clients. For larger transactions, risk teams in our headquarters work directly with clients when evaluating credit risks and preparing credit applications. Various credit approval committees, all of which include Risk Division and Commercial Division personnel, must verify that the appropriate qualitative and quantitative parameters are met by each applicant. Each committee’s powers are defined by our Board of Directors.
In addition, Banco Santander Spain is involved in the credit approval process of our largest loans and borrowers. If a single borrower or an economic group owes us an aggregate amount in excess of US$40 million, any additional loan to such borrower or member of such group must be reviewed by Banco Santander Spain. Once a year, the Executive Committee of Banco Santander Spain reviews those loans booked by us in excess of US$40 million.
Credit Approval: Corporate
In preparing a credit proposal for a corporate client, Santander-Chile’s personnel verify such parameters as debt servicing capacity (including, usually, projected cash flows), the company’s financial history and projections for the economic sector in which it operates. The Risk Division is closely involved in this process, and prepares the credit application for the client. All proposals contain an analysis of the client’s strengths and weaknesses, a rating and a recommendation. Credit limits are determined not on the basis of outstanding balances of individual clients, but on the direct and indirect credit risk of entire financial groups. For example, a corporation will be evaluated together with its subsidiaries and affiliates.
Credit Approval: Retail Banking
Retail loans are evaluated and approved by the Risk for Individuals, Micro businesses and Small Businesses Division. The majority of loans to individuals are approved by the Standardized Risk Area. The credit evaluation process is based on an evaluation system known as Garra for Banco Santander and Syseva for Santander Banefe, both process are decentralized, automated and are based on a scoring system which incorporates our Credit Risk Policies.
The credit evaluation process is based on the gathering of information to determine a client’s financial stability, payment capacity and commercial nature. The following parameters are used to evaluate an applicant’s credit risk: (i) income, (ii) length of current employment, (iii) indebtedness, (iv) credit reports and (v) background information, which is accessed by means of internal and external databases. Operations which cannot be approved by Garra or Syseva are sent to the Approval Center, a centralized area that carries out yearly analyses and renewals of credit lines and credit cards and evaluates higher risk credits.
The following table lists our committees from which credit approval is required depending on total risk exposure:
Approved By Maximum approval in
Thousands of US$
Executive Credit Committee............................................................................................................ >20,000Loan Credit Committee ................................................................................................................... 20,000Business Segment Committee ......................................................................................................... 8,000-10,000
Large Companies................................................................................................................. 10,000Real estate sector ................................................................................................................. 10,000

88
Approved By Maximum approval in
Thousands of US$
Medium sized companies .................................................................................................... 8,000Regional Committee ........................................................................................................................ 5,000Branch committee............................................................................................................................ 300
Companies ........................................................................................................................... 300Mortgage ............................................................................................................................. 120Persons ................................................................................................................................ 30
The following table lists Santander Banefe’s personnel from whom credit approval is required, depending upon total risk exposure. These attributions are granted based on specific training processes given by the Risk Division and according to the experience and professional background of the employee.
Range in US$ (Excludes mortgage
loans)
Risk Division Manager ...................................................................................................................... > 12,500Assistant Risk Division Managers..................................................................................................... 6,250-12,500Zone Manager.................................................................................................................................... 3,125-6,250Branch Assistant Manager................................................................................................................. 1,550-3,125Credit Analyst.................................................................................................................................... 1,170-1,550Commercial Executive ...................................................................................................................... 0-1,170
The Executive Credit Committee is comprised of the Chairman of the Board, three additional Board members, the Corporate Legal Counsel, the CEO, the Manager of Global Banking, the Corporate Director of Risk and two senior members of the Credit Risk department that present the loans being reviewed. This committee reviews the loan positions reviewed by the Senior Credit Committee above US$10 million and approves those loan positions greater than US$20 million. In addition, any loan position above US$40 million must also be reviewed by Banco Santander Spain’s credit committee.
The Loan Credit Committee is comprised of the CEO, the Manager of the Wholesale segment, the Manager of the Medium sized companies segment, General Counsel, the Corporate Director of Credit Risk and the Manager of Credit Admissions. The Loan Credit Committee reviews and will either approve or deny transactions in the range of US$8 million to US$20 million that have been previously approved by one of the Business Segment Committees: (i) Large Companies, (ii) Medium sized Companies and (iii) Real Estate. The Regional Committees have a maximum approval of up to US$5 million. The regional committees oversee the branch networks outside of Santiago. At the branch level, the maximum approval is US$300,000 for companies, US$30,000 for individuals and US$120,000 for mortgages. For the lower level committees, credit granting authority varies according to the seniority and experience of the committee members, and the values indicated represent upper limits. All committees include at least two bank officers from the commercial and credit areas.
We also have a department designated to monitor the quality of the loan portfolio on a continuous basis. The purpose of this special supervision is to maintain constant scrutiny of the portions of the portfolio that represent the greatest risk and to anticipate any deterioration. Based on this ongoing review of the loan portfolio, we believe we are able to detect problem loans and make a decision on client’s status. This includes measures such as reducing or extinguishing a loan, or requiring better collateral from the client. The control systems require that these loans be reviewed at least three times per year for those clients in the lowest category of credit watch.
Classification of Loan Portfolio
Chilean banks are required to provide to the Superintendency of Banks detailed information regarding their loan portfolio on a monthly basis. The Superintendency of Banks examines and evaluates each financial institution’s credit management process, including its compliance with the loan classification guidelines. Banks are classified into four categories: 1, 2, 3 and 4. Each bank’s category depends on the models and methods used by the bank to classify its loan portfolio, as determined by the Superintendency of Banks. Category 1 banks are those banks whose methods and models are satisfactory to the Superintendency of Banks. Category 1 banks will be entitled to continue using the same methods and models they currently have in place. A bank classified as a category 2 bank will have to

89
maintain the minimum levels of reserves established by the Superintendency of Banks while its Board of Directors will be made aware of the problems detected by the Superintendency of Banks and required to take steps to correct them. Banks classified as categories 3 and 4 will have to maintain the minimum levels of reserves established by the Superintendency of Banks until they are authorized by the Superintendency of Banks to do otherwise. We are classified in category 1.
Under the classifications effective January 1, 2004, loans are divided into: (i) consumer loans (including loans granted to individuals for the purpose of financing the acquisition of consumer goods or payment of services); (ii) residential mortgage loans (including loans granted to individuals for the acquisition, construction or repair of residential real estate, in which the value of the property covers at least 100% of the amount of the loan); and (iii) commercial loans (includes all loans other than consumer loans and residential mortgage loans).
In accordance with the regulations, which became effective as of January 1, 2004, the models and methods used to classify our loan portfolio must follow the following guiding principles, which have been established by the Superintendency of Banks and approved by our Board of Directors. In 2006, these models were improved and various changes introduced. Since then, not only have our internal provisioning models focused on non-performance, we have also introduced statistical models that take into account a borrower’s credit history and indebtedness levels. Group ratings that determine loan loss allowances based only on non-performance are being phased out and replaced by statistical scoring systems.
Allowances for large commercial loans
For large commercial loans, leasing and factoring, the Bank assigns a risk category level to each borrower and his respective loans. The Bank considers the following risk factors within the analysis: industry or sector of the borrower, owners or managers of the borrower, their financial situation, their payment capacity and payment behavior. The Bank assigns one of the following risk categories to each loan and borrower:
i. Classifications A1, A2 and A3, correspond to borrowers with no apparent credit risk.
ii. Classifications B, correspond to borrowers with some credit risk but no apparent deterioration of payment capacity.
iii. Classifications C1, C2, C3, C4, D1 and D2 correspond to borrowers whose loans have deteriorated.
For loans classified as A1, A2, A3 and B, the Bank assigns a specific level of risk to each borrower and, therefore, amount of loan loss allowance is determined on a case by case basis. All commercial loans for Companies, including leasing and factoring, have since been rated using a model for evaluating and calculating provisions on an individual basis. Since a debtor’s behavior varies over time, in order to determine the provisions, it is necessary to make a distinction between normal debtors and deteriorated debtors.
Debtor Classes
Two debtor classes have been determined based on debtors’ credit behavior in order to calculate loan loss allowance:
• Normal Debtors: Debtors that are current on their payment obligations and show no sign of deterioration in their credit quality.
• Deteriorated Debtors: Debtors that present some degree of non-payment in the Bank; which include debtors whose loan balances with us of 5% or more have been non-performing for more than three months, whose loans with us have been charged off or administered by our Recovery Unit, or classified as Precontenciosos (PRECO or Deteriorated)
Definition of Expected Loan Loss = Loan Loss Allowance
The expected loss is obtained by multiplying all risk factors defined in the following equation:
EL = PNP x EXP x SEV

90
EL = Expected Loss PNP = Probability of Non-
Performing EXP = Exposure SEV = Severity
EL = Expected Loss. The expected loss is how much could be lost in the event a debtor does not perform the
obligations under the loan.
PNP = Probability of Non-Performing. This variable, expressed as a percentage, indicates the probability that a debtor will default next year. This percentage is associated with the internal rating we give to each debtor, which is determined by analyzing such parameters as debt servicing capacity (including, usually, projected cash flows), the company’s financial history, the solvency and capacity of shareholders and management, and projections for the economic sector in which it operates. The internal rating can be different from ratings obtained from external third parties.
EXP = Exposure. This corresponds to the value of commercial loans without discounting the value of guarantees or collateral.
SEV = Severity. This is the effective loss rate for debtors in the same segment, which is determined statistically based on the historical effective losses for the Bank for each segment.
Determination of loan loss allowance according to Borrower Class
Normal Debtors
• The loan loss allowance for each debtor is calculated based on the Expected Loss equation (EL = PNP * EXP * SEV).
• A risk category is assigned to each debtor based on the PNP summarized in the following table:
PNP result Classification
Loan Loss Allowance (Pre-Dec.
2006)
Loan loss allowance as of and after Dec. 2006
External Classification> AA- A1 0% PNP ≤ 1% A2 0% 1% < PNP ≤ 4% A3 0.5% PNP > 4% B 1.0%
Determined by a model on an
individual basis Note: The classification is no longer tied to a particular level of allowance. For example, now an A1 could have a 0.1% allowance or a 0.2% allowance. The allowance is determined by the PNP which is directly associated to the internal rating each client receives. All loans have an assigned allowance regardless of classification level.
Deteriorated Debtors
For loans classified in Categories C1, C2, C3, C4, D1 and D2, the Bank must have the following levels of allowance:
Classification Estimated range of loss Allowance (1)
C1 ................................................................................ Up to 3% 2%C2 ................................................................................ More than 3% up to 19% 10%C3 ................................................................................ More than 19% up to 29% 25%C4 ................................................................................ More than 29% up to 49% 40%D1 ................................................................................ More than 49% up to 79% 65%D2 ................................................................................ More than 79% 90%
(1) Represents percentages of the required allowance to the aggregate amount of principal and accrued but unpaid interest of the loan.

91
Allowances for consumer loans
The classification of consumer is directly related to the aging of the installment. The following table sets forth our methodology for analyzing consumer loans prior to 2006.
Consumer loans overdue status
Category From To
Allowances as a percentage of aggregate exposure (1)
(Days) A ........................................................................ — — —% B ........................................................................ 1 30 1 B- ....................................................................... 31 60 20 C ........................................................................ 61 120 60 D ........................................................................ 121 >121 90
(1) In effect until December 31, 2005. Represents the percentages of the required allowance to the aggregate amount of the principal and accrued but unpaid interest of loans. Starting January 1, 2006, the risk category is determined by days of non-payment. However, the classification does not determine loan loss allowance levels.
Commencing in 2006, the Bank improved and modified the methodology for analyzing consumer loans. All consumer and are now assigned an allowance level on an individual borrower basis utilizing a more automated and sophisticated statistical model and considering borrower’s credit history, including any defaults on obligations to other creditors, as well as the overdue periods on the loans borrowed from the Bank. Further enhancements were implemented in 2007. The Bank now differentiates between old and new clients when determining a client’s risk profile for consumer loans and those that have gone through some type of renegotiation in the past in the financial system. All loans are assigned a provision at the moment a loan is granted depending on the risk profile of the client. Secondly, the time period used for statistically considering a consumer loan mature in order to determine the risk level of consumer loans was extended from 12 to 21 months of history. The latter change signified a one-time provision expense of Ch$14,444 million in 2007. The following table sets forth the allowances for consumer loan that depends on the client’s profile.
Allowances for mortgage loans
The classification of mortgage loans is directly related to the aging of the installment. The following table sets forth our methodology for analyzing consumer and mortgage loans prior to 2006.
Residential mortgage loans
overdue status
Category From To
Allowances as a percentage of aggregate exposure (1)
(Days) A ........................................................................ — — —% B ........................................................................ 1 180 1 B- ....................................................................... 181 >181 20 C ........................................................................ — — 60 D ........................................................................ — — 90
(1) In effect until December 31, 2005. Represents the percentages of the required allowance to the aggregate amount of the principal and accrued but unpaid interest of loans. Starting January 1, 2006, the risk category is determined by days of non-payment. However, the classification does not determine loan loss allowance levels.
Loan type Allowance % New Clients Old Clients New Clients Old Clients Consumer …… Profile 1 51.3% 39.1% 24.3% 30.2%
Profile 2 28.6% 15.2% 17.5% 25.8%Profile 3 16.2% 9.0% 8.2% 14.9%Profile 4 13.0% 4.8% --- 8.0% Profile 5 7.7% 2.7% --- 1.2% Profile 6 5.9% 1.2% --- --- Profile 7 2.3% 0.4% --- ---
Not-Renegotiated Renegotiated

92
Commencing in 2006, the Bank improved and modified the methodology for analyzing mortgage loans. All mortgage loans are now assigned an allowance level on an individual borrower basis utilizing a more automated and sophisticated statistical model and considering borrower’s credit history, including any defaults on obligations to other creditors, as well as the overdue periods on the loans borrowed from the Bank. Once the rating of the client is determined, the allowance for mortgage loans is calculated using a risk category and related allowance to loan ratio which is directly related to the overdue periods. The following table sets forth the allowance to loan ratios on loans based on overdue time.
Loan type Allowance %
(1) Overdue days
1-30 31-60 61-120 121-180 181-360 361- 720 >720 Mortgage ............................. Profile 1 0.3% 0.5% 1.2% 2.4% 6.8% 14.1% 28.3% Profile 2 1.5% 1.6% 2.5% 4.4% 6.8% 14.1% 28.3%
(1) Represents the percentage of required allowance amount to the aggregate amount of the principal and accrued but unpaid interest on the loan. These percentages may vary as the model is improved.
Allowances for group evaluations on small and mid-sized commercial loans
• Allowances for group evaluations are permitted for a large number of borrowers whose individual loan amounts are relatively insignificant. These models are intended to be used primarily to analyze commercial loans to individuals and small companies.
• Levels of required reserves are to be determined by the Bank, according to the estimated loss that may result from the loans, by classifying the loan portfolio using one or both of the following models:
i. A model based on the characteristics of the borrowers and their outstanding loans. Borrowers and their loans with similar characteristics will be placed into groups and each group will be assigned a risk level.
ii. A model based on the behavior of a group of loans. Loans with analogous past payment histories and similar characteristics will be placed into groups and each group will be assigned a risk level. Currently, the Bank is utilizing group analysis for determining the loan loss for certain types of loans such as lending to small and mid-sized companies and commercial loans to individuals.
Additional reserves
Banks are permitted to establish allowances above the limits described above only to cover specific risks that have been authorized by their Board of Directors. Voluntary reserves that cover no specific risk are no longer permitted.
Analysis of Santander-Chile’s Loan Classification
The following tables provide statistical data regarding the classification of our loans at the end of each of the last five years.
At December 31, 2003
(in millions of constant Ch$ as of December 31, 2007, except percentages)
Category Commercial Loans Consumer Loans Residential
Mortgage Loans Total Loans Percentage of
Evaluated Loans
A .................................................................... 3,412,521 725,498 1,444,630 5,582,649 69.7%B .................................................................... 1,856,490 111,025 136,772 2,104,287 26.3%B- ................................................................... 117,324 36,112 44,845 198,281 2.5%C .................................................................... 32,587 28,879 2,740 64,206 0.8%D .................................................................... 37,021 18,045 2 55,068 0.7%Total of evaluated loans................................. 5,455,943 919,559 1,628,989 8,004,491 100.0%Total loans ..................................................... 6,327,844 919,559 1,628,989 8,876,392 Percentage evaluated...................................... 86.2% 100.0% 100.0% 90.2%

93
At December 31, 2004
(in millions of constant Ch$ as of December 31, 2007, except percentages)
Category Commercial Loans Consumer Loans Residential
Mortgage Loans Total Loans Percentage of
Evaluated Loans
A ................................................................. - 1,037,678 1,910,034 2,947,712 30.1%A1 ............................................................... 475,568 - - 475,568 4.9%A2 ............................................................... 4,076,689 - - 4,076,689 41.6%A3 ............................................................... 727,391 - - 727,391 7.4%B ................................................................. 714,488 106,619 98,431 919,538 9.4%B- ................................................................ - 37,628 42,244 79,872 0.8%C ................................................................. - 34,981 2,364 37,345 0.4%C1 ............................................................... 288,992 - - 288,992 2.9%C2 ............................................................... 62,943 - - 62,943 0.6%C3 ............................................................... 35,713 - - 35,713 0.4%C4 ............................................................... 27,072 - - 27,072 0.3%D ................................................................. - 22,400 1 22,401 0.2%D1 ............................................................... 28,712 - - 28,712 0.3%D2 ............................................................... 69,677 - - 69,677 0.7%Total of evaluated loans.............................. 6,507,245 1,239,306 2,053,074 9,799,625 100.0%Total loans .................................................. 6,507,245 1,239,306 2,053,074 9,799,625 Percentage evaluated................................... 100.0% 100.0% 100.0% 100.0%
At December 31, 2005
(in millions of constant Ch$ as of December 31, 2007, except percentages)
Category Commercial
Loans Consumer Loans Residential
Mortgage Loans Total Loans Percentage of
Evaluated Loans
A ................................................................... - 1,264,085 2,362,015 3,626,100 32.6%A1 ................................................................. 470,257 - - 470,257 4.3%A2 ................................................................. 4,514,435 - - 4,514,435 40.6%A3 ................................................................. 1,016,594 - - 1,016,594 9.1%B ................................................................... 713,840 160,708 132,783 1,007,331 9.1%B- .................................................................. - 50,099 29,444 79,543 0.7%C ................................................................... - 39,295 2,027 41,322 0.4%C1 ................................................................. 203,608 - - 203,608 1.8%C2 ................................................................. 43,711 - - 43,711 0.4%C3 ................................................................. 22,191 - - 22,191 0.2%C4 ................................................................. 15,057 - - 15,057 0.1%D ................................................................... - 27,306 - 27,306 0.2%D1 ................................................................. 25,999 - - 25,999 0.2%D2 ................................................................. 36,614 - - 36,614 0.3%Total of evaluated loans................................ 7,062,306 1,541,493 2,526,269 11,130,068 100.0%Total loans .................................................... 7,062,306 1,541,493 2,526,269 11,130,068 Percentage evaluated..................................... 100.0% 100.0% 100.0% 100.0%
As of December 31, 2006
(in millions of constant Ch$ as of December 31, 2007, except for percentages)
Category Commercial
Loans Consumer Loans Residential
Mortgage Loans Total Loans Percentage of
Evaluated Loans
A ................................................................... - 1,598,134 2,830,330 4,428,464 35.0%A1 ................................................................. - - - - -A2 ................................................................. 5,501,457 - - 5,501,457 43.4%A3 ................................................................. 1,751,055 - - 1,751,055 13.8%B ................................................................... 163,584 182,015 131,285 476,884 3.8%B- .................................................................. - 67,156 21,249 88,405 0.7%C ................................................................... - 68,193 34,217 102,410 0.8%C1 ................................................................. 137,014 - - 137,014 1.1%C2 ................................................................. 23,738 - - 23,738 0.2%C3 ................................................................. 20,521 - - 20,521 0.2%

94
As of December 31, 2006
(in millions of constant Ch$ as of December 31, 2007, except for percentages)
Category Commercial
Loans Consumer Loans Residential
Mortgage Loans Total Loans Percentage of
Evaluated Loans
C4 ................................................................. 24,283 - - 24,283 0.2%D ................................................................... - 39,048 15,468 54,516 0.4%D1 ................................................................. 28,396 - - 28,396 0.2%D2 ................................................................. 28,915 - - 28,915 0.2%Total of evaluated loans................................ 7,678,963 1,954,546 3,032,549 12,666,058 100.0%Total loans .................................................... 7,678,963 1,954,546 3,032,549 12,666,058 Percentage evaluated..................................... 100.0% 100.0% 100.0% 100.0%
As of December 31, 2007
(in millions of constant Ch$ as of December 31, 2007, except for percentages)
Category Commercial
Loans Consumer Loans Residential
Mortgage Loans Total Loans Percentage of
Evaluated Loans
A ................................................................... - 1,716,521 3,055,967 4,772,488 35.5%A1 ................................................................. - - - - -A2 ................................................................. 6,279,856 - - 6,279,856 46.7%A3 ................................................................. 1,334,366 - - 1,334,366 9.9%B ................................................................... 169,762 154,051 180,220 504,033 3.7%B- .................................................................. - 66,839 31,211 98,050 0.7%C ................................................................... - 71,416 55,906 127,322 0.9%C1 ................................................................. 139,652 - - 139,652 1.0%C2 ................................................................. 23,548 - - 23,548 0.2%C3 ................................................................. 19,293 - - 19,293 0.1%C4 ................................................................. 30,164 - - 30,164 0.2%D ................................................................... - 43,172 21,112 64,284 0.5%D1 ................................................................. 40,520 - - 40,520 0.3%D2 ................................................................. 35,404 - - 35,404 0.3%Total of evaluated loans................................ 8,072,565 2,051,999 3,344,416 13,468,980 100.0%Total loans .................................................... 8,072,565 2,051,999 3,344,416 13,468,980 Percentage evaluated..................................... 100.0% 100.0% 100.0% 100.0%
Classification of Loan Portfolio Based on the Borrower’s Payment Performance
Accrued interest and UF indexation adjustments from overdue loans are recognized only when, and to the extent, received. Non performing loans include loans as to which either principal or interest is overdue, and which do not accrue interest. Restructured loans as to which payments are not overdue are not ordinarily classified as non performing loans. Past due loans include, with respect to any loan, only the portion of principal or interest that is overdue for 90 or more days, and do not include the installments of such loan that are not overdue or that are overdue for less than 90 days, unless legal proceedings have been commenced for the entire outstanding balance according to the terms of the loan, in which case the entire loan is considered past due within 90 days of the beginning of such proceedings. This practice differs from that normally followed in the United States, where the amount classified as past due would include the entire amount of principal and interest on any and all loans which have any portion overdue.
According to the regulations established by the Superintendency of Banks, we are required to write off commercial loan installments not later than 24 months after being classified as past due, if unsecured, and if secured, not later than 36 months after being classified as past due. When an installment of a past due commercial loan (either secured or unsecured) is written off, we must write off all installments which are overdue, notwithstanding our right to write off the entire amount of the loan. Once any amount of a loan is written off, each subsequent installment must be written off as it becomes overdue, notwithstanding our right to write off the entire amount of the loan. In the case of past due consumer loans, a similar practice applies, except that after the first installment becomes past due for six-months, we must write off the entire remaining part of the loan. We may write off any loan (commercial or consumer) before the first installment becomes overdue only in accordance with special procedures

95
established by the Superintendency of Banks. In certain circumstances we must write off an overdue loan (commercial or consumer) sooner than the terms set forth above. Loans are written off against the loan loss reserve to the extent of any required allowances for such loans; the remainder of such loans is written off against income.
In general, legal collection proceedings are commenced with respect to consumer loans once they are overdue for 90 days and, with respect to mortgage loans, once they are past due for 120 days. Legal collection proceedings are always commenced within one year of such loans becoming past due, unless the bank determines that the size of the past due amount does not warrant such proceedings. In addition, the majority of our commercial loans are short–term, with single payments at maturity. Past due loans are required to be covered by individual loan loss reserves equivalent to 100.0% of any unsecured portion thereof. See “Item 4: Information of the Company—Selected Statistical Information—Loan Loss Allowances—Individual Loan Loss Allowances.”
The following table sets forth as of December 31 of each of the last five years the amounts that are current as to payments of principal and interest and the amounts overdue:
Total Loans
The following table sets forth a loan aging schedule at the end of each of the last five years. Amounts shown as overdue and past due include only installments that are overdue or past due and not the aggregate principal amount of such loans.
At December 31,
2003 2004 2005 2006 2007 (in millions of constant Ch$ as of December 31, 2007)
Current .......................................................... 8,611,305 9,600,671 10,949,992 12,502,890 13,270,561Overdue for 1-29 days .................................... 43,426 33,389 41,206 42,063 52,811Overdue for 30-89 days .................................. 23,486 16,554 21,976 21,660 28,954Overdue for 90 days or more (“past due”) ...... 198,175 149,011 116,894 99,445 116,654Total loans ...................................................... 8,876,392 9,799,625 11,130,068 12,666,058 13,468,980Overdue loans expressed as a percentage
of total loans ............................................... 3.0% 2.0% 1.6% 1.3% 1.5%Past due loans as a percentage of total
loans ........................................................... 2.2% 1.5% 1.1% 0.8% 0.9%
We suspend the accrual of interest and readjustments on all overdue loans. The amount of interest that would have been recorded on overdue loans if they had been accruing interest was Ch$6,459 million, Ch$5,465 million and Ch$3,069 million for the years ended December 31, 2005, 2006 and 2007, respectively. Accrued interest and UF indexation adjustments from overdue loans are recognized only when, and to the extent, received.
Loans included in the previous table which have been restructured and that bear no interest are as follows.
At December 31,
2003 2004 2005 2006 2007 (in millions of constant Ch$ as of December 31, 2007)
Ch$ ................................................................. 16,393 20,852 1,672 1,708 1,165Foreign currency............................................. 5,280 10,733 1,745 29,515 75,502UF................................................................... 3,370 4,907 8,184 2,762 16,356
Total ........................................................... 25,043 36,492 11,601 33,985 93,023
The amount of interest that would have been recorded on these loans for the years ended December 31, 2005, 2006 and 2007, if these loans had been earning a market interest rate was Ch$441 million, Ch$2,229 million and Ch$6,593 million, respectively.
Loan Loss Allowances
The following table sets forth our balance of loan loss allowances, the minimum allowances to be established by us in accordance with the regulations of the Superintendency of Banks and our total loan loss allowances expressed
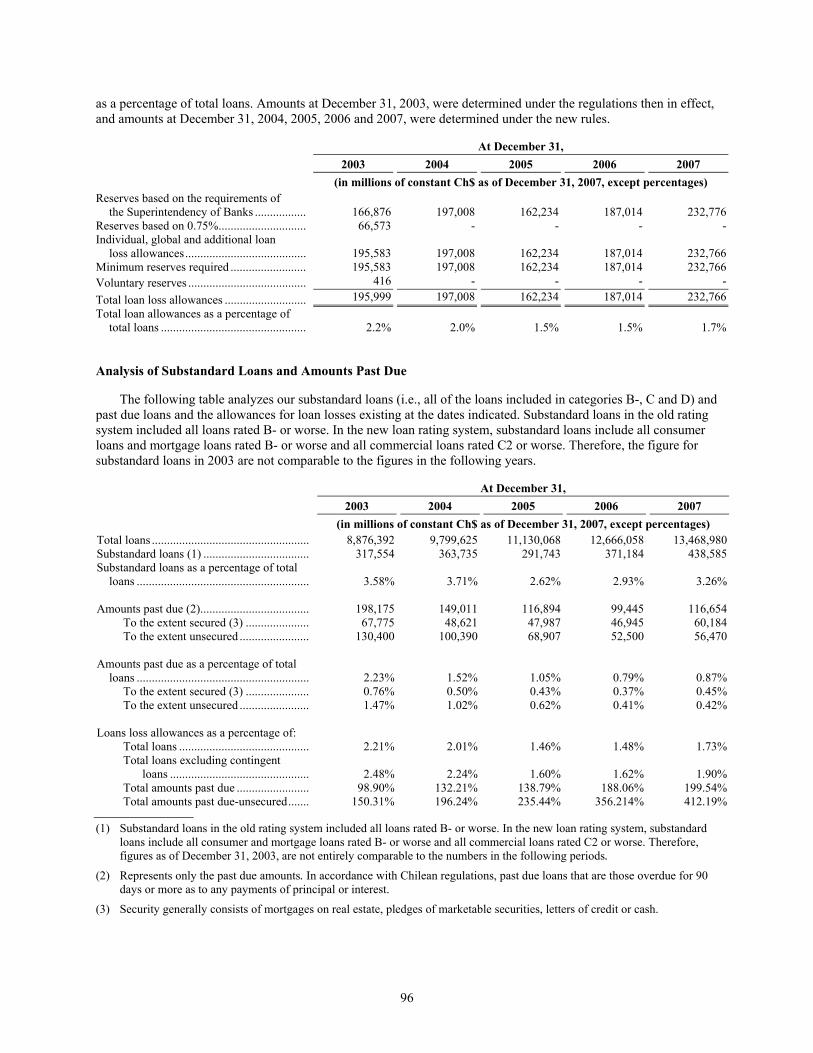
96
as a percentage of total loans. Amounts at December 31, 2003, were determined under the regulations then in effect, and amounts at December 31, 2004, 2005, 2006 and 2007, were determined under the new rules.
At December 31,
2003 2004 2005 2006 2007 (in millions of constant Ch$ as of December 31, 2007, except percentages)
Reserves based on the requirements of the Superintendency of Banks ................. 166,876 197,008 162,234 187,014 232,776
Reserves based on 0.75%............................. 66,573 - - - -Individual, global and additional loan
loss allowances........................................ 195,583 197,008 162,234 187,014 232,766Minimum reserves required ......................... 195,583 197,008 162,234 187,014 232,766Voluntary reserves ....................................... 416 - - - -Total loan loss allowances ........................... 195,999 197,008 162,234 187,014 232,766Total loan allowances as a percentage of
total loans ................................................ 2.2% 2.0% 1.5% 1.5% 1.7%
Analysis of Substandard Loans and Amounts Past Due
The following table analyzes our substandard loans (i.e., all of the loans included in categories B-, C and D) and past due loans and the allowances for loan losses existing at the dates indicated. Substandard loans in the old rating system included all loans rated B- or worse. In the new loan rating system, substandard loans include all consumer loans and mortgage loans rated B- or worse and all commercial loans rated C2 or worse. Therefore, the figure for substandard loans in 2003 are not comparable to the figures in the following years.
At December 31,
2003 2004 2005 2006 2007
(in millions of constant Ch$ as of December 31, 2007, except percentages) Total loans .................................................... 8,876,392 9,799,625 11,130,068 12,666,058 13,468,980Substandard loans (1) ................................... 317,554 363,735 291,743 371,184 438,585Substandard loans as a percentage of total
loans ......................................................... 3.58% 3.71% 2.62% 2.93% 3.26% Amounts past due (2).................................... 198,175 149,011 116,894 99,445 116,654
To the extent secured (3) ..................... 67,775 48,621 47,987 46,945 60,184To the extent unsecured ....................... 130,400 100,390 68,907 52,500 56,470
Amounts past due as a percentage of total
loans ......................................................... 2.23% 1.52% 1.05% 0.79% 0.87%To the extent secured (3) ..................... 0.76% 0.50% 0.43% 0.37% 0.45%To the extent unsecured ....................... 1.47% 1.02% 0.62% 0.41% 0.42%
Loans loss allowances as a percentage of:
Total loans ........................................... 2.21% 2.01% 1.46% 1.48% 1.73%Total loans excluding contingent
loans .............................................. 2.48% 2.24% 1.60% 1.62% 1.90%Total amounts past due ........................ 98.90% 132.21% 138.79% 188.06% 199.54%Total amounts past due-unsecured....... 150.31% 196.24% 235.44% 356.214% 412.19%
(1) Substandard loans in the old rating system included all loans rated B- or worse. In the new loan rating system, substandard loans include all consumer and mortgage loans rated B- or worse and all commercial loans rated C2 or worse. Therefore, figures as of December 31, 2003, are not entirely comparable to the numbers in the following periods.
(2) Represents only the past due amounts. In accordance with Chilean regulations, past due loans that are those overdue for 90 days or more as to any payments of principal or interest.
(3) Security generally consists of mortgages on real estate, pledges of marketable securities, letters of credit or cash.

97
Analysis of Loan Loss Allowances
The following table analyzes our loan loss allowances and changes in the allowances attributable to write-offs, provisions, allowances released, allowances on loans acquired and the effect of price-level restatement on loan loss allowances. Chilean GAAP requires that the loan loss allowance be debited the full amount of all charge-offs (irrespective of whether the charged-off loan was fully provisioned) and simultaneously credited the same amount through the taking of a new provision. The net effect of these two entries, which are included in the table below under “charge-offs” and “allowances established,” respectively, is to leave the loan loss allowance unchanged following the charge-off of a loan. Subsequently, at the end of each calendar month, loan loss allowances are released to the extent not needed. Such releases, which are included in the table below under “allowances released,” therefore include any amounts relating to provisions originally made in respect of loans that have been charged off.
For the Year Ended December 31,
2003 2004 2005 2006 2007 (in millions of constant Ch$ as of December 31, 2007, except percentages)
Loan loss allowances at beginning of the year ............................................................ 197,193 195,999 197,008 162,234 187,014
Release of allowances upon charge-offs (1) .............................................................. (116,776) (135,798) (150,021) (154,150) (201,124)
Allowances established (2) ............................ 145,887 164,819 176,950 221,420 306,669Allowances released (3)................................. (28,445) (22,863) (54,820) (39,123) (46,843)Price-level restatement (4) ............................. (1,860) (5,149) (6,883) (3,367) (12,950)Loan loss allowances at end of year 195,999 197,008 162,234 187,014 232,766Ratio of charge-offs to total loans.................. 1.3% 1.4% 1.3% 1.2% 1.5%Loan loss allowances at end of period as
a percentage of total loans ......................... 2.2% 2.0% 1.5% 1.5% 1.7%
(1) Reflects release of loan loss allowance equal to the entire amount of loans charged off, including any portion of such loans with respect to which no allowance had been established prior to the charge-off.
(2) Includes, in addition to provisions made in respect of increased risk of loss during the period, provisions made to replace allowances released upon charge-off of loans. See Note (1) to this table.
(3) Represents the amount of loan loss allowances released during the year as a consequence of reduction in the level of risk existing in the loan portfolio, including as a result of improvement in the credit risk classification of borrowers and the charge-off of loans.
(4) Reflects the effect of inflation on the allowances for loan losses at the beginning of each period, adjusted to constant pesos of December 31, 2007.
The following table shows charge-offs by Santander-Chile by type of loan.
For the Year Ended December 31,
2003 2004 2005 2006 2007
(in millions of constant Ch$ as of December 31, 2007) Consumer loans .................................................... 66,534 93,154 73,214 109,853 165,029Residential Mortgage loans .................................. 5,231 4,458 7,858 6,220 5,308Commercial loans ................................................. 45,011 38,186 68,949 38,077 30,787Total...................................................................... 116,776 135,798 150,021 154,150 201,124
The following table shows recoveries by Santander-Chile by type of loan.
For the Year Ended December 31,
2003 2004 2005 2006 2007
(in millions of constant Ch$ as of December 31, 2007) Commercial loans .................................................. 17,504 23,805 17,014 16,471 28,999Consumer loans ..................................................... 20,384 28,279 31,013 31,158 44,438

98
For the Year Ended December 31,
2003 2004 2005 2006 2007
(in millions of constant Ch$ as of December 31, 2007) Residential mortgage loans.................................... 1,615 2,465 2,555 2,940 4,323Loans reacquired from the Central Bank............... 18 - - - -Total....................................................................... 39,521 54,549 50,582 50,569 77,760
Based on information available regarding our borrowers, we believe that our loan loss allowances are sufficient to cover known potential losses and losses inherent in a loan portfolio of the size and nature of our loan portfolio.
Allocation of the Loan Loss Allowances
The following tables set forth, at December 31 of each of the last five years, the proportions of our required minimum loan loss allowances that were attributable to our commercial, consumer and residential mortgage loans, and the amount of voluntary allowances (which are not allocated to any particular category) at each such date.
At December 31, 2003 At December 31, 2004
Allowance amount (1)
Allowance amount as a
percentage of loans in category
Allowance amount as a
percentage of total loans
Allowance amount as a
percentage of total
allocated allowances
(2) Allowance amount (1)
Allowance amount as a
percentage of loans in category
Allowance amount as a
percentage of total loans
Allowance amount as a
percentage of total
allocated allowances
(2)
Commercial loans................... 124,938 1.97% 1.41% 66.42% 117,288 1.80% 1.20% 62.73%Consumer loans ...................... 51,164 5.56% 0.57% 27.21% 58,835 4.75% 0.60% 31.47%Residential mortgage
loans................................... 11,989 0.74% 0.14% 6.37% 10,853 0.53% 0.11% 5.80%Total allocated allowances ..... 188,091 2.12% 2.12% 100.00% 186,976 1.91% 1.91% 100.00%Leasing ................................... 7,492 0.08% 0.08% 10,032 0.10% 0.10%Voluntary allowances............. 416 0.01% 0.01% - - -
Total allowances..................... 195,999 2.21% 2.21% 197,008 2.01% 2.01%
At December 31, 2005 At December 31, 2006
Allowance amount (1)
Allowance amount as a
percentage of loans in category
Allowance amount as a
percentage of total loans
Allowance amount as a
percentage of total
allocated allowances
(2) Allowance amount (1)
Allowance amount as a
percentage of loans in category
Allowance amount as a
percentage of total loans
Allowance amount as a
percentage of total
allocated allowances
(2)
Commercial loans................... 76,426 1.08% 0.69% 49.73% 67,194 0.88% 0.53% 37.32%Consumer loans ...................... 68,826 4.46% 0.62% 44.78% 105,563 5.40% 0.83% 58.63%Residential mortgage
loans................................... 8,431 0.33% 0.07% 5.49% 7,294 0.24% 0.06% 4.05%Total allocated allowances ..... 153,683 1.38% 1.38% 100.00% 180,051 1.42% 1.42% 100.00%Leasing ................................... 8,551 0.08% 0.08% 6,963 0.06% 0.06%Voluntary allowances............. - - - - - -
Total allowances..................... 162,234 1.46% 1.46% 187,014 1.48% 1.48%
At December 31, 2007
Allowance amount (1)
Allowance amount as a
percentage of loans in category
Allowance amount as a
percentage of total loans
Allowance amount as a
percentage of total allocated allowances (2)
Commercial loans ..................................................................... 79,782 0.99% 0.59% 35.50%Consumer loans ........................................................................ 135,602 6.61% 1.01% 60.34%Residential mortgage loans ....................................................... 9,349 0.28% 0.07% 4.16%

99
At December 31, 2007
Allowance amount (1)
Allowance amount as a
percentage of loans in category
Allowance amount as a
percentage of total loans
Allowance amount as a
percentage of total allocated allowances (2)
Total allocated allowances........................................................ 224,733 1.67% 1.67% 100.00%Leasing ..................................................................................... 8,033 0.06% 0.06% Voluntary allowances ............................................................... - - - Total allowances ....................................................................... 232,766 1.73% 1.73%
(1) In millions of constant Chilean pesos as of December 31, 2007.
(2) Based on our loan classification, as required by the Superintendency of Banks for the purpose of determining the loan loss allowance.
ITEM 6. DIRECTORS, SENIOR MANAGEMENT AND EMPLOYEES
A. Directors and Senior Management
Directors
We are managed by our Board of Directors, which, in accordance with our by-laws, consists of 11 directors and two alternates who are elected at annual ordinary shareholders’ meetings. The current members of the Board of Directors were elected by the shareholders in the ordinary shareholders’ meeting held on April 22, 2008. Members of the Board of Directors are elected for three-year terms. The term of each of the current board members expires in April of 2011. Cumulative voting is permitted for the election of directors. The Board of Directors may appoint replacements to fill any vacancies that occur during periods between elections. If any member of the Board of Directors resigns before his or her term has ended, and no other alternate director is available to take the position at the next annual ordinary shareholders’ meeting a new replacing member will be elected. Our executive officers are appointed by the Board of Directors and hold office at its discretion. Scheduled meetings of the Board of Directors are held monthly. Extraordinary meetings can be held when called in one of three ways: by the Chairman of the Board of Directors, by three directors with the consent of the Chairman of the Board of Directors or by the majority of directors. None of the members of our Board of Directors has a service contract which entitles any Director to any benefits upon termination of employment with Santander-Chile.
Our current directors are as follows:
Directors Position Committees Term Expires Mauricio Larraín Garcés Chairman and
Director Asset and Liability Committee Executive Credit Committee Marketing and Communications Committee
April 2011
Marcial Portela Alvarez First Vice Chairman and Director
— April 2011
Carlos Olivos Marchant Second Vice Chairman and Director
Audit Committee Executive Credit Committee
April 2011
Víctor Arbulú Crousillat Director Audit Committee April 2011 Marco Colodro Hadjes Director Asset and Liability Committee
Executive Credit Committee April 2011
Lucía Santa Cruz Sutil Director — April 2011 Juan Manuel Hoyos Martínez de Irujo Director — April 2011 Roberto Méndez Torres Director Executive Credit Committee
Marketing and Communications Committee April 2011
Benigno Rodríguez Rodríguez* Director Audit Committee April 2011 Roberto Zahler Mayanz Director Asset and Liability Committee April 2011 Claudia Bobadilla Ferrer Director — April 2011 Raimundo Monge Zegers Alternate Director — April 2011

100
Jesús Zabalza Lotina Alternate Director — April 2011 * - resigned on June 24, 2008.
Mauricio Larraín Garcés is our Chairman. He is a member of the Asset and Liability Committee, the Executive Credit Committee and the Marketing and Communication Committee. He is also President of Santander Chile Holding S.A. and Universia Chile S.A. He is a director of the Asociación de Bancos e Instituciones Financieras de Chile and the Santiago Stock Exchange. He is also a member of the Council of Paz Ciudadana and was a former President of ICARE. Mr. Larraín began working at Santander-Chile in 1989. Previous to that he was Intendente (Director) of the Superintendency of Banks, Manager of External Debt at the Banco Central de Chile and a Senior Finance Specialist at the World Bank in Washington. He holds degrees in Law from Universidad Católica de Chile and from Harvard University.
Marcial Portela Alvarez became a Director on May 6, 1999 and Vice Chairman of the Board on May 18, 1999. He currently oversees all of Banco Santander Spain’s investments in Latin America and was the Director of Comercialización (Medios) at Banco Santander from November 1998 until the formation of Banco Santander Spain. In the past, he was the Vice Chairman of Telefonica España and the Managing Director of Banco Argentaria and also worked at several other banks, including Banco Exterior, Caja Postal, Banco Hipotecario and BBV. Mr. Portela holds a degree in Sociology from the University of Lovaina and a Political Science degree from the Universidad de Madrid.
Carlos Olivos Marchant is Second Vice-Chairman of the Board since 2007 and has been a Board member since the merger was consummated in 2002. He is Chairman of the Audit Committee and a member of the Executive Credit Committee. He was Chairman of the Board of Santiago since 1987 until the date of the merger, and he was Vice Chairman of that board since March 31, 1998. He is a partner in the law firm Guerrero, Olivos, Novoa y Errazuriz. From 1981 to 1983, Mr. Olivos served as General Counsel of the Central Bank of Chile, and from 1984 to 1986 he served as Chairman of the Board of Directors of Banco Osorno. Mr. Olivos holds a law degree from the Universidad de Chile and a Masters of Jurisprudence from New York University School of Law.
Benigno Rodríguez Rodríguez became a Director on March 19, 1996 and was Second Vice-Chairman of the Board of Banco Santander-Chile until 2007. He is a member of the Audit Committee and holds the position of Financial Expert. He is currently a member of the Instituto de Censores Jurados de Cuentas y Registros de Auditores del Colegio de Economistas de España. He served as Vice Chairman of the Board of Santiago from April 17, 2002 through the date the merger was consummated. Before that he served as Santiago’s Director of Management Information Systems. He is a director of Santander Chile Holding S.A., Aurum S.A. and Altec Chile. He was a former Adjunct Director of Santander Central Hispano. Mr. Rodriguez holds a degree in Economics from the Universidad Complutense of Madrid. Mr. Rodriguez resigned from the Bank’s Board on June 24, 2008, effective as of the same day.
Víctor Arbulú Crousillat became a Director on May 6, 1999. He is a member of the Audit Committee and has been designated as a Financial Expert. He is also director of Aurum S.A. He was a Managing Director of JPMorgan, member of its European management committee and Chief Executive Officer for Spain and Portugal from 1988 until 1998. He has worked for JPMorgan for over 25 years in various positions in Europe, North America and Latin America. Mr. Arbulu also worked for the Inter-American Development Bank. Mr. Arbulu holds a degree in Engineering and a Masters of Business Administration.
Marco Colodro Hadjes became a Director on April 19, 2005. Mr. Colodro is a member of the Executive Credit Committee. Mr. Colodro was President of the Board of Telefónica Chile and a Director of Codelco. He is a former chairman of TVN (national television network) and former vice chairman of Banco del Estado (state bank). He was also owner of Agencia de Valores Alfa S.A. Prior to that he was Foreign Trade Director at the Central Bank of Chile. Mr. Colodro holds a degree in Economics from Universidad de Chile, and has post-graduate studies from the University of Paris.
Lucía Santa Cruz Sutil became a Director on August 19, 2003. Ms. Santa Cruz holds a degree in History and a Masters Degree in Philosophy from Oxford University. She is the Dean of the College of Liberal arts of the Universidad Adolfo Ibañez. Ms. Santa Cruz is also a director of Universia Chile S.A. She is also on the Board of Compañía de Seguros Generales y de Vida La Chilena Consolidada and Fundación Minera Escondida. She is also

101
on the Advisory Board of Nestle Chile and the Fundación Educacional Santa Teresa de Avila. She is also a member of the Self-Regulation Committee for Insurance Companies in Chile.
Juan Manuel Hoyos Martínez de Irujo was the Managing Director of McKinsey & Company in Spain between 1997 and 2004. He was also President of the Client Committee of this company’s Board. Currently, he is in charge of partner development worldwide and is still part of the Board of the firm. His consulting career has been focused in the areas of strategy and organization of corporations, especially in the telecommunications, banking and metallurgy sectors. He has worked with companies in Spain, USA, Latin America, United Kingdom, Portugal and Africa. He is an Economist from the Universidad Complutense de Madrid and he has an MBA in Finance and Accounting from Columbia University. He began his career in 1978 at McKinsey & Company, where he was named partner in 1984 and Director in 1991.
Roberto Méndez Torres is a former member of the Board of Old Santander-Chile, to which he was appointed in 1996. He is a member of the Executive Credit Committee and the Marketing and Communication Committee. He is also vice-Chairman of Universia S.A. He is a professor of Economics at Universidad Católica de Chile. He is a Director of AFP Capital. He has been Advisor to Grupo Santander-Chile since 1989. Mr. Méndez is President and Director of Adimark Chile Gfk. He graduated with a degree in Business from Universidad Católica de Chile, and holds an MBA and a Ph.D. from the Graduate School of Business at Stanford University.
Roberto Zahler Mayanz became a Director on August 31, 1999. He is a member of the Asset and Liability Committee. Currently, he is President of Zahler & Co, a consulting firm. He is also director of Air Liquide-Chile and member of the CLAAF or the Latin American Committee for Financial Affairs. He was formerly President of the Board of Siemens Chile. He was also a visiting professor at the IMF’s Research Department. Between 1991 and 1996 he was President of the Central Bank of Chile and Vice-President from 1989-1991. He also serves as a consultant for the World Bank, the IDB, the IMF and the International Bank of Settlements. Mr. Zahler has also provided technical assistance to various Central Banks and Finance Ministries in most countries of Latin America, Indonesia and Kosovo. Mr. Zahler holds a degree in Business Administration from the Universidad de Chile and a Masters in Economics from the University of Chicago.
Claudia Bobadilla Ferrer was elected to the Board in April 2006. She is CEO of Fundación País Digital, a member of the Executive Committee of Innovation and Technology of ICARE, council member of Endeavor Chile and Executive Director of the Chile-Japón Siglo XXI Committee. She was also founder and President of Comunidad Mujer, an organization dedicated to increasing women’s participation in the workforce. She is also Director of Innova Chile CORFO and a member of the council of Fundación Chilena del Pacífico. She was previously Director of Legal Affairs at Terra Networks Chile S.A. She is a lawyer from the Universidad Diego Portales.
Raimundo Monge Zegers became an Alternate Director on April 29, 2003. He is Corporate Director of Strategic and Financial Planning for Grupo Santander-Chile and is CEO of Santander-Chile Holding S.A. and Santander Inversiones Ltda. He is also President of Santander S.A. Sociedad Securitizadora and Santander Factoring S.A. He is a director of Aurum S.A., Santander Multimedios S.A., Santander Asset Management Chile S.A. and Santander Corrdores de Seguros S.A. Mr. Monge has a degree in business from the Universidad Católica de Chile and a MBA from the University of California, Los Angeles.
Jesús Zabalza Lotina became a Director on April 19, 2005. He has worked for 22 years in the Spanish financial systems, and served as CEO in Banco Viscaya, Banco Hipotecario, Caja Postal and La Caixa. He as also served as director in several affiliate companies on La Caixa and Telefónica in Spain. He is Managing Director of America’s División of Santander Group for retail banking, and vice president of the Spanish Association of Finance Executives (AEEF). He also serves as Chairman of the Board of Santander Colombia and Director of Banco Santander Bancorp in Puerto Rico. Mr. Zabalza holds a degree in Industrial Engineering from the University of Bilbao.
On June 24, 2008, Benigno Rodriguez resigned from the Board of Banco Santander Chile and simultaneously from the Bank’s Audit Committee. The Board has nominated Mr. Vittorio Corbo as new member of the Board of Directors to replace Mr. Rodriguez. This nomination is expected to be ratified in the board meeting to be held on July 22, 2008. Vittorio Corbo was an advisor to the Bank between 1991 and 1995 and a member of the Board of Santander Chile between 1995 and 2003. In 2003, Mr. Corbo was named President of Chile’s Central Bank. Following the end of this tenure, Mr. Corbo has been named to various boards and is currently a Senior Investigator at the Centro de Estudio Públicos (CEP), a local think tank. He holds a business degree from Universidad de Chile and a Ph.D. in Economics from the Massachusetts Institute of Technology.

102
Senior Management
Our senior managers are as follows:
Senior Manager Position Date Appointed Oscar von Chrismar Chief Executive Officer August 1, 2003 Guillermo Sabater Corporate Financial Controller July 1, 2006 José Manuel Manzano Corporate Director of Risk July 1, 2007 Ignacio Centenera Corporate Director of Internal Audit January 1, 2007 Francisco Murillo Corporate Director Human Resources February 21, 2008 Claudio Melandrí Retail Banking February 21, 2008 Joaquín Quirante Global Banking and Markets March 11, 2008 José Luis Silva Santander Banefe Consumer Division August 23, 2007 Andrés Heusser Middle-market Banking October 1, 2004 Roberto Jara Chief Accounting Officer July 18, 2002 Juan Fernández Administration and Operations July 18, 2002 Gonzalo Romero General Counsel July 18, 2002
Oscar von Chrismar C. became the CEO of Santander-Chile in August 2003 after being Manager of Global Banking following the merger. Prior to that he was the former CEO of Old Santander-Chile since September 1997, after being General Manager of Banco Santander-Peru since September 1995. Mr. von Chrismar is also Director of Santander Corredora de seguros S.A. Prior to that, Mr. von Chrismar was the manager of the Finance Division of Santander-Chile, a position he had held since joining Santander-Chile in 1990. Mr. von Chrismar holds an Engineering degree from the Universidad de Santiago de Chile.
Guillermo Sabater is the Corporate Financial Controller of Santander-Chile, and is in charge of the Accounting and Financial Control Departments. He has held this position since July 2006. Previously, Mr. Sabater was responsible for Risk and Management Control at Santander Consumer (the European Consumer Finance Division of Santander Group) at the Madrid headquarters and Internal Audit Manager of the Group. Mr. Sabater has an Economics and Business Administration degree from C.U.N.E.F. (Universidad Complutense of Madrid).
José Manuel Manzano was appointed became Corporate Director of Risk in July 2007. Prior to that he was Corporate Director of Human Resources for Santander-Chile since October 31, 2002. Previously, he served as Manager of Human Resources for Old Santander-Chile since 1999. He was also General Manager of Santander Fund Management and Managing Director of Bancassurance. He is also a Director of Santander Chile Holding and Santander S.A. Sociedad Securitizadora. Mr. Manzano holds an MBA and a degree in Business from Universidad Católica de Chile.
Ignacio Centenera is the Corporate Director of Internal Auditing, a position he has held since January 2007. Prior to that Mr. Centenera was Manager in the Global Accounting Risk Department and Manager of Internal Auditing at Banesto. Mr. Centenera has a Law Degree from the Universidad Autónoma de Madrid, an MBA from the University of Houston and a Master de Desarrollo Directivo from the Instituto de Empresas in Madrid.
Francisco Murillo was appointed Corporate Director of Human Resources for Santander-Chile on February 21, 2008. Mr. Murillo has worked in Grupo Santander Chile since 1993. Previously he served as Corporate Director of Santander Asset Management and President of Bansander AFP. He was also the former CEO and Chief Investment Officer of Bansander AFP. Mr. Murillo is President of Santander Asset Management S.A. Administradora de General de Fondos, President of Santander Seguros de Vida S.A., President of Santander Seguros Generales S.A., Director of Santander Chile Holding, Director of Aurum S.A., Director of Santander Asset Management Chile S.A., CEO of Teatinos Siglo XXI Inversiones Ltda and CEO of Aurum S.A. Mr. Murillo has a Business Degree from the Universidad Adolfo Ibañez.
Claudio Melandrí is our Retail Banking Manager since February 21, 2008. He started his career at Santander-Chile in 1990 becoming a regional branch manager and manager of Santander-Chile’s branch network. He was also a Vice-President at Banco Santander Venezuela from 2005 to 2007. In 2007, he was appointed Corporate Director of Human Resources of Banco Santander-Chile. He is also on the Board of Santander Seguros de Vida S.A. and Santander Seguros Generales S.A. Mr. Melandrí has a Business Degree from the Universidad Técnologica Metropolitana.

103
Joaquin Quirante was appointed the Manager of Global Banking and Markets, that includes wholesale banking and treasury services, on March 11, 2008. Mr. Quirante began working for Santander in 2004 and was the Global Manager of Debt Capital Markets. Previous to working at Santander, Mr. Quirante worked 9 years at Bank of America where he also lead the Debt Capital Markets Group for Southern Europe. He also was a vice-president of Risk for the Bank of America in the UK and worked in the International Division of Argentaria. Mr. Quirante is an economist from the Universidad Complutense de Madrid and has a MBA from IESE.
José Luis Silva became Manager of the Santander Banefe Division of Santander-Chile in August 2007. Prior to that he was a Commercial Director in the Americas Division of Grupo Santander, CEO of Banco Santa Cruz in Bolivia, Commercial Manager of Banco Santander in Perú, Manager of Consumer Finance at Credisur in Perú and Manager of International Banking at Banco O´Higgins in Chile. Mr. Silva is also a member of the Board of Santander Seguros de Vida S.A. and Santander Seguros Generales S.A. Mr. Silva is a civil engineer from the Universidad Católica de Chile.
Andrés Heusser is our Middle Banking Manager. He has held the same position in the Old Santander-Chile since 1990, when he joined the Santander Group. Mr. Heusser is also President of Santander Corredora de Seguros S.A. and is on the Board of Santander Factoring S.A. Mr. Heusser holds a degree in business from the Universidad de Santiago and an MBA from the Universidad Adolfo Ibáñez.
Roberto Jara is our Chief Accounting Officer. He is the former Chief Accounting Officer at Old Santander-Chile, a position he held from March 1998 until August 2002, when the merger with Santiago was consummated. He joined Old Santander-Chile in 1978 and held several positions there, such as Sub-Manager of Budget and Costs and Chief of IT Projects. Mr. Jara is a CPA and holds a degree in Tax Management from Universidad Adolfo Ibañez.
Juan Fernández is our manager of Administration and Operations. He is the former Manager of Administration and Cost Control of Old Santander-Chile, a position he held from April 1999 until August 2002, when the merger with Santiago was consummated. Mr. Fernández is also Director of Santander Chile Holding S.A., Aquanima Chile S.A., Santander Factoring S.A., Altec S.A., Bansa Santander S.A. and Santander Investment S.A. Corredores de Bolsa. Previously Mr. Fernández served as Manager for Accounting and Administration of Old Santander-Chile since January 1993. Prior to that, Mr. Fernández held positions at Banchile Agencia de Valores y Subsidiarias, and at JPMorgan in Santiago and Madrid.
Gonzalo Romero is our General Counsel, a position he has held since July 18, 2002. He is also a director of Santander S.A. Sociedad Securitizadora. Mr. Romero, a lawyer, joined Old Santander-Chile in February 1997 as General Counsel. He was the General Manager of Banco Concepción from 1991 to 1996 and the General Counsel of Banco Concepción from 1986 to 1990. He has a degree in Law from the Universidad de Chile.
B. Compensation
For the year ended December 31, 2007, the aggregate amount of compensation paid by us to all of our directors was Ch$578 million, including attendance fees and monthly stipends. For the year ended December 31, 2007, the aggregate amount of compensation paid by us to all of our executive officers and our management members was Ch$25,818 million (US$52.2 million). At our annual shareholder meeting held on April 22, 2008, shareholders approved a monthly stipend per director of UF 209 (US$8,285). This amount will be increased by UF 25 per month (US$991) if a Board member is named to one or more committees of the Board. In addition, we pay certain directors professional service fees for the consulting services they rendered to us in their fields of expertise. For the year ended December 31, 2007, payments to our directors for consulting fees totaled Ch$533 million (US$1.1 million).
Santander Spain has set up remuneration systems tied to the performance of the stock market price of the shares of Santander Spain based on the achievement of two targets: appreciation of its share price and growth in earnings per share, in both cases based on a sample of comparable banks. These targets were achieved.
In this regards, certain high level executive of Santander Chile do participate in this global incentive-retention program implemented by Santander Spain. This consisted of giving to qualifying executives a fixed number of options on shares of Santander Spain, if the following parameters were met: (i) share price evolution in top 10 compared to 30 other global banks, (ii) earnings per share growth in top 10 compared to 30 other global banks, (iii) that Banco Santander Chile achieved its commercial and financial budget targets in the last two years and (iv) that the executive achieved his personal targets in the last two years, and remained employed with the Bank until the end of the incentive program. At December 31, 2007, these targets were achieved, and hence the vesting requirements
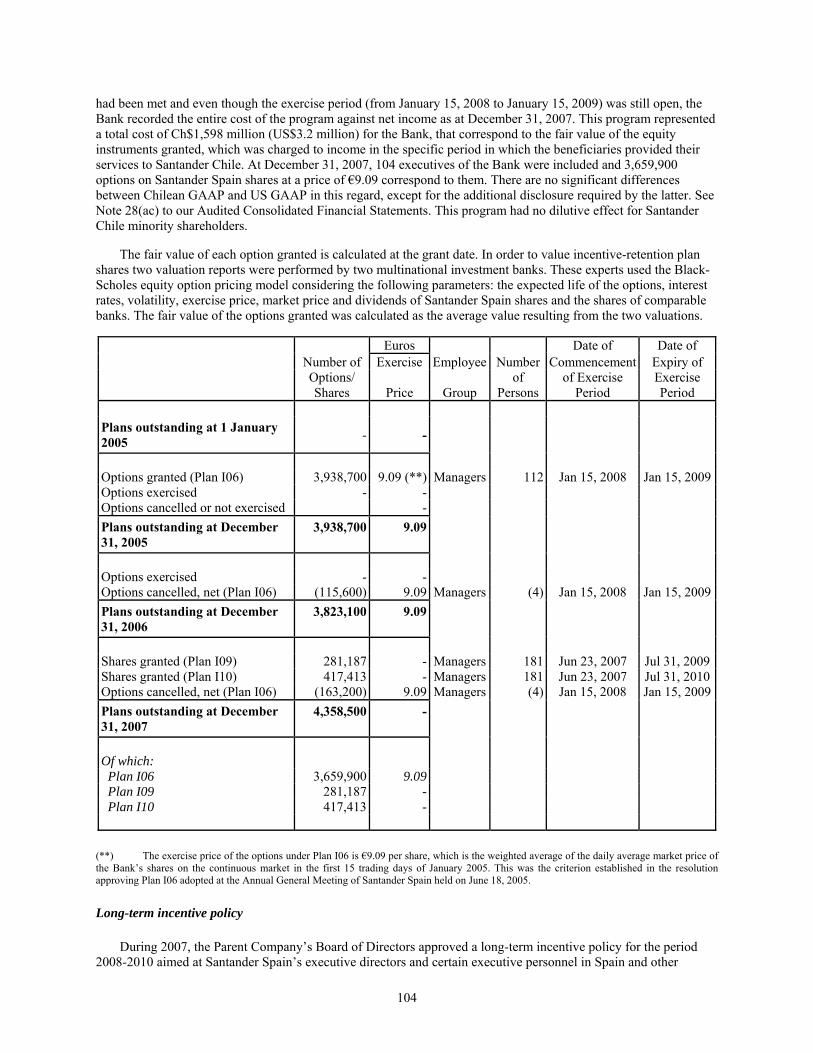
104
had been met and even though the exercise period (from January 15, 2008 to January 15, 2009) was still open, the Bank recorded the entire cost of the program against net income as at December 31, 2007. This program represented a total cost of Ch$1,598 million (US$3.2 million) for the Bank, that correspond to the fair value of the equity instruments granted, which was charged to income in the specific period in which the beneficiaries provided their services to Santander Chile. At December 31, 2007, 104 executives of the Bank were included and 3,659,900 options on Santander Spain shares at a price of €9.09 correspond to them. There are no significant differences between Chilean GAAP and US GAAP in this regard, except for the additional disclosure required by the latter. See Note 28(ac) to our Audited Consolidated Financial Statements. This program had no dilutive effect for Santander Chile minority shareholders.
The fair value of each option granted is calculated at the grant date. In order to value incentive-retention plan shares two valuation reports were performed by two multinational investment banks. These experts used the Black-Scholes equity option pricing model considering the following parameters: the expected life of the options, interest rates, volatility, exercise price, market price and dividends of Santander Spain shares and the shares of comparable banks. The fair value of the options granted was calculated as the average value resulting from the two valuations.
Euros Date of Date of Number of Exercise Employee Number Commencement Expiry of
Options/ Shares Price Group
of Persons
of Exercise Period
Exercise Period
Plans outstanding at 1 January 2005 - -
Options granted (Plan I06) 3,938,700 9.09 (**) Managers 112 Jan 15, 2008 Jan 15, 2009Options exercised - - Options cancelled or not exercised - Plans outstanding at December 31, 2005
3,938,700 9.09
Options exercised - - Options cancelled, net (Plan I06) (115,600) 9.09 Managers (4) Jan 15, 2008 Jan 15, 2009Plans outstanding at December 31, 2006
3,823,100 9.09
Shares granted (Plan I09) 281,187 - Managers 181 Jun 23, 2007 Jul 31, 2009Shares granted (Plan I10) 417,413 - Managers 181 Jun 23, 2007 Jul 31, 2010Options cancelled, net (Plan I06) (163,200) 9.09 Managers (4) Jan 15, 2008 Jan 15, 2009Plans outstanding at December 31, 2007
4,358,500 -
Of which: Plan I06 3,659,900 9.09 Plan I09 281,187 - Plan I10 417,413 -
(**) The exercise price of the options under Plan I06 is €9.09 per share, which is the weighted average of the daily average market price of the Bank’s shares on the continuous market in the first 15 trading days of January 2005. This was the criterion established in the resolution approving Plan I06 adopted at the Annual General Meeting of Santander Spain held on June 18, 2005.
Long-term incentive policy
During 2007, the Parent Company’s Board of Directors approved a long-term incentive policy for the period 2008-2010 aimed at Santander Spain’s executive directors and certain executive personnel in Spain and other

105
Santander Group companies. Certain high level executive of Santander Chile participate in this global Performance Share Plan implemented by Parent Company. This program had no dilutive effect for Santander Chile minority shareholders.
Performance Share Plan
This multi-annual incentive plan is payable in shares of Santander Spain. The beneficiaries of the plan are the executive directors and other members of senior management, together with any other Group executives determined by the Board of Directors of Santander Spain or, when delegated by its Executive Committee.
This plan will involve successive three-year cycles of share deliveries to the beneficiaries, so that each year one cycle will begin and, from 2009 onwards, another cycle will also end. The aim is to establish an adequate sequence between the end of the incentive program linked to the previous Plan and the successive cycles of this plan. Thus, the first two cycles will commence in July 2007, the first cycle having duration of two years (PI09) and the second cycle having a standard three-year term (PI10).
For each cycle, a maximum number of shares of Santander Spain are established for each beneficiary who remains in the Bank’s employ for the duration of the plan. The targets, which, if met, will determine the number of shares to be delivered, are defined by comparing Santander Spain’s performance with that of a benchmark group of financial institutions and are linked to two parameters, namely Total Shareholder Return (TSR) and growth in Earnings per Share (EPS). These parameters each have a 50% weighting in determining the percentage of shares to be delivered. In addition, the executives of Santander Chile must also meet their local commercial and earnings goals in order to receive this benefit and the Bank must also reach other commercial and earnings targets set by the Parent Company.
The ultimate number of shares to be delivered will be determined in each of the cycles by the degree of achievement of the targets on the third anniversary of commencement of each cycle (with the exception of the first cycle, for which the second anniversary will be considered), and the shares will be delivered within a maximum period of seven months from the end of the cycle. This number will range from the maximum percentage of shares, if Santander Spain, for each of the measures considered (TSR and EPS growth), ranks within the third quartile of the Benchmark Group, including the 75th percentile, to 30% of the maximum number of shares if it is placed at the median (50th percentile). If Santander Santander ranks below the median, all assignments of shares will be rendered null and void.
At December 31, 2007, the maximum number of shares to be delivered was 698,600 to 181 executives of Santander Chile (for a total of 281,187 for the first cycle (PI09) and 417,413 for the second cycle (PI10)). The fair value of the equity instruments granted under these plans was Ch$619 million (US$1.2 million), and this amount is charged to “Personnel expenses” in the specific period in which the beneficiaries provide their services to the Bank.
The fair value was calculated as follows:
It was assumed that the beneficiaries will remain employed by Santander Group companies during the term of each plan.
• The fair value of the 50% relating to the Bank’s relative TSR position was determined on the basis of the report of an independent expert whose assessment was based, inter alia, on the following variables:
• Expected volatility: determined on the basis of the historical volatility over a two-year period for PI09 and a three-year period for PI10. In the case of the Bank, the average volatility used was 16.25% for PI09 and 15.67% for PI10.
• Annual dividend yield: based on the data for the last two/three years before July 1, 2007. In the case of the Bank, this yield stood at 3.23% for PI09 and 3.24% for PI10.
• Risk-free interest rate: return on Treasury Bonds (zero coupon) offered on July 1, 2007, for a period of two years for PI09 (4.473%) and three years for PI10 (4.497%).

106
• Monte Carlo valuation model: performance of 10,000 simulations to determine the TSR of each of the companies in the Benchmark Group, taking into account the aforementioned variables. The results (each of which represents the delivery of a number of shares) are classified in decreasing order by calculating the weighted average and discounting the amount at the risk-free interest rate. Application of the simulation model results in percentage values of 42.7% for PI09 and 42.3% for PI10 (second cycle), which are applied to 50% of the value of the shares granted, in order to determine the cost per books of the TSR-based portion of the incentive. Since this valuation refers to a market condition, it cannot be adjusted after the grant date.
• In view of the high correlation between TSR and EPS, it was considered feasible to extrapolate that, in a high percentage of cases, the TSR value is also valid for EPS. Therefore, it was determined that the fair value of the portion of the plans linked to the Bank’s relative EPS position, i.e. of the remaining 50% of the shares granted, was the same as that of the 50% corresponding to the TSR. Since this valuation refers to a non-market condition, the number of shares expected to vest shall be reviewed and adjusted on a yearly basis.
In 2007, the management of Banco Santander Spain accorded to grant each active employee working for Banco Santander Spain or an entity controlled by Banco Santander Spain as of June 2007 a one-time gift of 100 shares in Banco Santander Spain to celebrate its 150th anniversary. This program had no costs for Santander-Chile.
We also pay bonuses to our administrative, supervisory and management personnel based on pre-defined goals (mainly commercial but also including items such as customer satisfaction) and our overall performance in the year. These bonuses are provisioned for monthly, according to the degree of accomplishment of our budget. We also give bonuses throughout the year to commercial teams for performance in other commercial contests. None of the members of our Board of Directors has a service contract which would entitle any Director to any benefits upon termination of employment with Santander-Chile. Santander-Chile currently does not have any profit-sharing arrangements with its employees. There is no system for the granting of options or securities of Santander-Chile to employees.
C. Board Practices
Summary Comparison of Corporate Governance Standards and NYSE Listed Company Standards
As a “Foreign Private Issuer” under the United States Securities Exchange Act of 1934 (“Exchange Act”) that is listed on the NYSE, we are required to provide a brief general summary of the significant ways in which our corporate governance standards, which are dictated by Chilean corporate law, differ from those followed by U.S. companies under NYSE listing standards.
Please note that because more than 50% of our voting power is held by another company, Banco Santander Spain, S.A., we would be permitted to elect certain exemptions under NYSE corporate governance standards. Specifically, as a U.S. company, we could elect to be exempted from the requirements (i) that we have a majority of independent directors (as defined by the NYSE), (ii) that we have a nominating/corporate governance committee meeting certain conditions, and (iii) that we have a compensation committee meeting certain requirements. Because as a U.S. company we would not be required to follow these standards, we do not discuss the differences, if any, between these provisions and our own corporate governance procedures in the table below.
The table below summarizes the significant differences between our corporate governance standards and those required by the NYSE for listed U.S. companies.
NYSE Listed Company Requirement Santander-Chile Corporate Governance Standard Non-management directors must meet at regularly scheduled executive sessions without management.
Under Chilean law, a company’s executive officers may not serve as such company’s directors. As a result, our board consists entirely of “non-management” directors, making separate meetings unnecessary.
Shareholders must be given the opportunity to vote on all equity-compensation plans and material revisions thereto.
Shareholders’ vote is not required for any equity-compensation plans other than those for the directors. Our compensation policies currently do not provide for

107
equity compensation, therefore do not trigger shareholders’ vote.
Listed companies must adopt and disclose corporate governance guidelines.
We follow the corporate governance guidelines established under Chilean laws, a summary of which is included in this 20-F.
Listed companies must adopt and disclose a code of business conduct and ethics for directors and employees, and promptly disclose any waivers of the code for directors or executive officers.
We have a code of business ethics and conduct which must be signed by all employees and are included as exhibits to this 20-F.
Summary of Corporate Governance Standards
Santander-Chile has adopted diverse measures to promote good corporate governance. Among the measures adopted are:
• Board of Directors mainly composed of professionals not related to Banco Santander Spain, our parent company.
• Active participation of Directors in main committees of the Bank.
• All personnel must subscribe to a code of ethics and good conduct. Those who interact directly with the capital markets must also subscribe to an additional code of conduct.
• Segregation of functions in order to assure adequate management of risks. Commercial areas separated from back office areas. Risk management independent of commercial areas. Main credit decisions taken in committees.
• Internal Auditing Area clearly independent from the Administration.
• The Bank also has an Internal Compliance Division that oversees the fulfillment of the Bank’s codes of conduct.
Santander-Chile has a commitment to transparency. This includes:
• Equal treatment for all shareholders. One share = one vote.
• Monthly publication of the Bank’s results by the Superintendency of Banks.
• Quarterly report of a detailed analysis of Bank results published by us at least 30 days after the close of each interim quarter and 40 days after close of the full year.
• Quarterly conference call open to the public.
• All information relevant to the public available immediately on the web page www.santander.cl.
• Ample and periodic coverage of the Bank by international and local stock analysts.
• The Bank has five credit risk ratings by five independent rating agencies, domestic and international.
Audit Committee
Board member Position in Committee Carlos Olivos Chairman Benigno Rodríquez. R.* Vice Chairman and Financial
Expert Víctor Arbulú. C. Member and Financial Expert

108
* On June 24, 2008, Mr. Rodriguez resigned from the Board and Audit Committee of Banco Santander Chile. His seat on the Audit Committee will be vacant until a replacement is nominated and approved during the Bank’s next board meeting, which is expected to be held in July 2008.
The Audit Committee (Comité de Directores y Auditoría) is comprised of three members of the Board of Directors. The General Secretary is the Committee Secretary. The Chief Executive Officer, General Auditor and other persons from the Bank can be invited to the meetings if necessary and presents on specific matters. This Committee’s primary responsibility is to support the Board of Directors in the continuous improvement of our system of internal controls, which includes reviewing the work of both the external auditors and the Internal Audit Department. The committee is also responsible for analyzing observations made by regulatory entities of the Chilean financial system about us and for recommending measures to be taken by our management in response. This committee also performs functions of a remuneration committee as established in Chilean Law, and reviews annually the salary and bonus programs for the executive officers of the Bank. The external auditors are recommended by this committee to our Board of Directors and appointed by our shareholders at the annual shareholders’ meeting.
Additionally this committee is responsible for:
• Presenting to the Board of Directors a list of candidates for the selection of an external auditor.
• Presenting to the board or directors a list of candidates for the selection of rating agencies.
• Overseeing and analyzing the results of the external audit and the internal reviews.
• Coordinating the activities of internal auditing with the external auditors’ review.
• Analyzing the interim and year-end financial statements and reporting the results to the Board of Directors.
• Analyzing the external auditors’ reports and their content, procedures and scope.
• Analyzing the rating agencies’ reports and their content, procedures and scope.
• Obtaining information regard the effectiveness and reliability of the internal control systems and procedures.
• Analyzing the information systems performance, its sufficiency, reliability and use in connection with decision-making processes.
• Obtaining information regarding compliance with the company’s policies regarding the due observance of laws, regulations and internal rules to which the company is subject.
• Obtaining information and resolve conflict interest matters and investigating suspicious and fraudulent activities.
• Analyzing the reports of the inspection visits, instructions and presentations of the Superintendency of Banks.
• Obtaining information, analyzing and verifying the company’s compliance with the annual audit program prepared by the internal audit department.
• Informing the Board of Directors of accounting changes and their effect.
• Examining on an annual basis the compensation plans of high level executives and managers.

109
Asset and Liability Committee
Board member Position in Committee Mauricio Larraín Chairman Roberto Zahler Member Marco Colodro Member
The Comité de Activos y Pasivos or the Asset and Liability Committee (the “ALCO”), following guidelines set by the Board of Directors, Santander Central Hispano’s Global Risk Department, is responsible for establishing Santander-Chile’s policies, procedures and limits with respect to market risks and monitoring the overall performance in light of the risks assumed. The ALCO constantly monitors whether these policies are fulfilled. Santander-Chile’s Market Risk and Control Department and the Financial Management Division carry out the day-to-day risk management of the trading and non-trading activities of Santander-Chile.
The composition of the Asset and Liabilities Management Committee includes the Chairman of the Board, two members of the Board, the Chief Executive Officer, the Manager of the Financial Management Division, the Manager of Market Risk, the Manager of Proprietary Trading, the Financial Controller and other senior members of management. Senior members of Santander-Chile’s Finance Division meet monthly on a formal basis with the Asset and Liabilities Management Committee and outside consultants.
Executive Credit Committee
Board member Position in Committee Mauricio Larraín Chairman Carlos Olivos Member Roberto Méndez Member Marco Colodro Member
The Executive Credit Committee is comprised of the Chairman of the Board, three additional Board members, the Corporate Legal Counsel, the CEO, the Manager of Global Banking, the Corporate Director of Risk, the Manager of Corporate Banking, the Manager of Middle Market and two senior members of the Credit Risk department that present the loans being reviewed for approval. This committee confirms the loan positions reviewed by the Senior Loan Committee, with approval rights up to the maximum exposure permitted by the General Banking Law.
Marketing and Communications Committee
Board member Position in Committee Mauricio Larraín Chairman Roberto Méndez Member
The Marketing and Communications Committee is comprised of the Chairman of the Board and an additional Board member, the CEO, the Manager of Retail Banking, the Manager of Santander Banefe, the Manager of Human Resources, the Manager of Corporate Communications, the Manager of Marketing and other senior managers of the Bank. This committee reviews and confirms all matters related to products, corporate image and communications.
D. Employees
As of December 31, 2007, on a consolidated basis we had 9,174 employees, 8,739 of whom were bank employees and 435 of whom were employees of our subsidiaries. With respect to the average number of employees for the Bank only, during the year ended December 31, 2006 and 2007, we had an average of 7,837 and 8,912 employees, respectively. We have traditionally enjoyed good relations with our employees and their unions. Of the total headcount, 3,775 or 41.1% were unionized. In March 2007, a new collective bargaining agreement became effective and will expire on March 1, 2011, but this may be negotiated ahead of schedule if management and union agree to. The primary terms of the new collective bargaining agreement include improved employee benefits relating to scholarships, sick days and insurance coverage for employees and a 5% increase in salaries as of May
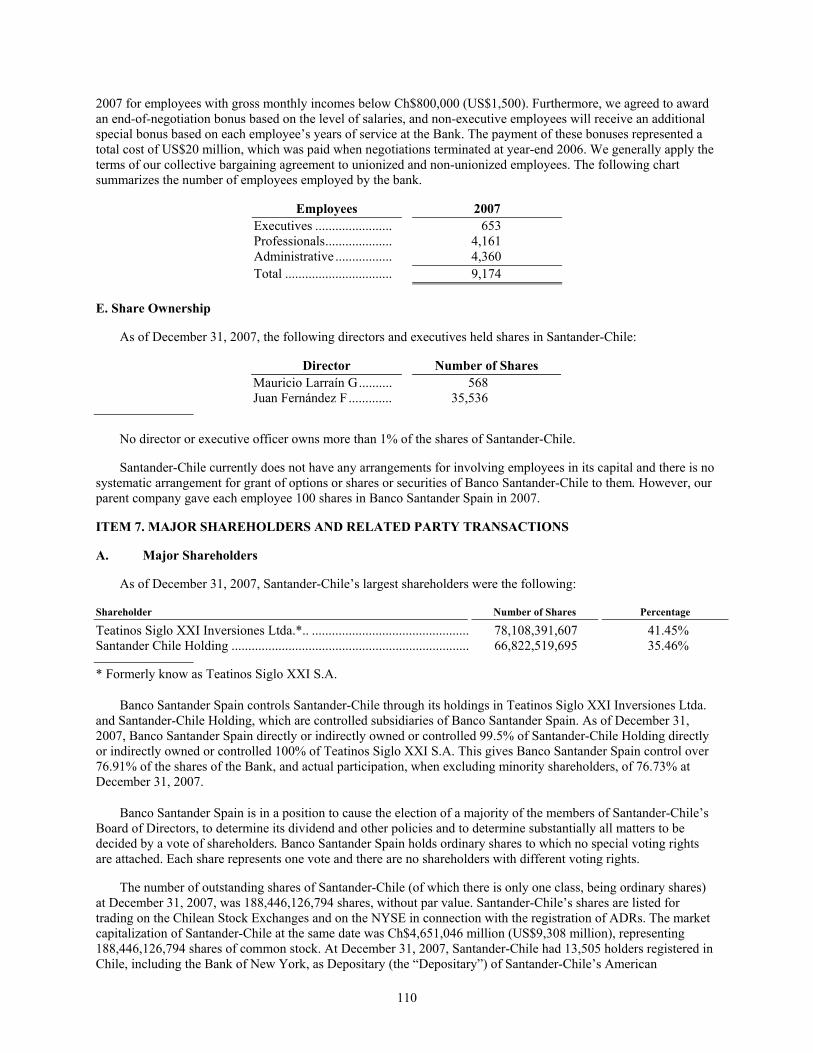
110
2007 for employees with gross monthly incomes below Ch$800,000 (US$1,500). Furthermore, we agreed to award an end-of-negotiation bonus based on the level of salaries, and non-executive employees will receive an additional special bonus based on each employee’s years of service at the Bank. The payment of these bonuses represented a total cost of US$20 million, which was paid when negotiations terminated at year-end 2006. We generally apply the terms of our collective bargaining agreement to unionized and non-unionized employees. The following chart summarizes the number of employees employed by the bank.
Employees 2007 Executives ....................... 653 Professionals.................... 4,161 Administrative ................. 4,360 Total ................................ 9,174
E. Share Ownership
As of December 31, 2007, the following directors and executives held shares in Santander-Chile:
Director Number of Shares Mauricio Larraín G.......... 568 Juan Fernández F ............. 35,536
No director or executive officer owns more than 1% of the shares of Santander-Chile.
Santander-Chile currently does not have any arrangements for involving employees in its capital and there is no systematic arrangement for grant of options or shares or securities of Banco Santander-Chile to them. However, our parent company gave each employee 100 shares in Banco Santander Spain in 2007.
ITEM 7. MAJOR SHAREHOLDERS AND RELATED PARTY TRANSACTIONS
A. Major Shareholders
As of December 31, 2007, Santander-Chile’s largest shareholders were the following:
Shareholder Number of Shares Percentage
Teatinos Siglo XXI Inversiones Ltda.*.. ............................................... 78,108,391,607 41.45% Santander Chile Holding ....................................................................... 66,822,519,695 35.46%
* Formerly know as Teatinos Siglo XXI S.A.
Banco Santander Spain controls Santander-Chile through its holdings in Teatinos Siglo XXI Inversiones Ltda. and Santander-Chile Holding, which are controlled subsidiaries of Banco Santander Spain. As of December 31, 2007, Banco Santander Spain directly or indirectly owned or controlled 99.5% of Santander-Chile Holding directly or indirectly owned or controlled 100% of Teatinos Siglo XXI S.A. This gives Banco Santander Spain control over 76.91% of the shares of the Bank, and actual participation, when excluding minority shareholders, of 76.73% at December 31, 2007.
Banco Santander Spain is in a position to cause the election of a majority of the members of Santander-Chile’s Board of Directors, to determine its dividend and other policies and to determine substantially all matters to be decided by a vote of shareholders. Banco Santander Spain holds ordinary shares to which no special voting rights are attached. Each share represents one vote and there are no shareholders with different voting rights.
The number of outstanding shares of Santander-Chile (of which there is only one class, being ordinary shares) at December 31, 2007, was 188,446,126,794 shares, without par value. Santander-Chile’s shares are listed for trading on the Chilean Stock Exchanges and on the NYSE in connection with the registration of ADRs. The market capitalization of Santander-Chile at the same date was Ch$4,651,046 million (US$9,308 million), representing 188,446,126,794 shares of common stock. At December 31, 2007, Santander-Chile had 13,505 holders registered in Chile, including the Bank of New York, as Depositary (the “Depositary”) of Santander-Chile’s American

111
Depositary Share Program. As of December 31, 2007, there were a total of 7 ADR holders on record. Since some of these ADRs are held by nominees, the number of record holders may not be representative of the number of beneficial holders.
Other than the information disclosed in this section, there are no arrangements in the knowledge of Santander-Chile, which can result in a change of control of Santander-Chile.
B. Related Party Transactions
The Chilean Companies Law requires that our transactions with related parties be on a market basis, that is, on similar terms to those customarily prevailing in the market. We are required to compare the terms of any such transaction to those prevailing in the market at the date the transaction is to be entered into. Directors of companies that violate this provision are liable for losses resulting from such violations.
In addition, under the Chilean Companies Law, a company may not enter into a transaction in which one or more of its directors has a direct or indirect interest unless (i) such transaction has received the prior approval of the company’s Board of Directors and (ii) the terms of such transaction are consistent with the terms of transactions of a similar type prevailing in the market. If it is not possible to make this determination, the board may appoint two independent evaluators. The evaluators’ final conclusions must be made available to shareholders and directors for a period of 20 business days, during which shareholders representing 5% or more of the issued voting shares may request the board to call a shareholders’ meeting to resolve the matter, with the agreement of two thirds of the issued voting shares required for approval. For purposes of this regulation, the law considers the amount of a proposed transaction to be material if (1) it exceeds 1% of the company’s net worth (provided that it also exceeds 2,000UF) or (2) it exceeds 20,000 UF.
All resolutions approving such transactions must be reported to the company’s shareholders at the next annual shareholders’ meeting. Violations of this provision may result in administrative, criminal or civil liability to the corporation, the shareholders and/or third parties who suffer losses as a result of such violation.
Loans granted to related parties
Related party loans, all of which are current, are as follows:
As of December 31, 2007
Loans
Collateral Pledged
Ch$mn Ch$mn Operating companies 88,510 50,404 Investment companies (1) 185,812 29,419 Individuals (2) 30,175 28,629 Total 304,497 108,452
(1) Includes companies whose purpose is to hold shares in other companies. (2) Includes debt obligations that are individually equal to or greater than UF 3,000, equivalent to Ch$59 million (US$118,995)
as of December 31, 2007. Includes loans to certain executive officers. All of the loans to the executive officers were made in our ordinary course of business, were made on substantially the same terms, including interest rates and collateral, as those prevailing at the time for comparable transactions with other persons, and did not involve more than the normal risk of collectability or present other unfavorable features.
Under the Chilean General Banking Law, Chilean banks are subject to certain lending limits, including the
following:
• a bank may not extend to any person or legal entity (or group of related entities), directly or indirectly, unsecured loans in an amount that exceeds 5.0% of the bank’s regulatory capital, or secured loans in an amount that exceeds 25.0% of its regulatory capital. In the case of foreign export trade finance, this 5.0% ceiling is raised to: 10.0% for unsecured financing, 30.0% for secured financing. This ceiling is raised to 15.0% for loans granted to finance public works under the concessions system contemplated in the Decree

112
with Force of Law 164 of 1991, of the Ministry of Public Works, provided that either the loan is secured on the concession, or the loan is granted as part of a loan syndication;
• a bank may not grant loans bearing more favorable terms than those generally offered by banks in the same community to any entity (or group of related entities) that is directly or indirectly related to its owners or management;
• a bank may not extend loans to another bank in an aggregate amount exceeding 30.0% of its regulatory capital;
• a bank may not directly or indirectly grant a loan the purpose of which is to allow the borrower to acquire shares in the lending bank;
• a bank may not lend, directly or indirectly, to a Director or any other person who has the power to act on behalf of the bank, or to certain related parties;
• a bank may not grant loans to individuals or legal entities involved in the ownership or management of the bank, whether directly or indirectly (including holders of 1.0% or more of its shares), on more favorable terms than those generally offered to non related parties. Loans may not be extended to senior executives and to companies in which such individuals have a participation of 5.0% or more of the equity or net earnings in such companies. The aggregate amount of loans to related parties may not exceed a bank’s regulatory capital; and
• the maximum aggregate amount of loans that a bank may grant to its employees is 1.5% of its regulatory capital, and no individual employee may receive loans in excess of 10.0% of such 1.5% limit. These limitations do not apply to a single home mortgage loan for personal use per term of employment of each employee.
We are not aware of any loans to any related parties exceeding the above lending limits.
Other transactions with related parties
During the years ended December 31, 2007, the Bank had the following significant income (expenses) from services provided to (by) related parties:
Year ended
December 31, 2007
Company Income/(Expenses)
Ch$ million Redbanc S.A. (payment for administering ATM network) ......................... (3,967) Transbank S.A. (payments for administering credit card network) ............. (6,871) Santander G.R.C. Ltda. (collection services)............................................... (3,218) Santander Chile Holding S.A. (rent)............................................................ 33 Santander Factoring S.A. (rent) ................................................................... 52 Bansa Santander S.A. (rent and sale of repossessed assets) ........................ (2,506) AFP Bansander S.A (rent) ........................................................................... 137 Altec S.A. (technology services) ................................................................. (6,103) Santander Investment Chile S.A. (rent) ....................................................... 95 Altavida Cia. De Seguro De Vida S.A. (rent and payment of life
insurance policies relating to certain loans) ............................................. (1,675) Santander Cia. de Seguros Generales S.A. (rent and payment of life
insurance policies relating to certain loans) ............................................. (821) Plaza El Trebol S A (rent) ........................................................................... (68) Other (1) ...................................................................................................... 130 Total............................................................................................................. (24,782)
(1) Consists primarily of payment of stipend to Board members.

113
On January 15, 2007, Santander Investment S.A. Corredores de Bolsa, an affiliate of Banco Santander Chile controlled by Santander Spain, approved the merger between Santiago Corredores de Bolsa Limitada, a subsidiary of Banco Santander Chile, into Santander Investment S.A. Corredores de Bolsa, effective January 1, 2007. Santander Investment S.A. Corredores de Bolsa, as of January 15, 2007, became a subsidiary of Banco Santander Chile and the legal successor of Santiago Corredores de Bolsa Limitada.
The merger of Santiago Corredores de Bolsa Limitada and Santander Investment S.A. Corredores de Bolsa was accounted as a business combination of entities under common control, thus, the lower value determined in the transaction was recorded as a charge to the Bank’s shareholders’ equity in an amount of Ch$1,903 million.
C. Interests of Experts and Counsel
Not applicable.
ITEM 8. FINANCIAL INFORMATION
A. Consolidated Statements and Other Financial Information
Financial Information
See Item 18.
Legal Proceedings
On August 26, 1992, a lawsuit was filed by the Chilean Internal Revenue Service against the Bank. On December 13, 2007, the Bank paid Ch$423 million to the Chilean Revenue Service, concluding this contingency.
Our General Counsel was indicted by the national treasury in a lawsuit regarding the repayment by Inverlink Corredores de Bolsa of a Ch$980 million (equivalent to US$1.8 million) loan made to it by Banco Santander-Chile. Repayment was made by tendering to Banco Santander-Chile a cashier’s check issued by another bank in favor of Banco Santander-Chile. The Bank was not legally required to verify the legitimacy of the funds used to obtain the cashier’s check and, authenticity of the cashier’s check and, accordingly, cashed it in satisfaction of its loan to Inverlink. Subsequently, the Bank learned that the cashier’s check had been obtained from the issuing bank by Inverlink Corredores de Bolsa with funds fraudulently obtained from CORFO. The Bank actively cooperated with the investigation and agreed to pay Ch$980 million to CORFO. In Janaury 2007, the courts approved the motion to end this trial against our General Counsel. The national treasury appealed this ruling. In November 2007, the courts approved and ratified definitively the motion to end this trial against our General Counsel.
In addition, we are subject to certain claims and are party to certain legal and arbitration proceedings incidental to the normal course of our business including claims for alleged operational errors. We do not believe that the liabilities related to such claims and proceedings are likely to have, individually or in the aggregate, a material adverse effect on our consolidated financial condition or results of operations. Nevertheless, based on management’s individual analysis of each proceeding, we have made provisions in the amount reported as “Provisions for lawsuit and other” in Note 10(b) of our Consolidated Financial Statements. Other than the proceedings described above, there are no material proceedings in which any of our directors, any members of our senior management or any of our affiliates is either a party adverse to us or to our subsidiaries or has a material interest adverse to us or our subsidiaries.
Dividends and dividend policy
See “Item 3: A. Selected Financial Data—Dividends.”
B. Significant Changes
None.

114
ITEM 9. THE OFFER AND LISTING
A. Historical Trading Information
The table below shows, for the periods indicated, the annual, quarterly and monthly high and low closing prices (in nominal Chilean pesos) of the shares of our common stock on the Santiago Stock Exchange and the annual, quarterly and monthly high and low closing prices (in U.S. dollars) as reported by the NYSE.
Santiago Stock
Exchanges NYSE
Common Stock ADS(2)
High Low High Low
(Ch$ per share(1)) (US$ per ADS)
Annual Price History 2003 .................................................................................................................. 15.30 12.65 24.65 17.05 2004 .................................................................................................................. 18.20 13.30 33.90 23.55 2005 .................................................................................................................. 22.75 17.11 45.86 30.40 2006 .................................................................................................................. 26.20 19.60 51.46 37.40 2007 .................................................................................................................. 27.10 21.25 55.30 41.76 Quarterly Price History 2006 1st Quarter ........................................................................................................ 25.09 21.60 49.85 43.10 2nd Quarter....................................................................................................... 23.20 19.60 46.80 37.40 3rd Quarter........................................................................................................ 24.00 19.75 46.50 37.66 4th Quarter........................................................................................................ 26.20 22.90 51.46 44.69 2007 1st Quarter ........................................................................................................ 26.75 24.35 51.14 46.75 2nd Quarter....................................................................................................... 27.10 24.49 53.13 48.39 3rd Quarter........................................................................................................ 25.40 21.25 50.74 41.76 4th Quarter........................................................................................................ 26.21 21.75 55.30 43.99 2008 1st Quarter ........................................................................................................ 24.86 20.00 53.37 45.58 Monthly Price History December 2007................................................................................................. 24.49 22.80 51.20 46.75January 2008..................................................................................................... 24.86 20.00 51.70 45.58February 2008................................................................................................... 24.00 21.25 53.37 47.11March 2008....................................................................................................... 22.67 20.82 52.39 48.96April 2008......................................................................................................... 23.55 22.49 54.34 50.40May 2008.......................................................................................................... 24.46 22.80 54.60 51.02June 2008 (as per June 24, 2008) 23.91 21.20 51.47 43.53
B. Plan of Distribution
Not applicable
C. Nature of Trading Market
Nature of Trading Market
Shares of our common stock are traded on the Chilean Stock Exchanges. Each ADS represents 1,039 shares of common stock. ADRs have been issued pursuant to the Deposit Agreement, dated as of August 1, 2002, among Santander-Chile, the Depositary and all holders from time to time of ADRs. As of December 31, 2006, 25,957,667 ADSs were outstanding (equivalent to 26,970,016,013 shares of common stock or 14.3% of the total number of issued shares of common stock).
D. Selling Shareholders
Not Applicable.

115
E. Dilution
Not Applicable.
F. Expenses of the Issue
Not Applicable.
ITEM 10. ADDITIONAL INFORMATION
A. Share Capital
Not applicable.
B. Memorandum and Articles of Association
The legal predecessor of Santander-Chile was Banco Santiago (Santiago). Santiago was incorporated by public deed dated September 7, 1977 granted at the Notary Office of Alfredo Astaburuaga Gálvez. Santiago received its permission to incorporate and function as a bank by Resolution No. 118 of the Superintendency of Banks on October 27, 1977. The Bank’s by-laws were approved by Resolution No. 103 of the Superintendency of Banks on September 22, 1977. In January 1997, Santiago merged with Banco O’Higgins’ with Santiago as the surviving entity. In 1999, Santiago became a controlled subsidiary of Banco Santander Spain.
On May 24, 2007, we have changed our by-laws insofar as our official name shall be Banco Santander-Chile (formerly: Banco Santander Chile) and that the Bank may also use the following names: Banco Santander Santiago, Santander Santiago, Banco Santander, or Santander (formerly only: Banco Santander Santiago and Santander Santiago.)
Shareholder rights in a Chilean bank that is also an open stock (public) corporation are governed by (1) the corporation’s estatutos, which effectively serve the purpose of both the articles or certificate of incorporation and the by-laws of a company incorporated in the United States, (2) the General Banking Law and (3) to the extent not inconsistent with the General Banking Law, by the provisions of Chilean Companies Law applicable to open stock corporations, except for certain provisions that are expressly excluded. Article 137 of the Chilean Companies Law provides that all provisions of the Chilean Companies Law take precedence over any contrary provision in a corporation’s estatutos. Both the Chilean Companies Law and our estatutos provide that legal actions by shareholders against us (or our officers or directors) to enforce their rights as shareholders or by one shareholder against another in their capacity as such are to be brought in Chile in arbitration proceedings, notwithstanding the plaintiff’s right to submit the action to the ordinary courts of Chile.
The Chilean securities markets are principally regulated by the Superintendency of Securities and Insurance under the Chilean Securities Market Law and the Chilean Companies Law. In the case of banks, compliance with these laws is supervised by the Superintendency of Banks. These two laws provide for disclosure requirements, restrictions on insider trading and price manipulation and protection of minority investors. The Chilean Securities Market Law sets forth requirements relating to public offerings, stock exchanges and brokers, and outlines disclosure requirements for companies that issue publicly offered securities. The Chilean Companies Law sets forth the rules and requirements for establishing open stock corporations while eliminating government supervision of closed (closely-held) corporations. Open stock (public) corporations are those with 500 or more shareholders, or companies in which 100 or more shareholders own at least 10.0% of the subscribed capital (excluding those whose individual holdings exceed 10.0%), and all other companies that are registered in the Securities Registry of the Superintendency of Securities and Insurance.
Board of Directors
The Board of Directors has 11 regular members and 2 alternate members, elected by shareholder vote at General Shareholders’ Meetings. The directors may be either shareholders or non-shareholders of the Company.
A director remains in office for three years and may be reelected indefinitely. If for any reason, the General Shareholders’ Meeting where the newly appointments of directors are to be made is not held, the duties of those

116
serving as such shall be extended until their replacements are designated, in which case, the Board of Director shall convene a Meeting at the earliest possible time in order to effect the appointments.
The directors are entitled to compensation for the performance of their duties. The amount of their compensation is determined annually by the General Shareholders’ Meeting. In addition, payments in the form of wages, fees, travel accounts, expense accounts, dues as representatives of the Board of Directors and other cash payments, payments in kind or royalties of any sort whatsoever, may be paid to certain directors for the performance of specific duties or tasks in addition to their functions as directors imposed upon them specifically by the General Shareholders’ Meeting. Any special compensation is authorized or approved at the General Shareholders’ Meeting, and for that purpose, a detailed and separate entry shall be made in the Annual Report, which shall expressly indicate the complete name of each of the directors receiving special compensation.
Without prejudice to any other incapacity or incompatibility established by law, the following may not be directors: (a) those persons who have been sentenced or are being tried, either as principals or accessories, for crimes punishable with a penalty of temporary or permanent suspension from or incapacity to hold public office; (b) those persons who have been declared bankrupt and have not been rehabilitated; (c) members of the House of Representatives and the Senate; (d) directors or employees of any other financial institution; employees appointed by the President of the Republic and employees or officers of (i) the State, (ii) any public service, public institution, semi-public institution, autonomous entity or state-controlled company (any such entity a “Public Entity”) or (iii) any enterprise, corporation or public or private entity in which the State or a Public Entity has a majority interest, has made capital contributions, or is represented or participating, provided that persons holding positions in teaching activities in any of the above entities may be directors; and (f) the Bank’s employees, which shall not prevent a director from holding on a temporary basis and for a term not to exceed ninety days the position of General Manager. Chief Executive Officers may not be elected as directors.
For purposes of the appointment of directors, each shareholder shall have the right to one vote per share for purposes of appointing a single person, or to distribute his votes in between candidates as he may deem convenient, and the persons obtaining the largest number of votes in the same and single process shall be awarded positions, until all positions have been filled. The election of the regular and alternate board members shall be carried out separately. For purposes of the casting of the vote, the Chairman and the Secretary, together with any other persons that may have been previously designated by the Meeting to sign the minutes thereof, shall issue a certificate giving evidence of the oral votes of shareholders attending, following the order of the list of attendance being taken.
Each shareholder shall be entitled, however, to cast his vote by means of a ballot signed by him, stating whether he signs for his own account or as a representative. This entitlement notwithstanding, in order to expedite the voting process, the Chairman of the Bank or the Superintendency, as the case may be, is entitled to order that the vote be taken alternatively or by oral vote or by means of ballots. At the time of polling, the Chairman may instruct that the votes be read aloud, in order for those in attendance to count for themselves the number of votes issued and verify the outcome of the voting process.
The Secretary tabulates the votes and the Chairman announces those who have obtained the largest majorities until all the director positions have been filled. The Secretary places the documents evidencing the outcome of the count, duly signed by the persons charged with the duty of verifying the number of votes issued, together with the ballots delivered by the shareholders who did not vote orally, in an envelope which shall be closed and sealed with the corporate seal and shall remain deposited with the Bank for a least two years.
Every appointment of directors, or any changes in the appointment of directors, shall be transcribed into a public deed before a notary public, published in a newspaper of Santiago and notified to the Superintendency of Banks and Financial Institutions, by means of the filing of a copy of the respective public deed. Likewise, the appointments of General Manager, Manager and Deputy Managers shall be communicated and transcribed into a public deed.
If a director ceases to be able to perform his or her duties, whether by reason of conflict of interest, limitation, legal incapacity or bankruptcy, impossibility, resignation or any other legal cause, the vacancy shall be filled as follows: (a) the positions of regular directors shall be filled by an alternate director; and (b) the positions of alternate directors vacated upon the application of (a) above, and the positions of regular directors if a regular director’s position can not be filled pursuant to clause (a) because both alternate members have already become regular members, shall be filled by the Board of Directors on its first meeting after the vacancy occurs. Board members
117
appointed pursuant to clause (b) will remain in the position until the next General Shareholders’ Meeting, where the appointment may be ratified, in which case, the replacement director will remain in his or her position until the expiration of the term of the director he or she replaced.
The alternate directors may temporarily replace regular directors in case of their absence or temporary inability to attend a board meeting, or in a definitive manner in case of vacancy. The alternate board members are always entitled to attend and speak at board meetings. They will be entitled to vote at such meetings only when a regular member is absent and such alternate member acts as the absent member’s replacement.
During the first meeting following the General Shareholders’ Meeting, the Board of Directors shall elect in separate votes from among its members, a Chairman, a First Vice Chairman and a Second Vice Chairman. In the event of a tie, the appointment shall be decided by lottery.
The Board of Directors meet in ordinary sessions at least once a month, held on pre-set dates and times determined by the Board. Extraordinary meetings are held whenever called by the Chairman, whether at his own will or upon the request of three or more directors, so long as the Chairman determines in advance that the meeting is justified, except if the request is made by the absolute majority of the directors in office, in which case the meeting shall be held without such prior determination. The extraordinary meetings may only address those matters specifically included in the agenda for the extraordinary meeting, except that, if the meeting is attended by all the directors in office, they may agree otherwise by a unanimous vote. Extraordinary meetings shall be called by means of a written instrument signed by the Chairman or the Secretary or his alternate and delivered to each of the directors at least three days prior to the date set for the meeting.
The quorum for the Board of Directors’ Meeting is six of its members. Resolutions shall be adopted by the affirmative vote of the absolute majority of the attending directors. In the event of a tie, the person acting as the Chairman of the meeting shall cast a deciding vote.
Directors having a vested interest in a negotiation, act, contract or transaction that is not related to the bank business, either as principal or as representative of another person, shall communicate such fact to the other directors. If the respective resolutions are approved by the Board, it shall be in accordance to the prevailing fair market conditions and director’s interest must be disclosed at the next General Shareholders’ Meeting.
The discussions and resolutions of the Board of Directors shall be recorded in a special book of minutes maintained by the Secretary. The relevant minutes shall be signed by the directors attending the meeting and by the Secretary, or his alternate. If a director determines that the minutes for a meeting are inaccurate or incomplete, he is entitled to record an objection before actually signing the minutes. The resolutions adopted may be carried out prior to the approval of the minutes at a subsequent meeting. In the event of death, refusal or incapacity for any reason of any of the directors attending to sign the minutes, such circumstance shall be recorded at the end of the minutes stating the reason for the impediment.
The directors are personally liable for all of the acts they effect in the performance of their duties. Any director who wishes to disclaim responsibility for any act or resolution of the Board of Directors must to record his opposition in the minutes, and the Chairman must report the opposition at the following General Shareholders’ Meeting.
The Board will represent the Bank in and out of court and, for the performance of the Bank’s business, a circumstance that will not be necessary to prove before third parties, it will be empowered with all the authorities and powers of administration that the law or the by-laws do not set as exclusive to the General Shareholders’ Meeting, without being necessary to grant any special power of attorney, even for those acts that the law requires to do so. This provision is notwithstanding the judicial representation of the Bank that is part of the General Manager’s authorities. The Board may delegate part of its authority to the General Manager, to the Managers, Deputy Managers or Attorneys of the Bank, a Director, a Commission of Directors, and for specifically determined purposes, in other persons.
Meetings and Voting Rights
An ordinary annual meeting of shareholders is held within the first four months of each year. The ordinary annual meeting of shareholders is the corporate body that approves the annual financial statements, approves all dividends in accordance with the dividend policy determined by our Board of Directors, elects the Board of

118
Directors and approves any other matter that does not require an extraordinary shareholders’ meeting. The last ordinary annual meeting of our shareholders was held on April 22, 2008. Extraordinary meetings may be called by our Board of Directors when deemed appropriate, and ordinary or extraordinary meetings must be called by our Board of Directors when requested by shareholders representing at least 10.0% of the issued voting shares or by the Superintendency of Banks. Notice to convene the ordinary annual meeting or an extraordinary meeting is given by means of three notices which must be published in a newspaper of our corporate domicile (currently Santiago) or in the Official Gazette in a prescribed manner, and the first notice must be published not less than 15 days nor more than 20 days in advance of the scheduled meeting. Notice must also be mailed 15 days in advance to each shareholder and given to the Superintendency of Banks and the Chilean Stock Exchanges. Currently, we publish our official notices in the El Mercurio newspaper of Santiago.
The quorum for a shareholders’ meeting is established by the presence, in person or by proxy, of shareholders representing at least an absolute majority of the issued shares. If a quorum is not present at the first meeting, the meeting can be reconvened (in accordance with the procedures described in the previous paragraph) and, upon the meeting being reconvened, shareholders present at the reconvened meeting are deemed to constitute a quorum regardless of the percentage of the shares represented. The shareholders’ meetings pass resolutions by the affirmative vote of an absolute majority of those voting shares present or represented at the meeting. The vote required at any shareholders’ meeting to approve any of the following actions, however, is a two-thirds majority of the issued shares:
• a change in corporate form, spin-off or merger;
• an amendment of the term of existence, if any, and the early dissolution of the bank;
• a change in corporate domicile;
• a decrease of corporate capital previously approved by the Superintendency of Banks, provided it is not reduced below the legal minimum capital;
• a decrease in the number of directors previously approved by the Superintendency of Banks;
• the approval of contributions and appraisal of properties other than cash, in those cases where it is permitted by the General Banking Act;
• the amendment of authority of the general shareholders’ meeting or the restriction of the authority of the Board of Directors;
• the transfer of 50.0% or more of the corporate assets, regardless of whether it includes liabilities, or the implementation or amendment of any business plan that contemplates the transfer of 50.0% or more of the corporate assets;
• a change in the manner of distribution of profits established in the by-laws;
• any non-cash distribution in respect of the shares;
• the repurchase of shares of stock in the Bank; or
• the approval of material related-party transactions when requested by shareholders representing at least 5.0% of the issued and outstanding shares with right to vote if they determine that the terms and conditions of those transactions are not favorable to the interests of the bank or if two independent assessments of those transactions requested by the Board materially differ from each other.
Shareholders may accumulate their votes for the election of directors and cast all of their votes in favor of one person.
In general, Chilean law does not require a Chilean open stock corporation to provide the level and type of information that U.S. securities laws require a reporting company to provide to its shareholders in connection with a solicitation of proxies. However, shareholders are entitled to examine the books of the bank within the 15-day period before the ordinary annual meeting. Under Chilean law, a notice of a shareholders’ meeting listing matters to be

119
addressed at the meeting must be mailed not fewer than 15 days prior to the date of such meeting, and, in cases of an ordinary annual meeting, shareholders holding a prescribed minimum investment must be sent an Annual Report of the bank’s activities which includes audited financial statements. Shareholders who do not fall into this category but who request it must also be sent a copy of the bank’s Annual Report. In addition to these requirements, we regularly provide, and management currently intends to continue to provide, together with the notice of shareholders’ meeting, a proposal for the final annual dividend.
The Chilean Corporations Law provides that whenever shareholders representing 10.0% or more of the issued voting shares so request, a Chilean company’s Annual Report must include, in addition to the materials provided by the Board of Directors to shareholders, such shareholders’ comments and proposals in relation to the company’s affairs. Similarly, the Chilean Corporations Law provides that whenever the Board of Directors of an open stock corporation convenes an ordinary shareholders’ meeting and solicits proxies for that meeting, or distributes information supporting its decisions, or other similar material, it is obligated to include as an annex to its Annual Report any pertinent comments and proposals that may have been made by shareholders owning 10.0% or more of the company’s voting shares who have requested that such comments and proposals be so included.
Only shareholders registered as such with us on the fifth business day prior to the date of a meeting are entitled to attend and vote their shares. A shareholder may appoint another individual (who need not be a shareholder) as his proxy to attend and vote on his behalf. Every shareholder entitled to attend and vote at a shareholders’ meeting has one vote for every share subscribed. Each share represents one vote and there are no special classes of shares with different rights. Our by-laws do not include any condition that is more significant than required by law to change the right of shareholders.
Capitalization
Under Chilean law, the shareholders of a company, acting at an extraordinary shareholders’ meeting, have the power to authorize an increase in such company’s capital. When an investor subscribes for issued shares, the shares are registered in such investor’s name, even if not paid for, and the investor is treated as a shareholder for all purposes except with regard to receipt of dividends and the return of capital, provided that the shareholders may, by amending the by-laws, also grant the right to receive dividends or distributions of capital. The investor becomes eligible to receive dividends and returns of capital once it has paid for the shares (if it has paid for only a portion of such shares, it is entitled to reserve a corresponding pro-rata portion of the dividends declared and/or returns of capital with respect to such shares unless the company’s by-laws provide otherwise). If an investor does not pay for shares for which it has subscribed on or prior to the date agreed upon for payment, the company is entitled under Chilean law to auction the shares on the stock exchange and collect the difference, if any, between the subscription price and the auction proceeds. However, until such shares are sold at auction, the subscriber continues to exercise all the rights of a shareholder (except the right to receive dividends and return of capital).
Article 22 of the Chilean Corporations Law states that the purchaser of shares of a company implicitly accepts its by-laws and any agreements adopted at shareholders’ meetings.
Approval of Financial Statements
Our Board of Directors is required to submit our audited financial statements to the shareholders annually for their approval. The approval or rejection of such financial statements is entirely within our shareholders’ discretion. If our shareholders reject our financial statements, our Board of Directors must submit new financial statements not later than 60 days from the date of such rejection. If our shareholders reject our new financial statements, our entire Board of Directors is deemed removed from office and a new Board of Directors is elected at the same meeting. Directors who individually approved such rejected financial statements are disqualified for re-election for the ensuing period.
Registrations and Transfers
We act as our own registrar and transfer agent, as is customary among Chilean companies. In the case of jointly owned shares, an attorney-in-fact must be appointed to represent the joint owners in dealings with us.

120
Dividend, Liquidation and Appraisal Rights
Under the Chilean Corporations Law, Chilean companies are generally required to distribute at least 30.0% of their earnings as dividends.
In the event of any loss of capital, no dividends can be distributed so long as such loss is not recovered. Also, no dividends of a bank above the legal minimum can be distributed if doing so would result in the bank exceeding its ratio of risk-weighted assets to regulatory capital or total assets.
Dividends that are declared but not paid by the date set for payment at the time of declaration are adjusted from the date set for payment to the date such dividends are actually paid, and they accrue interest.
We may declare a dividend in cash or in shares. When a share dividend is declared above the legal minimum (which minimum must be paid in cash), our shareholders must be given the option to elect to receive cash. Our ADS holders may, in the absence of an effective registration statement under the Securities Act or an available exemption from the registration requirement thereunder, effectively be required to receive a dividend in cash. See “Item 10: B. Memorandum and Articles of Incorporation—Preemptive Rights and Increases of Share Capital.”
In the event of our liquidation, the holders of fully paid shares would participate equally and pro rata, in proportion to the number of paid-in shares held by them, in the assets available after payment of all creditors.
In accordance with the General Banking Law, our shareholders do not have appraisal rights.
Ownership Restrictions
Under Article 12 of the Chilean Securities Market Law and the regulations of the Superintendency of Banks, shareholders of open stock corporations are required to report the following to the Superintendency of Securities and Insurance and the Chilean Stock Exchanges:
• any direct or indirect acquisition or sale of shares that results in the holder’s acquiring or disposing, directly or indirectly, 10.0% or more of an open stock corporation’s share capital; and
• any direct or indirect acquisition or sale of shares or options to buy or sell shares, in any amount, if made by a holder of 10.0% or more of an open stock corporation’s capital or if made by a director, liquidator, main officer, general manager or manager of such corporation.
In addition, majority shareholders must include in their report whether their purpose is to acquire control of the company or if they are making a financial investment. A beneficial owner of ADSs representing 10.0% or more of our share capital will be subject to these reporting requirements under Chilean law.
Under Article 54 of the Chilean Securities Market Law and the regulations of the Superintendency of Securities and Insurance, persons or entities intending to acquire control, directly or indirectly, of an open stock corporation, regardless of the acquisition vehicle or procedure, and including acquisitions made through direct subscriptions or private transactions, are also required to inform the public of such acquisition at least 10 business days before the date on which the transaction is to be completed, but in any case, as soon as negotiations regarding the change of control begin (i.e., when information and documents concerning the target are delivered to the potential acquiror) through a filing with the Superintendency of Securities and Insurance, the stock exchanges and the companies controlled by and that control the target and through a notice published in two Chilean newspapers, which notice must disclose, among other information, the person or entity purchasing or selling and the price and conditions of any negotiations.
Prior to such publication, a written communication to such effect must be sent to the target corporation, to the controlling corporation, to the corporations controlled by the target corporation, to the Superintendency of Securities and Insurance, and to the Chilean stock exchanges on which the securities are listed.
In addition to the foregoing, Article 54A of the Chilean Securities Market Law requires that within two business days of the completion of the transactions pursuant to which a person has acquired control of a publicly traded company, a notice shall be published in the same newspapers in which the notice referred to above was published and notices shall be sent to the same persons mentioned in the preceding paragraphs.

121
The provisions of the aforementioned articles do not apply whenever the acquisition is being made through a tender or exchange offer.
Title XXV of the Chilean Securities Market Law on tender offers and the regulations of the Superintendency of Securities and Insurance provide that the following transactions must be carried out through a tender offer:
• an offer which allows a person to take control of a publicly traded company, unless (i) the shares are being sold by a controlling shareholder of such company at a price in cash which is not substantially higher than the market price and the shares of such company are actively traded on a stock exchange and (ii) those shares are acquired (a) through a capital increase, (b) as a consequence of a merger, (c) by inheritance or (d) through a forced sale; and
• an offer for a controlling percentage of the shares of a listed company if such person intends to take control of the parent company (whether listed or not) of such listed company, to the extent that the listed company represents 75.0% or more of the consolidated net worth of the parent company.
In addition, Article 69bis of the Companies Law requires that whenever a controlling shareholder acquires two thirds of the voting shares of a listed company, such controlling shareholder must offer to purchase the remaining shares from the minority shareholders in a tender offer.
Article 200 of the Chilean Securities Market Law prohibits any shareholder that has taken control of a publicly traded company to acquire, for a period of 12 months from the date of the transaction in which it gained control of the publicly traded company, a number of shares equal to or greater than 3.0% of the outstanding issued shares of the target without making a tender offer at a price per share not lower than the price paid at the time of taking control. Should the acquisition from the other shareholders of the company be made on a stock exchange and on a pro rata basis, the controlling shareholder may purchase a higher percentage of shares, if so permitted by the regulations of the stock exchange.
Title XV of the Chilean Securities Market Law sets forth the basis to determine what constitutes a controlling power, a direct holding and a related party. The Chilean Securities Market Law defines control as the power of a person or group of persons acting (either directly or through other entities or persons) pursuant to a joint action agreement, to direct the majority of the votes at the shareholders’ meetings of the corporation, to elect the majority of members of its Board of Directors, or to influence the management of the corporation significantly. Significant influence is deemed to exist in respect of the person or group of persons with an agreement to act jointly that holds, directly or indirectly, at least 25.0% of the voting share capital, unless:
• another person or group of persons acting pursuant to joint action agreement, directly or indirectly, controls a stake equal to or greater than the percentage controlled by such person or group of persons;
• the person or group does not control, directly or indirectly, more than 40.0% of the voting share capital and the percentage controlled is lower than the sum of the shares held by other shareholders holding more than 5.0% of the share capital (either directly or pursuant to a joint action agreement); or
• in cases where the Superintendency of Securities and Insurance has ruled otherwise, based on the distribution or atomization of the overall shareholding.
According to the Chilean Securities Market Law, a joint action agreement is an agreement among two or more parties which, directly or indirectly, own shares in a corporation at the same time and whereby they agree to participate with the same interest in the management of the corporation or in taking control of the same. The law presumes that such an agreement exist between:
• a principal and its agents;
• spouses and relatives within certain degrees of kinship;
• entities within the same business group; and
• an entity and its controller or any of the members of the controller.

122
Likewise, the Superintendency of Securities and Insurance may determine that a joint action agreement exists between two or more entities considering, among other things, the number of companies in which they participate and the frequency with which they vote identically in the election of directors, appointment of managers and other resolutions passed at extraordinary shareholders’ meetings.
According to Article 96 of the Chilean Securities Market Law, a business group is a group of entities with such ties in their ownership, management or credit liabilities that it may be assumed that the economic and financial action of such members is directed by, or subordinated to, the joint interests of the group, or that there are common credit risks in the credits granted to, or in the acquisition of securities issued by, them. According to the Chilean Securities Market Law, the following entities are part of the same business group:
• a company and its controller;
• all the companies with a common controller together with that controller;
• all the entities that the Superintendency of Securities and Insurance declares to be part of the business group due to one or more of the following reasons:
• a substantial part of the assets of the company is involved in the business group, whether as investments in securities, equity rights, loans or guaranties;
• the company has a significant level of indebtedness and the business group has a material participation as a lender or guarantor;
• any member of a group of controlling entities of a company mentioned in the first two bullets above and there are grounds to include it in the business group; or
• the company is controlled by a member of a group of controlling entities and there are grounds to include it in the business group.
Article 36 of the General Banking Law states that as a matter of public policy, no person or company may acquire, directly or indirectly, more than 10.0% of the shares of a bank without the prior authorization of the Superintendency of Banks, which may not be unreasonably withheld. The prohibition would also apply to beneficial owners of ADSs. In the absence of such authorization, any person or group of persons acting in concert would not be permitted to exercise voting rights with respect to the shares or ADSs acquired. In determining whether or not to issue such an authorization, the Superintendency of Banks considers a number of factors enumerated in the General Banking Law, including the financial stability of the purchasing party.
According to Article 35bis of the General Banking Law, the prior authorization of the Superintendency of Banks is required for:
• the merger of two or more banks;
• the acquisition of all or a substantial portion of a banks’ assets and liabilities by another bank;
• the control by the same person, or controlling group, of two or more banks; or
• a substantial increase in the existing control of a bank by a controlling shareholder of that bank.
This prior authorization is only required when the acquiring bank or the resulting group of banks would own a significant market share in loans, defined by the Superintendency of Banks to be more than 15.0% of all loans in the Chilean banking system. The intended purchase, merger or expansion may be denied by the Superintendency of Banks; or, if the acquiring bank or resulting group would own a market share in loans determined to be more than 20.0% of all loans in the Chilean banking system, the purchase, merger, or expansion may be conditioned on one or more of the following:
• the bank or banks maintaining regulatory capital higher than 8.0% and up to 14.0% of risk-weighted assets;

123
• the technical reserve established in Article 65 of the General Banking Law being applicable when deposits exceed one and a half times the resulting bank’s paid-in capital and reserves; or
• the margin for interbank loans be reduced to 20.0% of the resulting bank’s regulatory capital.
If the acquiring bank or resulting group would own a market share in loans determined by the Superintendency of Banks to be more than 15% but less than 20%, the authorization will be conditioned on the bank or banks maintaining a regulatory capital not lower than 10% of their risks weighted assets for the period specified by the Superintendency of Banks, which may not be less than one year. The calculation of the risk weighted assets is based on a five category risk classification system applied to a bank’s assets that is based on the Basel Committee recommendations.
According to the General Banking Law, a bank may not grant loans to related parties on terms more favorable than those generally offered to non-related parties. Article 84 No. 2 of the General Banking Law and the regulations issued by the Superintendency of Banks creates the presumption that natural persons who are holders of shares and who beneficially own more than 1.0% of the shares are related to the bank and imposes certain restrictions on the amounts and terms of loans made by banks to related parties. This presumption would also apply to beneficial owners of ADSs representing more than 1.0% of the shares. Finally, according to the regulations of the Superintendency of Banks, Chilean banks that issue ADSs are required to inform the Superintendency of Banks if any person, directly or indirectly, acquires ADSs representing 5.0% or more of the total amount of shares of capital stock issued by such bank.
Article 16bis of the General Banking Law provides that the individuals or legal entities that, individually or with other people, directly control a bank and who individually own more than 10.0% of its shares must send to the Superintendency of Banks reliable information on their financial situation in the form and in the opportunity set forth in Resolution No. 3,156 of the Superintendency of Banks.
Preemptive Rights and Increases of Share Capital
The Chilean Corporations Law provides that whenever a Chilean company issues new shares for cash, it must offer its existing shareholders the right to purchase a number of shares sufficient to maintain their existing ownership percentages in the company. Pursuant to this requirement, preemptive rights in connection with any future issue of shares will be offered by us to the Depositary as the registered owner of the shares underlying the ADSs. However, the Depositary will not be able to make such preemptive rights available to holders of ADSs unless a registration statement under the Securities Act is effective with respect to the underlying shares or an exemption from the registration requirements thereunder is available.
We intend to evaluate, at the time of any preemptive rights offering, the practicality under Chilean law and Central Bank regulations in effect at the time of making such rights available to our ADS holders, as well as the costs and potential liabilities associated with registration of such rights and the related shares of common stock under the Securities Act, and the indirect benefits to us of thereby enabling the exercise by all or certain holders of ADSs of their preemptive rights and any other factors we consider appropriate at the time, and then to make a decision as to whether to file such registration statement. We cannot assure you that any registration statement would be filed. If we do not file a registration statement and no exemption from the registration requirements under the Securities Act is available, the Depositary will sell such holders’ preemptive rights and distribute the proceeds thereof if a premium can be recognized over the cost of such sale. In the event that the Depositary is not able, or determines that it is not feasible, to sell such rights at a premium over the cost of any such sale, all or certain holders of ADSs may receive no value for such rights. Non-U.S. holders of ADSs may be able to exercise their preemptive rights regardless of whether a registration statement is filed. The inability of all or certain holders of ADSs to exercise preemptive rights in respect of shares of common stock underlying such ADSs could result in such holders not maintaining their percentage ownership of the common stock following such preemptive rights offering unless such holder made additional market purchases of ADSs or shares of common stock.
Under Chilean law, preemptive rights are exercisable or freely transferable by shareholders during a period that cannot be less than 30 days following the grant of such rights. During such period, and for an additional 30-day period thereafter, a Chilean corporation is not permitted to offer any unsubscribed shares for sale to third parties on terms which are more favorable than those offered to its shareholders. At the end of such additional 30-day period, a Chilean open stock corporation is authorized to sell unsubscribed shares to third parties on any terms, provided they

124
are sold on a Chilean stock exchange. Unsubscribed shares that are not sold on a Chilean stock exchange can be sold to third parties only on terms no more favorable for the purchaser than those offered to shareholders.
Description of American Depositary Shares
This section summarizes all of the material provisions of the Amended and Restated Deposit Agreement, dated as of August 1, 2002, among Banco Santander-Chile (formerly known as Banco Santiago), the Depositary, and the holders of ADRs from time to time pursuant to which the American Depositary Receipts (which we refer to as ADRs) were issued. We refer to this agreement as the “deposit agreement.” We do not, however, describe every aspect of the deposit agreement. You should read the deposit agreement for a more detailed description of the terms of the ADRs. Additional copies of the deposit agreement are available for inspection at the Corporate Trust Office of the Depositary, which is presently located at 101 Barclay Street, New York, New York 10286.
American Depositary Receipts
The Depositary will issue ADRs evidencing American Depositary Shares (which we refer to as ADSs) pursuant to the deposit agreement. Each ADS will represent 1,039 shares of our common stock deposited with us, as custodian. An ADR may represent any number of ADSs. Only persons in whose names ADRs are registered on the books of the Depositary will be treated by the Depositary and us as holders of ADRs.
Pursuant to the terms of the deposit agreement, holders, owners and beneficial owners of ADRs will be subject to any applicable disclosure requirements regarding acquisition and ownership of shares of common stock or ADSs representing shares of our common stock as are applicable pursuant to the terms of our estatutos or Chilean laws, as each may be amended from time to time. See “Item 10: B. Memorandum and Articles of Association—Ownership Restrictions” for a description of the disclosure requirements applicable to shares of common stock and the consequences of noncompliance. The Depositary has agreed, subject to the terms and conditions of the deposit agreement, to comply with our instructions as to such requirements.
Deposit and Withdrawal of Common Stock
Upon written order of the depositor, the Depositary will execute and deliver to the persons specified in the written order, an ADR or ADRs registered in the name of such person or persons for the number of ADSs issuable in respect of such deposit, subject to the terms of the deposit agreement and upon the:
• deposit with the custodian of the required number of shares of common stock accompanied by any appropriate instrument of transfer or endorsement in the form satisfactory to the custodian;
• delivery of such certifications and payments as may be required by the custodian or the Depositary;
• payment of the required fees, charges and taxes; and
• if required by the Depositary and as applicable, the delivery to the Depositary of an agreement or instrument providing full transfer to the custodian or its nominee of any dividend or right to subscribe shares or to receive other property or the proxy or proxies entitling the custodian to vote on the shares.
The execution and delivery of the ADRs will take place at any of the Depositary’s designated transfer offices.
The Depositary will not accept for deposit any shares of common stock unless it receives evidence of necessary regulatory approvals, if any.
The Depositary may issue ADRs against rights to receive shares from us, any of our agents or a central clearing agency approved in writing by us. The Depositary may issue ADRs against other rights to receive shares only if:
• such other rights are fully collateralized (marked to market daily) with cash or U.S. government securities until such shares of common stock are deposited;
• each applicant for such ADRs represents in writing that it owns such shares, has assigned all beneficial right, title and interest in such shares to the Depositary and will hold such shares for the account of the Depositary until delivery of the shares following the Depositary’s request;

125
• such transaction may be terminated by the Depositary on no more than five business days’ notice; and
• all ADRs issued against rights to receive shares represent no more than 20.0% of the shares actually deposited. The Depositary may retain any compensation received by it in connection with these transactions, including without limitation, earnings on such collateral.
Notwithstanding any other provisions of the deposit agreement or the ADR to the contrary, holders of ADRs are entitled to withdraw the deposited shares at any time, subject only to:
• temporary delays caused by closing the transfer books of the Depositary or us;
• temporary delays caused by the deposit of shares of common stock in connection with voting at a shareholders’ meeting or the payment of dividends;
• the payment of fees, taxes and similar charges; and
• compliance with any U.S. or foreign laws or governmental regulations relating to the ADRs or to the withdrawal of the deposited shares.
ADR holders are entitled to receive from the custodian’s office in Chile, after they surrender ADRs at the Depositary’s office and pay any fees, governmental charges and taxes provided in the deposit agreement:
• the deposited shares;
• any other property that the surrendered ADRs evidence the right to receive; and
• a certificate from the custodian stating that the applicable deposited shares are being transferred to the person or persons specified by the surrendering holder and that the Depositary waives in favor of such person the right of access to the formal exchange market relating to such withdrawn shares.
At its discretion, the Depositary may deliver the property that the ADR holders surrendering ADRs have the right to receive (other than the certificates representing the shares) at its office. At the request, risk and expense of the ADR holder surrendering ADRs, deposited shares and other proper documents of title may be forwarded from our office in Chile to the Depositary’s office for delivery to the surrendering holders. In the event the Depositary determines that there is a reasonable possibility that a tax would be imposed upon the withdrawal of shares in exchange for surrendered ADRs, it may require that the withdrawing investor provide satisfactory security to it in an amount sufficient to cover the estimated amount of the tax.
Dividends, Other Distributions and Rights
The Depositary is required to convert promptly into dollars and transfer to the United States all cash dividends and other cash distributions denominated in Chilean pesos (or any other currency other than dollars) that it receives in respect of the deposited shares, to the extent that it can do so on a reasonable basis and subject to Chilean law and the Foreign Investment Contract. The Depositary is also required to distribute the amount received in dollars to the holders of ADRs upon an averaged or other practicable basis without regard to any distinctions among holders on account of exchange restrictions or the date of delivery of any ADR or ADRs or otherwise. The amount distributed by the Depositary will be reduced by any amounts to be withheld by us, the Depositary or by us acting as custodian, including amounts on account of any applicable taxes and certain other expenses. For further information regarding applicable taxes, see “Item 10: E. Taxation.”
If the Depositary determines that in its judgment any currency other than dollars received by it cannot be converted on a reasonable basis and transferred, or if the Foreign Investment Contract shall cease to be in effect or the rights of the Depositary thereunder shall be restricted or suspended, the Depositary, may after consultation with us, distribute such foreign currency received by it or hold such foreign currency (without liability for interest) for the respective accounts of the ADR holders entitled to receive the same.
If we declare a dividend in or free distribution of additional shares, the Depositary may (with our approval) and shall (if we so request), distribute to the ADR holders (in proportion to the number of ADSs evidenced by their respective ADRs) additional ADRs evidencing an aggregate number of ADSs that represents the number of shares

126
of common stock received in such dividend or free distribution. Instead of delivering ADRs of fractional ADSs, the Depositary will sell the amount of shares represented by the aggregate of such fractions and will distribute the net proceeds to holders of ADRs in accordance with the deposit agreement. If additional ADRs (other than ADRs for fractional ADSs) are not so distributed, each ADS shall thereafter also represent the additional shares distributed.
If we offer (or cause to be offered) to the holders of shares any rights to subscribe for additional shares of common stock or any rights of any other nature, the Depositary shall, after consultation with us, have discretion:
• as to the procedure followed to make such rights available to ADR holders;
• in disposing of such rights for the benefit of such owners and making the net proceeds available in dollars to holders; or
• if the Depositary may not make such rights available or dispose of such rights and make the proceeds available, allowing the rights to lapse unexercised (without incurring liability to any person as a consequence thereof);
provided that the Depositary will, at our request, either:
• if it determines that it is lawful and feasible to do so, make such rights available to ADR holders by means of warrants or employ such other method as it may deem feasible in order to facilitate the exercise, sale or transfer of rights by such holder; or
• sell such rights or warrants or other instruments at public or private sale, at such place or places and upon such terms as it may deem proper, and allocate the net proceeds of such sales for the account of the owners of ADRs otherwise entitled upon an averaged or other practicable basis without regard to any distinctions among holders on account of exchange restrictions or the date of delivery of an ADR or ADRs or otherwise.
Conversion of such net proceeds from pesos to dollars is subject to the terms and conditions of the Foreign Investment Contract, including presentation to the Central Bank of a request for access to the Formal Exchange Market.
In this regard, we may, in our sole discretion, decide not to register the securities to which such rights relate under the Securities Act where such registration may be required in connection with the offer or sale of such securities. In this case, ADR holders would not be permitted to purchase such securities or otherwise exercise such rights and the Depositary would, to the extent possible, dispose of such rights for the account of such holders as provided above. Such a disposal or rights may reduce the equity interest that ADR holders have in us.
If the Depositary determines that any distribution of property other than cash (including shares of common stock or rights to subscribe therefor) is subject to any tax or governmental charge that it is obligated to withhold, the Depositary may dispose of all or a portion of such property in such amounts and in such manner as it deems necessary and practicable to pay such taxes or governmental charges. The Depositary will distribute the net proceeds of any such sale or the balance of any such property after deduction of such taxes or governmental charges to the ADR holders.
Upon any split, consolidation, cancellation or any other reclassification of shares of common stock, or upon any recapitalization, reorganization, merger or consolidation or sale of assets affecting us, or to which we are a party, any securities that shall be received by the Depositary or the custodian in respect of shares shall be treated as newly deposited shares under the deposit agreement, and ADSs shall from then on represent the right to receive the securities so received, except when (1) additional ADRs (as in the case of a stock dividend), or (2) the Depositary calls for the surrender of outstanding ADRs to be exchanged for new ADRs.
Record Dates
Whenever any distribution is being made upon deposited shares of common stock, or whenever the Depositary shall receive notice of any meeting of holders of shares or whenever the Depositary shall find it necessary or convenient in connection with the giving of any notice, solicitation or any consent or any other matter, the Depositary will fix, by notice to ADR holders and to us, a record date (which, to the extent practicable, shall be the

127
same as the corresponding record date set by us or otherwise shall be the earliest practicable day thereafter) for the determination of the ADR holders who are entitled to receive such dividend, distribution or rights, or net proceeds of the sale thereof, to exercise the rights of ADR holders with respect to such changed number of shares, or to give instructions for the exercise of voting rights, if any, at any such meeting, subject to the provisions of the deposit agreement.
Voting of the Underlying Deposited Securities
When the Depositary receives any notice of a meeting of holders of common stock, it will mail to all ADR holders a notice containing:
• the information included in such notice received by it;
• a statement that each holder as of a specified record date will be entitled, subject to Chilean law and the provisions of or governing the deposited shares, to instruct the Depositary as to the exercise of the voting rights, if any, pertaining to the deposited shares represented by ADSs evidenced by such holder’s ADRs; and
• a statement as to the manner in which each such holder of ADRs may instruct the Depositary to exercise any right to vote held by such holder.
See “Item 10: B. Memorandum and Articles of Association—Meetings and Voting Rights.” The holders of ADRs at the close of business on the date specified by the Depositary are entitled, subject to any applicable provisions of Chilean law, our by-laws or the shares, to instruct the Depositary how to exercise the voting rights, if any, pertaining to the shares represented by their ADSs. The Depositary will endeavor, insofar as practicable and permitted under Chilean law and the shares, to vote the shares so represented in accordance with any such written instructions of holders of ADRs. The Depositary may not itself exercise any voting discretion over any shares. If the Depositary does not receive instructions from a holder of ADRs, the Depositary shall deem such holder to have instructed it to give discretionary proxy to a person designated by us to vote the underlying shares.
Reports and Notices
The Depositary will mail ADR holders any reports and communications received from us that are made generally available to holders of shares of common stock. The Depositary will also send to ADR holders copies or summaries of such reports when furnished by us.
On or before the first date notice is given by us, by publication or otherwise, of any meeting or adjournment of a meeting of shareholders or of the taking of any action by shareholders other than at a meeting, or the making of any distribution on or offering of rights in respect of the deposited shares, we will send the Depositary a copy of the notice in the form given or to be given to holders of shares. The Depositary will arrange for the mailing to all ADR holders of a notice containing the information (or a summary of the information) contained in any notice of a meeting of holders of shares it receives.
Amendment and Termination of the Deposit Agreement
The form of the ADRs and the deposit agreement may at any time be amended by an agreement between us and the Depositary. Any amendment that imposes or increases any fees or charges (other than the fees of the Depositary for the execution and delivery or the cancellation of ADRs and taxes and other governmental charges), or that otherwise prejudices any substantial existing right of ADR holders, will not take effect as to outstanding ADRs until the expiration of 30 days after notice of such amendment has been given to the holders of outstanding ADRs. Every holder of an ADR at the time such amendment becomes effective will be deemed, by continuing to hold such ADR, to consent and agree to such amendment and to be bound by the deposit agreement as amended. Except in order to comply with mandatory provisions of applicable law, in no event may any amendment impair the right of any ADR holder to surrender his ADR and receive therefor the shares and other property represented by it.
Whenever so directed by us, the Depositary will terminate the deposit agreement by mailing notice of such termination to the holders of all ADRs at least 30 days prior to the date fixed in such notice for termination. The Depositary may likewise terminate the deposit agreement at any time 90 days after it has delivered to us a notice of

128
its election to resign, provided that a successor Depositary shall not have been appointed and accepted its appointment as provided in the deposit agreement.
If any ADRs remain outstanding after the date of termination, the Depositary will:
• discontinue the registration of transfer of ADRs;
• suspend the distribution of dividends to the holders thereof; and
• not give any further notices or perform any further acts under the deposit agreement, except
• the collection of dividends and other distributions pertaining to the shares of common stock and any other property represented by such ADRs;
• the sale of rights as provided in the deposit agreement; and
• the delivery of shares, together with any dividends or other distributions received with respect thereto and the net proceeds of the sale of any rights or other property, in exchange for surrendered ADRs.
As soon as practicable after the one year anniversary of any date of termination, the Depositary shall sell the shares and any other property represented by any ADRs that have not been surrendered and hold the net proceeds in a segregated account, together with any other cash then held, without liability for interest, in trust for the pro rata benefit of ADR holders that have not surrendered their ADRs. After making such sale, the Depositary shall be discharged from all obligations to us, except for certain indemnification and accounting obligations. Upon termination of the deposit agreement, we will also be discharged from all obligations thereunder, except for certain obligations to the Depositary.
Charges of Depositary
The Depositary will charge anyone to whom ADRs are delivered and anyone who surrenders ADRs $5.00 per 100 ADSs (or portion thereof) so issued or surrendered.
We will pay certain other charges of the Depositary under the deposit agreement, except for:
• taxes and other governmental charges (which are payable by ADR holders and persons depositing shares);
• any applicable share transfer or registration fees on deposit or withdrawal of shares (which are also payable by such holders and persons);
• any applicable fees in connection with the execution, delivery, transfer or surrender of, or distributions on, ADRs (which are also payable by such holders and persons);
• such cable, telex, facsimile transmission and delivery charges and such expenses as are expressly provided to be at the expense of such holders and persons; and
• expenses that are paid or incurred by the Depositary in connection with the conversion into dollars, pursuant to the deposit agreement, or any other currency received by the Depositary in respect of the shares held on deposit (which are reimbursable to the Depositary out of such dollars).
Liability of Holders for Taxes or Other Charges
Any tax or other governmental charge or expense (including, without limitation, any Chilean tax on a gain realized or deemed to be realized, upon the withdrawal or sale of shares of common stock or other property held by the custodian or depository in respect of such shares) payable by the custodian, the Depositary or its nominee as the registered holder of any deposited shares represented by ADSs evidenced by any ADR shall be payable by the holder of such ADR to the Depositary. The Depositary may refuse to effect registration of transfer and withdrawal of shares underlying such ADR until such payment is made, and may withhold any dividends or other distributions or may sell for the account of the holder thereof any part or all of the deposited shares underlying such ADR and

129
may apply such dividends or distributions or the proceeds of any such sale in payment of any such tax or other governmental charge or expense, the holder of such ADR remaining liable for any deficiency.
Transfer of American Depositary Receipts
The ADRs are transferable on the books of the Depositary, provided that the Depositary may close the transfer books, at any time and from time to time, when deemed expedient by it in connection with the performance of its duties or at our request. The Depositary or the custodian may require payment from the person presenting an ADR or the depositor of the shares of a sum sufficient to reimburse it for any tax or other governmental charge, and any stock transfer or registration fee with respect thereto and payment of any applicable fees payable by the holders of ADRs as a condition to the execution and delivery, registration of transfer, split-up, combination or surrender of any ADR or transfer and withdrawal of shares of common stock.
The Depositary may refuse to deliver ADRs, register the transfer of any ADR or make any distribution of, or related to, shares until it has received such proof of citizenship, residence, exchange control approval, payment of all applicable Chilean taxes or other governmental charges, legal or beneficial ownership or other information as it may deem necessary or proper or as we may require by written request to the Depositary. The execution and delivery or transfer of ADRs generally may be suspended during any period when our transfer books or the transfer books of the Depositary are closed or if deemed necessary or advisable by us or the Depositary. ADR holders may inspect the transfer books of the Depositary at any reasonable time, provided that such inspection shall not be for the purpose of communicating with other holders of the ADRs in the interest of a business or object other than our business or a matter related to the deposit agreement or the ADRs.
General
Neither we nor the Depositary will be liable to the holders of ADRs if prevented or delayed in performing their obligations under the deposit agreement by any present or future law, regulation, decree, order or other action of the United States, Chile or any other country, or of any other governmental authority (including any action that may constitute a breach by the Central Bank of its obligation under the Foreign Investment Contract), or by reason of any provision, present or future, of the Foreign Investment Contract, or by reason of any act of God, war or circumstances beyond their control or in the case of the Depositary, any provision of our by-laws or of the securities deposited. Our obligations and those of the Depositary are expressly limited to performing their respective duties specified therein without negligence or bad faith.
So long as any ADRs or ADSs are listed on one or more stock exchanges, the Depositary will act as registrar or, with our approval, appoint a registrar or one or more co-registrars, for registration of such ADRs in accordance with any requirements of such exchanges. Such registrars or co-registrars shall, upon our request, and may, with our approval, be removed and a substitute or substitutes appointed by the Depositary. The Depositary will periodically furnish the Chilean Superintendency of Banks with the list of the registered holders of ADRs and a list of all beneficial owners who do not object to the disclosure of this information.
ADS holders are subject to certain provisions of the rules and regulations promulgated under the Exchange Act, and to the regulations of the Chilean Superintendency of Banks relating to the disclosure of interests in the shares of common stock. Any ADS holder who has or comes to have a directly or indirectly, an interest of 5.0% (or such other percentage as may be prescribed by law or regulation) or more of our outstanding shares must:
• under the Exchange Act, within 10 days after acquiring such interest and thereafter upon certain changes in such interests, notify us as required by such rules and regulations; and
• under regulations of the Chilean Superintendency of Banks, within 15 days after acquiring such interest, send to us a notarized declaration as to the number of shares and ADSs beneficially owned by it and commit to report to us any subsequent acquisitions of shares or ADSs.
In addition, ADR holders are subject to the reporting requirements contained in Articles 12 and 54 and Titles XV and XXV of the Chilean Securities Market Law and Article 16bis of the General Banking Law and the ownership limitations of Articles 35bis and 36 of the General Banking Law (which provisions may apply when a holder beneficially owns or intends to purchase 10.0% or more of our shares or has the intention of taking control of us).

130
ADS holders who beneficially own more than 1.0% of the shares of common stock are also subject to the presumption created by Article 84 No. 2 of the General Banking Law that such owners are related parties to the Bank, and are thus subject to certain restrictions on the amounts and terms of loans made by banks to related parties.
Valuation of Underlying Shares for Chilean Law Purposes
For all purposes of valuation under Chilean law, the acquisition value of the shares of common stock delivered to any holder upon surrender of ADRs shall be the highest reported sale price of the shares on the Santiago Stock Exchange on the day during which the transfer of the shares is recorded under the name of such holder. In the event that no such sale price is reported by the Santiago Stock Exchange during that day, the value shall be deemed to be the highest trade price on the day during which the last trade took place. However, if 30 or more days have elapsed since the last trade, such value shall be adjusted in accordance with the variation of the Chilean consumer price index during the period since such last trade date.
C. Material Contracts
On December 3, 2007, we entered into a long-term contract with Produban for the operation of certain of our systems, providing us with information data processing, technology services and hardware infrastructure to run our core transactional systems. This contract also includes an improvement in transactional capacities, services and back-up requirement compared to previous services. We agreed to pay Produban approximately €55 million (US$85 million) in the next 5 years. This contract replaced the one we had established with IBM that cost the Bank US$23 million in 2007. Produban is based in Madrid, Spain.
In August 2005, the Bank entered into a contract with the Sociedad Operadora de la Cámara de Compensación de Pagos de alto Valor S.A. (ComBanc) in order to participate in the “Servicio Cámara de Compensación de Pagos de Alto Valor”, which is an electronic clearing system for transactions for large movements between demand deposit accounts. The Bank must pay fixed and variable fees for participating in this system. The fixed fee was UF243 (Ch$4.8 million or US$9,617). The variable fee depends on the Bank’s market share in demand deposits and was UF1,339 (Ch$26.3 million or US$52,993) at December 31, 2007.
On January 23, 2007, the Bank agreed to pledge its shares in Administrador Financiero de Transantiago (AFT) in favor of the service providers of Santiago’s new public transportation system, TransSantiago. AFT is the company in charge of administering the finances of the new transportation system, TransSantiago, and all shareholders in AFT had to pledge their shares to the service providers. This pledge was approved by shareholders at a special Shareholders’ Meeting held on April 24, 2007. The book value of the Bank’s investment in AFT was Ch$820.6 million (US$1.7 million) at December 31, 2007.
D. Exchange Controls
The Central Bank is responsible for, among other things, monetary policies and exchange controls in Chile. Appropriate registration of a foreign investment in Chile grants the investor access to the Formal Exchange Market. See “Item 3: A. Selected Financial Data—Exchange Rates.” Foreign investments can be registered with the Foreign Investment Committee under Decree Law No. 600 or can be registered with the Central Bank under the Central Bank Act. The Central Bank Act is an organic constitutional law requiring a “special majority” vote of the Chilean Congress to be amended. Since April 18, 2001, all exchange controls in Chile have been eliminated.
Previously, Chilean law mandated that holders of shares of Chilean companies that were not residents of Chile register as foreign investors under one of the foreign investment regimes contemplated by Chilean law in order to receive dividends, sale proceeds or other amounts with respect to their shares remitted outside Chile through the Formal Exchange Market. Under the Foreign Investment Contract (as defined herein), the Depositary, on behalf of ADS holders, is granted access to the Formal Exchange Market to convert cash dividends from Chilean pesos to U.S. dollars and to pay such U.S. dollars to ADS holders outside Chile, net of taxes, and no separate registration by ADR holders is required. As of April 19, 2001, the Central Bank deregulated the Exchange Market, eliminating the need to obtain approval from the Central Bank in order to remit dividends, but at the same time eliminating the possibility of guaranteeing access to the Formal Exchange Market. It is important to point out that this does not affect the current Foreign Investment Contract, which was signed prior to April 19, 2001, and still permits access to the Formal Exchange Market based on the prior approval of the Central Bank. Therefore the holders of ADRs of Santander-Chile are still subject to the Foreign Investment Contract, including its clauses referring to the prior exchange rules including the now extinct Chapter XXVI of the Compedium.
131
E. Taxation
The following discussion summarizes certain material Chilean tax and United States federal income tax consequences to beneficial owners arising from the ownership and disposition of the ADSs. The summary does not purport to be a comprehensive description of all potential Chilean tax and United States federal income tax considerations that may be relevant to a decision to purchase, own or dispose of the ADSs and is not intended as tax advice to any particular investor. This summary does not describe any tax consequences arising under the laws of any state, locality or other taxing jurisdiction other than Chile and the United States. There is currently no income tax treaty between the United States and Chile.
Material Tax Consequences of Owning Shares of Our Common Stock or ADSs
Chilean Taxation
The following is a summary of certain Chilean tax consequences of the ownership of shares of Santander-Chile’s common stock or of ADSs evidenced by ADRs by Foreign Holders (as defined herein). The summary does not purport to be a comprehensive description of all of the tax considerations that may be relevant to a decision to purchase, own or dispose of shares or ADSs and does not purport to deal with the tax consequences applicable to all categories of investors, some of whom may be subject to special rules. Holders of shares or ADSs are advised to consult their own tax advisors concerning the Chilean and other tax consequences of the ownership of shares or of ADSs evidenced by ADRs.
The description of Chilean tax laws set forth below is based on Chilean laws in force as of the date of this Annual Report and is subject to any changes in such laws occurring after the date of this Annual Report. These changes can be made on a retroactive basis.
For purposes of this summary, the term “Foreign Holder” means either (1) in the case of an individual, a person who is not resident or domiciled in Chile (for purposes of Chilean taxation, (a) an individual holder is resident in Chile if he or she has resided in Chile for more than six months in one calendar year, or a total of more than six months in two consecutive fiscal years and (b) an individual is domiciled in Chile if he or she resides in Chile with the actual or presumptive intent of staying in Chile); or (2) in the case of a legal entity, a legal entity that is not domiciled in Chile, unless the shares of Santander-Chile’s common stock or ADSs are assigned to a branch or a permanent establishment of such entity in Chile.
Taxation of Dividends
Cash dividends paid by Santander-Chile with respect to shares of its common stock held by a Foreign Holder, including shares represented by ADSs, will be subject to a 35% Chilean withholding tax, which is withheld and paid over by Santander-Chile (the “Withholding Tax”). If Santander-Chile has paid corporate income tax (the “First Category Tax”) on the income from which the dividend is paid, a credit for the First Category Tax effectively reduces the rate of Withholding Tax. When a credit is available, the Withholding Tax is computed by applying the 35% rate to the pre-tax amount needed to fund the dividend and then subtracting from the tentative withholding tax so determined the amount of First Category Tax actually paid on the pre-tax income. For purposes of determining the rate at which First Category Tax was paid, dividends are treated as paid from Santander-Chile’s oldest retained earnings.
The effective rate of Withholding Tax to be imposed on dividends paid by Santander-Chile will vary depending upon the amount of First Category Tax paid by Santander-Chile on the earnings underlying the dividends. The effective rate for the First Category Tax attributed to earnings generated during the fiscal year 2004 and onwards is 17.0%. Full applicability of the First Category Tax credit at the 17.0% rate results in an effective Withholding Tax rate of 2l.7 %. Consequently, the Withholding Tax rate with respect to dividends fluctuates between 21.7% and 35.0%, depending on whether or not we are subject to the First Category Tax.
The example below illustrates the effective Chilean Withholding Tax burden on a cash dividend received by a Foreign Holder, assuming a Withholding Tax rate of 35%, an effective First Category Tax rate of 17% and a distribution of all of the net proceeds available after payment of the First Category Tax.

132
Taxable income .......................................................................................................................................... US$ 100 First Category Tax (17% of US$100)......................................................................................................... (17) Net proceeds available................................................................................................................................ 83 Dividend payment....................................................................................................................................... 83 Withholding Tax (35% of the sum of the dividend (US$83) and the available First Category Tax
credit (US$17)......................................................................................................................................... (35) First Category Tax credit ............................................................................................................................ 17 Payable Withholding Tax ........................................................................................................................... (18) Net dividend received................................................................................................................................. 65 (83-18)
Effective dividend withholding tax rate......................................................................................................21.7%
(18/83)
Dividend distributions made in kind would be subject to the same Chilean tax rules as cash dividends. Stock dividends are not subject to Chilean taxation. The distributions of preemptive rights relating to shares of common stock will not be subject to Chilean taxation.
Taxation of Capital Gains
Gain realized on the sale, exchange or other disposition by a Foreign Holder of ADSs (or ADRs evidencing ADSs) will not be subject to Chilean taxation, provided that such disposition occurs outside Chile or that it is performed under the rules of Title XXIV of the Chilean Securities Market Law, as amended by Law No. 19,601, dated January 18, 1999. The deposit and withdrawal of shares of common stock in exchange for ADRs will not be subject to any Chilean taxes.
Gain recognized on a sale or exchange of shares of common stock (as distinguished from sales or exchanges of ADSs representing such shares of common stock) by a Foreign Holder will be subject to both an income tax on capital gains, which is assessed at the same rate as the First Category Tax (currently imposed at a rate of 17%) and the Chilean withholding tax (the former being creditable against the latter) if (1) the Foreign Holder has held such shares of common stock for less than one year since exchanging ADSs for the shares of common stock, (2) the Foreign Holder acquired and disposed of the shares of common stock in the ordinary course of its business or as a regular trader of stock or (3) the sale is made to a company in which the Foreign Holder holds an interest. In certain other cases, gain on the disposition of shares of common stock will be subject only to the tax on capital gains (currently imposed at a rate of 17%). The sale of shares of common stock by a Foreign Holder to an individual or entity resident or domiciled in Chile is subject to a provisional withholding. Such a provisional withholding will be equal to (i) 5% of the amount, without any deduction, paid to, credited to, account for, put at the disposal of, or corresponding to, the Foreign Holder if the transaction is subject to the First Category Tax as sole tax, unless the gain subject to taxation can be determined, case in which the withholding is equal to 17% on the gain, or (ii) 20% of the amount, without any deduction, paid to, credited to, account for, put at the disposal of, or corresponding to, the Foreign Holder if the transaction is subject to the First Category Tax and the Chilean withholding tax, with a credit of the First Category Tax already paid. For income tax purposes, the capital gain shall be the difference between the sales price and the acquisition cost of the stock. The tax basis of shares of common stock received in exchange for ADSs will be the acquisition value of such shares. The valuation procedure set forth in the deposit agreement, which values shares of common stock that are being exchanged at the highest price at which they trade on the Santiago Stock Exchange on the date of the exchange, generally will determine the acquisition value for this purpose. Consequently, the conversion of ADSs into shares of common stock and sale of such shares of common stock for the value established under the deposit agreement will not generate a capital gain subject to taxation in Chile.
In the case where the sale of the shares is made on a day that is different than the date on which the exchange is recorded, capital gains subject to taxation in Chile may be generated. On October 1, 1999, the Chilean Internal Revenue Service issued Ruling No. 3708 whereby it allowed Chilean issuers of ADSs to amend the deposit agreements to which they are parties in order to include a clause that states that, in the case that the exchanged shares are sold by the ADSs’ holder in a Chilean Stock Exchange, either on the same day in which the exchange is recorded in the shareholders’ registry of the issuer or within the two prior business days to such date, the acquisition price of such exchanged shares shall be the price registered in the invoice issued by the stock broker that participated in the sale transaction. Consequently, because we have included this clause in the form of ADRs attached to the

133
deposit agreement, the capital gain that may be generated if the shares received in exchange for ADSs were sold within two days prior to the date on which the exchange is recorded will not be subject to taxation.
The distribution and exercise of preemptive rights relating to the shares of common stock will not be subject to Chilean taxation. Cash amounts received in exchange for the shares or assignment of preemptive rights relating to the shares will be subject to both the First Category Tax and the Chilean withholding tax (the former being creditable against the latter to the extent described above).
In certain cases and provided certain requirements are met, capital gains realized on the sale of actively traded stock of Chilean public companies may be exempt from Chilean income taxes. Our stock is currently considered an actively traded stock in the Santiago Stock Exchange, and Foreign Holders of the stock may qualify for an income tax exemption. Foreign Holders are urged to consult with their own tax advisors to determine whether an exemption applies to them.
Other Chilean Taxes
No Chilean inheritance, gift or succession taxes apply to the transfer or disposition of the ADSs by a Foreign Holder, but such taxes generally will apply to the transfer at death or by gift of shares of Santander-Chile’s common stock by a Foreign Holder. No Chilean stamp, issue, registration or similar taxes or duties apply to Foreign Holders of shares or ADSs.
Withholding Tax Certificates
Upon request, Santander-Chile will provide to foreign holders appropriate documentation evidencing the payment of Chilean withholding taxes. For further information, the investor should contact: Robert Moreno, [email protected].
Dividends payable to holders of ADSs are net of foreign currency conversion expenses of the Depositary and will be subject to the Chilean withholding tax currently at the rate of 35% (subject to credits in certain cases as described above). Owners of the ADSs will not be charged any dividend remittance fees by the Depositary with respect to cash or stock dividends.
U.S. Federal Income Tax Considerations
The following is a discussion of material U.S. federal income tax consequences of owning and disposing of shares or ADSs to U.S. holder described below, but it does not purport to be a comprehensive description of all of the tax considerations that may be relevant to a particular person’s decision to acquire such securities. The discussion applies only if you hold shares or ADSs as capital assets for tax purposes and it does not address special classes of holders, such as:
• certain financial institutions;
• insurance companies;
• dealers and traders in securities or foreign currencies;
• persons holding shares or ADSs as part of a hedge, “straddle,” conversion transaction, or integrated transaction;
• persons whose functional currency for U.S. federal income tax purposes is not the U.S. dollar;
• partnerships or other entities classified as partnerships for U.S. federal income tax purposes;
• persons liable for the alternative minimum tax;
• tax-exempt organizations;
• persons holding shares or ADSs that own or are deemed to own ten percent or more of our voting stock; or

134
• persons who acquired our ADSs or shares pursuant to the exercise of any employee stock option plan or otherwise as compensation.
This discussion is based on the Internal Revenue Code of 1986, as amended (the “Code”), administrative pronouncements, judicial decision and final, temporary and proposed Treasury regulations, all as of the date hereof. These laws are subject to change, possibly on a retroactive basis. It is also based in part on representations by the Depositary and assumes that each obligation under the Deposit Agreement and any related agreement will be performed in accordance with its terms. Please consult your own tax advisers concerning the U.S. federal, state, local and foreign tax consequences of purchasing, owning and disposing of shares or ADSs in your particular circumstances.
If an entity that is classified as a partnership for U.S. federal income tax purposes holds shares of ADSs, the U.S. federal income tax treatment of a partner will generally depend on the status of the partner and upon the activities of the partnership. Partnership holding shares of ADSs and partners in such partnerships should consult their tax advisers as to the particular U.S. federal income tax consequences of holding and disposing of the shares or ADSs.
As used herein, a “U.S. holder” is a beneficial owner of shares or ADSs that is for U.S. federal tax purposes:
• a citizen or resident of the United States;
• a corporation, or other entity taxable as a corporation, created or organized in or under the laws of the United States or any political subdivision thereof; or
• an estate or trust the income of which is subject to U.S. federal income taxation regardless of its source.
In general, if you own ADSs, you will be treated as the owner of the underlying shares represented by those ADSs for U.S. federal income tax purposes. Accordingly, no gain or loss will be recognized if you exchange ADSs for the underlying shares represented by those ADSs.
The U.S. Treasury has expressed concerns that parties to whom ADRs are released prior to delivery of shares to the Depositary (“pre-release”) or intermediaries in the chain of ownership between U.S. holders of ADRs may be taking actions that are inconsistent with the claiming of foreign tax credits for holders of ADRs. Such actions would also be inconsistent with the claiming of the reduced rate of tax, described below, applicable to dividends received by certain non-corporate holders. Accordingly, the analysis of the creditability of Chilean taxes and the availability of the reduced rate for dividends received by certain non-corporate holders, each described below, could be affected by future actions that may be taken by such parties or intermediaries.
Taxation of Distributions
Distributions paid on ADSs or shares, other than certain pro rata distributions of common shares or rights, will be treated as dividends to the extent paid out of current or accumulated earnings and profits (as determined under U.S. federal income tax principles). Since we do not maintain calculations of our earnings and profits under U.S. federal income tax principles, it is expected that distributions generally will be reported to U.S. holders as dividends. Subject to applicable limitations and the discussion above regarding concerns expressed by the U.S. Treasury, under current law, certain dividends paid by “qualified foreign corporations” to certain non-corporate U.S. Holders in taxable years beginning before January 1, 2011, will be taxable at a maximum rate of 15%. A foreign corporation is treated as a qualified foreign corporation with respect to dividends paid on stock which is readily tradable on a securities market in the United States, such as the NYSE where our ADSs are traded. You should consult your own tax advisers to determine whether the favorable rates may apply to dividends you receive and whether you are subject to any special rules that limit your ability to be taxed at this favorable rate. The amount of the dividend will include any amounts withheld by us or our paying agent in respect of Chilean taxes at the effective rate as described above under “ — Chilean Taxation.” The amount of the dividend will be treated as foreign-source dividend income to you and will not be eligible for the dividends received deduction generally allowed to U.S. corporations under the Code.
Dividends paid in Chilean pesos will be included in your income in a U.S. dollar amount calculated by reference to the exchange rate in effect on the date of your (or in the case of ADSs, the Depositary’s) receipt of the dividend, regardless of whether the payment is in fact converted into U.S. dollars. If the dividend is converted into

135
U.S. dollars on the date of receipt, you generally should not be required to recognize foreign currency gain or loss in respect of the dividend income. You may have foreign currency gain or loss if you do not convert the amount of such dividend into U.S. dollars on the date of its receipt.
Subject to applicable limitations that may vary depending upon your circumstances and the discussion above regarding concerns expressed by the U.S. Treasury, Chilean taxes withheld from cash dividends on shares or ADSs at the withholding tax rate, reduced in respect of any First Category Tax, as described above under “ —Chilean Taxation,” generally will be creditable against your U.S. federal income tax liability. Instead of claiming a credit, you may, at your election, deduct such Chilean taxes in computing your taxable income, subject to generally applicable limitations under U.S. law. You should consult your own tax advisers to determine whether you are subject to any special rules that limit your ability to make effective use of foreign tax credits.
Sale or Other Disposition of Shares or ADSs
For U.S. federal income tax purposes, gain or loss you realize on the sale or other disposition of shares or ADSs generally will be capital gain or loss, and will be long-term capital gain or loss if you held the shares or ADSs for more than one year. The amount of your gain or loss will be equal to the difference between your tax basis in the shares or ADSs disposed of and the amount realized on the disposition in each case as determined in U.S. dollars. Such gain or loss will generally be U.S. source gain or loss for foreign tax credit purposes. Consequently, you may not be able to utilize a credit for Chilean withholding taxes imposed on gain from shares or ADSs. You should consult your own tax advisers regarding the availability of foreign tax credits upon the sale or other disposition of your shares or ADSs.
Passive Foreign Investment Company Rules
Based on proposed Treasury regulations (“Proposed Regulations”), which are proposed for taxable years beginning after December 31, 1994, we believe that we were not a “Passive Foreign Investment Company” (“PFIC”) for U.S. federal income tax purposes for the year ended December 31, 2007. However, since the Proposed Regulations may not be finalized in their current form and since PFIC status depends upon the composition of a company’s income and assets and the market value of its assets (including, among others, less than 25 percent owned equity investments) from time to time, there can be no assurance that we will not be considered a PFIC for any taxable year. If we were treated as a PFIC for any taxable year during which you held an ADS or a share, certain adverse tax consequences could apply to you.
If we were a PFIC for any taxable year during which you held shares or ADSs, gain recognized by you on a sale or other disposition (including certain pledges) of a share or an ADS would generally be allocated ratably over your holding period for the share or ADS. The amounts allocated to the taxable year of the sale or other disposition and to any year before we became a PFIC would be taxed as ordinary income. The amount allocated to each other taxable year would be subject to tax at the highest rate in effect for individuals or corporations, as appropriate for that taxable year, and an interest charge would be imposed on the amount allocated to that taxable year. Further, any distribution in respect of shares or ADSs that exceeds 125 percent of the average of the annual distributions on shares or ADSs received by you during the preceding three years or your holding period, whichever if shorter, would be subject to taxation as described above. Certain elections may be available (including a mark-to-market election) to you that may help mitigate the adverse tax consequences. In addition, if we were to be treated as a PFIC in a taxable year in which we pay a dividend or the prior taxable year, the 15% dividend rate discussed above with respect to dividends paid to non-corporate shareholders would not apply.
Information Reporting and Backup Withholding
Payment of dividends and sales proceeds that are made within the United States or through certain U.S.-related financial intermediaries generally are subject to information reporting and to backup withholding unless (i) you are a corporation or other exempt recipient or (ii), in the case of backup withholding, you provide a correct taxpayer identification number and certify that you are not subject to backup withholding.
The amount of any backup withholding from a payment to you will be allowed as a credit against your U.S. federal income tax liability and may entitle you to a refund, provided that the required information is timely furnished to the Internal Revenue Service.

136
F. Dividends and Paying Agents
Not applicable.
G. Statement by Experts
Not applicable.
H. Documents on Display
The documents concerning Santander-Chile which are referred to in this Annual Report may be inspected at our offices at Bandera 140 Santiago, Chile. We are, and Santiago and Old Santander-Chile were, subject to the information reporting requirements of the Exchange Act, except that, as a foreign issuer, we are not subject to the proxy rules or the short-swing profit and disclosure rules of the Exchange Act. In accordance with these statutory requirements, we file or furnish reports and other information with the SEC. Reports and other information filed or furnished by us with the SEC may be inspected and copied at the public reference facilities maintained by the SEC at Room 1024, 450 Fifth Street, N.W., Washington, D.C. 20549 and at the SEC’s Regional Office at Northwestern Atrium Center, 500 West Madison Street, Suite 1400, Chicago, Illinois 60611-2511. Copies of such material may be obtained by mail from the Public Reference Section of the SEC, 450 Fifth Street, N.W., Washington, D.C. 20549, at prescribed rates. You may obtain information on the operation of the Public Reference Section by calling the SEC at 1-800-732-0330. The SEC maintains a World Wide Web site on the Internet at http://www.sec.gov that contains reports and information statements and other information regarding us. The reports and information statements and other information about us can be downloaded from the SEC’s website and can also be inspected and copied at the offices of the NYSE, Inc., 20 Broad Street, New York, New York 10005.
I. Subsidiary Information
Not applicable.
ITEM 11. QUANTITATIVE AND QUALITATIVE DISCLOSURES ABOUT MARKET RISK
Introduction
This section describes the market risks that we are exposed to, the tools and methodology used to control these risks, the portfolios over which these market risk methods were applied and quantitative disclosure that demonstrate the level of exposure to market risk that we are assuming. This section also discloses the derivative instruments that we use to hedge exposures and offer to our clients.
The principal types of risk inherent in Santander-Chile’s business are market, liquidity, operational and credit risks. The effectiveness with which we are able to manage the balance between risk and reward is a significant factor in our ability to generate long term, stable earnings growth. Toward that end, our senior management places great emphasis on risk management.
Market Risk
Market risk is the risk of losses due to unexpected changes in interest rates, foreign exchange rates, inflation rates and other rates or prices. We are exposed to market risk mainly as a result of the following activities:
• trading in financial instruments, which exposes us to interest rate and foreign exchange rate risk;
• engaging in banking activities, which subjects us to interest rate risk, since a change in interest rates affected gross interest income, gross interest expense and customer behavior;
• engaging in banking activities, which exposes us to inflation rate risk, since a change in expected inflation affects gross interest income, gross interest expense and customer behavior;
• trading in the local equity market, which subjects us to potential losses caused by fluctuations of the stock market; and

137
• investing in assets whose returns or accounts are denominated in currencies other than the Chilean peso, which subjects us to foreign exchange risk between the Chilean peso and such other currencies.
Market Risk Exposure Categories
Inflation
Inflation impacts our results of operations. High levels of inflation in Chile could adversely affect the Chilean economy and have an adverse effect on our business, financial condition and results of operations. Negative inflation rates also negatively impact our results. In 2007, the inflation rate in Chile was 7.8% compared to 2.6% in 2006 compared 3.7% in 2005. There can be no assurance that Chilean inflation will not change significantly from the current level. Although we currently benefit from moderate levels of inflation in Chile, due to the current structure of our assets and liabilities (i.e., a significant portion of our loans are indexed to the inflation rate, but there are no corresponding features in deposits or other funding sources that would increase the size of our funding base), there can be no assurance that our business, financial condition and result of operations in the future will not be adversely affected by changing levels of inflation.
UF-denominated assets and liabilities. Our assets and liabilities are denominated in Chilean pesos, UF and foreign currencies. The UF is revalued in monthly cycles. On each day in the period beginning the tenth day of the current month through the ninth day of the succeeding month, the nominal peso value of the UF is indexed up (or down in the event of deflation) in order to reflect a proportional amount of the change in the Chilean Consumer Price Index during the prior calendar month. One UF equaled to Ch$17,974.81 at December 31, 2005, Ch$ 18,336.38 at December 31, 2006, and Ch$19,622.66 at December 31, 2007. The effect of any changes in the nominal peso value of our UF-denominated assets and liabilities is reflected in our results of operations as an increase (or decrease, in the event of deflation) in interest revenue and expense, respectively. Our net interest revenue will be positively affected by an inflationary environment to the extent that our average UF-denominated assets exceed our average UF-denominated liabilities. Our net interest revenue will be negatively affected by inflation in any period in which our average UF-denominated liabilities exceed our average UF-denominated assets. Our average UF-denominated assets exceeded our average UF-denominated liabilities by Ch$2,871,535 million in 2007 compared to Ch$2,758,228 million in 2006. See “Item 5: F. Selected Statistical Information—Average Balance Sheets, Income Earned from Interest-Earning Assets And Interest Paid on Interest Bearing Liabilities.” The Bank generally has more UF-denominated financial assets than UF-denominated financial liabilities. In the year ended December 31, 2007, the interest gained on interest earning assets denominated in UF increased 71.5% compared to 2006 as a result of the higher inflation rate in 2007 compared to 2006 and the larger amount of assets than liabilities denominated in UFs. The interest paid on these liabilities increased by 130.4% during this period.
Inflation hedge. A key component of our asset and liability policy is the management of interest rate risk. The Bank’s assets generally have a longer maturity than our liabilities. As the Bank’s mortgage portfolio grows, the maturity gap tends to rise as these loans, which are denominated in UF, have a longer maturity than the average maturity of our funding base. As most long term financial instruments and mortgage loans are denominated in UF and most deposits in nominal pesos, the increase in mortgage lending increments the Bank’s exposure to inflation and to interest rate risk. The size of this gap is limited by internal and regulatory guidelines in order to avoid excessive potential losses due to strong shifts in interest rates. In order to keep this duration gap below regulatory limits the bank issues long term bonds denominated in UF or interest rate swaps. The financial cost of the bonds is recorded as interest expense, but the financial cost of these swaps is included in the net results from trading and marks to market. In 2007, the financial cost of the swaps taken in order to hedge for inflation and interest rate risk totaled Ch$42,465 million compared to Ch$12,899 million in 2006. This higher cost was a direct result of the higher inflation rate in these two periods.
At December 31, Inflation sensitive income 2006 2007 % Change (In million of constant Chilean pesos at
December 31, 2007) Interest gained on UF assets.......... 468,001 802,579 71.5% Interest paid on UF liabilities ........ (191,746) (441,703) 130.4% Inflation/ interest rate risk hedge (12,899) (42,465) 229.2% Price level restatement .................. (14,807) (56,325) 280.4% Net Gain ........................................ 248,549 262,086 5.4%
138
Peso denominated assets and liabilities. Interest rates prevailing in Chile during any period primarily reflect the inflation rate during the period and the expectations of future inflation. The sensitivity of our peso denominated interest earning assets and interest bearing liabilities to changes to such prevailing rates varies. See “Item 5: C Operating Results—Interest Rates.” We maintain a substantial amount of non interest bearing peso denominated demand deposits. Because such deposits are not sensitive to inflation, any decline in the rate of inflation would adversely affect our net interest margin on inflation indexed assets funded with such deposits, and any increase in the rate of inflation would increase the net interest margin on such assets. The ratio of the average of such demand deposits to average interest-earning assets was 16.4%, 13.9% and 15.3% for the years ended December 31, 2005, 2006 and 2007, respectively.
Interest Rates
Interest rates earned and paid on Santander-Chile’s assets and liabilities reflect to a certain degree inflation and expectations regarding inflation as well as shifts in short term rates related to the Central Bank’s monetary policies. The Central Bank manages short term interest rates based on its objectives of balancing low inflation and economic growth. In 2007, the Central Bank accelerated the pace of interest rate increases in the year. The overnight interbank rate set by the Central Bank as of April 2008 was set at 6.25%, 100 basis points higher than the rate at year-end 2006. Long-term real interest rates on the other hand descended in 2007. The yield on the Chilean Central Bank’s 10-year note in real terms was 2.98% compared to 3.02% as of December 31, 2006.
Foreign Exchange Fluctuations
The Chilean government’s economic policies and any future changes in the value of the Chilean peso against the U.S. dollar could adversely affect our financial condition and results of operations. The Chilean peso has been subject to significant devaluation in the past and may be subject to significant fluctuations in the future. In 2005, the Chilean peso appreciated by 8.1% against the dollar. In 2006, the Chilean peso depreciated by 3.9% against the U.S. dollar and in 2007 the peso appreciated 7.2% against the U.S. dollar. See “Item 3: A. Selected Financial Data—Exchange Rates.”
Asset and Liability Management
Our policy with respect to asset and liability management is to capitalize on our competitive advantages in treasury operations, maximizing our net interest revenue and return on assets and equity with a view to interest rate, liquidity and foreign exchange risks, while remaining within the limits provided by Chilean banking regulations. Subject to these constraints, we constantly have mismatched positions with respect to interest rates and foreign currencies. Our asset and liability management policies are developed by the Asset and Liability Committee (the “ALCO”) following guidelines and limits established by our Board of Directors, Banco Santander Spain’s Global Risk Department and our Market Risk and Control Department. The ALCO is composed of the Chairman of the Board, three members of the Board, the Chief Executive Officer, the Manager of Proprietary Trading, the Manager of the Financial Management Division, the Manager of Market Risk and the Financial Controller. Senior members of Santander-Chile’s Finance Division meet daily and, on a formal basis, weekly with the Asset and Liabilities Management Committee and outside consultants. In addition, our Market Risk Division reports weekly on all of our positions to the ALCO. Our limits and positions are reported on a daily basis to Banco Santander Spain’s Global Risk Department. The ALCO reports as often as deemed necessary to our Board of Directors. The risk limits set by the ALCO are implemented by our Finance Division and are controlled by the Market Risk and Control Department, which establishes guidelines and policies for risk management on a day to day basis. The composition of our assets, liabilities and shareholders’ equity at December 31, 2007, by currency and term is as follows:
December 31, 2007 Foreign Ch$ UF Currency Total Percentage (in millions of constant Ch$ as of December 31, 2007, except for percentages) Assets Cash and due from banks 452,718 -- 838,916 1,291,634 7.1%Other asset (1): Less than one year 3,614,760 1,430,249 1,426,722 6,471,731 35.5%From one to three years 1,339,742 1,437,812 125,542 2,903,096 15.9%More than three years 957,666 5,523,059 213,468 6,694,193 36.7%Banks premise and equipment and other 823,207 4,025 267,609 1,094,841 6.0%
139
December 31, 2007 allowances for loan losses -232,766 -232,766 -1.3%Total 6,955,327 8,395,145 2,872,257 18,222,729 100.0%
Percentage of total assets 38.1% 46.1% 15.8% 100.0% Liabilities and shareholders’ equity Non interest bearing deposits 2,346,296 197,124 177,639 2,721,059 14.9%Other liabilities: Less than one years 3,721,578 2,650,802 2,692,664 9,065,044 49.7%From one to three years 417,332 1,423,820 705,856 2,547,008 14.0%More than three years 136,490 1,556,154 758,930 2,451,574 13.5%Shareholder’s equity 1,129,395 -- -- 1,129,395 6.2%2007 net income 308,647 -- -- 308,647 1.7%Total 8,059,738 5,827,900 4,335,089 18,222,727 100%Percentage of total liabilities and shareholders’ equity 44.2% 32.0% 23.8% 100.0%
(1) Other assets include our rights under foreign exchange contracts, and other liabilities include our obligations under foreign exchange contracts. Mortgage finance bonds issued by us are included as other liabilities, and mortgage finance bonds held in our financial investment portfolio (issued by third parties) are included as other assets.
We have generally maintained more peso denominated liabilities than peso denominated assets and more UF-denominated assets than UF-denominated liabilities. In the context of a rising CPI, this has in the past had a positive impact on our net income by generating net income from adjustments of the UF that exceeds losses arising from price level restatements. This effect is expected to decrease significantly if rates of inflation decrease.
Interest Rate Sensitivity
A key component of our asset and liability policy is the management of interest rate sensitivity. Interest rate sensitivity is the relationship between market interest rates and net interest revenue due to the maturity or repricing characteristics of interest-earning assets and interest-bearing liabilities. For any given period, the pricing structure is matched when an equal amount of such assets and liabilities mature or reprice in that period. Any mismatch of interest-earning assets and interest-bearing liabilities is known as a gap position. A positive gap denotes asset sensitivity and means that an increase in interest rates would have a positive effect on net interest revenue while a decrease in interest rates would have a negative effect on net interest revenue.
Our interest rate sensitivity strategy takes into account not only the rates of return and the underlying degree of risk, but also liquidity requirements, including minimum regulatory cash reserves, mandatory liquidity ratios, withdrawal and maturity of deposits, capital costs and additional demand for funds. We monitor our maturity mismatches and manage them within established limits.
The following table sets forth the repricing of our interest-earning assets and interest-bearing liabilities at December 31, 2007, and may not reflect interest rate gap positions at other times. In addition, variations in interest rate sensitivity may exist within the repricing periods presented due to the differing repricing dates within the period. Variations may also arise among the different currencies in which interest rate positions are held.
As the following table reflects, we have a negative gap for most periods of one year or less as our main source of funding are short term time deposits. The majority of assets and liabilities with a maturity of 90 days or less are denominated in nominal pesos. Ninety days or more is also the most common repricing period for UF-denominated time deposits. In the case of interest-earning assets and interest-bearing liabilities denominated in UF, our exposure to changes in interest rates is reduced by the fact that a significant portion of the interest rate earned or paid on such assets or liabilities is indexed to reflect the daily effect of inflation, and as a result our gap position is limited to variations in the real interest rate among such assets and liabilities. Moreover, mortgage loans which have 8- to 20-year terms were generally financed through bonds issued for the same terms and in the same currency or interest rate swaps.
As of December 31,
Up to 30
days 31-60 days
61-90 days
91-180 days
181-365 days 1-3 years
Over 3 years Total
(in millons of constant Ch$ as of December 31, 2007, except for percentages)

140
Interest-earning assets: Interbank deposits 700,517 - - - - - - 700,517 Financial investments 1,099,484 106 14,096 20,399 51,458 136,785 496,936 1,819,264 Loans 2,431,977 443,046 328,809 822,807 874,850 2,210,557 4,663,653 11,775,699 Mortage loans 6,461 4,952 4,954 15,032 16,637 112,785 224,526 385,347 Contingent loans 255,184 118,241 98,528 196,636 273,793 190,258 58,639 1,191,279 Past due loans 116,654 116,654
Total Interest-earning assets 4,610,277 566,345 446,387 1,054,874 1,216,738 2,650,385 5,443,754 15,988,760
Interest-bearning liabilities: Deposits 1,858,988 1,113,839 757,084 1,185,953 1,354,331 1,528,645 89,041 7,887,881 Central Bank Borrowings 142,909 - - - 3,433 - - 146,342 Investment under agreements to repurchase 166,281 - - - - - - 166,281 Mortage finance bonds 16,209 2,034 1,792 12,501 24,891 92,792 284,055 434,274 Other obligations 114,713 24,329 2,348 118,298 474,734 718,317 1,513,823 2,966,562
Total interest-bearing libiabilities 2,299,100 1,140,202 761,224 1,316,752 1,857,389 2,339,754 1,886,919 11,601,340
Asset/liability gap 2,311,177 (573,857) (314,837) (261,878) (640,651) 310,631 3,556,835 4,387,420
Cumulative gap 2,311,177 1,737,320 1,422,483 1,160,605 519,954 830,585 4,387,420
Exchange Rate Sensitivity
The regulations of the Central Bank do not permit the difference, whether positive or negative, between a bank’s assets and liabilities denominated in any foreign currency (including assets and liabilities denominated in U.S. dollars but payable in pesos, as well as those denominated in pesos and indexed to the U.S. dollar exchange rate) to exceed 20% of the bank’s paid in capital and reserves; except in case where the balance of such assets exceeds the balance of such liabilities and the excess difference does not exceed the bank’s allowances and reserves denominated in such foreign currency (excluding profits to be remitted abroad). Santander-Chile has also set an absolute limit on the size of its net foreign currency trading position. At December 31, 2007, this was equal to US$200 million. The Bank also uses a sensitivity analysis to limit the potential loss in fluctuations of U.S. interest rates on interest income and a VaR model to limit foreign currency risk.
In recent years, our results of operations have benefited from fluctuations in the exchange rate between the Chilean peso and the U.S. dollar in part due to our policy and Central Bank regulations relating to the control of material exchange rate mismatches. However, the rate of devaluation or appreciation of the peso against the U.S. dollar could also be expected to have the following principal effects:
(i) If we maintain a net asset position in U.S. dollars and a devaluation of the peso against the U.S. dollar occurs, we would record a related gain, and if an appreciation of the peso occurs, we would record a related loss;
(ii) If we maintain a net liability position in U.S. dollars and a devaluation of the peso against the dollar occurs, we would record a related loss, and if an appreciation of the peso occurs, we would record a related gain;
(iii) If the inflation rate for a period exceeded the devaluation of the peso against the U.S. dollar during the same period, this would mean that in real terms the peso appreciated against the U.S. dollar. Therefore, we would record a related gain if we had a net asset position in UFs that exceeded a net liability position in U.S. dollars, and we would record a related loss if we had a net liability position in U.S. dollars that exceeded a net asset position in UFs; and
(iv) If the inflation rate for a period were lower than the rate of devaluation of the peso against the U.S. dollar during the same period, this would mean that in real terms the peso depreciated against the U.S. dollar. Therefore, we would record a related gain if it maintained a net asset position in U.S. dollars and a net liability position in UFs and would record a related loss if it had a net liability position in U.S. dollars and a net asset position in UFs.
We enter into foreign exchange forward contracts and interest rate swap contracts as part of our asset and liability management. We enter into two fundamental types of foreign forward exchange contracts: (i) transactions covering two foreign currencies and (ii) transactions covering only Chilean pesos and UFs against U.S. dollars. We

141
use the first type for hedging purposes, such as when we take a liability position in foreign currency other than the U.S. dollar, and use the second type, which is carried out only in the Chilean local market, to take foreign currency positions, subject to the regulatory requirement that the forward foreign currency exposure must be included in the maximum net foreign currency position permitted by applicable regulations. See “Item 4: D. Regulation and Supervision” and “Item 5: F. Selected Statistical Information—Average Balance Sheets, Income Earned from Interest-Earning Assets And Interest Paid on Interest Bearing Liabilities.”
The Central Bank requires that foreign exchange forward contracts be made only in U.S. dollars and other major foreign currencies. As noted above, substantially all of our forward contracts are made in U.S. dollars against the Chilean peso or the UF. We may enter into foreign currency forward contracts with companies organized and located outside of Chile, including foreign subsidiaries of Chilean companies. We believe that as the market for forward contracts deepens, our client base in Chile as well as our relationship with Banco Santander Spain will give us an advantage in positioning ourselves within this new market.
Statistical Tools for Measuring and Managing Risk: Regulatory Method
On an unconsolidated basis, the Bank must separate its balance sheet in two separate categories: trading portfolio (Libro de Negociación) and unconsolidated non-trading, or permanent, portfolio (Libro de Banca). The trading portfolio as defined by the Superintendency of Banks includes all instruments valued at market prices, free of any restrictions for their immediate sale and that are frequently bought and sold by the bank or are maintained with the intention of selling them in the short term in order to profit from short term price variations. The non-trading portfolio is defined as all instruments in the balance sheet not considered in the trading portfolio.
We must also report the following absolute risk levels:
Trading portfolio:
• Exposure to interest rate risk: Interest rate risk of the trading portfolio is basically a sensitivity analysis, which is the calculated potential losses assuming an increase in nominal rate yield curves, real rates and foreign currency rates by 75 to 350 basis point.
• Exposure to foreign currency risk: The foreign currency risk is calculated using sensitivity factors linked to the credit risk rating of the issuing country.
• Market risk exposure of options: Options risk is calculated using sensitivity factors called delta, gamma and vega that basically measure the sensitivity of the value of the options to changes in the price of the underlying security and its volatility.
Non trading portfolio:
• Exposure to short term interest rate risk: Sensitivity analysis that is calculated for assets and liabilities with maturities of less than 1 year, assuming a 200 basis point parallel shift of the nominal yield curve, 400 for real rates and 200 for foreign interest rates.
• Exposure to inflation risk: Sensitivity analysis that is calculated for assets and liabilities with maturities of less than 1 year, assuming a 200 basis point parallel shift of the nominal yield curve, 400 for real rates and 200 for foreign interest rates.
• Exposure to long term interest rate risk: Sensitivity analysis that is calculated for assets and liabilities with maturities from 1 to over 20 years, assuming a 200 basis point parallel shift of the nominal yield curve, 400 for real rates and 200 for foreign interest rates.
The Superintendency of Banks has defined various limits for these risks.
1) EMR limit. A bank’s regulatory capital must be greater or equal to the sum of the exposure to market risk multiplied by the minimum capital adequacy ratio defined in the General Banking Law. In other words:
RC – ((k * RWA) + EMR) > 0

142
Where:
RC: Regulatory capital as defined by the General Banking Law. k: Minimum capital adequacy ratio. The Bank is required to use a 10% minimum capital adequacy ratio
for the purpose of calculating the EMR limit. RWA: Consolidated risk-weighted assets as defined by the General Banking Law. EMR: Exposure to market risk. Santander-Chile’s EMR is equal to the total market risk of its unconsolidated
trading portfolio. This includes interest rate risk, foreign currency risk and risks derived from options.
2) Limit on exposure to short-term interest rate and inflation risk of the Bank’s non-trading portfolio. Santander-Chile’s exposure to short-term interest rate and inflation risk of the non-trading portfolio cannot exceed 20% of its unconsolidated net interest income plus fees sensitive to interest rate volatility.
3) Limit on exposure to long term interest rate risk of a bank’s non-trading portfolio. Santander-Chile’s exposure to long term interest rate risk of the unconsolidated non-trading portfolio cannot exceed 35% of its regulatory capital.
The following is a description of the models adopted by local regulators for measuring market risks.
Interest rate risk of trading portfolio: Regulatory method
The interest rate risk of the trading portfolio as defined by the Central Bank of Chile is equal to the sum of:
1) The sensitivity analysis (sensitivity factor) of the trading portfolio 2) Vertical adjustment factor 3) Horizontal adjustment factor The sensitivity factor of the trading portfolio is calculated using the following formula:
M 14 Sensitivity = Σ Σ (αmt * Amt - αmt * Lmt )
m t=1
Where:
Amt = Trading Assets (pesos, inflation linked and foreign currency) Lmt = Liabilities funding trading positions (pesos, inflation linked and foreign currency) αmt = Sensitivity factor to rise in interest rates t = Time period M = Currency (pesos, inflation linked and foreign currency) Σ = Summation
= Absolute value
The vertical adjustment factor is calculated in the following manner
M 14 Vertical adjustment = Σ Σ β ∗ Compensated net position
M T=1
M 14
Compensated net position = Σ Σ Min(αmt * Amt ; αmt * Lmt ) M T=1

143
Where:
Amt = Trading Assets (pesos, inflation linked and foreign currency) Lmt = Liabilities funding trading positions (pesos, inflation linked and foreign currency) αmt = Sensitivity factor to rise in interest rates t = Time period M = Currency (pesos, inflation linked and foreign currency) β = Vertical adjustment factor = 10%
A horizontal adjustment must be made following the vertical adjustment. To determine the horizontal adjustment one must multiply the horizontal adjustment factor by the compensated net position for Zones 1, Zone 2, Zone 3, Zones 1 and 2, Zones 2 and 3 and Zones 1 through 3
Horizontal adjustment = Adjusted net position (λ)
Compensated net position Zone 1,2 or 3 Min(Σ Adjusted net asset position; Σ absolute value of Adjusted net liability position in Zone 1, 2 or 3 )
Compensated net position Zones 1 and 2 Min(Σ Adjusted net asset position in Zones 1 and 2 , Σ absolute value of adjusted net liability position in Zones 1 and 2)
Compensated net position Zones 2 and 3 Min(Σ Adjusted net asset position in Zone 3 and Zone 2 (deducting adjusted net asset position that have been compensated for with net liability positions in Zone 1) , Σ absolute value of adjusted net liability position in Zone 3 and Zone 2 (deducting adjusted net liability positions that have been compensated for with net liability positions in Zone 1))
Compensated net position Zones 1 – 3 Min(Σ Adjusted net asset position in Zone 3 and Zone 1 (deducting adjusted net asset position that have been compensated for with net liability positions in Zone 2) , Σ absolute value of adjusted net liability position in Zone 3 and Zone 1 (deducting adjusted net liability positions that have been compensated for with net liability positions in Zone 2))

144
Currency: pesos
Zone Asset LiabilitySensitivity factor
α Adjusted assetsAdjusted liabilities
Adjusted Net position
Compensated net position
Adjustment factor Β Adjustment
Compensated net position in Zone
Adjustment factor λ Adjustment
Compensated net position in Zone
Adjustment factor λ Adjustment
Compensated net position in Zone
Adjustment factor λ Adjustment
Compensated net position in Zone
Adjustment factor λ Adjustment
1 1 0 - 1m 560,000,000 430,000,000 0.0005 280,000 215,000 65,000 215,000 10% 21,500 2 1-3m 390,000,000 310,000,000 0.0019 741,000 589,000 152,000 589,000 10% 58,900 3 3-6m 260,000,000 200,000,000 0.0042 1,092,000 840,000 252,000 840,000 10% 84,000 4 6-9m 160,000,000 100,000,000 0.0069 1,104,000 690,000 414,000 690,000 10% 69,000 5 9m - 1a 80,000,000 50,000,000 0.0095 760,000 475,000 285,000 475,000 10% 47,500
2 6 1 - 2a 75,000,000 20,000,000 0.0124 930,000 248,000 682,000 248,000 10% 24,800 7 2-3a 15,000,000 20,000,000 0.0191 286,500 382,000 (95,500) 286,500 10% 28,650 8 3-4a 25,000,000 1,000,000 0.0248 620,000 24,800 595,200 24,800 10% 2,480
3 9 4-5a 20,000,000 - 0.0221 442,000 - 442,000 - 10% - 10 5-7a - - 0.0263 - - - - 10% - 11 7-10a - - 0.0307 - - - - 10% - 12 10-15a - - 0.0332 - - - - 10% - 13 15-20a - - 0.0317 - - - - 10% - 14 > 20a - - 0.0278 - - - - 10% -
Exposure 2,791,700 336,830 28,650 - - - Total interest rate risk peso trading portfolio 3,157,180
-
- 100% -
40.0% -
- 0.4
- 0.3 0
-
- 0.4 -
95,500 0.3 28,650
Time period
Vertical adjustment Horizontal adjustmentIndependent Zones (1,2,3) Zone 1 and 2 Zone 2 and 3 Zones 1 - 3
The following table illustrates the value of the different factors used for calculating the interest rate risk of the trading portfolio.
Table 1 Sensitivity Factors - Trading Portfolio
Zone T Period Change in
Interest rate (bp) Sensitivity factor( αmt )
Vertical adjustment
factor Horizontal adjustment
factor
peso UF FX Peso UF FX (β) (λ)
1 Up to 30 days .............................. 125 350 125 0.0005 0.0014 0.0005 2 31 days to 3 mth .......................... 125 300 125 0.0019 0.0047 0.0020 3 3 – 6 mths ................................... 125 250 125 0.0042 0.0088 0.0044 4 6 – 9 mths ................................... 125 200 125 0.0069 0.0116 0.0072
Zone 1
5 9 mths – 1 year 125 175 125 0.0095 0.0140 0.0100
40%
6 1-2 years ...................................... 100 125 100 0.0124 0.0166 0.0133 7 2-3 years ...................................... 100 100 100 0.0191 0.0211 0.0211
Zone 2
8 3-4 years ...................................... 100 100 100 0.0248 0.0281 0.0281 30%
40%
9 4-5 years ...................................... 75 75 75 0.0221 0.0258 0.0258 10 5-7 years ...................................... 75 75 75 0.0263 0.0320 0.0320 11 7-10 years .................................... 75 75 75 0.0307 0.0401 0.0401 12 10-15 years .................................. 75 75 75 0.0332 0.0486 0.0486 13 15-20 years .................................. 75 75 75 0.0317 0.0534 0.0534
Zone 3
14 > 20 years .................................... 75 75 75 0.0278 0.0539 0.0539
10%
30%
40%
100%
Below is an example of how the interest risk of the trading portfolio is calculated. This calculation must be done for each type of currency (peso, inflation indexed and foreign currency).

145
Interest rate and inflation risk of trading portfolio: Regulatory method
The short term interest rate risk and inflation risk of the non-trading portfolio as defined by the Central Bank is equal to:
M 5 Sensitivity = Σ Σ (Amt - Lmt ) * μt + NPur * τ + Δφ
M t=1
The long term interest rate risk of the non-trading portfolio is calculated according to the following formula:
M 14
Sensitivity = Σ Σ (Amt - Lmt ) * ρt
m t=1
Where:
Amt = Non trading Assets (pesos, inflation linked and foreign currency) Lmt = Non Trading Liabilities (pesos, inflation linked and foreign currency) μt = Sensitivity factor associated with interest rate movement scenario NPur = Net position in inflation linked instruments, including those subject to price level restatement τ = Factor that measures the sensitivity of/to movements in the inflation index. This factor is
equal to 2% Δφ = Effect on fees from shifts in interest rate. Each bank must determine which fees are sensitive
to shifts in interest rates and assumes a 200 basis point movement. ρt = Sensitivity factor to increase in interest rates t = Time period M = Currency (pesos, inflation linked and foreign currency) Σ = Summation
= Absolute value
The following table illustrates the value of the different factors used for calculating the interest and inflation rate risks of the non-trading portfolio.
Table 2 Sensitivity Factors Trading Portfolio t
Period Change in
interest rate (bp) Sensitivity factor long-term
(ρt) Sensitivity factor
short-term peso UF FX peso UF FX (μt) 1 Up to 30 days............. 200 400 200 0.0008 0.0016 0.0008 0.0192 2 31 days to 3 mth ........ 200 400 200 0.0030 0.0063 0.0031 0.0167 3 3 – 6 mths ................. 200 400 200 0.0067 0.0140 0.0070 0.0125 4 6 – 9 mths ................. 200 400 200 0.0110 0.0231 0.0116 0.0075 5 9 mths – 1 year 200 400 200 0.0152 0.0320 0.0160 0.0025 6 1-2 years .................... 200 400 200 0.0248 0.0399 0.0266 7 2-3 years .................... 200 400 200 0.0382 0.0422 0.0422 8 3-4 years .................... 200 400 200 0.0496 0.0563 0.563 9 4-5 years .................... 200 400 200 0.0591 0.0690 0.0690 10 5-7 years .................... 200 400 200 0.0702 0.0856 0.0856 11 7-10 years .................. 200 400 200 0.0823 0.1076 0.1076 12 10-15 years ................ 200 400 200 0.0894 0.1309 0.1309 13 15-20 years ................ 200 400 200 0.0860 0.1450 0.1450 14 > 20 years .................. 200 400 200 0.0762 0.1480 0.1480
Foreign currency risk: local method
The foreign currency risk as defined by the Central Bank is equal to:
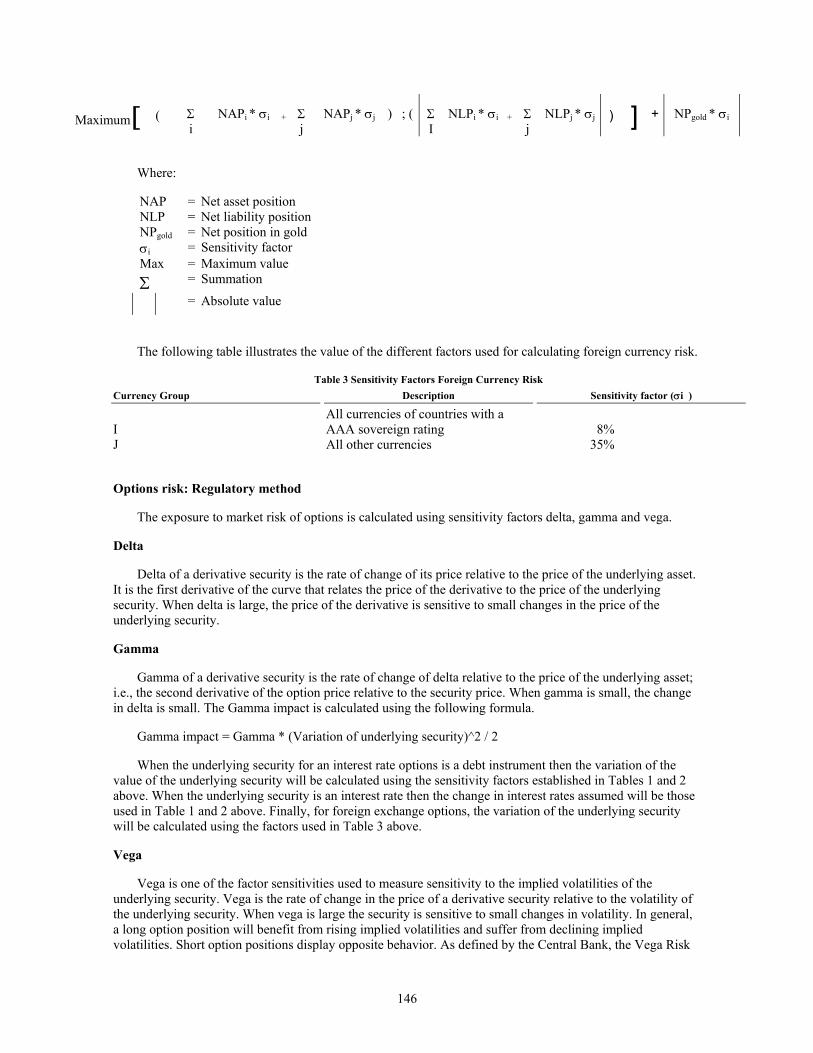
146
Σ NAPi * σi + Σ NAPj * σj ) ; ( Σ NLPi * σi + Σ NLPj * σj + NPgold * σi Maximum [ (
i
j
I
j ) ]
Where:
NAP = Net asset position NLP = Net liability position NPgold = Net position in gold σi = Sensitivity factor Max = Maximum value Σ = Summation
= Absolute value
The following table illustrates the value of the different factors used for calculating foreign currency risk.
Table 3 Sensitivity Factors Foreign Currency Risk Currency Group Description Sensitivity factor (σi )
I All currencies of countries with a AAA sovereign rating 8%
J All other currencies 35%
Options risk: Regulatory method
The exposure to market risk of options is calculated using sensitivity factors delta, gamma and vega.
Delta
Delta of a derivative security is the rate of change of its price relative to the price of the underlying asset. It is the first derivative of the curve that relates the price of the derivative to the price of the underlying security. When delta is large, the price of the derivative is sensitive to small changes in the price of the underlying security.
Gamma
Gamma of a derivative security is the rate of change of delta relative to the price of the underlying asset; i.e., the second derivative of the option price relative to the security price. When gamma is small, the change in delta is small. The Gamma impact is calculated using the following formula.
Gamma impact = Gamma * (Variation of underlying security)^2 / 2
When the underlying security for an interest rate options is a debt instrument then the variation of the value of the underlying security will be calculated using the sensitivity factors established in Tables 1 and 2 above. When the underlying security is an interest rate then the change in interest rates assumed will be those used in Table 1 and 2 above. Finally, for foreign exchange options, the variation of the underlying security will be calculated using the factors used in Table 3 above.
Vega
Vega is one of the factor sensitivities used to measure sensitivity to the implied volatilities of the underlying security. Vega is the rate of change in the price of a derivative security relative to the volatility of the underlying security. When vega is large the security is sensitive to small changes in volatility. In general, a long option position will benefit from rising implied volatilities and suffer from declining implied volatilities. Short option positions display opposite behavior. As defined by the Central Bank, the Vega Risk

147
is the sum in absolute value of the vega impacts for each option a bank holds. These impacts will be calculated assuming a change of 25% in the volatility rate.
Assumptions and Limitations of Scenario Simulations/Sensitivity Analysis (Regulatory method)
Our scenario simulation methodology should be interpreted in light of the limitations of our models, which include:
• The scenario simulation assumes that the volumes remain on balance sheet and that they are always renewed at maturity, omitting the fact that credit risk considerations and pre payments may affect the maturity of certain positions.
• This model assumes set shifts in interest rates and sensitivity factors for different time periods and does not take into consideration any other scenario for each time period or other sensitivity factors.
• The model does not take into consideration the sensitivity of volumes to these shifts in interest rates.
• The model does not take into consideration our subsidiaries which are subject to market risks.
Quantitative Disclosures about Market Risk: Regulatory Method
The following table illustrates at December 31, 2006 and 2007, our market risk exposure according to the Chilean regulatory method. This report is sent to the Superintendency of Banks and is published on our website on a quarterly basis. The Bank maximum exposure to long term interest rate fluctuations is set at 35% of regulatory capital and is approved by the Board.
Regulatory Market Risk At December 31,
2006 At December
31, 2007
(in millions of nominal Ch$) Market risk of Trading portfolio (EMR) Interest rate risk of trading portfolio.................................................................................. 22,489 64,484Foreign currency risk of trading portfolio ......................................................................... 24,841 2,576Risk from interest rate options .......................................................................................... 31,111 39,111Risk from foreign currency options................................................................................... 1 2Total market risk of trading portfolio ................................................................................ 78,442 106,17310% x Risk-weighted assets .............................................................................................. 1,126,349 1,312,391Subtotal.............................................................................................................................. 1,204,791 1,418,564Limit = Regulatory Capital................................................................................................ 1,418,303 1,602,432Available margin ............................................................................................................... 213,512 183,868 Non trading portfolio market risk Short-term interest rate risk ............................................................................................... 27,344 39,545Inflation risk ...................................................................................................................... 37,050 18,202Long term interest rate risk................................................................................................ 305,834 368,422Total market risk of non-trading portfolio......................................................................... 370,228 426,169 Regulatory limit of exposure to short-term interest rate and inflation risk Short-term exposure to interest rate risk............................................................................ 27,344 39,545Exposure to inflation risk .................................................................................................. 37,050 18,202Limit: 20% of (net interest income + net fee income sensitive to interest rates)............... 119,339 157,844Available margin ............................................................................................................... 54,945 100,097 Regulatory limit of exposure to long term interest rate risk Long-term exposure to interest rate risk............................................................................ 305,834 368,42235% of regulatory capital ................................................................................................. 496,406 560,851Available margin ............................................................................................................... 190,572 192,429
148
Internal Regulations Regarding Market Risk
Our relationship with Banco Santander Spain has allowed us to take advantage of Banco Santander Spain’s banking policies, procedures and standards, especially with respect to credit approval and risk management. Banco Santander Spain has successfully used these policies and expertise in the Spanish and other banking markets, and our management believes that such policies and expertise have a beneficial effect upon our operations. Below is a qualitative and quantitative description of our market risks according to our internal guidelines. These guidelines were established prior to the adoption of the applicable regulations required by local authorities and are still being used.
The main difference between the regulatory and internal methods is that the internal measures divide the Bank’s balance sheet into three categories and impose limits based on these categories. Our internal methods also takes into account Santander S.A. Agente de Valores. As a result, the sensitivity analysis performed incorporates a broader range of instruments and portfolios. The internal method also incorporates a value at risk methodology for measuring the market risk of our consolidated trading positions.
Value at Risk: Consolidated Trading Portfolio (Cartera de Negociación)
The VaR model is mainly used to measure the market risk of our trading portfolio. The Finance Division manages trading activities following the guidelines set by the ALCO and Banco Santander Spain’s Global Risk Department. The Market Risk and Control Department’s activities consist of (i) applying VaR techniques (as discussed above) to measure interest rate risk; (ii) marking to market our trading portfolios and measuring daily profit and loss from trading activities; (iii) comparing actual trading VaR and other limits against the established limits; (iv) establishing control procedures for losses in excess of such limits; and (v) providing information about trading activities to the ALCO, other members of senior management, the Finance Division and Banco Santander Spain’s Global Risk Department.
The Bank has a consolidated trading position comprised of fixed income trading, foreign currency trading and a minor equity trading position. The market risk of this trading portfolio is measured by using a VaR technique. The composition of this portfolio mainly consisted of Central Bank bonds, mortgage bonds and low risk Chilean corporate bonds issued locally. There is also an equity portfolio that represents less than 5% of the total trading portfolio. Under Chilean GAAP, a bank must separate its unconsolidated financial investment portfolio between “trading” and “available for sale” investment portfolios. Under Chilean GAAP, the unrealized holding gains (losses) related to investments classified as available for sale have been included in equity. The size of the available for sale portfolio is limited to an amount equal to such bank’s capital. Any amount above this must be considered as “trading”; the unrealized gains (losses) related to investments classified as “trading” are included in operating results. The ALCO has taken a conservative approach and has set even more restrictive limits on the Finance Division’s actual trading portfolio. This portfolio is denominated “Cartera de Negociación”. The market risk of the portfolio defined as “trading” for accounting purposes is measured by using the regulatory method.
VaR Model
All VaR measurements are intended to determine the distribution function for the change in value of a given portfolio, and once this distribution is known, to calculate a percentile linked to the confidence level required which will be equal to the VaR under those parameters. Therefore, if the distribution function of the change in value of a portfolio is known and given by f(x), where x is the random variable of the change in value of the portfolio, then the VaR for a determined level of confidence of k% is given by the number such that:
∫∞
=VaR
dx)x(f%k
or:
∫ ∞−=−
VaRdx)x(f%kl

149
As calculated by Santander-Chile, VaR is an estimate of the expected maximum loss in the market value of a given portfolio over a one day horizon at a one tailed 99.00% confidence interval. It is the maximum one day loss that Santander-Chile would expect to suffer on a given portfolio 99.00% of the time, subject to certain assumptions and limitations discussed below. Conversely, it is the figure that Santander-Chile would expect to exceed only 1.0% of the time. VaR provides a single estimate of market risk that is comparable from one market risk to the other. Volatility is calculated utilizing 520 historical observations. A one day holding period is utilized.
Santander-Chile uses VaR estimates to alert senior management whenever the statistically expected losses in its trading portfolio exceed prudent levels. Limits on VaR are used to control exposure on the fixed income trading portfolio, the net foreign currency trading position and the equity trading portfolio. Santander-Chile’s trading portfolio is mainly comprised of government bonds, mortgage finance bonds, mortgage finance bonds, the foreign currency trading position and a minor position in equities through Santander S.A. Agente de Valores. A daily VaR is calculated for the trading portfolio.
Assumptions and Limitations of VaR Model
Our VaR model assumes that changes in the market risk factors have a normal distribution and that the parameters of this joint distribution (in particular, the standard deviation of risk factor changes and the correlation between them) have been estimated accurately. The model assumes that the correlation and changes in market rates/prices included in our historical databases are independent and identically distributed random variables, and provide a good estimate of correlation and rate/price changes in the future.
Our VaR methodology should be interpreted in light of the limitations of our models, which include:
• Changes in market rates and prices may not be independent and identically distributed random variables or have a normal distribution. In particular, the normal distribution assumption may underestimate the probability of extreme market moves;
• The historical data we use in our VaR model may not provide the best estimate of the joint distribution of risk factor changes in the future, and any modifications in the data may be inadequate. In particular, the use of historical data may fail to capture the risk of possible extreme adverse market movements independent of the time range utilized. For example, the use of extended periods of historical data might erroneously lead to an important decrease in volatility especially after the Asian crisis. We typically use 520 historical observations of market data depending on circumstances, but also monitor other ranges of market data in order to be more conservative. However, reliable historical risk factor data may not be readily available for certain instruments in our portfolio;
• A one day time horizon may not fully capture the market risk positions that cannot be liquidated or hedged within one day. It would not be possible to liquidate or hedge all positions in one day;
• At present, we compute VaR at the close of business and trading positions may change substantially during the course of the trading day;
• The use of 99% confidence level does not take account of, nor makes any statement about, any losses that might occur beyond this level of confidence; and
• Value at risk does not capture all of the complex effects of the risk factors on the value of positions and portfolios and could, therefore, underestimate potential losses.
There are also a number of approximations in the VaR calculation. For example, benchmark indexes are used instead of certain risk factors, and in the case of some activities, not all the relevant risk factors are taken into account which can be due to difficulties obtaining daily data.
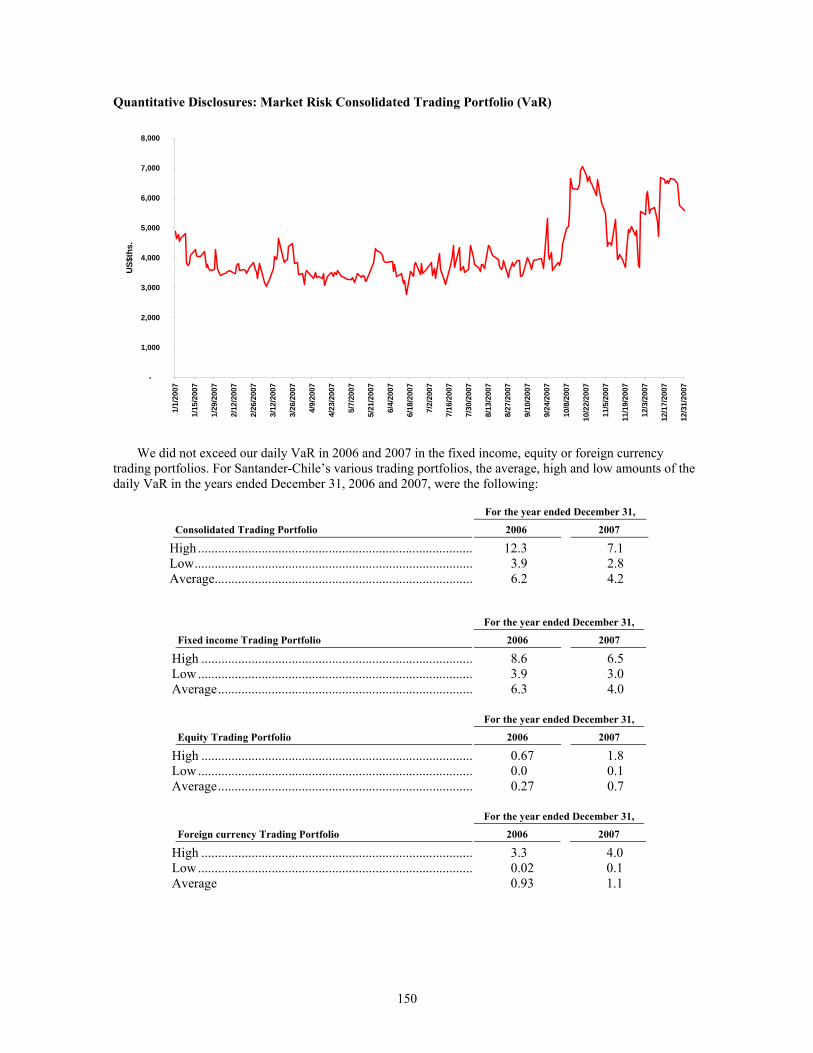
150
Quantitative Disclosures: Market Risk Consolidated Trading Portfolio (VaR)
-
1,000
2,000
3,000
4,000
5,000
6,000
7,000
8,000
1/1/
2007
1/15
/200
7
1/29
/200
7
2/12
/200
7
2/26
/200
7
3/12
/200
7
3/26
/200
7
4/9/
2007
4/23
/200
7
5/7/
2007
5/21
/200
7
6/4/
2007
6/18
/200
7
7/2/
2007
7/16
/200
7
7/30
/200
7
8/13
/200
7
8/27
/200
7
9/10
/200
7
9/24
/200
7
10/8
/200
7
10/2
2/20
07
11/5
/200
7
11/1
9/20
07
12/3
/200
7
12/1
7/20
07
12/3
1/20
07
US$
ths.
We did not exceed our daily VaR in 2006 and 2007 in the fixed income, equity or foreign currency trading portfolios. For Santander-Chile’s various trading portfolios, the average, high and low amounts of the daily VaR in the years ended December 31, 2006 and 2007, were the following:
For the year ended December 31,
Consolidated Trading Portfolio 2006 2007
High .................................................................................. 12.3 7.1 Low................................................................................... 3.9 2.8 Average............................................................................. 6.2 4.2
For the year ended December 31,
Fixed income Trading Portfolio 2006 2007
High ................................................................................. 8.6 6.5 Low.................................................................................. 3.9 3.0 Average............................................................................ 6.3 4.0
For the year ended December 31,
Equity Trading Portfolio 2006 2007
High ................................................................................. 0.67 1.8 Low.................................................................................. 0.0 0.1 Average............................................................................ 0.27 0.7
For the year ended December 31,
Foreign currency Trading Portfolio 2006 2007
High ................................................................................. 3.3 4.0 Low.................................................................................. 0.02 0.1 Average 0.93 1.1
151
Quantitative Disclosure: Derivatives
Derivatives
The Bank enters into transactions involving derivative instruments, particularly foreign exchange contracts, as part of its asset and liability management, and in acting as a dealer in order to satisfy its clients’ needs. The notional amounts of these contracts are carried off-balance sheet.
Foreign exchange forward contracts involve an agreement to exchange the currency of one country for the currency of another country at an agreed-upon price and settlement date. These contracts are generally standardized contracts, normally for periods between 1 and 180 days and are not traded in a secondary market; however, in the normal course of business and with the agreement of the original counterparty, they may be terminated or assigned to another counterparty.
When the Bank enters into a forward exchange contract, it analyses and approves the credit risk (the risk that the counterparty might default on its obligations). Subsequently, on an ongoing basis, it monitors the possible losses involved in each contract. To manage the level of credit risk, the Bank generally deals with counterparties of good credit standing, enters into master netting agreements whenever possible and when appropriate, and obtains collateral.
The Chilean Central Bank requires that foreign exchange forward contracts be made only in U.S. dollars and other major foreign currencies. In the case of the Bank, most forward contracts are made in U.S. dollars against the Chilean peso or the UF. Occasionally, forward contracts are also made in other currencies, but only when the Bank acts as an intermediary.
During the year ended December 31, 2006 and 2007, the Bank entered into interest rate and cross currency swap agreements to manage exposure to fluctuation in currencies and interest rates. The differential between the interest paid or received on a specified notional amount is recognized under the caption “Amounts payable from forward contracts, net”. The fair value of the swap agreement and changes in the fair value as a result of changes in market interest rates are recognized in the consolidated financial statements.
The Bank’s foreign currency futures and forward operations and other derivative products outstanding at December 31, 2006 and 2007, are summarized below:
The Chilean Central Bank requires that foreign exchange forward contracts be made only in US dollars and other major foreign currencies. In the case of the Bank, most forward contracts are made in US dollars against the Chilean peso or the UF. Occasionally, forward contracts are also made in other currencies, but only when the Bank acts as an intermediary.
During the period ended December 31, 2006 and 2007, the Bank entered into interest rate and cross currency swap agreements to manage exposure to fluctuation in currencies and interest rates. The differential between the interest paid or received on a specified notional amount is recognized under the caption “Amounts payable from forward contracts, net”. The fair value of the swap agreement and changes in the fair value as a result of changes in market interest rates are recognized in the consolidated financial statements.

152
The Bank’s foreign currency futures and forward operations and other derivative products outstanding at December 31, 2006 and 2007, are summarized below.
As of December 31, 2007 Notional amounts Fair Value
Cash Flow hedge (CF)
or fair value hedge
(FV) Within 3 months
After 3 months but within one year
After one year Assets Liabilities
MCh$ MCh$ MCh$ MCh$ MCh$ Derivate instruments in designated hedge
accounting relationships Currency Forwards ( ) - - - - -Interest rate Swaps (FV) - - 121,209 3,891 502Currency Swaps ( ) - - - - -Cross currency Swaps (FV) - - 278,757 - 9,246Cross currency Swaps (CF) - - 480,358 - 55,171Call currency options ( ) - - - - -Call interest rate options ( ) - - - - -Put currency options ( ) - - - - -Put interest rate options ( ) - - - - -Interest rate future ( ) - - - - -Others derivatives ( ) - - - - -Subtotal - - 880,324 3,891 64,919 Derivate instruments for trading Currency forwards 5,776,546 3,938,733 785,841 111,681 159,969Interest rate swaps 1,935,239 3,254,410 8,759,290 86,515 159,146Currency swaps - - - - -Cross currency swaps 133,688 460,902 6,557,457 576,515 392,337Call currency options 64,751 29,708 644 262 292Call interest rate options - - 74,667 1 -Put currency options 159,781 36,532 - 1,501 1,172Put interest rate options - - 75,667 - 9Interest rate future - - - - -Others derivatives 196,371 2,943 - 409 373Subtotal 8,266,376 7,723,228 16,253,566 776,884 713,298 Total 8,266,376 7,723,228 17,133,890 780,775 778,217
The notional amounts refer to the US dollar bought or sold or to the US dollar equivalent of foreign currency bought or sold for future settlement. The contract terms correspond to the duration of the contracts as from the date of the transaction to the date of the settlement.

153
As of December 31, 2006 Notional amounts Fair Value Cash Flow
hedge (CF) or fair
value hedge (FV)
Within 3 months
After 3 months but within one year
After one year Assets Liabilities
MCh$ MCh$ MCh$ MCh$ MCh$ Derivate instruments in designated hedge
accounting relationships
Currency Forwards ( ) - - - - -Interest rate Swaps (FV) - - 225,944 1,260 2,529Currency Swaps ( ) - - - - -Cross currency Swaps (FV) 906,761 - - - 40,689Call currency options ( ) - - - - -Call interest rate options ( ) - - - - -Put currency options ( ) - - - - -Put interest rate options ( ) - - - - -Interest rate future ( ) - - - - -Others derivatives ( ) - - - - -Subtotal 906,761 - 225,944 1,260 43,218 Derivate instruments for trading Currency forwards 6,465,222 3,691,295 407,074 88,753 106,818Interes rate swaps 492,069 1,266,642 4,215,224 37,559 73,237Currency swaps - - - - -Cross currency swaps 2,948,225 1,448,955 139,353 265,900 152,628Call currency options 51,149 399,776 - 4,710 4,697Call interes rate options - 107 - - -Put currency options - - - - -Put interes rate options 31,916 372,485 - 1,556 1,109Interes rate future - - - - -Others derivatives 336,347 114,838 109,096 678 696Subtotal 10,324,928 7,294,098 4,870,747 399,156 339,185 Total 11,231,689 7,294,098 5,096,691 400,416 382,403 The notional amounts refer to the US dollar bought or sold or to the US dollar equivalent of foreign currency bought or sold for future settlement. The contract terms correspond to the duration of the contracts as from the date of the transaction to the date of the settlement.
154
Sensitivity Analysis: Consolidated Non Trading Portfolios
The Bank’s non-trading portfolio or Financial Management (Gestión Financiera) portfolio includes the majority of the Bank’s assets and liabilities that are not trading, including the loan portfolio. Investment and funding decisions are heavily influenced by commercial strategies.
We use a sensitivity analysis to measure the market risk of the local and foreign currency-denominated non-trading portfolio. We perform a scenario simulation by calculating the potential loss over the entire balance from an increase (or decrease) of 100 basis points in the entire yield curve in terms of local rates. All local currency positions indexed to inflation are adjusted for a sensitivity factor of 0.57, which represents a shift of yield curve by 57 basis points in real rates and 100 basis point in nominal rates. The same scenario is performed for the net foreign currency position and U.S. dollar interest rates. We set limits as to the maximum loss these types of movements in interest rates can lead to over our capital and net financial income budgeted for the year. These limits are calculated according to the formulas discussed below.
Scenario Simulation (Net Financial Income)
To determine the percentage of our budgeted net financial income for the year that is at risk of loss upon a sudden 100 basis point movement in the entire yield curve, we utilize the following equation:
Sensitivity = ∑=
−Δn
li
ji )t365(x365
rxPGA
n: Number of intervals in which sensitivity is measured.
ti: Average maturity (or duration) for each interval being measured.
Δr: Change in interest rate. A 100 basis point increase (decrease) in the yield curve is used.
GAP: Difference between assets and liabilities that are sensitive to interest rates for each period.
Scenario Simulation (Capital and Reserves)
To determine the percentage of our capital and reserves that is at risk of loss upon a sudden 100 basis point movement in the entire yield curve, we utilize the following equation:
Sensitivity = ∑=
Δn
li
ji )Dm(xrxGAP
N: Number of intervals in which sensitivity is measured.
Dmj: Modified duration for interval i.
Δr: Change in interest rate. A 100 basis point increase (decrease) in the yield curve is used.
GAP: Difference between assets and liabilities that are sensitive to interest rates for each period.
Consolidated limits:
To determine the consolidated limit, the foreign currency limit is added to the local currency limit for both the net financial income loss limit and the loss limit over capital and reserves using the following formula:
Consolidated limit = Square root of a2 + b2 + 2ab

155
a: limit in local currency.
b: limit in foreign currency.
Since correlation is assumed to be 0. 2ab = 0.
Assumptions and Limitations of Scenario Simulations/Sensitivity Analysis
The most important assumption is the usage of a 100 basis point shift in the yield curve (57 basis points for real rates). We use a 100 basis point shift since a sudden shift of this magnitude is considered realistic, but not an everyday occurrence given historical movements in the yield curve, and significant in terms of the possible effects a shift of this size could have on our performance. The Global Risk Department at Banco Santander Spain has also set comparable limits by country in order to be able to compare, monitor and consolidate market risk by country in a realistic and orderly manner.
Our scenario simulation methodology should be interpreted in light of the limitations of our models, which include:
• The scenario simulation assumes that the volumes remain on balance sheet and that they are always renewed at maturity, omitting the fact that credit risk considerations and pre payments may affect the maturity of certain positions.
• This model assumes an equal shift throughout the entire yield curve and does not take into consideration different movements for different maturities.
• The model does not take into consideration the sensitivity of volumes to these shifts in interest rates.
• The limits to the loss of the budgeted financial income are calculated over an expected financial income for the year which may not be obtained, signifying that the actual percentage of financial income at risk could be higher than expected.
Quantitative Disclosure: Market Risk Non Trading Portfolio (Sensitivity Analysis/Scenario Simulations)
The Finance Division manages the risk management of the consolidated non-trading portfolios under guidelines approved by the ALCO and Banco Santander Spain’s Global Risk Department. In carrying out its market risk management functions, the Finance Division manages interest rate risk that arises from any mismatches with respect to rates, maturities, repricing periods, notional amounts or other mismatches between our interest earning assets and our interest bearing liabilities.
The Market Risk and Control Department: (i) applies scenario simulations (as discussed below) to measure the interest rate risk of the local currency activities and the potential loss as forecast by these simulations; and (ii) provides the ALCO, the Finance Division and Banco Santander Spain’s Global Risk Department with risk/return reports.
Non-trading local currency portfolio
The potential loss in the market value of our local currency-denominated non-trading balance sheet resulting from a 100 basis point shift in the yield curve was set at approximately Ch$94,000 million of equity at year-end 2007. This limit at the beginning of 2007 was set at Ch$60,000 million and was increased to Ch$70,000 million, Ch$86,000 million and finally Ch$94,000 million, as the Bank’s loan portfolio, especially residential mortgage loan portfolio continued to increase at a fast pace. These loans are generally financed with long-term bonds, but there is a time lapse between when bonds are issued and the growth rate of the residential mortgage portfolio. In order to accommodate for this temporary gap, this limit is increased. The Bank has remained within this limit for this portfolio, with only a minor breach of Ch$3,375 million in June 2007 and Ch$1,099 million in August 2007. At the same time, the variation in net interest income caused by a 100 basis point shift of the local yield curve may not exceed Ch$20,000 million and Santander-Chile was within the limits established in 2007. These limits are internally set by the ALCO. The ALCO has authority to

156
lower this limit. However, approval from the Santander Central Hispano Global Risk Department is required to lift this limit. The following table, sets forth the loss limit and the high, low and average potential loss in 2006 and 2007 resulting from a 100 basis point shift in the relevant interest rate.
Local Currency-denominated Financial Management Portfolio
Financial Income Capital and Reserves
(in millions of constant Ch$ as of December 31, 2007) Loss limit at December 31, 2007......................................... 20,000 94,000 High..................................................................................... 13,835 91,733 Low ..................................................................................... 386 50,630 Average in 2007 .................................................................. 8,243 75,450
Local Currency-denominated Financial Management Portfolio
Financial Income Capital and Reserves
(in millions of constant Ch$ as of December 31, 2006) Loss limit at December 31, 2006......................................... 20,000 60,000 High..................................................................................... 18,281 60,152 Low ..................................................................................... 2,564 43,561 Average in 2006 .................................................................. 9,397 53,844
Non-trading foreign currency portfolio
For our net non-trading foreign currency position, any loss caused by a 100 basis point shift in U.S. dollar interest rates may not exceed US$45x million of equity and US$30 million of budgeted net interest income. These limits are internally imposed limits set by the ALCO. The ALCO has the authority to lower this limit. However, approval from Banco Santander Spain Global Risk Department is required to lift this limit. The following table sets forth the loss limit and the high, low and average potential loss in 2006 and 2007, resulting from a 100 basis point shift in the interest rates on U.S. dollar-denominated assets and liabilities
Foreign Currency-denominated Financial Management Portfolio
Financial Income Capital and Reserves
(in millions of constant US$) Loss limit at December 31, 2007......................................... 30.0 45.0 High..................................................................................... 16.0 7.9 Low ..................................................................................... 1.0 0.7 Average in 2007 .................................................................. 6.7 4.2
Foreign Currency-denominated Financial Management Portfolio
Financial Income Capital and Reserves
(in millions of constant US$) Loss limit at December 31, 2006......................................... 30.0 45.0 High..................................................................................... 28.0 10.6 Low ..................................................................................... 2.5 1.0 Average in 2006 .................................................................. 12.0 6.0
Combined non-trading local and foreign currency
We track a consolidated indicator to track the total interest risk of the local and foreign currency-denominated non-trading portfolios. The consolidated loss limit for equity at risk was set at Ch$94,000 million at year-end 2007. This limit at the beginning of 2007 was set at Ch$60,000 million and was increased to Ch$70,000 million, Ch$86,000 million and finally Ch$94,000 million, as the Bank’s loan portfolio, especially residential mortgage loan portfolio continued to increase at a fast pace. These loans are generally

157
financed with long-term bonds, but there is a time lapse between when bonds are issued and the growth rate of the residential mortgage portfolio. In order to accommodate for this temporary gap, this limit is increased. The Bank has remained within this limit for this portfolio, with only a minor breach of Ch$3,375 million in June 2007 and Ch$1,056 million in August 2007. At the same time, the variation in net interest income caused by a 100 basis point shift of the local yield curve may not exceed Ch$30,000 million. The following table, which contemplates a 100 basis point shift in the relevant interest rate, indicates that Santander-Chile was within the limits established in 2007. These limits are an internally imposed limit set by the ALCO and Banco Santander Spain’s Global Risk Department. The ALCO has authority to lower these limits. However, approval from Banco Santander Spain Global Risk Department is required to lift these limits.
Combined Financial Management Portfolio
Financial Income Capital and Reserves
(in millions of constant Ch$ as of December 31, 2007) Loss limit at December 31, 2007......................................... 15,249 84,767 High..................................................................................... 15,249 91,733 Low ..................................................................................... 5,377 50,630 Average in 2007 ................................................................. 9,553 75,452
Combined Financial Management Portfolio
Financial Income Capital and Reserves
(in millions of constant Ch$ as of December 31, 2006) Loss limit at December 31, 2006......................................... 30,000 60,000 High..................................................................................... 23,719 60,188 Low ..................................................................................... 4,458 43,758 Average in 2006 ................................................................. 11,604 53,961
Volume Limits
We have also developed volume limits, which place a cap on the actual size of the different portfolios being monitored.
Fixed Income: Volume Equivalent. This system is considered to be an additional limit to the size of our consolidated fixed income trading portfolio. This measure seeks to conform the different instruments in our fixed income trading portfolio and convert the portfolio into a single instrument with a duration of one year. Santander-Chile limits the size of this volume equivalent portfolio. The equivalent volume is calculated by the Market Risk and Control Department and limits are set by the ALCO with respect to the size of the volume equivalent portfolio.
Net Foreign Currency Trading Position: Maximum Net Position. We also set an absolute limit on the size of Santander-Chile’s consolidated net foreign currency trading position. At December 31, 2007, this was equal to US$200 million. The limit on the size of the net foreign currency position is determined by the ALCO and is calculated and monitored by the Market Risk and Control Department.
Liquidity Management
The Central Bank also requires us to comply with the following liquidity limits:
• The sum of the liabilities with a maturity of less than 30 days may not exceed the sum of the assets with a maturity of less than 30 days by more than an amount greater than our capital. This limit must be calculated in local currency and foreign currencies together as one gap. At December 31, 2007, the percentage of (x) our liabilities with a maturity of less than 30 days in excess of our assets with a maturity of less than 30 days to (ii) our capital and reserves was 40.9%.

158
• The sum of the liabilities with a maturity of less than 90 days may not exceed the sum of the assets with a maturity of less than 90 days by more than 2 times our capital. This limit must be calculated in local currency and foreign currencies together as one gap. At December 31, 2007, the percentage of (x) our liabilities with a maturity of less than 90 days in excess of our assets with a maturity of less than 90 days to (y) 2 times our capital and reserves was 44.0%.
We have also set internal liquidity limits. The Market Risk Control Department measures two other liquidity indicators:
1. Net accumulated liquidity gap:
• Net accumulated liquidity gap, which represents the amount of the assets with a maturity of up to 30 days in excess of the liabilities with a maturity of up to 30 days, is required to be no less than Ch$0, i.e.,
The following table sets forth our net accumulated liquidity gap at December 31, 2007, and our average net accumulated liquidity gap for the year of 2007.
Net accumulated liquidity gap in Ch$
At December 31, 2007 ...................................................... 1,808 Average in 2007................................................................ 428
2. Liquidity coefficient (LC):
Liquidity coefficient, calculated by dividing (x) liquid assets (at liquidation value) by (y) the sum of total liabilities, capital and contingent liabilities, is required to be no less than 2%, i.e., Liquid assets (at liquidation value) / (Total liabilities capital + contingent) >= 2%
The following table sets forth our liquidity coefficients at December 31, 2007, and for the year of 2007.
LC Local currency Foreign currency
At December 31, 2007...................................................... 18.7% 40.0% Average in 2007 ............................................................... 20.5% 38.7%
Other Subsidiaries
For VaR measurements and scenario simulations, our consolidated trading and consolidated non-trading portfolios do not consolidate the asset liability structure of the following subsidiaries:
• Santander Leasing S.A.
• Santander Investment S.A. Corredores de Bolsa
• Santander Asset Management S.A. Administradora General de Fondos
• Santander S.A. Sociedad Securitizadora
• Santander Corredora de Seguros Ltda.
• Santander Servicios de Recaudación y Pagos Ltda.
The balance sheets of these subsidiaries are mainly comprised of non sensitive assets and liabilities, fixed assets and capital and in total only represent 2.3% of our total consolidated assets.
ITEM 12. DESCRIPTION OF SECURITIES OTHER THAN EQUITY SECURITIES
Not applicable.

159
PART II
ITEM 13. DEFAULTS, DIVIDEND ARREARAGES AND DELINQUENCIES
Not applicable.
ITEM 14. MATERIAL MODIFICATIONS TO THE RIGHTS OF SECURITY HOLDERS AND USE OF PROCEEDS
Not applicable.
ITEM 15. CONTROLS AND PROCEDURES
Conclusion Regarding the Effectiveness of Disclosure Controls and Procedures
As of December 31, 2007, the Bank, under the supervision and with the participation of Bank’s management, including the President, Chief Executive Officer and Chief Financial Officer, performed an evaluation of the effectiveness of the design and operation of our disclosure controls and procedures (as defined in Rule 13a-15(f) under the Exchange Act). There are, as described below, inherent limitations to the effectiveness of any control system, including disclosure controls and procedures. Accordingly, even effective disclosure controls and procedures can provide only reasonable assurance of achieving their control objectives.
Based on such evaluation, the Bank’s President, Chief Executive Officer and Chief Financial Officer concluded that the Bank’s disclosure controls and procedures were effective in ensuring that information relating to the Bank, including its consolidated subsidiaries, required to be disclosed in the reports it files under the Exchange Act is (1) recorded, processed, summarized and reported within the time periods specified in the SEC’s rules and forms, and (2) accumulated and communicated to the management, including principal financial officers as appropriate to allow timely decisions regarding required disclosure.
Management’s Report on Internal Control Over Financial Reporting
The Bank’s management is responsible for establishing and maintaining adequate internal control over financial reporting as defined in Rule 13a-15 (f) under the Exchange Act. The Bank’s internal control over financial reporting is a process designed to provide reasonable assurance regarding the reliability of financial reporting and the preparation of financial statements for external purposes in accordance with generally accepted accounting principles in Chile, including the reconciliation to U.S. GAAP, and includes those policies and procedures that:
• Pertain to the maintenance of records that, in reasonable detail, accurately and fairly reflect the transactions and dispositions of the assets of the Bank;
• Provide reasonable assurance that transactions are recorded as necessary to permit preparation of financial statements in accordance with generally accepted accounting principles, and that our receipts and expenditures are being made only in accordance with authorizations of the Bank’s management and directors; and
• Provide reasonable assurance regarding prevention or timely detection of unauthorized acquisition, use or disposition of our assets that could have a material effect on the financial statements.
Because of its inherent limitations, internal control over financial reporting, no matter how well designed may not prevent or detect misstatements, due to the possibility that a control can be circumvented or overridden or that misstatements due to error or fraud may occur that are not detected. Also, projections of any evaluation of effectiveness to future periods are subject to the risk that controls may become inadequate because of changes in conditions, or that the degree of compliance with the policies or procedures may deteriorate.

160
Under the supervision and with the participation of the Bank’s management, including the Chief Executive Officer and Chief Financial Officer, we conducted an evaluation of the effectiveness of our internal control over financial reporting based on the criteria established in Internal Control—Integrated Framework issued by the Committee of Sponsoring Organizations of the Treadway Commission (“COSO”) in the Enterprise-Wide Risk Management – Integrated Framework.
Based on this assessment, our management concluded that, as of December 31, 2007, our internal control over financial reporting was effective based on those criteria.
Our internal control over financial reporting as of December 31, 2007, has been audited by Deloitte Auditores y Consultores Limitada, an independent registered public accounting firm, as stated in their report which follows below.
Changes in Internal Control Over Financial Reporting
There has been no change in the Bank’s internal control over financial reporting (as defined in Rule 13a-15(f) under the Exchange Act) that occurred during the period covered by this Annual Report that has materially affected, or is reasonably likely to materially affect, internal control over financial reporting.
Report of Independent Registered Public Accounting Firm
To the Board of Directors and Shareholders of Banco Santander Chile We have audited the internal control over financial reporting of Banco Santander Chile and its subsidiaries (collectively referred to as “Banco Santander Chile” or the “Bank”) as of December 31, 2007, based on criteria established in Internal Control-Integrated Framework issued by the Committee of Sponsoring Organizations of the Treadway Commission. The Bank’s management is responsible for maintaining effective internal control over financial reporting and for its assessment of the effectiveness of internal control over financial reporting included in the accompanying Management’s Report on Internal Control Over Financial Reporting. Our responsibility is to express an opinion on the Bank’s internal control over financial reporting based on our audit. We conducted our audit in accordance with the standards of the Public Company Accounting Oversight Board (United States of America). Those standards require that we plan and perform the audit to obtain reasonable assurance about whether effective internal control over financial reporting was maintained in all material respects. Our audit included obtaining an understanding of internal control over financial reporting, assessing the risk that a material weakness exist, testing and evaluating the design and operating effectiveness of internal control based on the assessed risk, and performing such other procedures as we considered necessary in the circumstances. We believe that our audit provides a reasonable basis for our opinion. A bank’s internal control over financial reporting is a process designed by, or under the supervision of, the bank’s principal executive and principal financial officers, or persons performing similar functions, and effected by the bank’s board of directors, management, and other personnel to provide reasonable assurance regarding the reliability of financial reporting and the preparation of financial statements for external purposes in accordance with generally accepted accounting principles. A Bank’s internal control over financial reporting includes those policies and procedures that (1) pertain to the maintenance of records that, in reasonable detail, accurately and fairly reflect the transactions and dispositions of the assets of the bank; (2) provide reasonable assurance that transactions are recorded as necessary to permit preparation of financial statements in accordance with generally accepted accounting principles, and that receipts and expenditures of the bank are being made only in accordance with authorizations of management and directors of the bank; and (3) provide reasonable assurance regarding prevention or timely detection of unauthorized acquisition, use, or disposition of the bank’s assets that could have a material effect on the financial statements. Because of the inherent limitations of internal control over financial reporting, including the possibility of collusion or improper management override of controls, material misstatements due to error or fraud may not be prevented or detected on a timely basis. Also, projections of any evaluation of the effectiveness of the
161
internal control over financial reporting to future periods are subject to the risk that the controls may become inadequate because of changes in conditions, or that the degree of compliance with the policies or procedures may deteriorate. In our opinion, the Bank maintained, in all material respects, effective internal control over financial reporting as of December 31, 2007, based on the criteria established in Internal Control-Integrated Framework issued by the Committee of Sponsoring Organizations of the Treadway Commission. We have also audited, in accordance with the standards of the Public Company Accounting Oversight Board (United States of America), the consolidated financial statements as of and for the year ended December 31, 2007 and our report dated June 23, 2008 expressed an unqualified opinion on those consolidated financial statements and included three explanatory paragraphs stating that (1) during 2006 the Bank modified its basis for recording and valuation of financial investments acquired for trading, available-for-sale or held-to-maturity investments and derivative instruments. The nature and effect of such modification is explained in Note 2 to the consolidated financial statements of the Bank, (2) the accounting principles generally accepted in Chile vary in certain significant respects from accounting principles generally accepted in the United States of America (“U.S. GAAP”), and that the information relating to the nature and effect of such differences is presented in Note 28 to the consolidated financial statements of the Bank and (3) that a convenience translation of Chilean peso amounts to U.S. dollars was presented. /s/Deloitte Santiago, Chile June 23, 2008
ITEM 16. [RESERVED]
ITEM 16A. AUDIT COMMITTEE FINANCIAL EXPERT
Our Board of Directors has determined that two of the members of our Audit Committee, Benigno Rodríguez Rodríguez (who resigned from the Board and the Audit Committee on June 24, 2008) and Víctor Arbulú Crousillat, meet the requirements of an “audit committee financial expert” in accordance with SEC rules and regulations, in that they have an understanding of Chilean GAAP and financial statements, the ability to assess the general application of Chilean GAAP in connection with the accounting for estimates, accruals and reserves, experience analyzing and evaluating financial statements that present a breadth and level of complexity of accounting issues that are generally comparable to the breadth and complexity of issues that can reasonably be expected to be raised by our consolidated financial statements, an understanding of internal controls over financial reporting, and an understanding of audit committee functions. All three members of our Audit Committee have experience overseeing and assessing the performance of Santander-Chile and its consolidated subsidiaries and our external auditors with respect to the preparation, auditing and evaluation of our consolidated financial statements.
All three members of our Audit Committee are considered to be independent according to applicable NYSE criteria. Benigno Rodríguez R. (who resigned from the Board and the Audit Committee on June 24, 2008) and Víctor Arbulú C. are relying on the exemption provided by Rule 10A-3(b)(1)(iv)(B), which allows an otherwise independent director to serve on both the audit committee of the issuer and the Board of Directors of an affiliate. The Board is expected to nominate and approve a new member of the Audit Committee on it’s next monthly meeting in July 2008.
ITEM 16B. CODE OF ETHICS
The Bank has adopted a code of ethics that is applicable to all of the Bank’s employees and a copy is included as an exhibit hereto. We will provide to any person without charge, upon request, a copy of our code of ethics. Please email [email protected] to request a copy.

162
ITEM 16C. PRINCIPAL ACCOUNTANT FEES AND SERVICES
Amounts paid to the auditors for statutory audit and other services were as follows:
2006
MCh$ 2007
MCh$
Audit Services - Statutory audit 727 789 - Audit-related regulatory reporting 693 99
Tax Fees - Compliance -- -- - Advisory Services -- 1 All Other Services -- 15 Total 1,420 904
Statutory audit: Consists of fees billed for professional services rendered in connection with the audit of our consolidated financial statements that are provided by Deloitte Auditores y Consultores Limitada in 2006 and 2007 in connection with statutory and regulatory filings or engagements, and attest services.
Audit-related regulatory reporting: Consists of fees billed for assurance and related services that were specifically related to the performance of the audit and review of our filings under the Securities Act.
Auditors are pre-approved by the Audit Committee. The selection of external auditors is subject to approval by shareholders at the Annual Shareholders’ Meeting. All proposed payments have been presented to our Audit Committee, which has determined that they are reasonable and consistent with internal policies.
ITEM 16D. EXEMPTIONS FROM THE LISTING STANDARDS FOR AUDIT COMMITTEES
Not applicable.
ITEM 16E. PURCHASES OF EQUITY SECURITIES BY THE ISSUER AND AFFILIATED PURCHASERS
In 2007 neither Santander-Chile nor any of its affiliates purchased any of Santander-Chile’s equity securities.
PART III
ITEM 17. FINANCIAL STATEMENTS
We have responded to Item 18 in lieu of this item.
ITEM 18. FINANCIAL STATEMENTS
Reference is made to Item 19 for a list of all financial statements filed as part of this Annual Report.
ITEM 19. EXHIBITS
a) Index to Financial Statements
Review report of independent registered public accounting firm F-2 Audited consolidated financial statements: Consolidated balance sheets at December 31, 2006 and 2007 F-3
163
Consolidated statements of income for each of the three years in the period ended December 31, 2007 F-5
Consolidated statements of cash flows for each of the three years in the period ended December 31, 2007 F-6
Consolidated statements of shareholders’ equity for each of the three years in the period ended December 31, 2007 F-7
Notes to consolidated financial statements F-8
b) Index to Exhibits
Exhibit Number Description
1A.1 Restated Articles of Incorporation of Santander-Chile (Spanish Version)
(incorporated by reference to our Registration Statement on Form F-4 (Registration No. 333-100975) filed with the Commission on December 12, 2002).
1A.2 Restated Articles of Incorporation of Santander-Chile (English Version) (incorporated
by reference to our Registration Statement on Form F-4(Registration No. 333-100975) filed with the Commission on December 12, 2002).
1B.1 Amended and Restated By-Laws (estatutos) of Santander-Chile (Spanish Version)
(incorporated by reference to our Annual Report on Form 20-F for the fiscal year ended December 31, 2004 (File No. 1-4554) filed with the Commission on June 30, 2005).
1B.2 Amended and Restated By-Laws (estatutos) of Santander-Chile (English Version)
(incorporated by reference to our Annual Report on Form 20-F for the fiscal year ended December 31, 2004 (File No. 1-4554) filed with the Commission on June 30, 2005).
2A.1 Form of Amended and Restated Deposit Agreement, dated August 1, 2002, among
Banco Santander-Chile (formerly known as Banco Santiago), the Bank of New York (as depositary) and Holders of American Depositary Receipts (incorporated by reference to our Registration Statement on Form F-6 (Registration No. 333-97303) filed with the Commission on July 26, 2002).
2A.2 Form of Foreign Investment Contract among Banco Santiago, JPMorgan Chase Bank
and the Central Bank of Chile relating to the foreign exchange treatment of an investment in ADSs (accompanied by an English translation) (Incorporated by reference to our Registration Statement on Form F-1 (Registration No. 333-7676) filed with the Commission on October 23, 1997).
2A.3 Copy of the Central Bank Chapter XXVI Regulations Related to the Acquisition of
Shares in Chilean Corporations and the Issuance of Instrument on Foreign Stock Exchanges or under Other Terms and Conditions of Issue (accompanied by an English translation) (incorporated by reference to Old Santander-Chile’s Annual Report for the fiscal year ended December 31, 1996 (File No. 1-13448) filed with the Commission on June 30, 1997).
2B.1 Agreement for the Issuance of Bonds dated November 26, 1996 between Old
Santander-Chile and Banco Security (accompanied by an English translation) (incorporated by reference to Old Santander-Chile’s Annual Report for the fiscal year ended December 31, 1996 (File No. 1-13448) filed with the Commission on June 30, 1997).

164
2B.2 Indenture dated December 9, 2004 between Santander-Chile and Deutsche Bank Trust Company Americas, as trustee, providing for issuance of securities in series (incorporated by reference to Banco Santiago’s Annual Report on Form 20-F for the fiscal year ended December 31, 2005 (File No. 1-4554) filed with the Commission on April 12, 2006).
2B.3 Indenture dated March 16, 2001, as amended on May 30, 2003, October 22, 2004,
May 3, 2005, and September 20, 2005 between Santander-Chile and Banco de Chile, as trustee, relating to issuance of UF14 million senior notes (copy to be furnished upon request).
4A.1 Automatic Teller Machines Participation Agreement dated October 1, 1988 between
Banco Espanol-Chile (predecessor to Old Santander-Chile) and REDBANC (accompanied by an English translation) (incorporated by reference to Old Santander-Chile’s Annual Report for the fiscal year ended December 31, 1996 (File No. 1-13448) filed with the Commission on June 30, 1997).
4A.2 Outsourcing agreement between Banco Santiago and IBM de Chile S.A.C. dated June
30, 2000 (including English summary) (incorporated by reference to Banco Santiago’s Annual Report on Form 20-F for the fiscal year ended December 31, 2000 (File No. 1-4554) filed with the Commission on June 28, 2001).
4A.3 Systems and Technology Service and Consulting Agreement between Santander-
Chile and Altec dated December 30, 2003 (English translation) (incorporated by reference to our Annual Report on Form 20-F for the fiscal year ended December 31, 2003 (File No. 1-14554) filed with the Commission on June 29, 2004).
4A.4 Purchase-Sale Contract between Santander-Chile and Empresas Almacenes París
dated December 6, 2004 (English translation) (incorporated by reference to our Annual Report on Form 20-F for the fiscal year ended December 31, 2005 (File No. 1-14554) filed with the Commission on June 12, 2006).
4A.5 Service Participant operating contract dated August 9, 2005 between
Banco Santander-Chile and Socieded Operadora de la Cámera de Compensación de Pagos de Alto Valor (English translation) (incorporated by reference to our Annual Report on Form 20-F for the fiscal year ended December 31, 2006 (File No. 1-14554) filed with the Commission on June 19, 2007).
4A.6 Commercial Pledge Agreement dated February 5, 2007 by Santander-Chile of shares
in Administrador Financiero de Transantiago (English Translation) (incorporated by reference to our Annual Report on Form 20-F for the fiscal year ended December 31, 2006 (File No. 1-14554) filed with the Commission on June 19, 2007).
4A.7 Contract for the Outsourcing of Computer Services between Santander-Chile and
Produban, Servicios Informaticos Generales, S.L, dated December 3, 2007 (English translation) (filed herewith).
7.1 Statement explaining Calculation of Ratios (incorporated by reference to Old
Santander-Chile’s Annual Report on Form 20-F for the fiscal year ended December 31, 2000 (File No. 1-13448) filed with the Commission on June 28, 2001).
8.1 List of Subsidiaries (incorporated by reference to our Annual Report on Form 20-F
for the fiscal year ended December 31, 2004 (File No. 1-4554) filed with the Commission on June 30, 2005).
11.1 Code of Conduct for Executive Personnel of Banco Santander-Chile and Subsidiaries

165
(incorporated by reference to our Annual Report on Form 20-F for the fiscal year ended December 31, 2004 (File No. 1-4554) filed with the Commission on June 30, 2005).
11.2 Code of Conduct for all Grupo Santander Personnel (incorporated by reference to our
Annual Report on Form 20-F for the fiscal year ended December 31, 2004 (File No. 1-4554) filed with the Commission on June 30, 2005).
. 12.1 Section 302 Certification by the Chief Executive Officer. 12.2 Section 302 Certification by the Chief Financial Officer. 13.1 Section 906 Certification. 23.1 Consent of Deloitte & Touche Sociedad de Auditores y Consultores, Ltda.
We will furnish to the Securities and Exchange Commission, upon request, copies of any unfiled instruments that define the rights of holders of long-term debt of Banco Santander-Chile.

166
SIGNATURES
The registrant hereby certifies that it meets all of the requirements for filing on Form 20-F and that it has duly caused and authorized the undersigned to sign this Annual Report on its behalf.
BANCO SANTANDER-CHILE
By: /s/ Gonzalo Romero A. Name: Gonzalo Romero A. Title: General Counsel
Date: June 25, 2008.