Commerzbank German Investment Seminar 2016 New York City ... · Commerzbank German Investment...
80
Transcript of Commerzbank German Investment Seminar 2016 New York City ... · Commerzbank German Investment...


HUGO BOSS © 2Jan-16Commerzbank German Investment Seminar 2016
Commerzbank German Investment Seminar 2016
Mark Langer, CFO
New York City, January 12/13, 2016
Dennis Weber, Head of Investor Relations

HUGO BOSS © 3Jan-16Commerzbank German Investment Seminar 2016
Agenda
Omnichannel strategy
Group strategy update
Financial outlook and summary

HUGO BOSS © 4Jan-16Commerzbank German Investment Seminar 2016
Agenda
Omnichannel strategy
Group strategy update
Financial outlook and summary

HUGO BOSS © 5Jan-16Commerzbank German Investment Seminar 2016
The Group’s operating environment is changing at a rapid pace
The relationship between brands
and customers has changed
Today’s customers increasingly
think “noline“
The pressure on multi-branded
retail is growing
Global brand perception is
shaped in key metropolitan areas
Apparel is in a tough competition
for share of consumers’ wallet
The importance of sustainability is
rising
Marketing power drives brand
desirability
The importance of the traveling
consumer is growing by the day
Talent has become a scarce
resource
■ Changing consumer habits mean
business models are changing
industry-wide
■ Pace of industry growth is slowing
■ Cost of doing business is rising
Challenges for the whole industry …
■ Business model has to become
more customer-centric than ever
before
■ Need to nurture brand’s growth
potential beyond its core
■ Need to constantly improve
efficiency and productivity
… as well as for HUGO BOSS

HUGO BOSS © 6Jan-16Commerzbank German Investment Seminar 2016
Every element of Group strategy must contribute to turning these
challenges into opportunities
Further build the Group’s operational strength to enable key strategy implementation
Elevate the
BOSS core
brand by
engaging
consumers
emotionally
Leverage the
brand’s potential
in womenswear
and shoes &
accessories
Build
omnichannel to
drive own retail
online and offline
Exploit growth
opportunities in
underpenetrated
markets

HUGO BOSS © 7Jan-16Commerzbank German Investment Seminar 2016
Brand elevation aims to increase luxury share to 20% of BOSS sales by 2020
Further build the Group’s operational strength to enable key strategy implementation
Elevate the
BOSS core
brand by
engaging
consumers
emotionally
Leverage the
brand’s potential
in womenswear
and shoes &
accessories
Build
omnichannel to
drive own retail
online and offline
Exploit growth
opportunities in
underpenetrated
markets

HUGO BOSS © 8Jan-16Commerzbank German Investment Seminar 2016
Emotional brand perception will be key to brand elevation
Brand strategy
(purpose)
Inspire and enable
people for success
Emotional brand
perception
When a garment simply
feels right you are ready
to achieve whatever you
are striving for in life
Product positioning
The unique combination
of craftsmanship in
tailoring and the artistry
of modern engineering
Rational brand
perception
Outstanding quality and
the perfect fit
Connect
through
SHARED
EXPERIENCES
Connect
through
SHARED
VALUES
Emotional level
Rational level

HUGO BOSS ©
An increasingly differentiated brand portfolio will support BOSS brand
elevation
Jan-16Commerzbank German Investment Seminar 2016 9
PR
EM
IUM
LU
XU
RY
authentic
lighthearted
confident
sophisticated
progressive
contemporary
innovative
dynamic
Future brand positioning
WH
OL
ES
AL
ER
ETA
IL

HUGO BOSS © 10Jan-16Commerzbank German Investment Seminar 2016
A changing price architecture supports brand differentiation
■ BOSS core brand offering
will continue to be
anchored in premium,
extending into luxury
■ HUGO and BOSS Green
will cater to entry price
points discontinued by the
BOSS core brand
Clothing Shirts 90 - 229 70 - 120 -
Trousers 140 - 299 110 - 140 -
Jackets 349 - 749 279 - 379 -
Suits 499 - 1199 399 - 549 -
Sportswear Polos 80 - 249 75 - 100 70 - 120
Jeans 130 - 279 100 - 150 100 - 150
Trousers 140 - 200 110 - 160 120 - 140
Outerwear 299 - 799 279 - 299 229 - 279
Jackets 349 - 699 279 - 329 -
Shoes 240 - 495 170 - 270 140 - 195
Product Group
HUGO BOSS price ranges by product group and brand line
(Pre-Fall 2016 collection, German market)
in EUR
HUGO BOSS ©
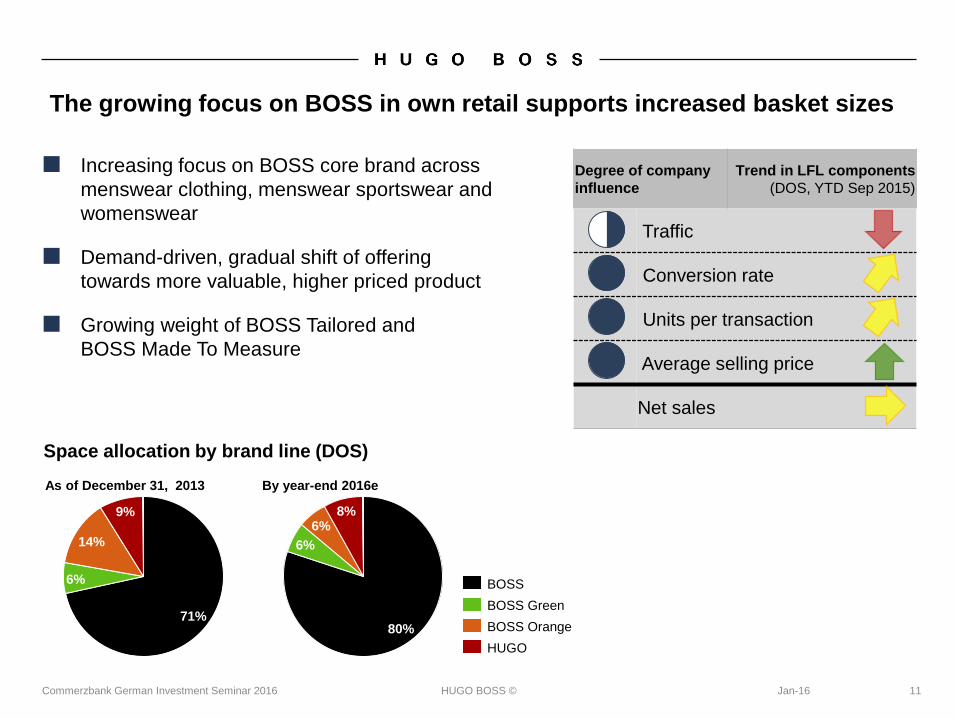
The growing focus on BOSS in own retail supports increased basket sizes
Jan-16Commerzbank German Investment Seminar 2016 11
Space allocation by brand line (DOS)
As of December 31, 2013 By year-end 2016e
9%
6%
14%
71%
HUGO
BOSS Orange
BOSS Green
BOSS
6%
8%6%
80%
Degree of company
influence
Trend in LFL components
(DOS, YTD Sep 2015)
Traffic
Conversion rate
Units per transaction
Average selling price
Net sales
■ Increasing focus on BOSS core brand across
menswear clothing, menswear sportswear and
womenswear
■ Demand-driven, gradual shift of offering
towards more valuable, higher priced product
■ Growing weight of BOSS Tailored and
BOSS Made To Measure

HUGO BOSS ©
The category migration process has been well received by wholesale
partners in Europe
12Jan-16Commerzbank German Investment Seminar 2016
Top 5 European wholesale markets 2015
1. Germany
2. United Kingdom
3. France
4. Scandinavia
5. Benelux
Wholesale category business order book(Top 8 EMEA WHS category customers,
Spring/Summer 2015 vs. Spring/Summer 2016 // in %)
2016
75
10
15
33
41
26
2015
+1%
BOSS Green Man
HUGO Man
BOSS Man
■ Category migration process almost completed
in Europe
■ Distribution of BOSS core brand limited to
shop-in-shops
■ Substitution of BOSS core brand with HUGO
and BOSS Green in category business

HUGO BOSS © 13Jan-16Commerzbank German Investment Seminar 2016
Womenswear aims to account for at least 15% of Group sales by 2020
Further build the Group’s operational strength to enable key strategy implementation
Elevate the
BOSS core
brand by
engaging
consumers
emotionally
Leverage the
brand’s potential
in womenswear
and shoes &
accessories
Build
omnichannel to
drive own retail
online and offline
Exploit growth
opportunities in
underpenetrated
markets

HUGO BOSS © 14Jan-16Commerzbank German Investment Seminar 2016
Six key values shape the brand’s competence in womenswear
T a i l o r e d Building on the brand’s key
competence in tailoring
S o p h i s t i c a t e dPresenting an urban and
cultivated approach to the
daily wardrobe
F e m i n i n eOffering desirable products
with a high degree of
feminine aesthetic
M o d e r nProviding sophisticated
and versatile garments that
fulfil every need of a
woman’s modern lifestyle
I n n o v a t i v eInnovating with new and
cutting-edge fabrics,
finishes and construction
techniques
R e f i n e d Offering straightforward,
understated luxury
“BOSS Womenswear offers modern yet timeless style statements with a luxurious
touch for sophisticated women”

HUGO BOSS © 15Jan-16Commerzbank German Investment Seminar 2016
BOSS Womenswear addresses four key user moments
M O D E R N B U S I N E S S M O D E R N D A Y
O C C A S I O N L U X U R Y L E I S U R E

HUGO BOSS © 16Jan-16Commerzbank German Investment Seminar 2016
Healthy and sustainable growth in the womenswear business
Womenswear sales growth has accelerated,
driven by own retail and wholesale alike
The number of stores offering womenswear
has increased, driven by the establishment of
30 ambassador stores…
2011
3
48
49
2010
6
49
45
40
56
2013
4
41
249
5
48
47
2009
211231
213
289263
55
2012
4
44
52
2014
4
Licenses
Wholesale
Retail
Womenswear sales
(in EUR million)
and share of sales channels
(in %)
291258
2014 2015
Number of DOS offering womenswear
(September 2014 v. September 2015)

HUGO BOSS © 17Jan-16Commerzbank German Investment Seminar 2016
Overall stable retail space allocation by gender, but increasingly leaned
towards BOSS
…but the overall allocation of retail space has
not changed significantly
However, the focus in own retail has clearly
shifted to the BOSS brand
89 88
11 12
20152014 Menswear
Womenswear
Space allocation by gender (DOS)
(September 2014 vs. September 2015 // in %)
62 69
1410
14 9
10 12
20152014
HUGO
BOSS
Shoes & Accessories
BOSS Orange
Space allocation by product category (DOS)
(September 2014 vs. September 2015 // in %)

HUGO BOSS ©
2016e
18Jan-16Commerzbank German Investment Seminar 2016
The communication focus has supported increased brand awareness
Fashion show presence and advertising support have contributed to growth of brand
awareness in womenswear
CAMPAIGNS AND EDITORIAL COVERAGE
NEW YORK FASHION SHOWS
42%58%
60%40%
Media spend relative to
overall marketing spend
(2015e)
~1/3
Budget allocation of
media spend by gender
2015e
Man
Woman
EUR 80 million
Editorial value of womenswear coverage
(YTD Sep. 2015, Source: DMR)

HUGO BOSS © 19Jan-16Commerzbank German Investment Seminar 2016
At least 75% of Group sales are to be generated through own retail by 2020
Further build the Group’s operational strength to enable key strategy implementation
Elevate the
BOSS core
brand by
engaging
consumers
emotionally
Leverage the
brand’s potential
in womenswear
and shoes &
accessories
Build
omnichannel to
drive own retail
online and offline
Exploit growth
opportunities in
underpenetrated
markets

HUGO BOSS ©
414
20Jan-16Commerzbank German Investment Seminar 2016
New openings and takeovers have contributed to past retail expansion
425 Freestanding stores
550 Shop-in-shops
130 Outlets100
38 32
15
51
2011
12
19
51
28
3249
51
52
27
16
104
19
12
1225
20
31
2012
238
2
8
206
114
3
2011
100
20132010 YTD Sep
2015
130
2014
86
4
Opening: Shop-in-shops
Takeover: Shop-in-shops
Opening: Outlets
Takeover: Freestanding stores
Opening: Freestanding stores
Retail store expansion by format and type
16
14

HUGO BOSS © 21Jan-16Commerzbank German Investment Seminar 2016
Future store openings will focus on key metropolitan areas
BOSS store
London // Regent Street
Opening date: December 2015
BOSS store
Milan // Galleria Vittorio Emanuele II
Opening date: 2017
BOSS store
New York City // World Trade Center
Opening date: Summer 2016

HUGO BOSS © 22Jan-16Commerzbank German Investment Seminar 2016
Existing store network will be upgraded and optimized
■ Potential to open between 10 and 15 new stores
per annumFreestanding store
network
Renovations
Shop-in-shop network
Franchise store
takeovers
■ More than 100 renovations per annum, accounting for at
least half of retail investment budget
■ Selective additional takeovers in department stores
■ Ongoing consolidation of existing network
■ Focus on smaller bolt-on acquisitions
■ Takeovers in Russia and Malaysia planned in 2016

HUGO BOSS © 23Jan-16Commerzbank German Investment Seminar 2016
The importance of digital retailing continues to rise
Online penetration of luxury goods
industry (in %)
Source: “Digital inside: Get wired for the ultimate luxury experience”,
McKinsey&Company, July 2015
Online penetration of global apparel and
footwear industry
(in %)
2010
4.5
2009
4.0
2013
8.3
2012
6.8
2011
5.5
2014
10.1
Source: Euromonitor
24%
7.5
3.6
Affordable
8.5
Aspirational Absolute
Ready
to wear
7.27.2
Accessories
6.4
Watches and
jewelleries
4.1
Beauty
By price points
By categories

HUGO BOSS © 24Jan-16Commerzbank German Investment Seminar 2016
The Group has built a strong online business across own retail and
wholesale
>EUR 100 millionOnline sales with HUGO BOSS products
generated by wholesale partners in 2014
(at retail value)
■ Frontend insourcing and relaunch
of hugoboss.com in 2014 has
supported pick-up of growth in
2015
■ Continued double-digit sales
increases expected
■ Account-specific approach to
distribution based on brand
environment
■ Strong interest in expanding
direct brand control via online
concessions
6862
49
33
20
8
2013 2015e201420122010 2011
>80
2009
Development of online sales
(in EUR million)

HUGO BOSS © 25Jan-16Commerzbank German Investment Seminar 2016
Physical and digital retailing are growing together
In-store sales influenced by digital
Source: “Navigating the new digital divide 2015”, Deloitte Digital, 2015
HUGO BOSS customers researching online
before purchase
Source: HUGO BOSS Customer Survey 2015, n = 15,003
24%
73%
Digital influence
projection
20132009 2010 2011 2012
10%
20%
30%
40%
50%
60%
70%
80%
90%
100%
2014 2015 2016 2017 2018 2019 2020
14%
49%
36%
64%

HUGO BOSS © 26Jan-16Commerzbank German Investment Seminar 2016
Omnichannel is going to break the barriers between online and offline
Omnichannel will become increasingly important driver of retail sales growth online
and offline
An accretive effect on the Group’s margin development is expected after the investment
phase in 2015 and 2016
2015 2016 2017
August 2015:
Start of
my HUGO BOSS rollout
November 2015:
Launch of omnichannel
pilot in the US
Early 2016:
Start of CRM system
upgrade and MOCCA
rollout
Early summer 2016:
Insourcing of online
fulfillment
Q4 2016:
Launch of first omnichannel
services (click & collect, order from
store, convenient returns)
2017 and beyond:
Continuous expansion of
omnichannel services and their
regional coverage

HUGO BOSS © 27Jan-16Commerzbank German Investment Seminar 2016
Underpenetrated markets are a source of long-term growth
Further build the Group’s operational strength to enable key strategy implementation
Elevate the
BOSS core
brand by
engaging
consumers
emotionally
Leverage the
brand’s potential
in womenswear
and shoes &
accessories
Build
omnichannel to
drive own retail
online and offline
Exploit growth
opportunities in
underpenetrated
markets

HUGO BOSS ©
HUGO BOSS Europe sales development 2015
(in EUR million // fx-adj. change)
28Jan-16Commerzbank German Investment Seminar 2016
Confident outlook for region Europe
■ Good growth despite mixed market
environment
■ Continued transition to retail model
business model builds on
achievements in all areas of retail
management
■ Successful completion of category
migration process supports uplift of
BOSS brand perception at wholesale 20142013
1,378
1,5671,457
20122009
1,041
2010 2011
1,245
1,073
HUGO BOSS Europe sales development 2009-2014
(in EUR million)
1,185
9M 2014 9M 2015
1,253
+5%
480458
Q3 2014 Q3 2015
+4%
HUGO BOSS © 29Jan-16Commerzbank German Investment Seminar 2016
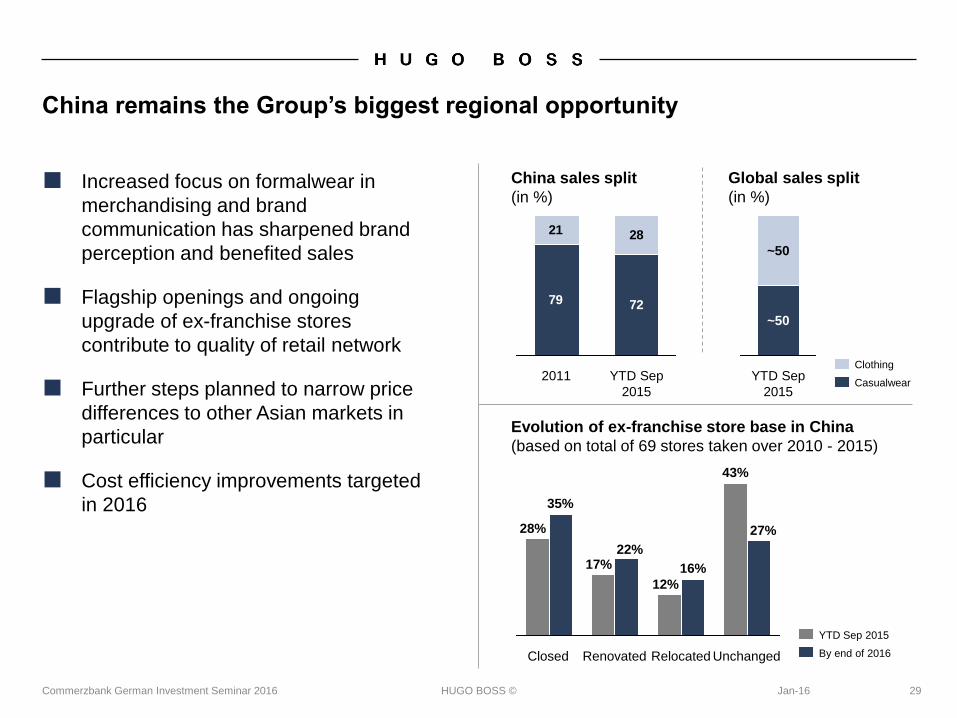
China remains the Group’s biggest regional opportunity
■ Increased focus on formalwear in
merchandising and brand
communication has sharpened brand
perception and benefited sales
■ Flagship openings and ongoing
upgrade of ex-franchise stores
contribute to quality of retail network
■ Further steps planned to narrow price
differences to other Asian markets in
particular
■ Cost efficiency improvements targeted
in 2016
79 72
21 28
2011 YTD Sep
2015
Clothing
Casualwear
China sales split
(in %)
Evolution of ex-franchise store base in China
(based on total of 69 stores taken over 2010 - 2015)
27%
Renovated
16%
Relocated
12%
Closed
35%
28%
17%
43%
Unchanged
22%
YTD Sep 2015
By end of 2016
Global sales split
(in %)
~50
~50
YTD Sep
2015

HUGO BOSS © 30Jan-16Commerzbank German Investment Seminar 2016
The Chinese luxury apparel market is once more set to suffer a double-
digit decline also in 2015
■ Economic slowdown and stock market
turbulence impacts local demand
■ Hong Kong market undergoing
structural change
■ Robust sales growth with Chinese
tourists in other Asian markets and
Europe
215211211
20132012 2014
HUGO BOSS China sales development 2012-2014
(in EUR million // fx-adj. change)
+4% +2%+2%
(6)%
149
9M 2014 9M 2015
170
4750
(20)%
Q3 2014 Q3 2015
HUGO BOSS China sales development 2015
(in EUR million // fx-adj. change)
Chinese men’s luxury apparel market (retail sales)
(change in %)
12
2013 20142012
(1)
(10)
Source: Bain
HUGO BOSS © 31Jan-16Commerzbank German Investment Seminar 2016
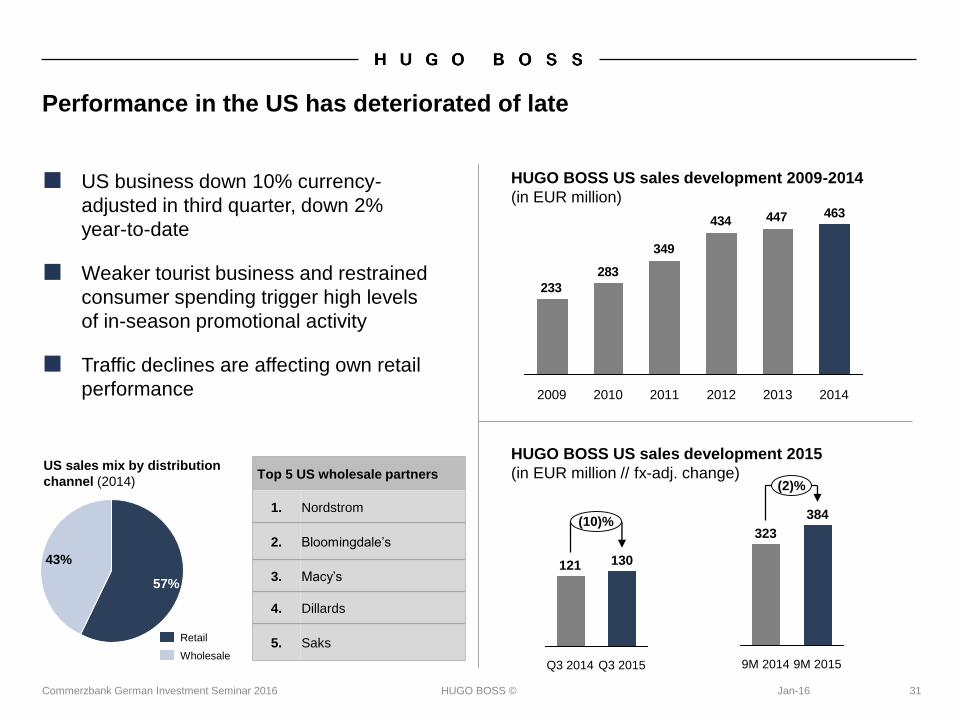
Performance in the US has deteriorated of late
■ US business down 10% currency-
adjusted in third quarter, down 2%
year-to-date
■ Weaker tourist business and restrained
consumer spending trigger high levels
of in-season promotional activity
■ Traffic declines are affecting own retail
performance
463447434
349
283
233
20132012 2014201120102009
HUGO BOSS US sales development 2009-2014
(in EUR million)
9M 2015
384
(2)%
323
9M 2014
121
(10)%
Q3 2014
130
Q3 2015
HUGO BOSS US sales development 2015
(in EUR million // fx-adj. change)Top 5 US wholesale partners
1. Nordstrom
2. Bloomingdale’s
3. Macy’s
4. Dillards
5. Saks
43%
57%
US sales mix by distribution
channel (2014)
Wholesale
Retail

HUGO BOSS © 32Jan-16Commerzbank German Investment Seminar 2016
HUGO BOSS is seeking to elevate the quality of its brand presentation in
US wholesale
■ Upgrade of store
concepts
■ Optimization of
merchandising
assortment
■ Improvement of service
quality
Group willing to accept short-term negative sales impact in order to drive full-price sell-
through and support brand equity
Strong interest in
assuming direct control
of HUGO BOSS shop-
in-shops at department
store partners
Category migration
strategy to be
implemented in 2016
Reduction of off-price
business
■ Brand presence in
wholesale off-price
channels to be further
limited
■ Own outlets primary
channel to clear excess
merchandise
■ Distribution of BOSS
core brand to be limited
to shop-in-shops
■ HUGO and BOSS Green
to substitute BOSS core
brand offering in
category spaces

HUGO BOSS © 33Jan-16Commerzbank German Investment Seminar 2016
Initiatives are under way to strengthen US retail execution and operations
Customer focus■ Key customer activation activities and intensified retail
trainings to support traffic and conversion
Retail front-end■ New cash desk solution implemented, rollout of CRM
system upgrade in early 2016
Omnichannel■ First Click & Collect pilots off to a promising start
Logistics■ Comprehensive overhaul of technical and IT
infrastructure at Savannah distribution center ongoing
Merchandise planning
■ Newly implemented Retail Merchandise Planning system
adjusts key planning and buying processes to Group-
wide standards

HUGO BOSS © 34Jan-16Commerzbank German Investment Seminar 2016
Agenda
Omnichannel strategy
Group strategy update
Financial outlook and summary

HUGO BOSS ©
Development of online sales(in EUR million // fx-adj. change)
35Jan-16Commerzbank German Investment Seminar 2016
What we achieved: Website upgrade has driven sales
■ Online frontend insourced in early 2014
■ Website relaunch in autumn 2014 has
enhanced emotional appeal of commercial
platform
■ Strong traffic increase has supported
significant online sales growth acceleration
in 2015
6862
49
33
20
8
201420132012201120102009
+10%
60
48
9M 20159M 2014
+22%
Online sales development 2015(in EUR million // fx-adj. change)

HUGO BOSS © 36Jan-16Commerzbank German Investment Seminar 2016
The brand website is the key digital channel comes close behind the
physical stores
72
31
36
42
48
53
67
Call center
Social media
Mobile app/mobile web
Site
In-store technology
Traditional store experience
Omnichannel retail: Importance of selected digital channels when making a purchase(June 2014 // in %)
Source: “Digital Shopper Relevancy Report 2014”, Capgemini, September 2014

HUGO BOSS © 37Jan-16Commerzbank German Investment Seminar 2016
Strong lineup of topics creates storytelling website content
#1 GREAT PRODUCTSFASCINATING
SPONSORSHIPS#2
#3UNMISTAKABLE
BRAND DNA #4UNIQUE ADVISORY
COMPETENCE

HUGO BOSS © 38Jan-16Commerzbank German Investment Seminar 2016
Hub pages are key elements of future hugoboss.com website
EMOTION COMMERCE
Topic-specific
HUB PAGES will connect
EMOTION and
COMMERCE,
integrating editorial content, advisory elements and access to store.

HUGO BOSS © 39Jan-16Commerzbank German Investment Seminar 2016
Hub pages are starting point of customers’ on-site journey

HUGO BOSS ©
Hub page structure adapts dynamically to profile of visiting customer
40Jan-16Commerzbank German Investment Seminar 2016
Unrecognized customer
seeking advice
Recognized customer (through
IP, cookie or registration) seeking
inspiration
Profile Content
Profile
Content
Profile
Content
A
?
B C D
READ
APPOINT-
MENT BUY
READ
H U B P A G E
Local
Content
HUGO BOSS ©
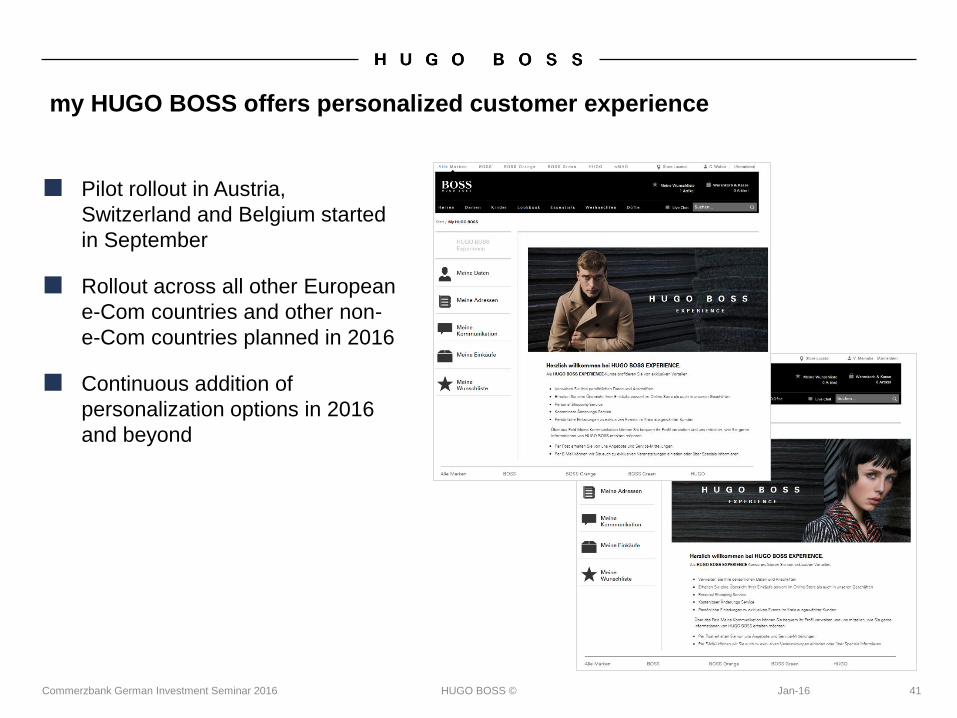
my HUGO BOSS offers personalized customer experience
41Jan-16Commerzbank German Investment Seminar 2016
■ Pilot rollout in Austria,
Switzerland and Belgium started
in September
■ Rollout across all other European
e-Com countries and other non-
e-Com countries planned in 2016
■ Continuous addition of
personalization options in 2016
and beyond

HUGO BOSS © 42Jan-16Commerzbank German Investment Seminar 2016
All digital marketing activities drive traffic to hugoboss.com
“NOLINE” NET SALES
hugoboss.com
Search Engine
Advertisement
(SEA)
Display Online
BannerE-Mail
Affiliate /
PublisherSocial Media
Search Engine
Optimization
(SEO)
Advertising

HUGO BOSS © 43Jan-16Commerzbank German Investment Seminar 2016
hugoboss.com scores high on convenience and usability
Customer facing Infrastructure
Cross-Device
Excellence
Omnichannel
Service
Features /
Usability
Live chat
PayPal /
PayPal
Express
Back-in-
stock
notification
Search as
you type
Shoppable,
premium
lookbooks
Cross-seller,
similar
products &
related
categories
Brand
grouping to
support
differentiation
Mobile store
Tablet
optimization
‘Find in
store’
Fully
responsive
store
locator my HUGO
BOSSQuick-shop
functionality
available all
over the
store

HUGO BOSS © 44Jan-16Commerzbank German Investment Seminar 2016
The role of hugoboss.com is changing
Upgrades across all four
dimensions elevate hugoboss.com
to state-of-the-art center of all
digital activity at HUGO BOSS
CONVENIENCEADVISORY
CONTENTPERSONALI-
ZATION
Digital reset focus areas
hugoboss.com is changing from a pure distribution channel into a source of inspiration,
engagement and advice, driving customers to buy online and, even more so, offline
HUGO BOSS © 46Jan-16Commerzbank German Investment Seminar 2016
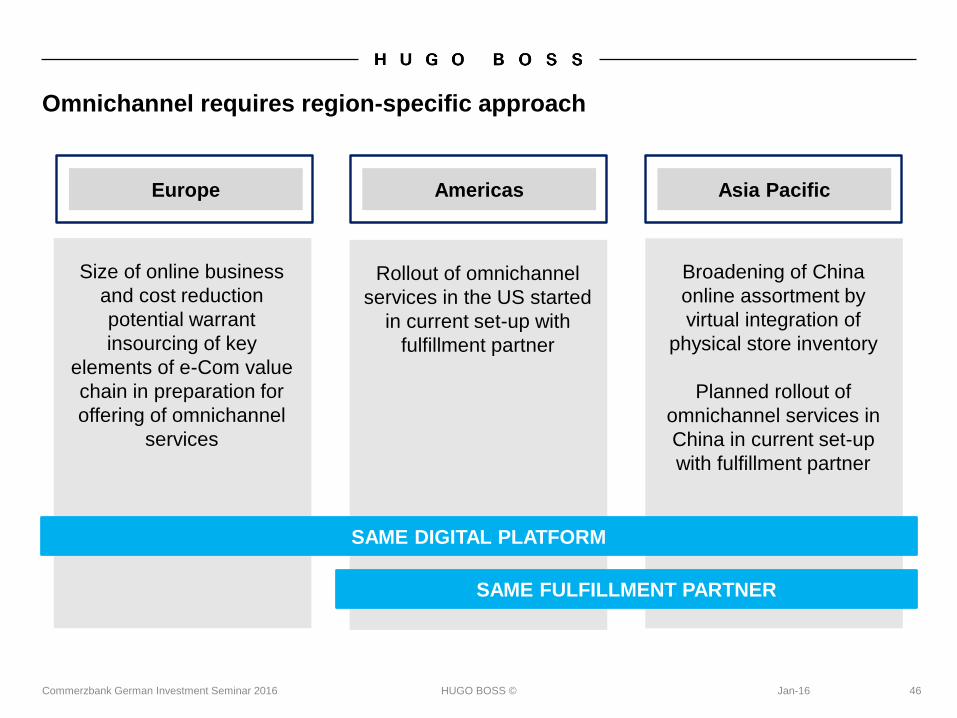
Omnichannel requires region-specific approach
Europe Americas Asia Pacific
Broadening of China
online assortment by
virtual integration of
physical store inventory
Planned rollout of
omnichannel services in
China in current set-up
with fulfillment partner
SAME DIGITAL PLATFORM
SAME FULFILLMENT PARTNER
Size of online business
and cost reduction
potential warrant
insourcing of key
elements of e-Com value
chain in preparation for
offering of omnichannel
services
Rollout of omnichannel
services in the US started
in current set-up with
fulfillment partner

HUGO BOSS © 48Jan-16Commerzbank German Investment Seminar 2016
Insourcing of online fulfillment will enhance service levels and lower costs
Current status
(fulfillment outsourced)
New set-up
(fulfillment insourced)
Costs
Service
Returns
Processes
Sales-based service fee Lower handling costs per unit and
full transparency
Cut-off at 3:30 pm
Varying service levels, delivery
times can be > 2 days
Cut-off at 6:00 pm
High service levels
Return handling and product refurbish-
ment across all channels
Efficient processing of return credit memos
€
One-by-one handling without
synergies
Backlogs in customer returns
Process setup not
HUGO BOSS-specific
Tailor-made processes meeting
the premium requirements of
HUGO BOSS

HUGO BOSS © 51Jan-16Commerzbank German Investment Seminar 2016
The impact of omnichannel on physical retailing
OMNICHANNEL
RETAIL
EXECUTION
Digital store locator
‘Find in store’ tool
(in-store inventory
availability)
Ship from store
Click and reserve
Same day delivery
Smart merchandise
Mobile in-store
check-outs
Digital receipts
Online in-store
appointment
Order from store
Click & collect
Convenient returns
Next-generation
POS system
Free in-store WIFI
Integrated CRM
2015 and before 2016 2017 and beyond

HUGO BOSS © 48Jan-16Commerzbank German Investment Seminar 2016
Agenda
Omnichannel strategy
Group strategy update
Financial outlook and summary

HUGO BOSS © 49Jan-16Commerzbank German Investment Seminar 2016
Group forecasts solid sales and profit growth in 2015
Outlook 2015
Sales growth (currency-adjusted)* 3% - 5%
Growth of
EBITDA before special items3% - 5%
Capex EUR 220 million – EUR 240 million
Own retail network Around 65 openings (excl. takeovers)
* based on the assumption of stable to positive currency-adjusted retail comp store sales
development in the fourth quarter.

HUGO BOSS © 50Jan-16Commerzbank German Investment Seminar 2016
Every element of Group strategy is set to contribute to long-term growth…
Condensed brand purpose to drive perception and desirability
Clearer brand differentiation to support brand elevation
Investment in womenswear warranted to build business for long term
Own retail strategy well balanced between expansion and productivity maximization
Omnichannel to step-change customer experience at HUGO BOSS
Implementation of initiatives to reignite growth in the Americas in full swing
Solid foundation for long-term growth built in China

HUGO BOSS © 51Jan-16Commerzbank German Investment Seminar 2016
…but challenges in key markets and investments will weigh on financial
performance in 2016
■ Group sales improvement in 2016 is
forecasted to remain below long-term target
level of high-single-digit growth as a result
of ongoing challenges in China and the US
■ Investments in omnichannel and retail
business model transformation will equip
Group to turn industry changes into
opportunities
■ Lower capex and further improvement of
working capital management will contribute
to free cash flow increase in 2016
■ Strong commitment to maintaining attractive
dividend payout policy remains

HUGO BOSS © 52Jan-16Commerzbank German Investment Seminar 2016
Investment in the key strategy pillars will support medium-term growth
■ Rapid change in operating environment
highlights the need to further invest in
transformation to customer-centric business
model
■ Solid progress in key strategy areas
overshadowed by ongoing challenges in
China and the US
■ Achievement of 2020 EBITDA margin target
of 25% has become increasingly dependent
on overall market recovery

HUGO BOSS © 53Jan-16Commerzbank German Investment Seminar 2016
BACKUP
HUGO BOSS © 54Jan-16Commerzbank German Investment Seminar 2016
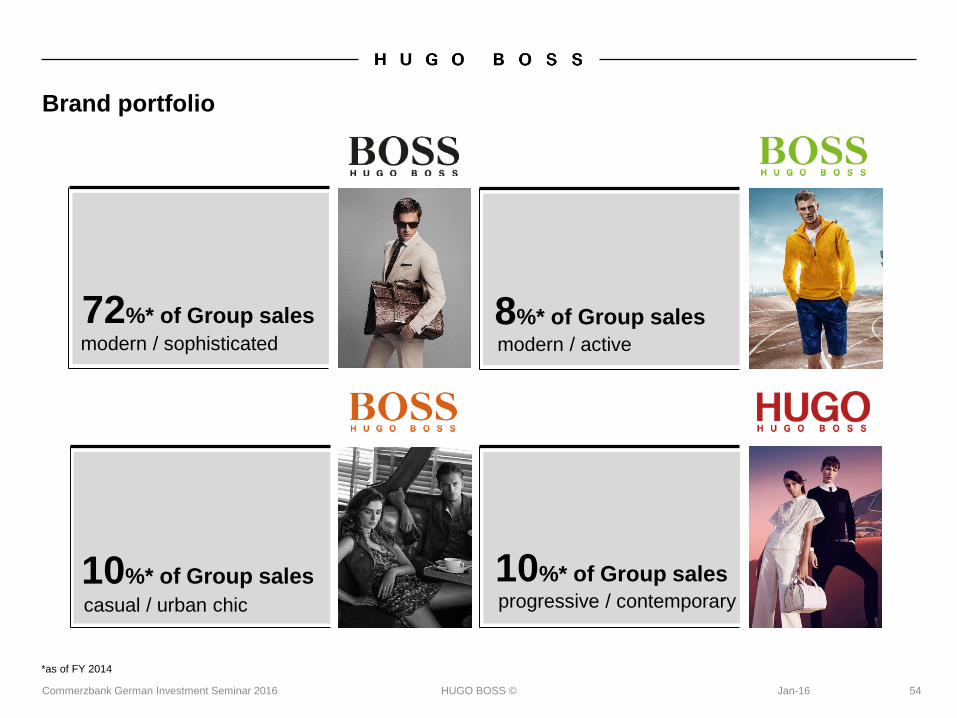
Brand portfolio
72%* of Group sales 8%* of Group sales
10%* of Group sales10%* of Group sales
modern / sophisticated
progressive / contemporary
modern / active
casual / urban chic
*as of FY 2014

HUGO BOSS © 55Jan-16Commerzbank German Investment Seminar 2016
Sales by region 2014
*+2% Licenses
61%Germany: 17% (of Group Sales)
Great Britain: 10%
France: 7%
Benelux: 6%
Other: 21%
Europe(incl. Middle East/Africa)
Americas Asia/Pacific
23%U.S.: 18%
Canada: 3%
Central &
South America: 2%
Share of Group sales*
14%China: 8%
Oceania: 2%
Japan: 1%
Other: 3%

HUGO BOSS © 56Jan-16Commerzbank German Investment Seminar 2016
Sales by distribution channel
Wholesale
Retail
Licenses
64%
3%
2009
33%
2011
2%
45%
53%
2012
49%
49%
2% 2%
2013
44%
54%
2010
40%
3%
57%
2%
57%
2014
41%
Retail to account for at least 75% of Group sales by 2020

HUGO BOSS ©
*Source: TextilWirtschaft, based on TW-Testclub Panel
**Source: Bain & Company, 2014 China Luxury Market Study
***Source: Hong Kong Census and Statistics Department
57Jan-16Commerzbank German Investment Seminar 2016
Key market data
German apparel
marketRetail sales growth
(in %)*
Chinese men’s luxury
apparel market Retail sales growth
(in %)**
Hong Kong Clothing &
Footwear marketRetail sales growth
(in %)***
12
(10)
2013 20142012
(1)
10
(12)
Aug ’15 Sep ’15
(11)
Oct ’15
(5)(4)
Nov ’14
(3)
(11)
Jul ’15Jun ’15
(4)
May ’15
(3)
Apr ’15
(5)
Mar ’15
(3)
Feb ’15Jan ’15
(14)
Dec ’14
118430
Dec ’14
(4) (3)
Jan ’15
(7)
Feb ’15 Mar ’15
(16)
Nov ’14
(9)
Aug ’15 Oct ’15Sep ’15Apr ’15
(4) (5)
Jun ’15May ’15 Jul ’15

HUGO BOSS ©
Sales growth by region, y-o-yQ3 2015
(in %)
58Jan-16Commerzbank German Investment Seminar 2016
Sales by region
Sales growth by region, y-o-y9M 2015
(in %)
4
5
5
4
(8) 80 4(12) (4)
Europe*
(1)Group
Americas
(12)
(7)
(3)Asia/Pacific
fx-adjusted
in EUR
9
12
17
6
3
5
12 164(4) 2080
Group
Asia/Pacific(2)
Europe*
Americas(1)
fx-adjusted
in EUR
■ Growth remains strong across almost all markets in Europe in the third quarter
■ Positive developments in smaller countries in the Americas offset by 10% currency-adjusted
sales decline in the US in Q3
■ Further deterioration of sales trends in China and HK drag down performance of Asia/Pacific*Incl. Middle East and Africa

HUGO BOSS ©
Sales growth by channel, y-o-yQ3 2015
(in %)
59Jan-16Commerzbank German Investment Seminar 2016
Sales by channel
■ Flat retail comp store sales in Q3 caused by negative developments in the US and China
■ Wholesale affected by takeover-related shifts and weak replenishment business in the US
■ Strong development of watches and eyewear continues to drive growth of license business
Sales growth by channel, y-o-y9M 2015
(in %)
4
1
12
1
6
10 150(5) 5(10)
Licenses
Retail
(4)Wholesale
(1)Group
(7)
fx-adjusted
in EUR
9
7
0
16
3
7
8
0 20(5) 5 10 15
Retail
Licenses
Wholesale(4)
Group
fx-adjusted
in EUR

HUGO BOSS © 60Jan-16Commerzbank German Investment Seminar 2016
Income statement
*Basic and diluted earnings per share
in EUR million
Q3 2015 Q3 2014 Change in % 9M 2015 9M 2014 Change in %
Sales 744.1 716.5 4 2,058.7 1,888.0 9
Cost of sales (264.4) (257.3) (3) (711.7) (655.2) (9)
Gross profit 479.7 459.2 4 1,347.0 1,232.8 9
In % of sales 64.5 64.1 40 bp 65.4 65.3 10 bp
Selling and distribution expenses (280.6) (245.5) (14) (812.9) (705.9) (15)
Administration expenses (62.8) (59.1) (6) (200.7) (179.9) (12)
Other operating income and expenses (3.7) (2.6) (41) (3.6) (3.4) (4)
Operat ing result (EBIT) 132.6 152.0 (13) 329.8 343.6 (4)
In % of sales 17.8 21.2 (340) bp 16.0 18.2 (220) bp
Net interest income/expense (1.4) (1.4) 0 (5.2) (3.3) (58)
Other financial items (16.3) (1.6) <(100) (19.8) (3.7) <(100)
Financial result (17.7) (3.0) <(100) (25.0) (7.0) <(100)
Earnings before taxes 114.9 149.0 (23) 304.8 336.6 (9)
Income taxes (26.4) (34.3) (23) (70.1) (77.4) 9
Net income 88.5 114.7 (23) 234.7 259.2 (9)
Attributable to:
Equity holders of the parent company 88.5 114.7 (23) 234.6 258.0 (9)
Non-controlling interests 0 0 0.1 1.2 (92)
Earnings per share (EUR)* 1.28 1.67 (23) 3.40 3.74 (9)
EBITDA before special items 168.1 181.9 (8) 422.9 423.4 0
In % of sales 22.6 25.4 (280) bp 20.5 22.4 (190) bp
Special items (3.7) (2.6) (41) (3.6) (3.4) (4)

HUGO BOSS © 61Jan-16Commerzbank German Investment Seminar 2016
Segmental reporting
■ Currency effects cause margin decline in Europe
■ Positive currency translation effects offset underlying gross margin pressure in the Americas
■ Deteriorating sales trends, takeovers and higher selling and distribution expenses impact
margins in Asia/Pacific
*Incl. Middle East and Africa
Segment profitin EUR million
9M 2015 In % of sales 9M 2014 In % of sales Change in %
Europe* 403.9 32.2 415.8 35.1 (3)
Americas 130.1 27.1 98.4 23.9 32
Asia/Pacific 70.3 24.8 72.9 28.9 (4)
Licenses 34.6 81.7 33.1 83.5 4
Segment profit operat ing segments 638.9 31.0 620.2 32.8 3
Corporate units/ consolidat ion (216.0) (196.8) (10)
EBITDA before special items 422.9 20.5 423.4 22.4 0

HUGO BOSS © 62Jan-16Commerzbank German Investment Seminar 2016
Trade net working capital and inventory development
-5
0
5
10
15
20
3
Q2 2015
54
Q1 2015
9
12
Q4 2014
98
Q3 2014
19
Q3 2015
(4)
1615
Q2 2014
1313
Q1 2014
10
Inventories
Trade Net Working Capital
Currency-adjusted inventory and working capital growth, y-o-y(in %)
HUGO BOSS © 63Jan-16Commerzbank German Investment Seminar 2016
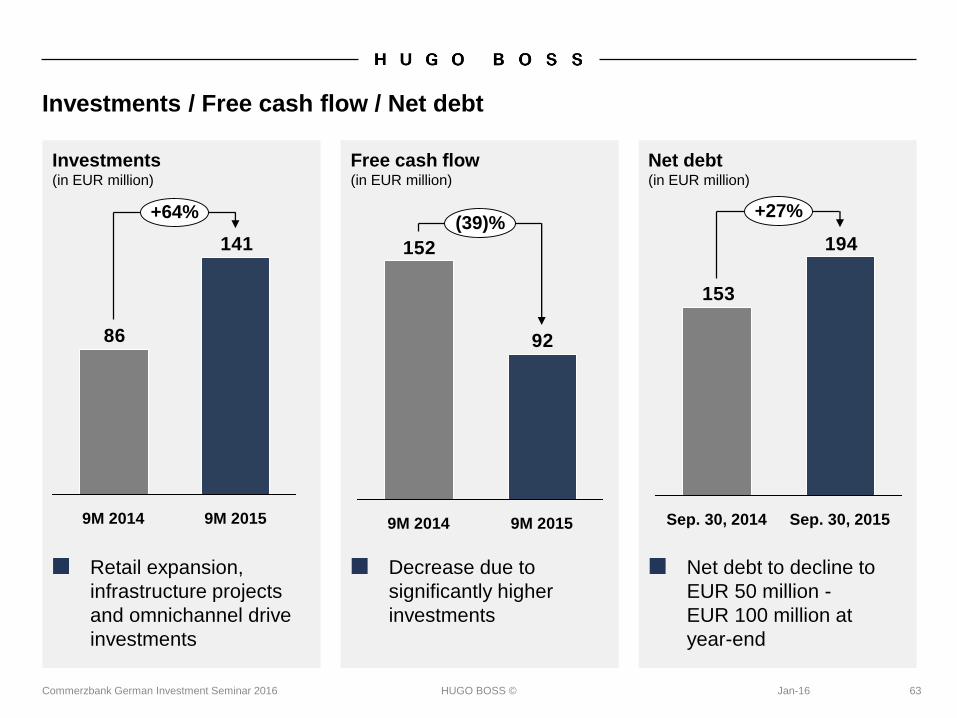
Investments / Free cash flow / Net debt
■ Retail expansion,
infrastructure projects
and omnichannel drive
investments
■ Net debt to decline to
EUR 50 million -
EUR 100 million at
year-end
141
86
9M 2014 9M 2015
+64%
194
153
+27%
Sep. 30, 2015Sep. 30, 2014
92
152
(39)%
9M 20159M 2014
■ Decrease due to
significantly higher
investments
Investments(in EUR million)
Free cash flow(in EUR million)
Net debt(in EUR million)

HUGO BOSS © 64Jan-16Commerzbank German Investment Seminar 2016
Multi-Year overview
in EUR million 2014 2013 2012 2011 2010 2009Earnings PositionSales 2,571.6 2,432.1 2,345.9 2,058.8 1,729.4 1,561.9Gross profit 1,699.1 1,579.6 1,444.1 1,252.0 1,022.4 836.2EBITDA 571.5 561.4 523.9 468.0 340.1 226.5EBITDA before special items 590.8 564.7 528.1 469.5 353.7 269.2EBIT 448.7 456.2 432.0 394.6 267.9 157.4Net income attributable to equity holders of the parent company 333.3 329.0 306.5 284.9 188.9 105.5Financial Position and DividendFree cash flow 268.4 230.0 220.6 194.9 246.3 299.5Net debt 35.7 57.0 130.4 149.1 201.1 379.1Capital expenditures 134.7 185.3 165.8 108.5 55.6 48.3Depreciation/amortization 122.8 105.3 91.9 73.4 72.2 69.1Dividend 249.8 230.5 215.3 199.1 139.7 66.6Asset and Liability StructureTotal assets 1,661.8 1,501.3 1,577.2 1,419.6 1,342.8 1,065.4Shareholders' equity 843.9 740.3 631.6 517.3 361.2 205.5Trade net working capital 503.0 431.8 408.5 399.6 322.7 295.6Non-current assets 660.3 611.5 587.7 503.2 454.5 435.0Key RatiosGross profit margin in % 66.1 64.9 61.6 60.8 59.1 53.5Adjusted EBITDA margin in %* 23.0 23.2 22.5 22.8 20.5 17.2Total leverage** 0.1 0.1 0.2 0.3 0.6 1.4Equity ratio in % 50.8 49.3 40.0 36.4 26.9 19.3
*EBITDA before special items/Sales
**Net financial liabilities/EBITDA before special items

HUGO BOSS © 65Jan-16Commerzbank German Investment Seminar 2016
Retail comp stores sales growth
Sales growth retail l-f-l*
0
2
4
6
8
Q1
2014
Q2
2013
FY
2013
3%
6%
2%
Q3
2013
Q4
2013
Q1
2013
4%
4%
2%2%
5%
4%
Q3
2012
Q4
2012
FY
2012
Q2
2012
2%
0%
6%
Q3
2015
Q2
2015
0%
FY
2014
3%
Q3
2014
Q4
2014
4%
Q1
2015
Q2
2014
3%
4%
Retail l-f-l
*fx-adjusted
HUGO BOSS © 66Commerzbank German Investment Seminar 2016
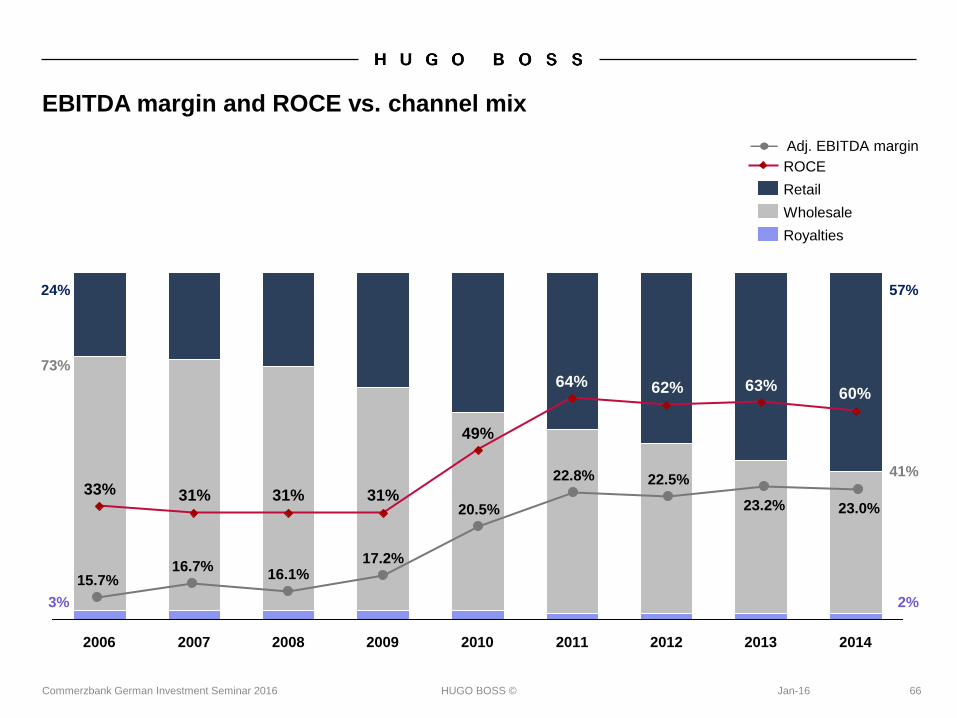
EBITDA margin and ROCE vs. channel mix
49%
31%31%31%33%
60%63%62%64%
2012201120102009200820072006 20142013
ROCE
Wholesale
Royalties
Retail
24%
73%
41%
Adj. EBITDA margin
3% 2%
22.5%
17.2%16.1%
22.8%
20.5% 23.2%
16.7%
23.0%
15.7%
57%
Jan-16

HUGO BOSS © 67Jan-16Commerzbank German Investment Seminar 2016
Trade net working capital in relation to sales
Average trade net working capital as a
percentage of sales by quarter*(in %)
0
2
4
6
8
10
12
14
16
18
20
22
19.8
Q3 2012
18.619.7
Q4 2012
+110 bp
Q1 2015
19.7
Q3 2014Q3 2013
17.9
19.8
Q2 2015Q1 2014Q1 2013
19.1
Q2 2014
20.6
Q4 2013Q2 2013
18.1
Q4 2014
17.9
20.7
18.7
Q3 2015
19.8
18.0
Q2 2012
*Certain amounts shown here do not correspond to the figures published in prior years and reflect adjustments made

HUGO BOSS © 68Jan-16Commerzbank German Investment Seminar 2016
(Adjusted) financial leverage
Operating leases = Future committed operating lease obligations capitalized according to S&P methodology
EBITDAR = EBITDA + minimum rents + contingent rents
2009 2010 2011 2012 2013 2014
2.0
0.8
1.6
2.4
1.2
0.0
0.4
1.3x
0.1x
1.2x
0.1x
1.2x
0.2x
1.3x
0.3x
1.6x
0.6x
2.2x
1.4x
Net debt / EBITDA
Net debt incl. operating leases / EBITDAR

HUGO BOSS ©
*As a percentage of net profit attributable to the shareholders of the parent company
69Jan-16Commerzbank German Investment Seminar 2016
Dividend and payout ratio
0
10
20
30
40
50
60
70
80
90
100
3.50
1.50
3.00
2.50
2.00
1.00
0.50
0.00
4.00
2014
3.62
75%
2013
3.34
70%
2012
3.12
70%
2011
2.88
70%
2010
2.02
75%
2009
0.96
64%
in EUR in %*
Dividend policy to pay out between 60% and 80% of consolidated net profit

HUGO BOSS © 70Jan-16Commerzbank German Investment Seminar 2016
Sourcing and production structure 2014*
5%
North Africa
11% Western
Europe
4%
Americas
33%
Asia
47%
Eastern Europe
80% third
party production
20% own
production
*Percentage based on value of procurement volumes

HUGO BOSS © 71Jan-16Commerzbank German Investment Seminar 2016
Retail network
Number of own retail stores as of December 31
197270 323 371 388 425
261264
413
526 531550
7988
104
113 122130
2014
1,041
2013
1,010
2012
840
2011
622
2010
537
1,105
Sep. 30, 2015
Shop-in-shops
Freestanding stores
Outlets

HUGO BOSS © 72Jan-16Commerzbank German Investment Seminar 2016
Retail network (continued)
Number of own retail stores and shop-in-shops
*Europe incl. Middle East and Africa
Sep. 30, 2015
1,041
1,105
ClosingsAsia/PacificAmericasEurope*Dec. 31, 2014
+ 50+ 23
+ 57 (66)
+ 16 UK
+ 8 France
+ 6 Spain
+ 5 Italy
+ 4 Germany
+ 4 Russia
+ 2 Denmark
+ 2 Greece
+ 1 Belgium
+ 1 Poland
+ 1 Turkey
+ 14 Mexico
+ 4 Canada
+ 3 Brazil
+ 2 USA
+ 29 China
+ 25 Korea
+ 1 Australia
+ 1 Japan
+ 1 New Zealand

HUGO BOSS © 73Jan-16Commerzbank German Investment Seminar 2016
HUGO BOSS share
Key Share Data
ISIN DE000A1PHFF7
WKN A1PHFF
Ticker Symbol BOSS
Stock exchanges: Xetra, Frankfurt/Main, Stuttgart, Dusseldorf, Hamburg, Munich, Hanover, Berlin/Bremen

HUGO BOSS © 74Jan-16Commerzbank German Investment Seminar 2016
Analyst coverage
Institution Analyst
Baader Bank Volker Bosse
Bankhaus Lampe Peter Steiner
Bank of America Merrill Lynch Ashley Wallace
Barclays Julian Easthope
Bryan Garnier Cédric Rossi
Citigroup Thomas Chauvet
Commerzbank Andreas Riemann
Credit Suisse Guillaume Gauville
Deutsche Bank Warwick Okines
DZ Bank Herbert Sturm
equinet Mark Josefson
Exane BNP Paribas Luca Solca
Invest Securities Peter Farren
Goldman Sachs William Hutchings
Hauck & Aufhäuser Christian Schwenkenbecher
The HUGO BOSS AG share is covered by the following financial analysts:
Institution Analyst
HSBC Antoine Belge
Jefferies Charmaine Yap
J.P. Morgan Chiara Battistini
Kepler Cheuvreux Jürgen Kolb
LBBW Thomas Hofmann
M.M. Warburg Jörg Philipp Frey
MainFirst John Guy
Mirabaud Securities Alessandro Migliorini
Nomura Christopher Walker
Nord LB Wolfgang Vasterling
Oddo Seydler Martin Decot
RBC Claire Huff
Société Générale Thierry Cota
UBS Fred Speirs

HUGO BOSS ©
ADR Details Benefits of ADRs for U.S. investors
■ Clear and settle according to normal U.S.
standards
■ Offer the convenience of stock quotes and
dividend payments in U.S. dollars
■ Can be purchased/sold in the same way as
other U.S. stocks via a U.S. broker
■ Provide a cost-effective means of
international portfolio diversification
For questions about creating HUGO BOSS ADRs, please contact BNY Mellon:
Level I ADR program
Jan-16Commerzbank German Investment Seminar 2016 75
Market OTC
Symbol BOSSY
CUSIP 444560106
Ratio 5 : 1
Country Germany
Effective Date Jan 18, 2013
Underlying SEDOL B88MHC4
Underlying ISIN DE000A1PHFF7
Depositary BNY Mellon
New York
Rick Maehr / Ravi Davis
email: [email protected]
Tel: +1 212 815 2264
Hong Kong
Herston Powers
email: [email protected]
Tel: +852 2840 9868
London
Jacek Jankowski
email: [email protected]
Tel: +44 (0)20 7163 7427

HUGO BOSS © 76Jan-16Commerzbank German Investment Seminar 2016
Shareholder structure*
90%
Free float
2%
Own shares
8%PFC S.r.l. / Zignago Holding S.p.A. /
Tamburi Investment Partners S.p.A.
*Source: Share register, voting rights notifications (as of June 10, 2015)

HUGO BOSS © 77Jan-16Commerzbank German Investment Seminar 2016
Financial calendar 2015/2016
Date Event
Early February 2016 Preliminary Results 2015
March 10, 2016 Press and Analysts’ Conference
May 3, 2016 First Quarter Results
May 19, 2016 Annual Shareholders’ Meeting
August 5, 2016 First Half Year Results
November 4, 2016 Nine Months Results

HUGO BOSS © 78Jan-16Commerzbank German Investment Seminar 2016
Investor Relations contact
Dennis Weber, CFA
Head of Investor Relations
Phone: +49 (0) 7123 94 - 86267
E-Mail: [email protected]
Internet: group.hugoboss.com

HUGO BOSS ©
Forward looking statements contain risks
79Jan-16Commerzbank German Investment Seminar 2016
This document contains forward-looking statements that reflect management's current
views with respect to future events. The words "anticipate ", "assume ", "believe",
"estimate", "expect", "intend", "may", "plan", "project", "should", and similar expressions
identify forward-looking statements. Such statements are subject to risks and
uncertainties. If any of these or other risks and uncertainties occur, or if the assumptions
underlying any of these statements prove incorrect, then actual results may be materially
different from those expressed or implied by such statements. We do not intend or assume
any obligation to update any forward-looking statement, which speaks only as of the date
on which it is made.