Commercial Real Estate: Just How Fast is it Moving?
43
Ask the Fed ® is a program of the Federal Reserve Bank of St. Louis. Use of the presentation materials, including audio recording of a presentation, is strictly prohibited except by written permission of the Federal Reserve Bank of St. Louis. The opinions expressed in the presentations are statements of the speaker's opinion, are intended only for informational purposes, and are not formal opinions of —nor binding on— any Federal Reserve Bank or the Board of Governors of the Federal Reserve System. Each participant is responsible for its own business, financial, investment, or credit decisions. www .askthefed.org Commercial Real Estate: Just How Fast is it Moving? October 14, 2021 Brian D. Bailey, CRE, CCIM Subject Matter Expert, Commercial Real Estate and Senior Policy Advisor Federal Reserve Bank of Atlanta
Transcript of Commercial Real Estate: Just How Fast is it Moving?

Ask the Fed® is a program of the Federal Reserve Bank of St. Louis. Use of the presentation materials, including audio recording of a presentation, is strictly prohibited except by written permission of the FederalReserve Bank of St. Louis. The opinions expressed in the presentations are statements of the speaker's opinion, are intended only for informational purposes, and are not formal opinions of —nor binding on— anyFederal Reserve Bank or the Board of Governors of the Federal Reserve System. Each participant is responsible for its own business, financial, investment, or credit decisions.www.askthefed.org
Commercial Real Estate:Just How Fast is it Moving?
October 14, 2021
Brian D. Bailey, CRE, CCIMSubject Matter Expert, Commercial Real
Estate and Senior Policy AdvisorFederal Reserve Bank of Atlanta

© 2021 Federal Reserve Bank of St. Louis 2
Welcome• Call-in number: 888-625-5230 • Participant code: 663 664 18#• Webinar: https://www.webcaster4.com/Webcast/Page/584/41039• This call is being recorded and will be available immediately following the session.• A short survey will be delivered via email following the call. Please let us know your thoughts
about today and ideas for future sessions.
Logistics
• You can listen through your PC or dial in to the phone.• Remember: Your specific connection matters; if PC audio diminishes, dial in to the toll-free line.
Webinar
• Use the chat feature in the webinar (Ask Question button on bottom of screen).• Email your question to: [email protected].• Use the “Ask a Question” feature on the Ask the Fed® website: www.askthefed.org.
How We’ll Take Questions
• Ask the Fed® is a program of the Federal Reserve Bank of St. Louis. Use of the presentation materials, including audio recording of a presentation, is strictly prohibited except by written permission of the Federal Reserve Bank of St. Louis. The opinions expressed in the presentations are statements of the speaker's opinion, are intended only for informational purposes, and are not formal opinions of —nor binding on— any Federal Reserve Bank or the Board of Governors of the Federal Reserve System. Each participant is responsible for its own business, financial, investment or credit decisions.
Disclaimer

© 2021 Federal Reserve Bank of St. Louis 3
Goals of Today’s Session
• To provide an informational hour of learning so lenders and regulators can be better informed on the economy, commercial real estate (CRE), and commercial finance markets.
• Audience members should be able to recognize issues in the aforementioned topics that will help them better identify and mitigate issues in CRE and lending.

© 2021 Federal Reserve Bank of St. Louis 4
Contributions to Gross Domestic Product (GDP)
Source: BLS, HAVER Analytics
-31.2
33.8
4.56.3 6.7
-40
-30
-20
-10
0
10
20
30
40
2018 2019 2020 2021
Contributions to Real GDPquarterly, percent, seasonally adjusted annualized rate
Intellectual Property Products Government Net Exports
Nonresidential Equipment & Software Private Inventory Investment Residential Investment
Nonresidential Structures Consumer Spending Real GDP

© 2021 Federal Reserve Bank of St. Louis 5
EmploymentMonthly Job Creation by Segment
Source: BLS, HAVER Analytics
-20,679
2,833
4,846
1,7261,583716 680 264 -306 233 536 785 269 614 962 1,091 366 194
-25,000
-20,000
-15,000
-10,000
-5,000
0
5,000
10,000
Goods Producing Retail Trade Services (Information, Financial, and Other)
Wholesale Trade, Transportation, and Utilities Professional and Business Services Leisure and Hospitality
Government Education & Health Services Total Nonfarm
thousands, seasonally adjusted
Leisure & Hospitality-7.4 million jobsin April 2020
© 2021 Federal Reserve Bank of St. Louis 6
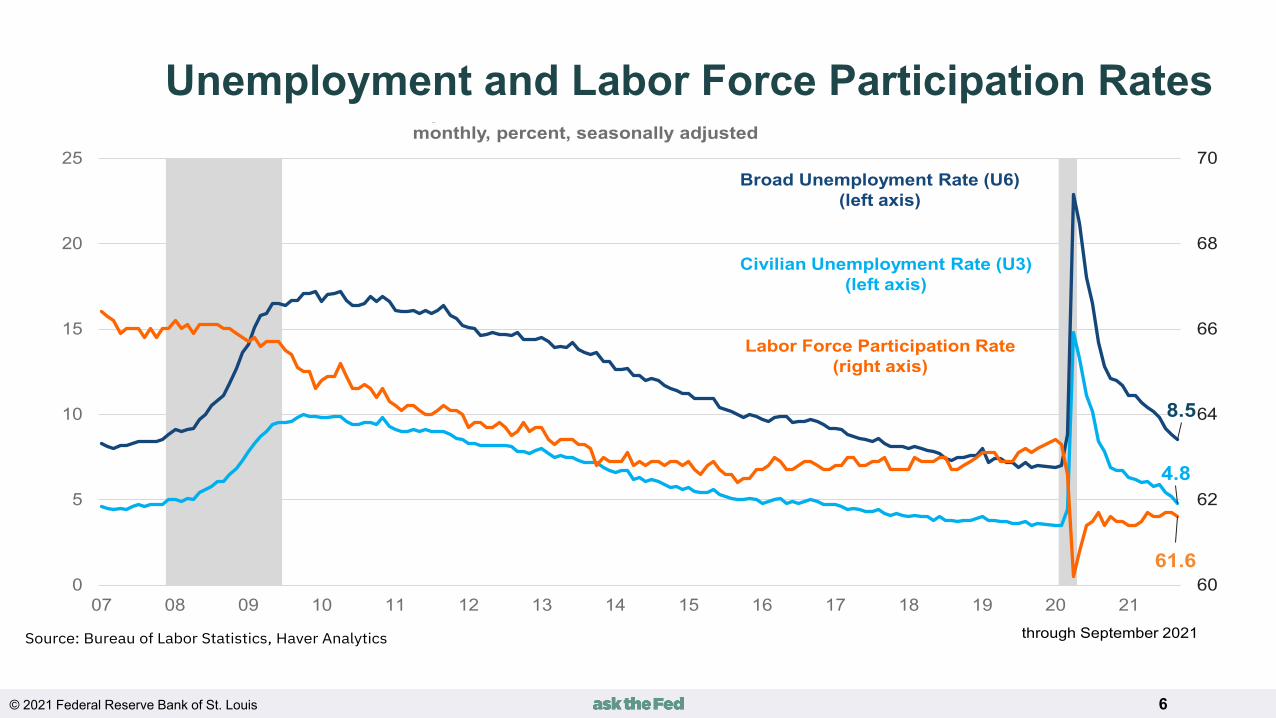
Unemployment and Labor Force Participation Rates
4.8
8.5
61.660
62
64
66
68
70
0
5
10
15
20
25
07 08 09 10 11 12 13 14 15 16 17 18 19 20 21
y monthly, percent, seasonally adjusted
through September 2021Source: Bureau of Labor Statistics, Haver Analytics
Civilian Unemployment Rate (U3)(left axis)
Broad Unemployment Rate (U6)(left axis)
Labor Force Participation Rate(right axis)

© 2021 Federal Reserve Bank of St. Louis 7
Employment Change by Skill and Gender

© 2021 Federal Reserve Bank of St. Louis 8
Change in Hospitality and Leisure Employment% of Markets, 2021 Q2
Source: CoStar

© 2021 Federal Reserve Bank of St. Louis 9
Components of InflationYear-over-Year Change in the Consumer Price Index (CPI)
Source: BLS/Risk Analysis Unit/Atlanta Fed
© 2021 Federal Reserve Bank of St. Louis 10
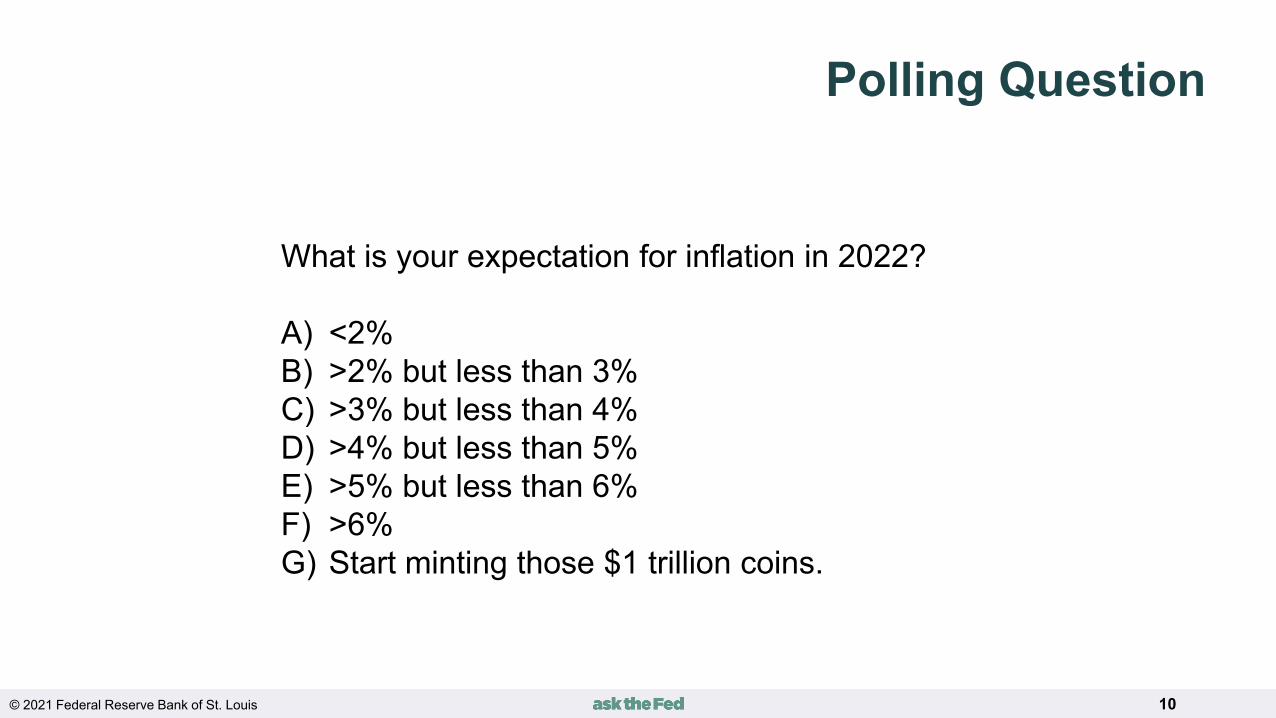
Polling Question
What is your expectation for inflation in 2022?
A) <2%B) >2% but less than 3%C) >3% but less than 4%D) >4% but less than 5%E) >5% but less than 6%F) >6%G) Start minting those $1 trillion coins.

© 2021 Federal Reserve Bank of St. Louis 11
Change in Commercial Property Price Indices
Source: Sam LaRussa, Lucy Nicholson/Reuters
Congestion Junction Supply Chain Woes Persist
• Retailers already struggling from the Covid-19 pandemic are facing greater transit times for goods that may cause them to shorten or miss the upcoming high- traffic seasonal points.
• Many container ships are anchored off U.S. ports, leading to at least an extra one to two weeks of transit time.
• Rail congestion at several critical junctures is growing and creating severe offloading bottlenecks.
• Once offloaded, due to the lack of trucks/drivers, container pickup times have grown six- to eight-fold.

© 2021 Federal Reserve Bank of St. Louis 12
Jerome Powell Chairman, Federal Reserve
“The spike in inflation is so far largely the product of a relatively narrow group of goods and services that have been directly affected by the pandemic and the reopening of the economy.”
FOMC Press Conference —September 2021
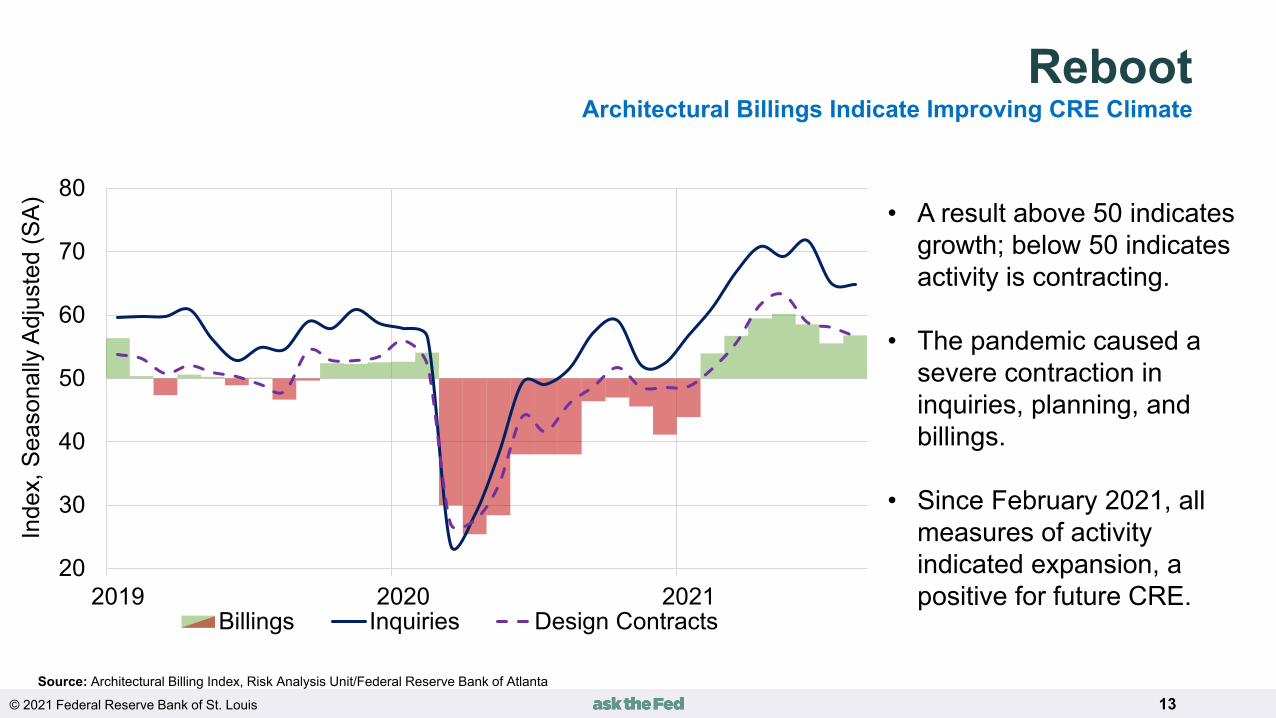
© 2021 Federal Reserve Bank of St. Louis 13Source: Architectural Billing Index, Risk Analysis Unit/Federal Reserve Bank of Atlanta
Inde
x
• A result above 50 indicates growth; below 50 indicates activity is contracting.
• The pandemic caused a severe contraction in inquiries, planning, and billings.
• Since February 2021, all measures of activity indicated expansion, a positive for future CRE.
20
30
40
50
60
70
80
2019 2020 2021
Inde
x, S
easo
nally
Adj
uste
d (S
A)
Billings Inquiries Design Contracts
Reboot Architectural Billings Indicate Improving CRE Climate

© 2021 Federal Reserve Bank of St. Louis 14
Housing StartsMonthly, Thousands Units, Seasonally Adjusted Annual Rate (SAAR)
0
200
400
600
800
1,000
1,200
1,400
1,600
1,800
2,000
2007 2008 2009 2010 2011 2012 2013 2014 2015 2016 2017 2018 2019 2020 2021
Total Starts: July 2021=1,534 Single-Family: July 2021=1,111
Sources: Census Bureau; National Bureau of Economic Research; Haver Analytics

© 2021 Federal Reserve Bank of St. Louis 15
Home Price AppreciationJuly 2021
Source: CoreLogic, Federal Reserve Bank of Atlanta
Up, Up, and Away???Home Price Appreciation (HPA), Year-over-Year % Change

© 2021 Federal Reserve Bank of St. Louis 16
Home Affordability Ownership Monitor (HOAM)Declining Affordability Is Slowing Residential
Source: REIT/FRB Atlanta

© 2021 Federal Reserve Bank of St. Louis 17
Showcases CRE trends in an easy-to-understand format on a market and historical variable basis
Covers the office, retail, multi-family and office sectors (hotels coming soon)
Encompasses 390 major, secondary, and tertiary markets in the U.S. (includes Alaska & Hawaii)
Provides clarity on CRE market momentum: Is it accelerating or decelerating? How do the current results compare to the long-
term norm?
Seeking Free CRE Information? AtlantaFed.org
https://www.atlantafed.org/center-for-housing-and-policy/data-and-tools/commercial-real-estate-momentum-index.aspx
https://www.atlantafed.org/forms/news-events/2021/10/20/registration-commercial-real-estate.aspx
CRE Momentum Index (CREMI)More Transparent, Free CRE Data
Source: Risk Analysis Unit/Federal Reserve Bank of Atlanta
© 2021 Federal Reserve Bank of St. Louis 18
RiskGrowing
RiskGrowing
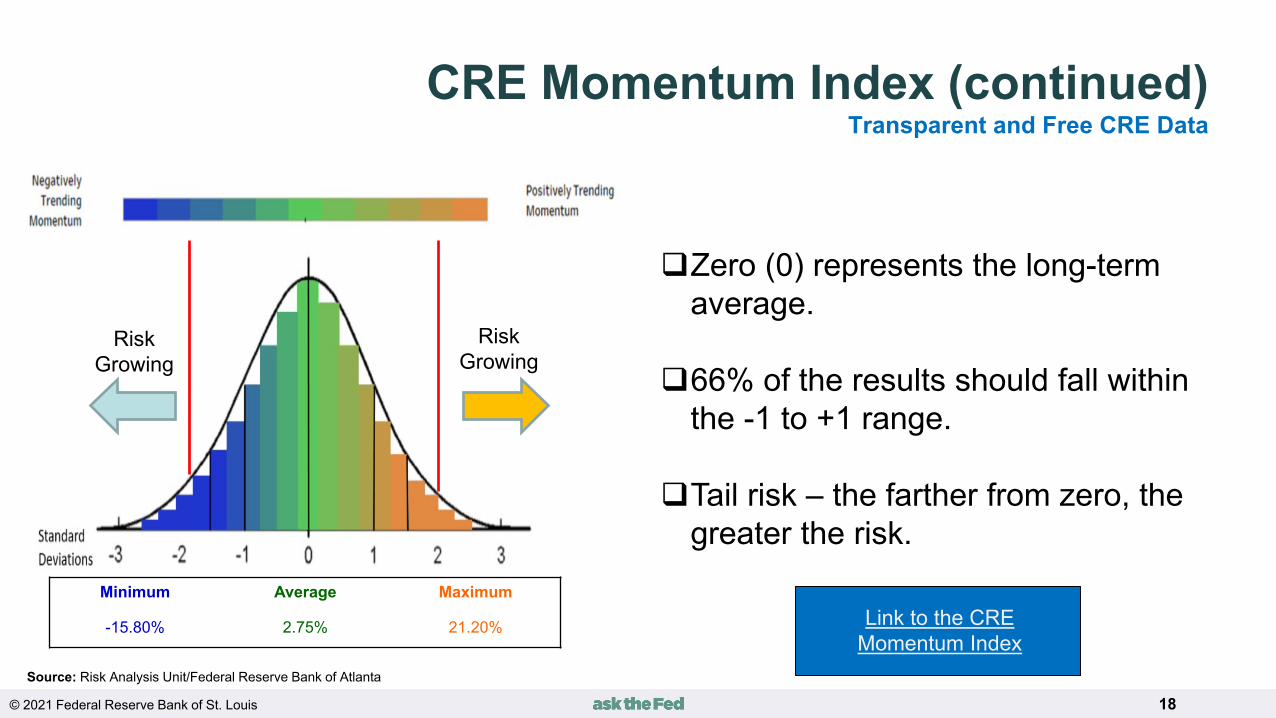
CRE Momentum Index (continued)Transparent and Free CRE Data
Zero (0) represents the long-term average.
66% of the results should fall within the -1 to +1 range.
Tail risk – the farther from zero, the greater the risk.
Source: Risk Analysis Unit/Federal Reserve Bank of Atlanta
Link to the CRE Momentum Index
Minimum Average Maximum
-15.80% 2.75% 21.20%

© 2021 Federal Reserve Bank of St. Louis 19
Multi-family Occupancy Percent, August 2021
Source: CoStar

© 2021 Federal Reserve Bank of St. Louis 20
Multi-family Occupancy (continued)Basis Point Change from Last August
Source: CoStar
© 2021 Federal Reserve Bank of St. Louis 21
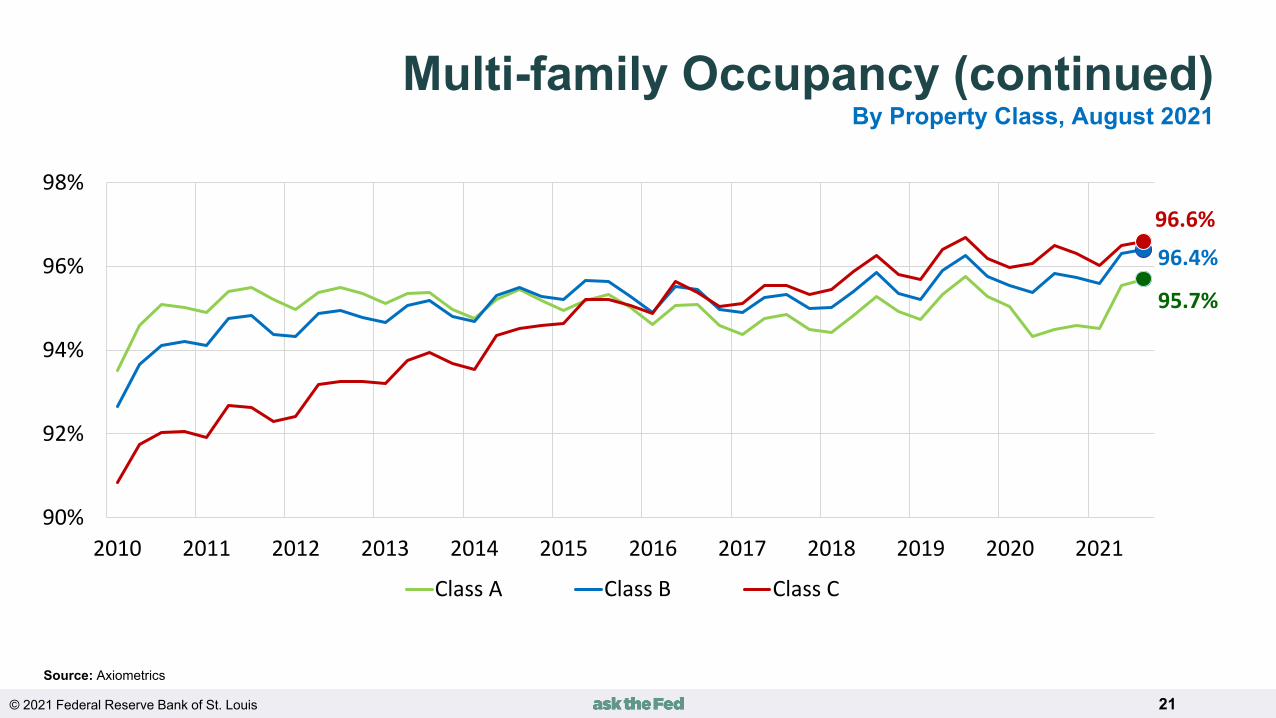
Source: Axiometrics
Multi-family Occupancy (continued)By Property Class, August 2021
95.7%
96.4%
96.6%
90%
92%
94%
96%
98%
2010 2011 2012 2013 2014 2015 2016 2017 2018 2019 2020 2021
Class A Class B Class C
© 2021 Federal Reserve Bank of St. Louis 22
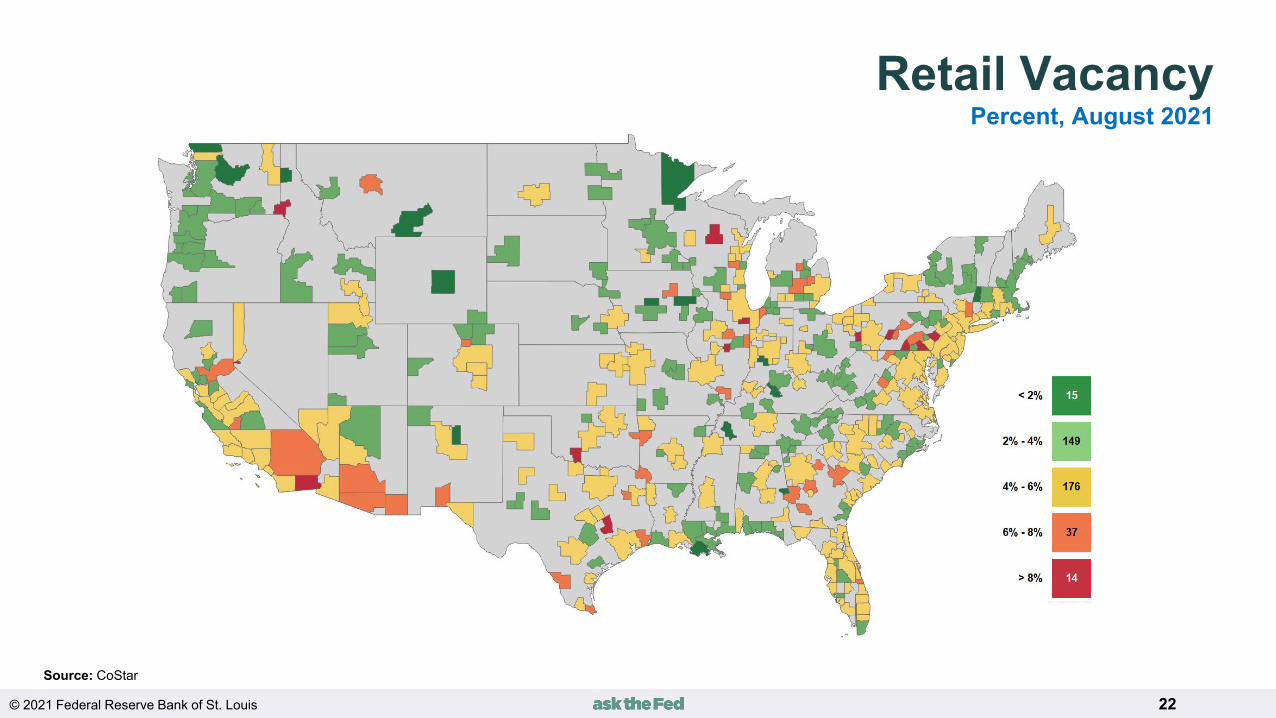
Retail VacancyPercent, August 2021
Source: CoStar

© 2021 Federal Reserve Bank of St. Louis 23
Retail Vacancy (continued)Change in Year-over-Year Basis Points, August 2021
Source: CoStar

© 2021 Federal Reserve Bank of St. Louis 24
Retail Sales Trends
Source: Monthly Retail Trade Report/U.S. Census Bureau, Risk Analysis Unit/Federal Reserve Bank of Atlanta

© 2021 Federal Reserve Bank of St. Louis 25
Retail VacancyPercent, August 2021

© 2021 Federal Reserve Bank of St. Louis 26
Office VacancyOffice Vacancy Percent, August 2021
Source: CoStar

© 2021 Federal Reserve Bank of St. Louis 27
Office VacancyPercent above Long-Term Average, August 2021
Source: CoStar

© 2021 Federal Reserve Bank of St. Louis 28
Polling Question #2
Compared to pre-pandemic levels, what percent of your organization’s employees will be expected to work on-site by year-end?
A) >90%B) >75% but less than 90%C) >50% but less than 75%D) >33% but less than 50%E) <33%

© 2021 Federal Reserve Bank of St. Louis 29
Polling Question #3
Compared to pre-pandemic levels, when your organization returns to the office, on average, how many days a week will your employees physically be in the office?
A) 5 daysB) 4 days C) 3 days D) 2 daysE) 1 dayF) None

© 2021 Federal Reserve Bank of St. Louis 30
Future HomeworkPercent of Employees Working from the Office
75%
6%
3%2%
1%13%
5 days 4 days 3 days 2 days 1 day <1 day
29.4%
24.0%15.0%
8.4%
5.0%
18.2%
5 days 4 days 3 days 2 days 1 day <1 day
Source: BLS, Various surveys/CBRE, Risk Analysis Unit/Federal Reserve Bank of Atlanta
Some industries reported the percent of successful remote workers was greater than 70% during the pandemic.
The remote work impact will vary depending upon the industry.
In extreme circumstances, whole industries may simply not return to the office (e.g., tech support, call center).
2019 POST COVID-19

Office of the Future
Areas of Greater Confidence
Return to the office delayed More people working remotely…more businesses reporting worker-return issues Technology is enabling greater space efficiency in the workplace Some industries will be more prone to let workers utilize alternative work arrangements More space may be needed per full time employee Greater building of Capex & Opex Low-cost/suburban locations appear to be thriving at the expense of high-cost and high-
density markets Tasks requiring collaboration, cross-pollination of ideas, networking, and culture are not
conducted as efficiently in the virtual environment vs. in-person
More Opaque Areas
Re-emergence of the Covid-19 virus Defining what constitutes a safe workplace The new workplace and employee implications
The Future Office

© 2021 Federal Reserve Bank of St. Louis 32
Industrial VacancyPercent, August 2021
Source: CoStar

© 2021 Federal Reserve Bank of St. Louis 33
Industrial Vacancy (continued)Basis Point Change from Last August
Source: CoStar

© 2021 Federal Reserve Bank of St. Louis 34
Travel Spending
Source: Bureau of Economic Analysis; Risk Analysis Unit/Atlanta Fed

© 2021 Federal Reserve Bank of St. Louis 35
Change in RevPAR*% of Markets, 2021 Q2
Source: CoStar
*Revenue Per Available Room

© 2021 Federal Reserve Bank of St. Louis 36
Just How Fast is it Moving??Commercial Mortgage-backed Securities (CMBS), Non-Banks Increase Market Share
Source: Real Capital Analytics, REIT/FRB Atlanta

© 2021 Federal Reserve Bank of St. Louis 37
Return of Risk?Non-Banks Offering Higher LTV Loans
Source: RealCapital Analytics, REIT/FRB Atlanta
0%
5%
10%
15%
20%
20% 25% 30% 35% 40% 45% 50% 55% 60% 65% 70% 75% 80% 85% 90%
All Others
Investor-Driven
Loan to Value
Percent of Loans

© 2021 Federal Reserve Bank of St. Louis 38
Whose Loan?Non-Bank Loan Characteristics
Source: RealCapital Analytics, REIT/FRB Atlanta
73%
70%
68%
70%
71%
69%
68%
65%66%67%68%69%70%71%72%73%74%
Average Loan to Value
2015 2016 2017 2018 2019 2020 2021 1H
$17.2 $17.9 $18.2 $19.4 $18.3 $17.3
$5.6
$0
$5
$10
$15
$20
$25
2015 2016 2017 2018 2019 2020 2021 1H
Average Loan Size$ Millions

© 2021 Federal Reserve Bank of St. Louis 39
Alternative (Institutional) Real Estate Price Change% Change from 1, 2, 3 & 5 Years
-60%
-40%
-20%
0%
20%
40%
60%
80%
100%Apartment
Industrial
Mall
Office
Strip Center
Health Care
Medical Office
Skilled NursingLife Science
Lodging
Manufactured Homes
Net Lease
Self-Storage
Student Housing
Retail
1 year 2 year 3 year 5 yearSource: GreenStreet Advisors, REIT/FRB Atlanta

© 2021 Federal Reserve Bank of St. Louis 40
National Cap Rate Spreads
Source: Real Capital Analytics/FRB Atlanta
SpreadsCap Rates less 10-Year Treasury Yields
0
100
200
300
400
500
600
700
800
'01 '02 '03 '04 '05 '06 '07 '08 '09 '10 '11 '12 '13 '14 '15 '16 '17 '18 '19 '20 '21
Office Industrial Retail Apartments Hotel
Office Industrial Retail Apartments HotelCurrent 497 422 502 347 674
LT Average 434 438 419 317 578Difference 63 -16 83 30 96
Office Industrial Retail Apartments HotelCurrent 497 422 502 347 674
Low (Q2 2007) 146 185 160 104 373Difference 351 237 342 243 302
© 2021 Federal Reserve Bank of St. Louis 41
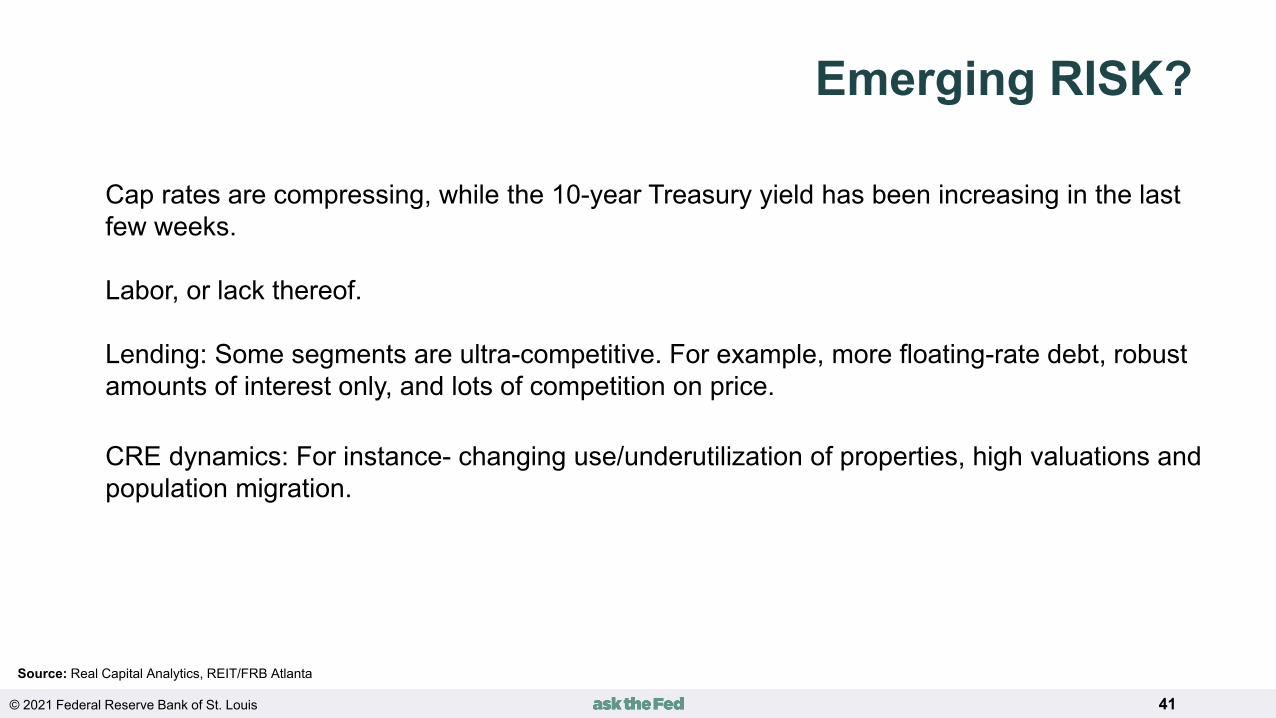
Emerging RISK?
Source: Real Capital Analytics, REIT/FRB Atlanta
Cap rates are compressing, while the 10-year Treasury yield has been increasing in the last few weeks.
Labor, or lack thereof.
Lending: Some segments are ultra-competitive. For example, more floating-rate debt, robust amounts of interest only, and lots of competition on price.
CRE dynamics: For instance- changing use/underutilization of properties, high valuations and population migration.
© 2021 Federal Reserve Bank of St. Louis 42
To Ask a Question
• Use the chat feature in the webinar (Ask Question button on bottom of screen).
• Email your question to: [email protected].
• Use the “Ask a Question” feature on the Ask the Fed® website: www.askthefed.org.

© 2021 Federal Reserve Bank of St. Louis 43
Thanks for joining us.
www.askthefed.org