
Commercial real estate in Hungary – state e Real€¦ · 320 340 01.01.08 29.06.08 26.12.08...
15
REAL ESTATE Country Facts Commercial real estate in Hungary – not a focus of international investors 10/2012
Transcript of Commercial real estate in Hungary – state e Real€¦ · 320 340 01.01.08 29.06.08 26.12.08...

Real
esta
te
Country Facts
Commercial real estate in Hungary – not a focus of international investors
10/2012

2 I Real Estate Country Facts 10/2012
Real Estate Country Facts
Imprint: Publisher and media owner: UniCredit Bank Austria AG http://www.bankaustria.atEditor: Bank Austria Real Estate Consulting & Investment, Karla Schestauber, Tel. +43 (0)50505-54784Layout: www.horvath.co.at
Dated: 21 September 2012
A joint publication of Bank Austria Real Estate, Immobilien Rating GmbH (IRG) and UniCredit Political Studies.
Legal notice – please read this important information: This publication is neither a marketing communication nor a financial analysis. It contains information on general economic data and real estate market data and related assessments of real estate market developments. Despite careful research and the use of reliable sources, we cannot assume any responsibility for the completeness, correctness, up-to-dateness and accuracy of information contained in this publication.
The publication has not been prepared in compliance with the legal provisions governing the independence of financial analyses, and it is not subject to the ban on trading subsequent to the distribu-tion of financial analyses.
This information should not be interpreted as a recommendation to buy or sell financial instruments, or as a solicitation of an offer to buy or sell financial instruments. This publication serves informa-tion purposes only and does not replace specific advice taking into account the investor’s individual personal circumstances (e.g. risk tolerance, knowledge and experience, investment objectives and financial circumstances).
Past performance is not a guide to future performance. Please note that the value of an investment and the return on it may rise and fall, and that every investment involves a degree of risk.
The information in this publication contains assessments of short-term market developments. We have obtained value data and other information from sources which we deem reliable. Our informa-tion and assessments may change without notice.

Real Estate Country Facts 10/2012 I 3
Europe remains in the grip of the euro area crisis. While measures have been taken to combat the crisis, including the introduction of new rescue schemes to support those European countries which have been hit hardest, these efforts have not yet put an end to the crisis. Hopes continue to rest mainly on the European Central Bank. The recently announced purchase in the secondary market of
short-term bonds issued by euro member countries could stabilise the situation and bring down excessively high yield levels.
Future economic developments in Europe will depend on such stabilisation. Euro area forecasts for 2013 generally suggest slight economic growth, based on the assumption that the euro area crisis will ease. Growth expectations for Hungary depend to a large degreee on how the European economy will develop. Around 80% of Hungarian exports go to Europe. This means that the country’s economy has close links with other European countries.
Furthermore, the conservative coalition government under Viktor Orban is responsible for a series of economic policy surprises that have further destabilised the markets and burdened the economy. Most recently, however, Hungary has made concessions. Talks with the EU/ IMF in particular resumed in the summer, sending a positive signal.
The risk appetite of commercial real estate investors remains dampened in these difficult circumstances. Demand concentrates on core real estate, with a preference for economically and political-ly stable economies. Hungary is therefore not among the markets
on which internationally active real estate investors are focusing their attention. In the first half of 2012, the total volume of real estate investments in Hungary was less than €100 million. Prime office yields were around 7.50%. The market for office space con-tinues to suffer as a result of high vacancy rates, reflecting the fact that development activity in this area remained at a high level in the years following the outbreak of the financial and economic cri-sis which was triggered by the collapse of Lehman Brothers. It was only in the past year that construction activity declined markedly, giving the market an opportunity to recover. The retail sector is well developed, market saturation in Budapest in particular has reached a high level. At the end of 2011, the government introduced strict building regulations for commercial properties with a sales area exceeding 300 m2, which will be applicable until 2014 for the time being. This should relieve the intense competition in Budapest to some extent. Should the euro area crisis actually stabilise and Mr Orban’s government sign an agreement with the IMF, this could give a boost to the Hungarian commercial real estate market.
The European banking sector also remains affected by the crisis and internationally tightened regulatory measures. Funding costs are still high and have to be passed on to customers. Bank Austria and UniCredit Bank Hungary are well positioned and ready to finance sound projects. As part of UniCredit Group, we can support Austrian and international real estate developers and investors to use mar-ket opportunities in Hungary.
Yours sincerely,
Karla Schestauber
Commercial real estate in Hungary – not a focus of international real estate investors
4 I Real Estate Country Facts 10/2012
Real Estate Country Facts
Economy shows weakness
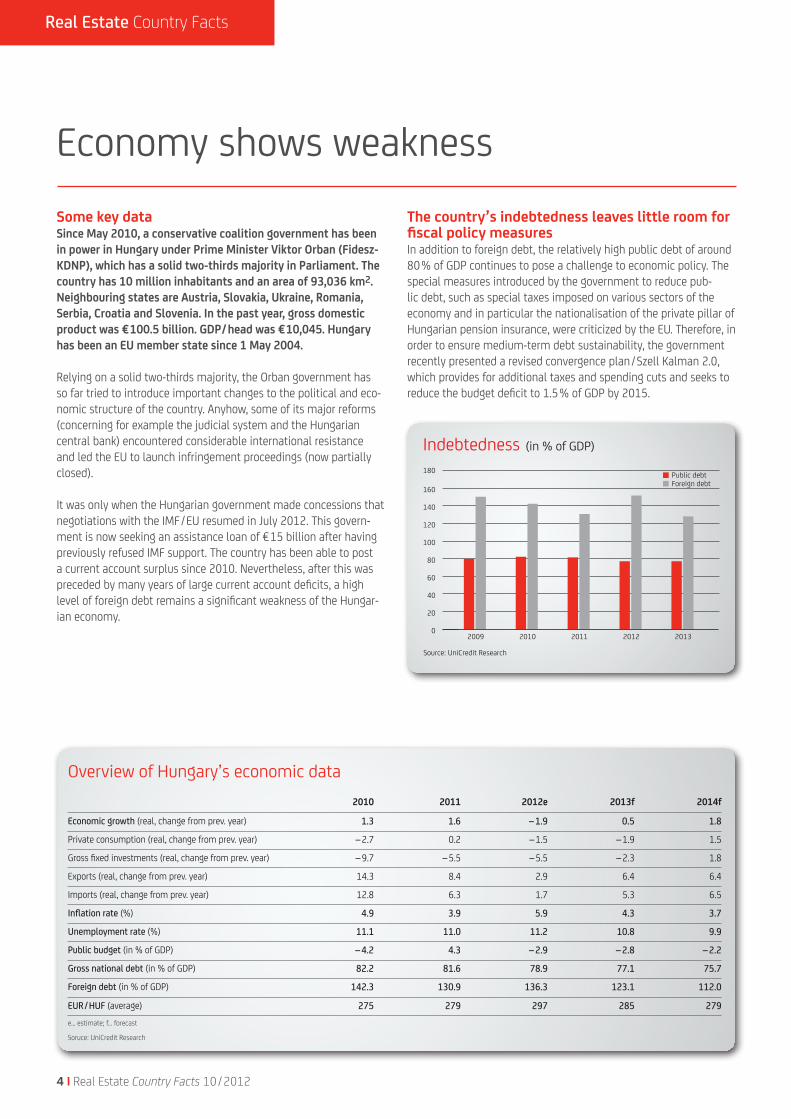
Indebtedness (in % of GDP)
2009 2010 2011 2012 2013
Public debtForeign debt
0
20
40
60
80
100
120
140
160
180
Source: UniCredit Research
Some key dataSince May 2010, a conservative coalition government has been in power in Hungary under Prime Minister Viktor Orban (Fidesz-KDNP), which has a solid two-thirds majority in Parliament. The country has 10 million inhabitants and an area of 93,036 km2. Neighbouring states are Austria, Slovakia, Ukraine, Romania, Serbia, Croatia and Slovenia. In the past year, gross domestic product was €100.5 billion. GDP/head was €10,045. Hungary has been an EU member state since 1 May 2004.
Relying on a solid two-thirds majority, the Orban government has so far tried to introduce important changes to the political and eco-nomic structure of the country. Anyhow, some of its major reforms (concerning for example the judicial system and the Hungarian central bank) encountered considerable international resistance and led the EU to launch infringement proceedings (now partially closed). It was only when the Hungarian government made concessions that negotiations with the IMF/EU resumed in July 2012. This govern-ment is now seeking an assistance loan of €15 billion after having previously refused IMF support. The country has been able to post a current account surplus since 2010. Nevertheless, after this was preceded by many years of large current account deficits, a high level of foreign debt remains a significant weakness of the Hungar-ian economy.
The country’s indebtedness leaves little room for fiscal policy measuresIn addition to foreign debt, the relatively high public debt of around 80% of GDP continues to pose a challenge to economic policy. The special measures introduced by the government to reduce pub-lic debt, such as special taxes imposed on various sectors of the economy and in particular the nationalisation of the private pillar of Hungarian pension insurance, were criticized by the EU. Therefore, in order to ensure medium-term debt sustainability, the government recently presented a revised convergence plan/Szell Kalman 2.0, which provides for additional taxes and spending cuts and seeks to reduce the budget deficit to 1.5% of GDP by 2015.
Overview of Hungary’s economic data2010 2011 2012e 2013f 2014f
Economic growth (real, change from prev. year) 1.3 1.6 – 1.9 0.5 1.8
Private consumption (real, change from prev. year) – 2.7 0.2 – 1.5 – 1.9 1.5
Gross fixed investments (real, change from prev. year) – 9.7 – 5.5 – 5.5 – 2.3 1.8
Exports (real, change from prev. year) 14.3 8.4 2.9 6.4 6.4
Imports (real, change from prev. year) 12.8 6.3 1.7 5.3 6.5
Inflation rate (%) 4.9 3.9 5.9 4.3 3.7
Unemployment rate (%) 11.1 11.0 11.2 10.8 9.9
Public budget (in % of GDP) – 4.2 4.3 – 2.9 – 2.8 – 2.2
Gross national debt (in % of GDP) 82.2 81.6 78.9 77.1 75.7
Foreign debt (in % of GDP) 142.3 130.9 136.3 123.1 112.0
EUR/HUF (average) 275 279 297 285 279e… estimate; f… forecast
Soruce: UniCredit Research
Real Estate Country Facts 10/2012 I 5
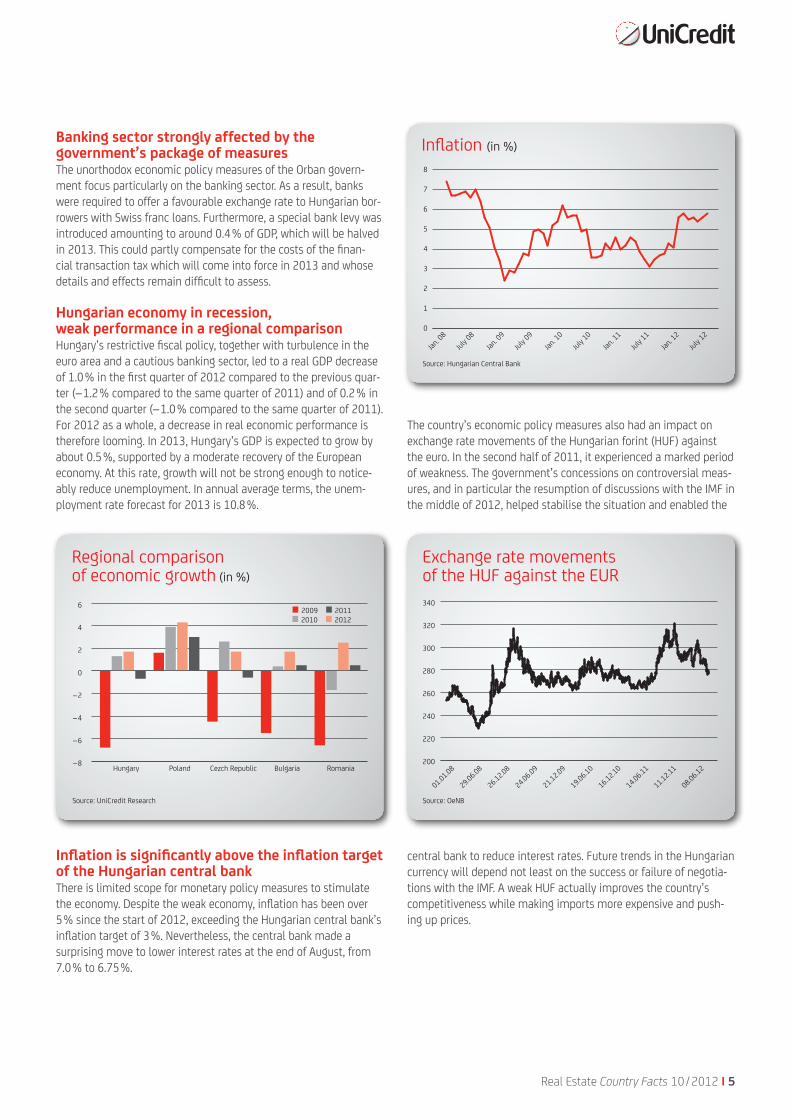
The country’s economic policy measures also had an impact on exchange rate movements of the Hungarian forint (HUF) against the euro. In the second half of 2011, it experienced a marked period of weakness. The government’s concessions on controversial meas-ures, and in particular the resumption of discussions with the IMF in the middle of 2012, helped stabilise the situation and enabled the
central bank to reduce interest rates. Future trends in the Hungarian currency will depend not least on the success or failure of negotia-tions with the IMF. A weak HUF actually improves the country’s competitiveness while making imports more expensive and push-ing up prices.
Inflation (in %)
0
1
2
3
4
5
6
7
8
July 1
2Jan
. 12
Jan. 0
8Jul
y 08
Jan. 0
9Jul
y 09
Jan. 1
0Jul
y 10
Jan. 1
1Jul
y 11
Source: Hungarian Central Bank
Exchange rate movementsof the HUF against the EUR
200
220
240
260
280
300
320
340
01.01.08
29.06.08
26.12.08
24.06.09
21.12.09
19.06.10
16.12.10
14.06.11
11.12.11
08.06.12
Source: OeNB
Banking sector strongly affected by the government’s package of measuresThe unorthodox economic policy measures of the Orban govern-ment focus particularly on the banking sector. As a result, banks were required to offer a favourable exchange rate to Hungarian bor-rowers with Swiss franc loans. Furthermore, a special bank levy was introduced amounting to around 0.4% of GDP, which will be halved in 2013. This could partly compensate for the costs of the finan-cial transaction tax which will come into force in 2013 and whose details and effects remain difficult to assess.
Hungarian economy in recession, weak performance in a regional comparisonHungary’s restrictive fiscal policy, together with turbulence in the euro area and a cautious banking sector, led to a real GDP decrease of 1.0% in the first quarter of 2012 compared to the previous quar-ter (–1.2% compared to the same quarter of 2011) and of 0.2% in the second quarter (–1.0% compared to the same quarter of 2011). For 2012 as a whole, a decrease in real economic performance is therefore looming. In 2013, Hungary’s GDP is expected to grow by about 0.5%, supported by a moderate recovery of the European economy. At this rate, growth will not be strong enough to notice-ably reduce unemployment. In annual average terms, the unem-ployment rate forecast for 2013 is 10.8%.
Inflation is significantly above the inflation target of the Hungarian central bankThere is limited scope for monetary policy measures to stimulate the economy. Despite the weak economy, inflation has been over 5% since the start of 2012, exceeding the Hungarian central bank’s inflation target of 3%. Nevertheless, the central bank made a surprising move to lower interest rates at the end of August, from 7.0% to 6.75%.
Regional comparison of economic growth (in %)
20092010
20112012
–8
–6
–4
–2
0
2
4
6
RomaniaBulgariaCezch RepublicPolandHungary
Source: UniCredit Research
6 I Real Estate Country Facts 10/2012
Real Estate Country Facts
Hungary not a focus of commercial real estate investors
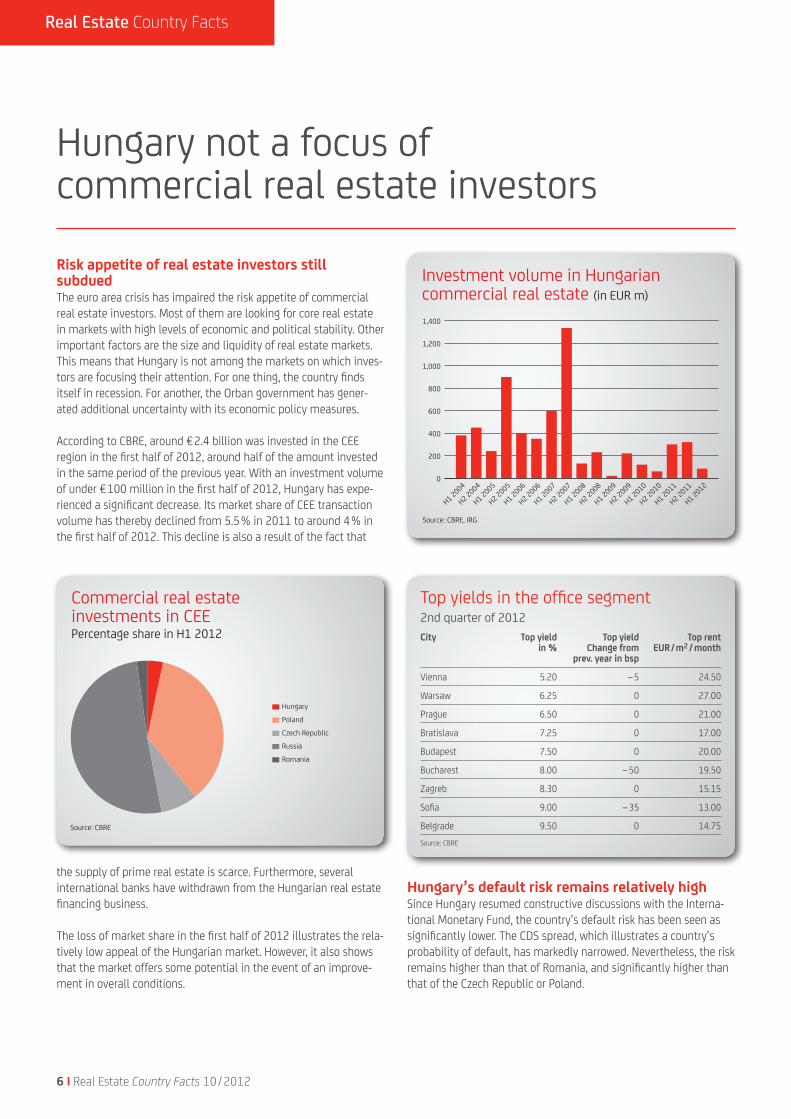
Risk appetite of real estate investors still subdued The euro area crisis has impaired the risk appetite of commercial real estate investors. Most of them are looking for core real estate in markets with high levels of economic and political stability. Other important factors are the size and liquidity of real estate markets. This means that Hungary is not among the markets on which inves-tors are focusing their attention. For one thing, the country finds itself in recession. For another, the Orban government has gener-ated additional uncertainty with its economic policy measures.
According to CBRE, around €2.4 billion was invested in the CEE region in the first half of 2012, around half of the amount invested in the same period of the previous year. With an investment volume of under €100 million in the first half of 2012, Hungary has expe-rienced a significant decrease. Its market share of CEE transaction volume has thereby declined from 5.5% in 2011 to around 4% in the first half of 2012. This decline is also a result of the fact that
the supply of prime real estate is scarce. Furthermore, several international banks have withdrawn from the Hungarian real estate financing business.
The loss of market share in the first half of 2012 illustrates the rela-tively low appeal of the Hungarian market. However, it also shows that the market offers some potential in the event of an improve-ment in overall conditions.
Hungary’s default risk remains relatively highSince Hungary resumed constructive discussions with the Interna-tional Monetary Fund, the country’s default risk has been seen as significantly lower. The CDS spread, which illustrates a country’s probability of default, has markedly narrowed. Nevertheless, the risk remains higher than that of Romania, and significantly higher than that of the Czech Republic or Poland.
Top yields in the office segment 2nd quarter of 2012City Top yield
in % Top yield
Change fromprev. year in bsp
Top rent EUR/m2 / month
Vienna 5.20 – 5 24.50
Warsaw 6.25 0 27.00
Prague 6.50 0 21.00
Bratislava 7.25 0 17.00
Budapest 7.50 0 20.00
Bucharest 8.00 – 50 19.50
Zagreb 8.30 0 15.15
Sofia 9.00 – 35 13.00
Belgrade 9.50 0 14.75Source: CBRE
Commercial real estate investments in CEEPercentage share in H1 2012
Hungary
Poland
Czech Republic
Russia
Romania
Source: CBRE
Investment volume in Hungarian commercial real estate (in EUR m)
0
200
400
600
800
1,000
1,200
1,400
H1 2012
H2 2011
H1 2011
H2 2010
H1 2010
H2 2009
H1 2009
H2 2008
H1 2008
H2 2007
H1 2007
H2 2006
H1 2006
H2 2005
H1 2005
H2 2004
H1 2004
Source: CBRE, IRG
Real Estate Country Facts 10/2012 I 7
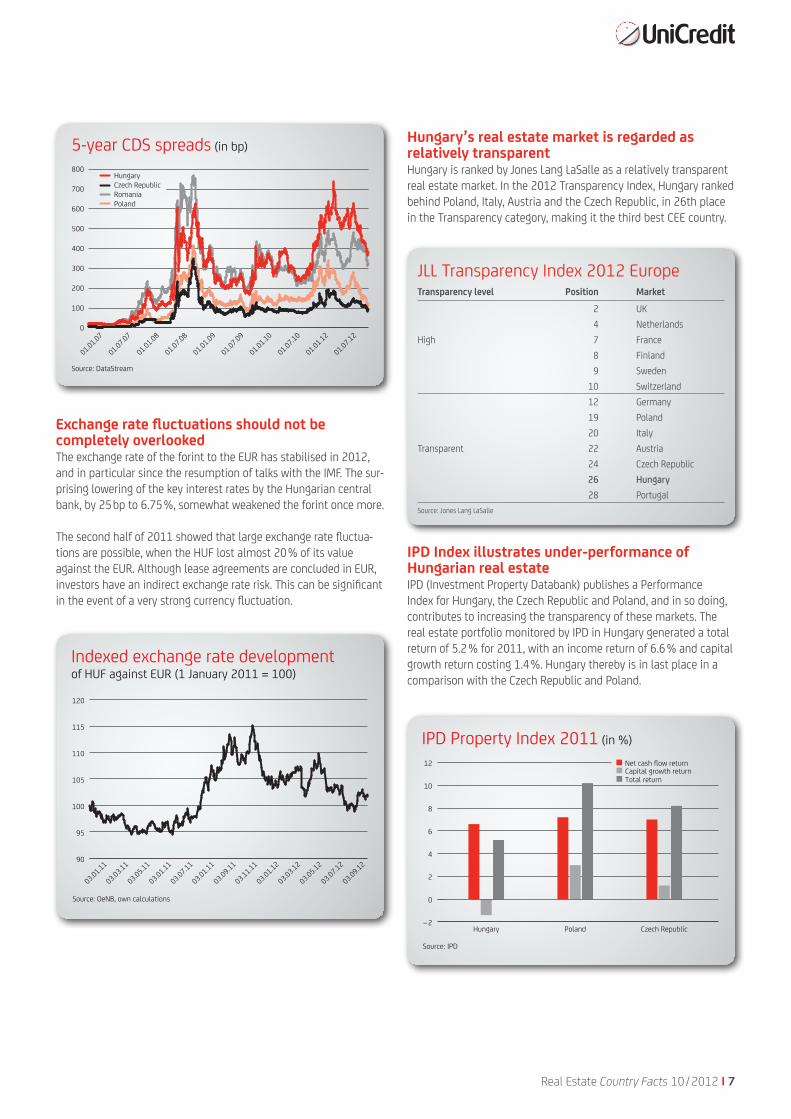
Hungary’s real estate market is regarded as relatively transparentHungary is ranked by Jones Lang LaSalle as a relatively transparent real estate market. In the 2012 Transparency Index, Hungary ranked behind Poland, Italy, Austria and the Czech Republic, in 26th place in the Transparency category, making it the third best CEE country.
IPD Index illustrates under-performance of Hungarian real estateIPD (Investment Property Databank) publishes a Performance Index for Hungary, the Czech Republic and Poland, and in so doing, contributes to increasing the transparency of these markets. The real estate portfolio monitored by IPD in Hungary generated a total return of 5.2% for 2011, with an income return of 6.6% and capital growth return costing 1.4%. Hungary thereby is in last place in a comparison with the Czech Republic and Poland.
–2
0
2
4
6
8
10
12
Czech RepublicPolandHungary
Capital growth returnTotal return
Net cash flow return
IPD Property Index 2011 (in %)
Source: IPD
Exchange rate fluctuations should not be completely overlookedThe exchange rate of the forint to the EUR has stabilised in 2012, and in particular since the resumption of talks with the IMF. The sur-prising lowering of the key interest rates by the Hungarian central bank, by 25bp to 6.75%, somewhat weakened the forint once more.
The second half of 2011 showed that large exchange rate fluctua-tions are possible, when the HUF lost almost 20% of its value against the EUR. Although lease agreements are concluded in EUR, investors have an indirect exchange rate risk. This can be significant in the event of a very strong currency fluctuation.
5-year CDS spreads (in bp)
0
100
200
300
400
500
600
700
800
PolandRomaniaCzech RepublicHungary
01.01.07
01.07.07
01.01.08
01.07.08
01.01.09
01.07.09
01.01.10
01.07.10
01.01.12
01.07.12
Source: DataStream
Indexed exchange rate development of HUF against EUR (1 January 2011 = 100)
90
95
100
105
110
115
120
03.01.11
03.03.11
03.05.11
03.01.11
03.07.11
03.01.11
03.09.11
03.11.11
03.01.12
03.03.12
03.05.12
03.07.12
03.09.12
Source: OeNB, own calculations
JLL Transparency Index 2012 EuropeTransparency level Position Market
2 UK4 Netherlands
High 7 France8 Finland9 Sweden
10 Switzerland12 Germany19 Poland20 Italy
Transparent 22 Austria24 Czech Republic26 Hungary28 Portugal
Source: Jones Lang LaSalle
8 I Real Estate Country Facts 10/2012
Real Estate Country Facts
Vacancy rates in office market remain high despite record low in new building activity
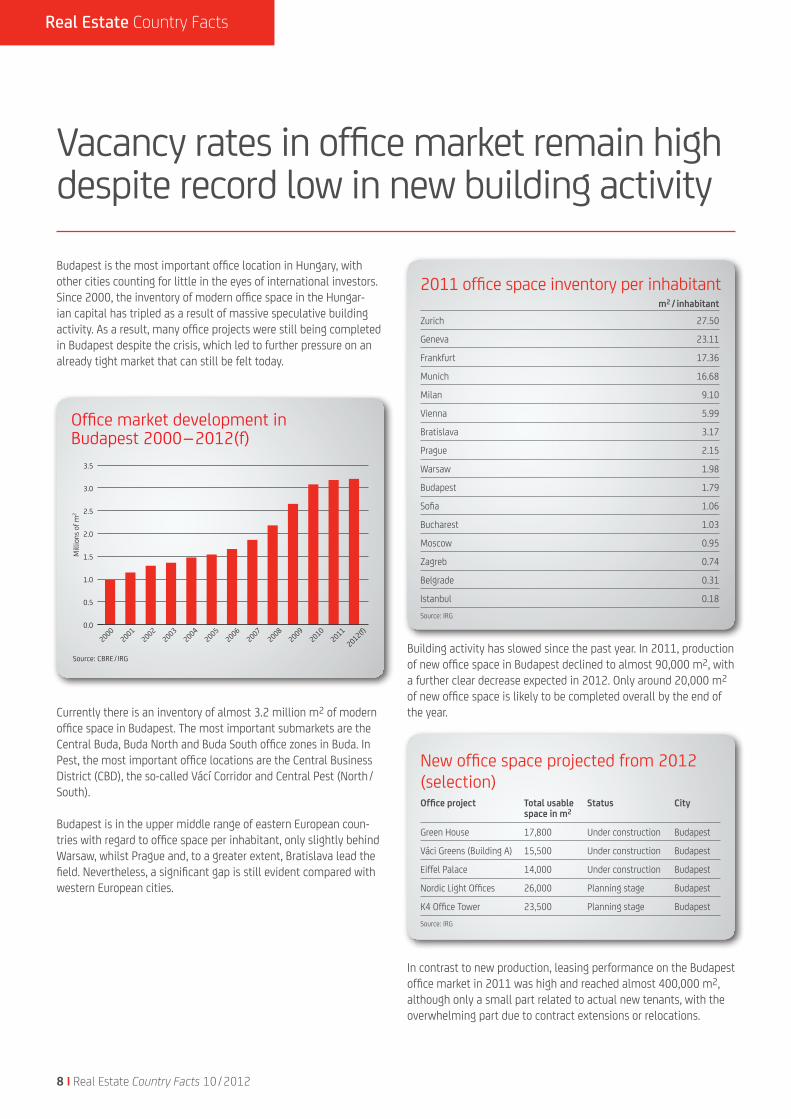
Budapest is the most important office location in Hungary, with other cities counting for little in the eyes of international investors. Since 2000, the inventory of modern office space in the Hungar-ian capital has tripled as a result of massive speculative building activity. As a result, many office projects were still being completed in Budapest despite the crisis, which led to further pressure on an already tight market that can still be felt today.
Currently there is an inventory of almost 3.2 million m2 of modern office space in Budapest. The most important submarkets are the Central Buda, Buda North and Buda South office zones in Buda. In Pest, the most important office locations are the Central Business District (CBD), the so-called Vácí Corridor and Central Pest (North/South).
Budapest is in the upper middle range of eastern European coun-tries with regard to office space per inhabitant, only slightly behind Warsaw, whilst Prague and, to a greater extent, Bratislava lead the field. Nevertheless, a significant gap is still evident compared with western European cities.
Building activity has slowed since the past year. In 2011, production of new office space in Budapest declined to almost 90,000 m2, with a further clear decrease expected in 2012. Only around 20,000 m2 of new office space is likely to be completed overall by the end of the year.
In contrast to new production, leasing performance on the Budapest office market in 2011 was high and reached almost 400,000 m2, although only a small part related to actual new tenants, with the overwhelming part due to contract extensions or relocations.
New office space projected from 2012 (selection)Office project Total usable
space in m2 Status City
Green House 17,800 Under construction Budapest
Váci Greens (Building A) 15,500 Under construction Budapest
Eiffel Palace 14,000 Under construction Budapest
Nordic Light Offices 26,000 Planning stage Budapest
K4 Office Tower 23,500 Planning stage BudapestSource: IRG
2011 office space inventory per inhabitantm2 / inhabitant
Zurich 27.50
Geneva 23.11
Frankfurt 17.36
Munich 16.68
Milan 9.10
Vienna 5.99
Bratislava 3.17
Prague 2.15
Warsaw 1.98
Budapest 1.79
Sofia 1.06
Bucharest 1.03
Moscow 0.95
Zagreb 0.74
Belgrade 0.31
Istanbul 0.18Source: IRG
Office market development in Budapest 2000–2012(f)
20002001
20022003
20042005
20062007
20082009
20102011
2012(f)0.0
0.5
1.0
1.5
2.0
2.5
3.0
3.5
Source: CBRE/ IRG
Mill
ions
of m
2
Real Estate Country Facts 10/2012 I 9
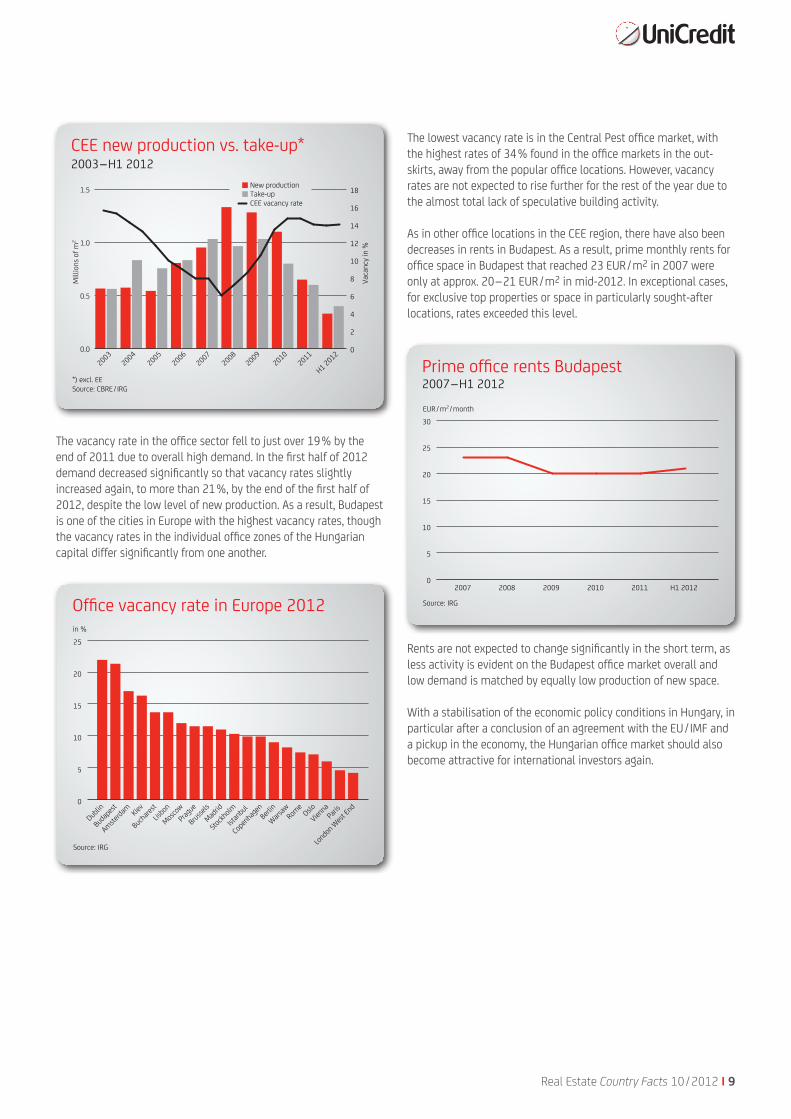
The lowest vacancy rate is in the Central Pest office market, with the highest rates of 34% found in the office markets in the out-skirts, away from the popular office locations. However, vacancy rates are not expected to rise further for the rest of the year due to the almost total lack of speculative building activity.
As in other office locations in the CEE region, there have also been decreases in rents in Budapest. As a result, prime monthly rents for office space in Budapest that reached 23 EUR/m2 in 2007 were only at approx. 20–21 EUR/m2 in mid-2012. In exceptional cases, for exclusive top properties or space in particularly sought-after locations, rates exceeded this level.
Rents are not expected to change significantly in the short term, as less activity is evident on the Budapest office market overall and low demand is matched by equally low production of new space.
With a stabilisation of the economic policy conditions in Hungary, in particular after a conclusion of an agreement with the EU/ IMF and a pickup in the economy, the Hungarian office market should also become attractive for international investors again.
Prime office rents Budapest 2007–H1 2012
0
5
10
15
20
25
30
2007 2008 2009 2010 2011 H1 2012
Source: IRG
EUR/m2/month
The vacancy rate in the office sector fell to just over 19% by the end of 2011 due to overall high demand. In the first half of 2012 demand decreased significantly so that vacancy rates slightly increased again, to more than 21%, by the end of the first half of 2012, despite the low level of new production. As a result, Budapest is one of the cities in Europe with the highest vacancy rates, though the vacancy rates in the individual office zones of the Hungarian capital differ significantly from one another.
CEE new production vs. take-up* 2003–H1 2012
20032004
20052006
20072008
20092010
2011
H1 20120.0
0.5
1.0
1.5
0
2
4
6
8
10
12
14
16
18CEE vacancy rateTake-up New production
*) excl. EESource: CBRE/ IRG
Mill
ions
of m
2
Vaca
ncy
in %
Office vacancy rate in Europe 2012
0
5
10
15
20
25
in %
Londo
n West
End
Paris
Vienna
Oslo
Warsaw
Rome
Berlin
Copen
hagen
Istan
bul
Stockh
olmMad
rid
Brussel
sPrag
ue
Moscow
Lisbo
n
Buchare
st
Amsterda
m Kiev
Budap
estDub
lin
Source: IRG
10 I Real Estate Country Facts 10/2012
Real Estate Country Facts
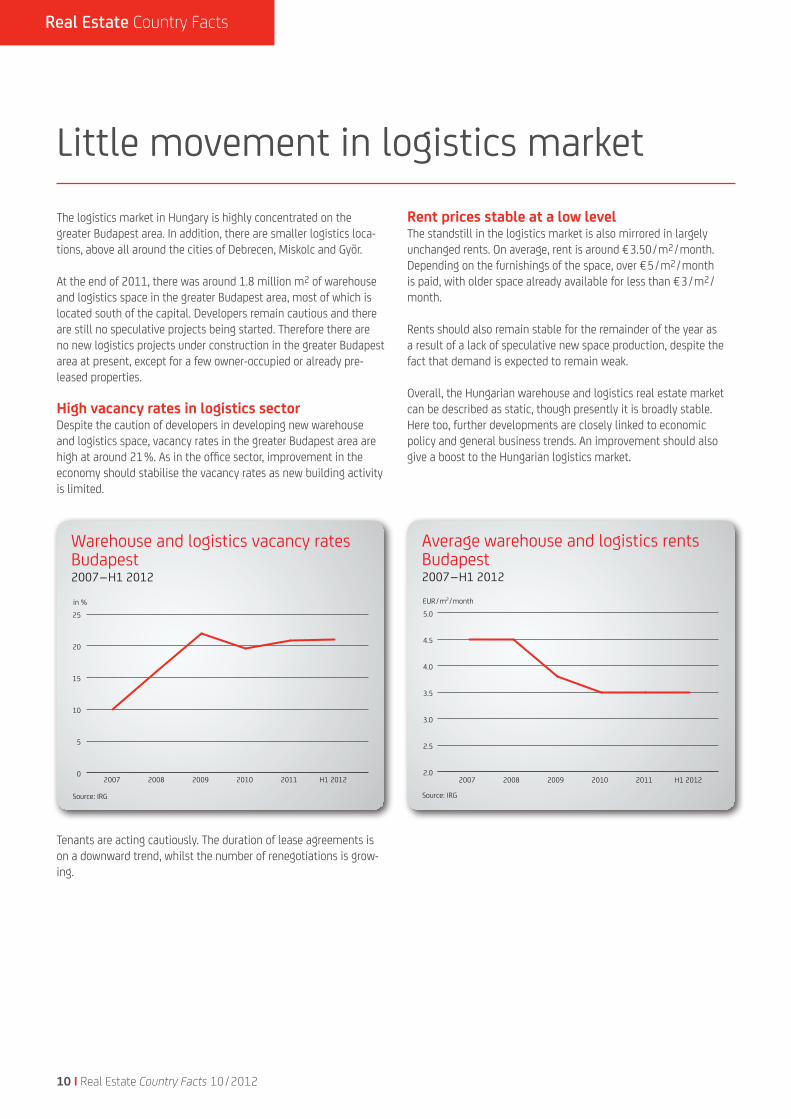
Little movement in logistics market The logistics market in Hungary is highly concentrated on the greater Budapest area. In addition, there are smaller logistics loca-tions, above all around the cities of Debrecen, Miskolc and Györ.
At the end of 2011, there was around 1.8 million m2 of warehouse and logistics space in the greater Budapest area, most of which is located south of the capital. Developers remain cautious and there are still no speculative projects being started. Therefore there are no new logistics projects under construction in the greater Budapest area at present, except for a few owner-occupied or already pre-leased properties.
High vacancy rates in logistics sectorDespite the caution of developers in developing new warehouse and logistics space, vacancy rates in the greater Budapest area are high at around 21%. As in the office sector, improvement in the economy should stabilise the vacancy rates as new building activity is limited.
Tenants are acting cautiously. The duration of lease agreements is on a downward trend, whilst the number of renegotiations is grow-ing.
Rent prices stable at a low levelThe standstill in the logistics market is also mirrored in largely unchanged rents. On average, rent is around €3.50/m2/month. Depending on the furnishings of the space, over €5/m2/month is paid, with older space already available for less than €3/m2/month.
Rents should also remain stable for the remainder of the year as a result of a lack of speculative new space production, despite the fact that demand is expected to remain weak.
Overall, the Hungarian warehouse and logistics real estate market can be described as static, though presently it is broadly stable. Here too, further developments are closely linked to economic policy and general business trends. An improvement should also give a boost to the Hungarian logistics market.
Warehouse and logistics vacancy rates Budapest 2007–H1 2012
0
5
10
15
20
25
2007 2008 2009 2010 2011 H1 2012
Source: IRG
in %
Average warehouse and logistics rents Budapest 2007–H1 2012
2.0
2.5
3.0
3.5
4.0
4.5
5.0
2007 2008 2009 2010 2011 H1 2012
Source: IRG
EUR/m2/month

Real Estate Country Facts 10/2012 I 11
Retail sector struggling on several frontsThe recession in Hungary is also affecting the Hungarian retail sector. A weak labour market combined with declining purchasing power is dampening consumer spending, a development which is reflected in weak retail sales. The increase at the start of 2012 in already very high VAT rates from 25% to 27%, affecting most everyday items, led to higher prices. Retail sales are also being taxed with the introduction of a “crisis tax”. All large companies, e.g. Tesco or Spar, are affected by this tax of up to 2.5% of annual sales.
Around 10 million people live in Hungary. Like many European countries, Hungary also has to deal with an ageing population. In the coming years, a further decrease in the population is expected due to a declining birth rate. The major cities of interest for the retail sector are Budapest, Debrecen, Miskolc and Szeged.
According to MB Research in Hungary, annual purchasing power was around €5,581 per capita in 2011. This figure is significantly lower than the EU-27 average of €15,501. As in other CEE coun-tries, there are significant regional differences within the country. The poorest regions are in the south and east of the country. Buda-pest has the highest purchasing power with €7,425 per capita.
Budapest, the most important and largest commercial centre, has 1.7 million inhabitants. The city has slightly over 1 million m2 of shopping centre space – around three-quarters of all shopping centre space in Hungary – and around 170,000 m2 of space in speciality shopping centres, and is therefore very well supplied with retail space.
However, in comparison to other countries, Hungary is lagging behind in the provision of shopping centre space. According to Cushman & Wakefield, the country has 131.4 m2 of retail space per 1,000 inhabitants, well below the European average of 246.6 m2.
The financial crisis reached many shopping centre projects either shortly before or during their implementation phase. A string of these projects had to be temporarily halted, postponed or shelved. At the end of 2011, the strict building regulations for retail proper-ties with more than 300 m2 of sales space imposed by the govern-ment – the so-called “plaza stop” – added a further complication for developers. The “plaza stop” will initially be valid until 2014. Foreign chain stores have to decide whether to postpone their expansion plans, submit their projects to the planning commission or switch to empty units in existing retail properties. Discount food retailers who sought to grow strongly in Hungary in the coming years have been particularly affected by the tightened planning regulations.
Declining sales and more difficult market conditions have also prompted some chain stores to exit the Hungarian market. On the other hand, other chain stores see their chance to obtain vacant stores at cheaper rents in better locations. They expect a head start compared to other market participants not yet represented in Hun-gary, once the Hungarian market begins to recover.
In 2011, around 160,000 m2 of new retail space came onto the market, mainly in Budapest. In 2012, only the two Sió Pláza projects are expected to be added, with 18,500 m2 of rentable space in Siofok and the Hegyvidék Center in Budapest with 5,300 m2 of space.
Shopping centre space in Europe(Rentable area in m2 per 1,000 inhabitants)
0
50
100
150
200
250
300
350
400
Ukraine
Bulgari
aTu
rkey
Russia
Roman
ia
Hunga
ry
Czech Rep
ublic
Slovak
iaPola
ndCroa
tia
EU-27 av
erage
Latvia
Lithua
nia
Austria
Sloven
ia
Eston
ia
Source: Cushman & Wakefield, as of March 2012
Selected SCShopping centre Gross
lettable area m2
(Planned) opening/status City
KÖKI Terminal ~ 55,000 2011, completed BudapestÁrkád Szeged ~ 41,000 2011, completed SzegedFerihegy T2 Sky Court (Airport)
~ 40,000 2011, completed Budapest
Sió Pláza ~ 18,500 2012, completed SiófokVáci 1 Emporium ~ 11,000 2011/2012, part-completed Budapest
2011, completedEuropeum SC ~ 6,000 2012, under construction BudapestHegyvidék Center ~ 5,300 2013, under construction BudapestÁrkád II (expansion) ~ 20,000 2013, under construction BudapestMundo Center ~ 37,300 2015, planning stage BudapestSource: BulwienGesa, IRG

12 I Real Estate Country Facts 10/2012
Real Estate Country Facts
31
30
29
9
8
7
6
5
4
3
2
1
28
27
26
25
24
2322
21
20
19
18
1716
15
14
13
12
11
10
Created on: 09.08.2012Source: IRG, ESRIShopping Centres
Budapest
LEGEND
Shopping Centre
GLA in m²> 50,000 m²
20,001 – 50,000 m²
< 20,000 m²
state of SC0 3 61,5
kilometres
1 Aréna Plaza Center2 Mammut3 KÖKI4 WestEnd City Center 5 Pólus Center6 Allee Center7 Árkád örs vezér tere8 Ferihegy T2 Sky Court 9 Campona10 Duna Pláza11 Asia Center12 Corvin Shopping Center 13 Savoya Park14 MOM Park15 Lurdy Ház16 Europark17 Új Buda Center 18 EuroCenter Óbuda19 Sugár Üzletközpont 20 Neo Center21 Új Udvar22 Csepel Plaza23 Auchan Soroksár24 Fashion Street25 Récsei Center26 Váci 127 Budagyöngye 28 Eleven Center29 Hegyvidek Központ30 Árkád örs vezér tere (extension)31 Mundo Center
Existing SC
SC Under Construction
Planned SC
Figures: BulwienGesa, King Sturge, ICSC, developers' figures
N
31
30
29
9
8
7
6
5
4
3
2
1
28
27
26
25
24
2322
21
20
19
18
1716
15
14
13
12
11
10
Created on: 09.08.2012Source: IRG, ESRIShopping Centres
Budapest
LEGEND
Shopping Centre
GLA in m²> 50,000 m²
20,001 – 50,000 m²
< 20,000 m²
state of SC ±0 3 61,5Kilometer
1 Aréna Plaza Center2 Mammut3 KÖKI4 WestEnd City Center 5 Pólus Center6 Allee Center7 Árkád örs vezér tere8 Ferihegy T2 Sky Court 9 Campona10 Duna Pláza11 Asia Center12 Corvin Shopping Center 13 Savoya Park14 MOM Park15 Lurdy Ház16 Europark17 Új Buda Center 18 EuroCenter Óbuda19 Sugár Üzletközpont 20 Neo Center21 Új Udvar22 Csepel Plaza23 Auchan Soroksár24 Fashion Street25 Récsei Center26 Váci 127 Budagyöngye 28 Eleven Center29 Hegyvidek Központ30 Árkád örs vezér tere (extension)31 Mundo Center
Existing SC
SC Under Construction
Planned SC
Figures: BulwienGesa, King Sturge, ICSC, developers' figures
Shopping Centres Budapest
Rents in most shopping centres in Budapest have been lowered by between 10% and 30% since the start of the financial crisis, though rents have stabilised somewhat in the meantime. They are currently between EUR 8 and 70 per m2 per month, depending on the size and location of the unit. It is expected that rents will once again come under pressure due to economic uncertainty, particu-larly in less successful shopping centres, whilst rents in the top shopping centres should remain stable. Examples of top shopping centres in Budapest include the WestEnd City Center, the Mammut, Árkád, Arena Plaza and Allee.
Some expiring lease agreements in less attractive centres are not being extended by tenants as they use the opportunity to switch to more attractive space in one of the top shopping centres. In the case of new lease agreements, retailers are increasingly attempting to transfer business risk to the shopping centre operator in agree-ments where rent is proportionate to sales.
The vacancy rate in the shopping centre sector is around 15 – 20%, whereas it is much lower in thriving shopping centres. The propor-tion of vacant shops in good locations should not rise any further as a result of limited new space being offered in the coming years.Prime yields for the first half of 2012 were 7.25 – 7.5%.
Shopping streetsTraditionally, the top high streets in Budapest are the luxurious An-drássy út and Váci utca. However, demand from international luxury brand companies for locations in the exclusive shopping streets is not very strong. Rent rates here are around EUR 30 to 100 per m2 per month. Around 15% to 20% of retail space in the high streets is vacant. In the first half of 2012, top yields reached 7.0 – 7.25%.
Mixed outlookIt is expected that shopping centres will undergo a market shake-out as a result of high saturation of retail space, particularly in Budapest. In intensified competition, location, tenant mix and professional management will be the long-term success factors. However, the introduction of the “plaza stop” also has positive impacts for existing shopping centres, as the cut-throat competition from new projects is being alleviated.
For international investors who are still cautious, a stabilising of economic policy conditions and a pickup in the economy could once again make shopping centres increasingly interesting.
31
30
29
9
8
7
6
5
4
3
2
1
28
27
26
25
24
2322
21
20
19
18
1716
15
14
13
12
11
10
Created on: 09.08.2012Source: IRG, ESRIShopping Centres
Budapest
LEGEND
Shopping Centre
GLA in m²> 50,000 m²
20,001 – 50,000 m²
< 20,000 m²
state of SC ±0 3 61,5Kilometer
1 Aréna Plaza Center2 Mammut3 KÖKI4 WestEnd City Center 5 Pólus Center6 Allee Center7 Árkád örs vezér tere8 Ferihegy T2 Sky Court 9 Campona10 Duna Pláza11 Asia Center12 Corvin Shopping Center 13 Savoya Park14 MOM Park15 Lurdy Ház16 Europark17 Új Buda Center 18 EuroCenter Óbuda19 Sugár Üzletközpont 20 Neo Center21 Új Udvar22 Csepel Plaza23 Auchan Soroksár24 Fashion Street25 Récsei Center26 Váci 127 Budagyöngye 28 Eleven Center29 Hegyvidek Központ30 Árkád örs vezér tere (extension)31 Mundo Center
Existing SC
SC Under Construction
Planned SC
Figures: BulwienGesa, King Sturge, ICSC, developers' figures
Real Estate Country Facts 10/2012 I 13
Residential market at a standstill
Housing market at a historic lowIn 2010 there was a newly renovated 87 m2 2-bedroom apartment in the city centre of Budapest. The goal was to sell it to an inves-tor as quickly as possible. This really should not present a great challenge for an apartment in a prime location, together with an experienced broker. Nevertheless, two years later the apartment still stands empty, even though the price per square metre has already dropped by 20–30%. This example is no one-off and is characteris-tic of the current problems facing the Hungarian residential property market.
Foreign currency loans, particularly in Swiss francs, have driven the residential property market for a long time. The strong appreciation of the CHF coupled with the weakness of the HUF meant repayments became unaffordable for many borrowers. More favourable ex-change rates for repayment fixed by the government are alleviating the situation for borrowers somewhat, but this fixing is expensive for the banking sector. As Hungarian forint loans with high interest rates are relatively less attractive, many of those interested in purchasing new residential property have deferred this indefinitely.
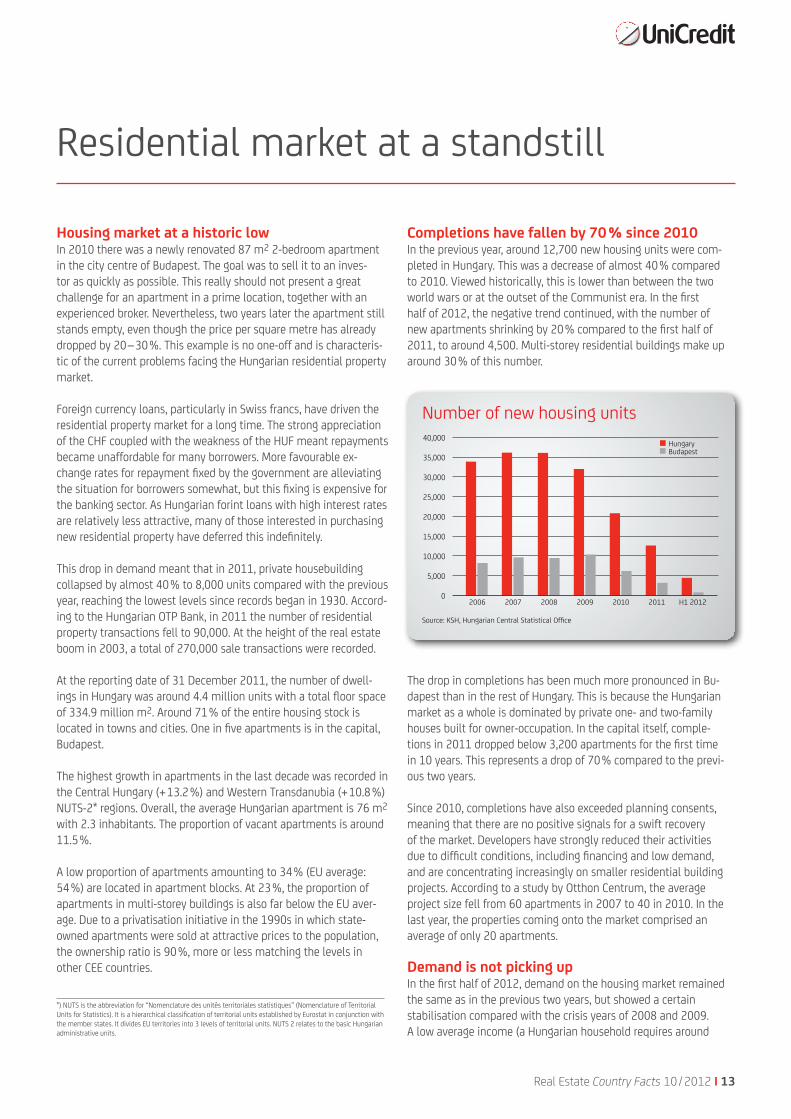
This drop in demand meant that in 2011, private housebuilding collapsed by almost 40% to 8,000 units compared with the previous year, reaching the lowest levels since records began in 1930. Accord-ing to the Hungarian OTP Bank, in 2011 the number of residential property transactions fell to 90,000. At the height of the real estate boom in 2003, a total of 270,000 sale transactions were recorded.
At the reporting date of 31 December 2011, the number of dwell-ings in Hungary was around 4.4 million units with a total floor space of 334.9 million m2. Around 71% of the entire housing stock is located in towns and cities. One in five apartments is in the capital, Budapest.
The highest growth in apartments in the last decade was recorded in the Central Hungary (+13.2%) and Western Transdanubia (+10.8%) NUTS-2* regions. Overall, the average Hungarian apartment is 76 m2 with 2.3 inhabitants. The proportion of vacant apartments is around 11.5%.
A low proportion of apartments amounting to 34% (EU average: 54%) are located in apartment blocks. At 23%, the proportion of apartments in multi-storey buildings is also far below the EU aver-age. Due to a privatisation initiative in the 1990s in which state-owned apartments were sold at attractive prices to the population, the ownership ratio is 90%, more or less matching the levels in other CEE countries.
Completions have fallen by 70% since 2010In the previous year, around 12,700 new housing units were com-pleted in Hungary. This was a decrease of almost 40% compared to 2010. Viewed historically, this is lower than between the two world wars or at the outset of the Communist era. In the first half of 2012, the negative trend continued, with the number of new apartments shrinking by 20% compared to the first half of 2011, to around 4,500. Multi-storey residential buildings make up around 30% of this number.
The drop in completions has been much more pronounced in Bu-dapest than in the rest of Hungary. This is because the Hungarian market as a whole is dominated by private one- and two-family houses built for owner-occupation. In the capital itself, comple-tions in 2011 dropped below 3,200 apartments for the first time in 10 years. This represents a drop of 70% compared to the previ-ous two years.
Since 2010, completions have also exceeded planning consents, meaning that there are no positive signals for a swift recovery of the market. Developers have strongly reduced their activities due to difficult conditions, including financing and low demand, and are concentrating increasingly on smaller residential building projects. According to a study by Otthon Centrum, the average project size fell from 60 apartments in 2007 to 40 in 2010. In the last year, the properties coming onto the market comprised an average of only 20 apartments.
Demand is not picking upIn the first half of 2012, demand on the housing market remained the same as in the previous two years, but showed a certain stabilisation compared with the crisis years of 2008 and 2009. A low average income (a Hungarian household requires around
Number of new housing units
2006 2007 2008 2009 2010 2011 H1 2012
BudapestHungary
0
5,000
10,000
15,000
20,000
25,000
30,000
35,000
40,000
Source: KSH, Hungarian Central Statistical Office
*) NUTS is the abbreviation for “Nomenclature des unités territoriales statistiques” (Nomenclature of Territorial Units for Statistics). It is a hierarchical classification of territorial units established by Eurostat in conjunction with the member states. It divides EU territories into 3 levels of territorial units. NUTS 2 relates to the basic Hungarian administrative units.
14 I Real Estate Country Facts 10/2012
Real Estate Country Facts
4.5 monthly salaries in order to acquire one square metre of prop-erty in a very good location) as well as the difficult economic situa-tion and unattractive interest rates for forint loans are inhibiting the sale of apartments.
According to the Otthon Centrum database, around 2,200 new-build apartments were sold in Budapest in 2011. In the first half year of 2012, there were registered transactions of 1,000 apartments, based on which it can be expected that sales will reach a similar level by the end of the year as in the previous year.
There has been hardly any change in the number of apartments on the market remaining unsold. The level in H1 2012 was around 3,200 apartments – the same as in 2010 and 2011. Although in 2009 and 2010 there were signs of a reduction in vacancies, this trend has recently slowed again.
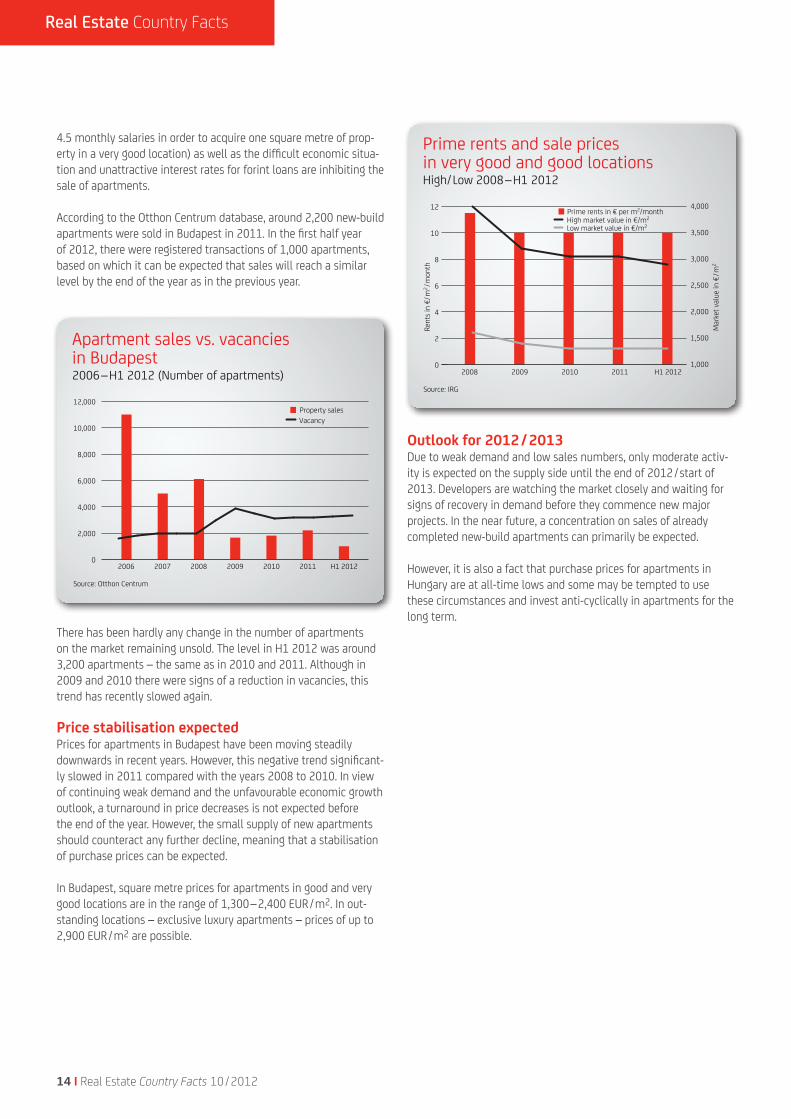
Price stabilisation expectedPrices for apartments in Budapest have been moving steadily downwards in recent years. However, this negative trend significant-ly slowed in 2011 compared with the years 2008 to 2010. In view of continuing weak demand and the unfavourable economic growth outlook, a turnaround in price decreases is not expected before the end of the year. However, the small supply of new apartments should counteract any further decline, meaning that a stabilisation of purchase prices can be expected.
In Budapest, square metre prices for apartments in good and very good locations are in the range of 1,300–2,400 EUR/m2. In out-standing locations – exclusive luxury apartments – prices of up to 2,900 EUR/m2 are possible.
Outlook for 2012/2013Due to weak demand and low sales numbers, only moderate activ-ity is expected on the supply side until the end of 2012/start of 2013. Developers are watching the market closely and waiting for signs of recovery in demand before they commence new major projects. In the near future, a concentration on sales of already completed new-build apartments can primarily be expected.
However, it is also a fact that purchase prices for apartments in Hungary are at all-time lows and some may be tempted to use these circumstances and invest anti-cyclically in apartments for the long term.
Apartment sales vs. vacanciesin Budapest 2006–H1 2012 (Number of apartments)
2006 2007 2008 2009 2010 2011 H1 20120
2,000
4,000
6,000
8,000
10,000
12,000
VacancyProperty sales
Source: Otthon Centrum
Prime rents and sale prices in very good and good locations High/Low 2008–H1 2012
2008 2009 2010 2011 H1 2012
Rent
s in
€/m
2 /mon
th
Mar
ket v
alue
in €
/m2
0
2
4
6
8
10
12
1,000
1,500
2,000
2,500
3,000
3,500
4,000
High market value in €/m2
Low market value in €/m2
Prime rents in € per m2/month
Source: IRG

Real Estate Country Facts 10/2012 I 15
Bank Austria
Real EstateGünter Hofbauer Tel: + 43 (0)50505-57488 [email protected]
Werner Zimmel Tel: + 43 (0)50505-62600 [email protected]
Anton Höller Tel: + 43(0)50505-55980 anton.hö[email protected]
UniCredit Bank Hungary
Real Estate FinanceGabor VörösTel: +36 (1)301-5555 [email protected]
Gábor Pető Tel: +36 (1) 301-5602 [email protected]
Bank Austria
Real Estate ResearchKarla SchestauberTel: + 43 (0)[email protected]
Immobilien Rating GmbH (IRG)
Market ResearchDoris TomschizekTel: + 43 (0)50601-51871doris. [email protected]
Alexander StögbauerTel: + 43 (0)[email protected]
Helmut Schneider Tel: + 43 (0)[email protected]
UniCredit – Public Affairs
Political StudiesAngelica Attolico Tel: + 39 (0)66707-8277 [email protected]
Contacts:
Authors: