
COMMERCIAL POTENTIAL OF KITUMBA COPPER PROJECT ...
21
Blackthorn Resources Limited ABN 63 009 193 980 Level 5, Suite 502, 80 William Street, Sydney NSW 2011, Australia t +61 2 9357 9000 f +61 2 9332 1336 www.blackthornresources.com.au 10 September 2013 COMMERCIAL POTENTIAL OF KITUMBA COPPER PROJECT DEMONSTRATED IN PREFEASIBILITY STUDY – OPTIMISATION WORK INITIATED TARGETING SIGNIFICANT VALUE ENHANCEMENT OPPORTUNITIES KEY POINTS The Prefeasibility Study (PFS) demonstrates positive potential for an economically and technically viable project. The PFS timing has been critical to provide for preparation of a Mining Licence application to the Zambian Government, and the positive results clearly justify further work being undertaken, including detailed project optimisation. An underground operation targeting the high-grade core of the deposit has been chosen as the preferred base case as it has a lower capital cost and higher capital efficiency than a larger scale open pit mine. Work to commence immediately on project optimisation focussing primarily on metallurgical recovery and mining sequence that has potential for enhanced economics. This optimisation work will also be based on an updated Mineral Resource that incorporates recent high-grade drilling results, and is expected to lead to a PFS update in early 2014. Summary results (not yet optimised): • Underground mine with 11 years mine life, 33 million tonnes of mineable ore with 572,000 tonnes of contained copper. • Annual ore production of approximately 3 million tonnes Run of Mine (ROM) to a combination of flotation and solvent extraction and electrowinning (SXEW) plant to produce an annual average of approximately 39,000 tonnes copper. Annual copper metal production ranges from 36,000 tonnes in early years 1 ramping up to 40,000 tonnes in the latter years 2 . • Life of mine average C1 cash cost estimate of US$2.04/lb of Cu metal 3 Project development cost estimated at US$358 million, including US$34.2 million contingency. 1. Average production over first 4 years 2. Average production Years 5 - 11 3. Includes cost of mining, processing and SXEW costs, administration, overheads, transport and logistics of concentrate to smelter, treatment & refining charges. Excludes royalties and taxes.
Transcript of COMMERCIAL POTENTIAL OF KITUMBA COPPER PROJECT ...

Blackthorn Resources Limited ABN 63 009 193 980 Level 5, Suite 502, 80 William Street, Sydney NSW 2011, Australia
t +61 2 9357 9000 f +61 2 9332 1336 www.blackthornresources.com.au
10 September 2013
COMMERCIAL POTENTIAL OF KITUMBA COPPER PROJECT DEMONSTRATED IN PREFEASIBILITY STUDY – OPTIMISATION WORK INITIATED TARGETING SIGNIFICANT VALUE ENHANCEMENT OPPORTUNITIES KEY POINTS
The Prefeasibility Study (PFS) demonstrates positive potential for an economically and technically viable project. The PFS timing has been critical to provide for preparation of a Mining Licence application to the Zambian Government, and the positive results clearly justify further work being undertaken, including detailed project optimisation.
An underground operation targeting the high-grade core of the deposit has been chosen as the preferred base case as it has a lower capital cost and higher capital efficiency than a larger scale open pit mine.
Work to commence immediately on project optimisation focussing primarily on metallurgical recovery and mining sequence that has potential for enhanced economics. This optimisation work will also be based on an updated Mineral Resource that incorporates recent high-grade drilling results, and is expected to lead to a PFS update in early 2014.
Summary results (not yet optimised):
• Underground mine with 11 years mine life, 33 million tonnes of mineable ore with 572,000 tonnes of contained copper.
• Annual ore production of approximately 3 million tonnes Run of Mine (ROM) to a combination of flotation and solvent extraction and electrowinning (SXEW) plant to produce an annual average of approximately 39,000 tonnes copper. Annual copper metal production ranges from 36,000 tonnes in early years1 ramping up to 40,000 tonnes in the latter years2.
• Life of mine average C1 cash cost estimate of US$2.04/lb of Cu metal 3
Project development cost estimated at US$358 million, including US$34.2 million contingency.
1. Average production over first 4 years 2. Average production Years 5 - 11 3. Includes cost of mining, processing and SXEW costs, administration, overheads, transport and
logistics of concentrate to smelter, treatment & refining charges. Excludes royalties and taxes.

2
Economic evaluation using US$3.50/lb4 Cu price delivers a post-tax real IRR of 12.7% and an NPV of US$108M5 with an annual average EBITDA of approximately US$105M once the project is at full production.
Work is underway to prepare Mining Licence application for submission to the Mining Ministry of Zambia. The PFS has been based on the April 2013 Mineral Resource Statement. Work has also been initiated to calculate the Project’s maiden Ore Reserve Statement.
Blackthorn Resources is committed to progress the development of the Kitumba asset, and is currently formulating a ‘Path to Production’ strategy that will incorporate management of critical financing, project implementation and organisational development risks.
Following completion of the optimisation studies, submission of the mining licence application and strategic planning for the “Path to Production”, the next phase of the project will be implementation of an investment-grade Feasibility Study expected to commence early 2014. A process to select key consultants for the next phase of Feasibility Study will commence in the near future.
Blackthorn Resources Limited (ASX: BTR) (“the Company” or “Blackthorn Resources”) is pleased to announce the results from the Prefeasibility Study (“PFS” or “Study”) for its 100% owned Kitumba Copper Project (the “Project”) located in Zambia (see Figure 1).
The PFS results confirm the potential for a commercial project with an average production rate of approximately 39,000 tpa copper for a period of 11 years.
Managing Director Scott Lowe said:
“The completion of the PFS for the Kitumba Project along with identification of optimisation and value enhancement potential is a very important milestone for the Company and the latest in a series of positive developments since BHP Billiton exited the JV just two years ago. We have chosen a smaller scale underground operation rather than a much larger scale open pit as this allows us to target the higher grade zone much earlier, and to avoid expensive and time-consuming pre-strip. The economic comparison clearly showed that the internal rate of return is better for the underground scenario with a significantly lower pre-production capital cost.
The timing of this PFS has been very important for preparation of a mining licence. Looking ahead we see potential to further improve the business case for the Project through optimisation work focussed on metallurgical recoveries and mining sequence. We are also looking forward to a Mineral Resource update later in the year incorporating the excellent drilling results we recently announced, and working towards a maiden Ore Reserve Statement.
In summary, the Kitumba PFS represents a Project that has sound technical feasibility and economic potential, along with “upside” possible through optimisation. The copper market continues to be firm in what is a very volatile international business environment and the Kitumba Project will be well positioned to take advantage of what many analysts are forecasting to be higher copper prices in the medium term. Beyond Kitumba, there remains the possibility of further discoveries on the Mumbwa Project (approximately 1,000 sq. km held in 5 licences) and we are currently reviewing our exploration plans.
Our immediate priorities are to work through the optimisation exercise while examining a range of strategic alternatives for the Project to map out the “Path to Production” that is in the best interests of shareholders.”
4. Wood Mackenzie long term copper price forecast 5. Discount rate 8% real

3
Project Overview
Blackthorn Resources’ Kitumba Project is located in west central Zambia, approximately 200 km west of the capital, Lusaka. It is currently the main focus of activity within the larger exploration property, Mumbwa, which comprises five exploration licences covering approximately 1,036 sq. km.
The Mumbwa Project, previously held in joint venture with BHP Billiton (BHPB), is now owned 100% by Blackthorn Resources with BHPB retaining a 2% production royalty (Production Royalty) following its decision in 2011 to exit from direct involvement in the Mumbwa Project.
Following on from the positive drilling results and the Scoping Study outcomes issued in mid-2012, Blackthorn Resources committed to a PFS of the Kitumba Project in late 2012.
The Company engaged an independent consultant, Lycopodium Minerals Qld Pty Ltd to manage the PFS in conjunction with a number of other specialist consultants.
The PFS is based on the geological model completed by MSA Group (MSA) in April 2013. MSA also prepared a Mineral Resource Statement in accordance with “The Australasian Code for Reporting of Exploration Results, Mineral Resources and Ore Reserves, the JORC Code, 2004 edition” (JORC Code). Mineral Resources as at April 2013 were estimated at 108.9 Mt at a 0.5% Cu cut-off, comprising 87.6 Mt @ 1.17% Cu of Indicated Mineral Resource and 21.3 Mt of Inferred Mineral Resource at 0.77% Cu.
Both open pit and underground mining strategies were assessed by RungePincockMinarco Limited (RPM) as part of the PFS. This assessment ranked a range of development options based on economics, risk and mining development capital.
The assessment demonstrated an underground mining method, with ore extraction using sub-level caving (SLC) to be most appropriate for the PFS. A sublevel open stoping (SLOS) mining method with full cemented paste backfill for maximum ore extraction was also considered, but rejected due to the cost savings associated with sub-level caving.
A 3 million tonnes per annum production rate at a stope design cut-off grade of 2.0% Cu was chosen as the preferred mining strategy. Contractor mining was selected over owner mining to provide maximum flexibility for mine start-up. This results in a production mine life of 11 years, producing an average of 39,000 tonnes of copper per annum.
The mined ore is designed to be processed via a concentrator to produce a copper concentrate which may then be acid leached to provide feed solution to the SXEW. Residue from the leached concentrate will then be processed to produce approximately 24,000 tonnes per annum of copper concentrate at 25% Cu.
The SXEW plant treats the pregnant liquor (copper rich solution) resulting from the acid leaching of the bulk flotation concentrate to produce an average of approximately 33,000 tonnes per annum of copper.
The PFS Base Case assumes that the cathode will be sold direct to customers, while the concentrate will be transported to copper smelters within Zambia for treatment and refining.

4
Figure 1: Kitumba Project – Regional Location Plan
Key economic and planning outcomes from the PFS are as follows:
Key Element Base Case Results
Nominal production rate (ROM) 3 million tonnes
Average Cu Production over Life of Mine 39,000 tonnes Cu
Mine Life 11 years
Cu Head Grade 1.7%
Initial Capital Expenditure US$ 358 million (including contingency)
Additional Life of Mine Capital Expenditure * US$ 75 million
Average LOM Cash cost / lb Cu (C1) US$ 2.04
Overall Cu Recovery Approx. 76%
Real post-tax Internal Rate of Return (100% ungeared equity basis)
12.7%
Post-tax NPV8 US$108M
Average Annual EBITDA Approx. US$105M
* Includes capital for underground mine development and rehabilitation
The PFS, together with the Environmental Impact Assessment (EIA) that has also recently been completed, will provide the necessary support for a Mining Licence Application.

5
Looking ahead
Now that the PFS work has been completed, demonstrating potential for a technically and economically sound project, the Company is working on the next phase of advancement and value adding activities.
There is considerable opportunity for the Project economic metrics to be improved and optimisation work around the key areas of metallurgy and copper recovery, mining sequence and geotechnical understanding will soon be initiated.
Optimisation
i) Metallurgy and recoveries
Further metallurgical test work will be undertaken on additional ore samples collected during the recently completed Phase 7 exploration program. An independent metallurgist will be commissioned to manage the test work program and examine opportunities for optimising the metallurgical process design, reducing costs and increasing recovery for each material type.
ii) Mineral Resources & Ore Reserves
The PFS has been based on the April 2013 Mineral Resources Statement with 100% of the ore mined being from Mineral Resources in the Indicated category. Recent drilling on the Project has been designed to further improve the confidence of the Mineral Resource and to advance some Mineral Resources to the Measured category. An updated Mineral Resource Statement is expected later in the year. Work has also been initiated with the aim of announcing the Project’s maiden Ore Reserve Statement.
iii) Mining sequence
The current production schedule indicates that the ore grade peaks mid-mine life. A revised mining plan will assess opportunities to modify the production sequence to smooth out the mined grade over the production life and ensure consistent feed quality to the processing plant. The optimisation will also encompass development schedule optimisation to provide the “best fit” with the chosen production strategy.
Feasibility Study
Following the optimisation, work on the next stage of development will involve additional drilling and completion of an investment-grade Feasibility Study. The timing of the Feasibility Study will be driven by the optimisation and our “Path to Production” business strategy.
Business Strategy and the “Path to Production”
In parallel with work to advance and improve the Project, Blackthorn Resources is also considering a range of medium term strategic alternatives to progress the Project along the “Path to Production” in a way that maximises shareholder value. To this end the Company intends to engage independent advisors to assist with identification and evaluation of strategic alternatives, principally for managing finance, project execution and organisation capability development risks. In addition to identifying strategic alternatives for the medium term development of Kitumba, the Company will review organisational requirements to match the chosen strategy. The optimisation work and strategy review are expected to be completed by early 2014, prior to commitment to the Feasibility Study.

6
Mineral Resources
The 2013 Mineral Resource Estimate (MRE) was prepared by MSA and incorporated both the Phase 6 drilling program completed in early 2013 and the exploration database created over more than 10 years of previous field programs.
Field operating protocols meeting international reporting standards were implemented and audited throughout the Phase 6 drilling program.
The MRE was conducted using CAE Studio 3 software, together with Microsoft Excel and Snowden Supervisor for data analysis.
The MRE is reported above a base case cut-off grade of 0.5% Cu and has been classified as either Indicated or Inferred Mineral Resource in accordance with the guidelines of the 2004 edition of the JORC Code.
The maximum depth of the reported Mineral Resource is approximately 630 m below surface. No Mineral Resources occur above the stated 0.5% Cu cut-off grade within 100 m of surface.
The Mineral Resource is shown in (Table 1).
Table 1: Kitumba Mineral Resource# above a Cut-off Grade of 0.5% Cu, as at 8 April 2013
Category Tonnes Cu Acid Soluble Cu
Co Au Ag Density
(Millions) % % ppm g/t g/t t/m3
Supergene Domain
Indicated 58.6 1.22 0.54 141 0.04 0.86 2.58
Inferred 12.3 0.67 0.14 91 0.03 0.46 2.58
Hypogene Domain
Indicated 28.9 1.05 0.15 217 0.03 0.86 2.87
Inferred 9.1 0.91 0.13 132 0.08 0.47 2.86
Combined Domain
Indicated 87.6 1.17 0.41 166 0.03 0.86 2.67
Inferred 21.3 0.77 0.14 108 0.05 0.46 2.70
Total 108.9 1.09 0.36 155 0.04 0.78 2.67
# All tabulated data has been rounded to one decimal place for tonnage and to either no or two decimal places for grades.

7
In order to illustrate the sensitivity of the Mineral Resource to cut-off grade, the Mineral Resource is presented at a variety of cut-off grades in the following tables for Indicated and Inferred Mineral Resources respectively.
Kitumba Indicated Mineral Resource# by Cut-off Grade, as at 08 April 2013
Cut-off Grade
Tonnes Cu Acid Soluble Cu
Co Au Ag Density
(Cu%) (Millions) % % ppm g/t g/t t/m3
0.20 258.2 0.60 0.19 131 0.04 0.80 2.68
0.35 146.9 0.87 0.29 153 0.03 0.77 2.68
0.50 87.6 1.17 0.41 166 0.03 0.86 2.67
1.00 29.8 2.13 0.83 203 0.03 1.03 2.67
1.40 21.7 2.49 0.98 208 0.03 1.04 2.65
# All tabulated data has been rounded to one decimal place for tonnage and to either no or two decimal places for grades.
Kitumba Inferred Mineral Resource# by Cut-off Grade, as at 08 April 2013
Cut-off Grade
Tonnes Cu Acid Soluble Cu
Co Au Ag Density
(Cu%) (Millions) % % ppm g/t g/t t/m3
0.20 146.6 0.36 0.06 92 0.04 0.58 2.74
0.35 43.9 0.59 0.12 108 0.05 0.49 2.69
0.50 21.3 0.77 0.14 108 0.05 0.46 2.70
1.00 3.5 1.39 0.12 148 0.04 0.37 2.95
1.40 2.0 1.55 0.09 152 0.04 0.37 2.96
# All tabulated data has been rounded to one decimal place for tonnage and to either no or two decimal places for grades.

8
Mining
To define a base case mining option for the PFS, both open cut and underground mining strategies were analysed with development options ranked on IRR, capital expenditure, NPV, risk and strategic suitability for Blackthorn Resources. (The economic comparison of underground and open pit options was undertaken at a strategic level suitable for ranking purposes only, and not for defining detailed project economics).
RPM evaluated a range of mining methods including open cut mining, underground sub-level open stoping (SLOS) and sub-level caving (SLC). Following extensive analysis, SLC targeting a 3 Mtpa ROM production rate at a stope design cut-off grade of 2.0% Cu was selected as the preferred mining method as it provided the best economic outcome.
This strategy reflects a preference for the higher rates of return and a lower establishment capital expense associated with an underground project.
Based on the geometry and shape of the resource geological model, the PFS determined that SLC is a cost effective and productive extraction methodology, allowing for maximum resource extraction and not requiring the use of back-fill. Figure 2 illustrates the proposed mine design.
The SLC design work is based on Geotechnical analysis conducted by Pells Sullivan Meynink Pty Ltd (PSM), through the processing of borehole data including RQD (rock quality designation), field strength and defect characterisation. Further geotechnical work is required for future feasibility studies, with some work having already been commenced for the optimisation study.
Preliminary haulage modelling based on the use of “60 t class” trucks and a production rate of 3 Mtpa indicated that a peak fleet size in the order of 9 trucks and 6 loaders will be required. By opting for a dual decline arrangement, productivity reductions due to having a high number of trucks on a single access haul route have been negated, enabling production targets to be met without incurring the capital cost associated with establishing a hoisting shaft or a conveyor system.
Mining related capital costs including pump stations, surface fans, portal construction, ventilation shafts, and sustaining capital related to mining have been estimated based on quotations from suppliers, quotations from contractors, or from internal estimates based on the RPM internal database. The most significant mining capital expenditure relates to capital development and haulage which has been established based on a mining schedule developed by RPM and unit-rate costs provided by Australian and African based mining contractor, Barminco.
9
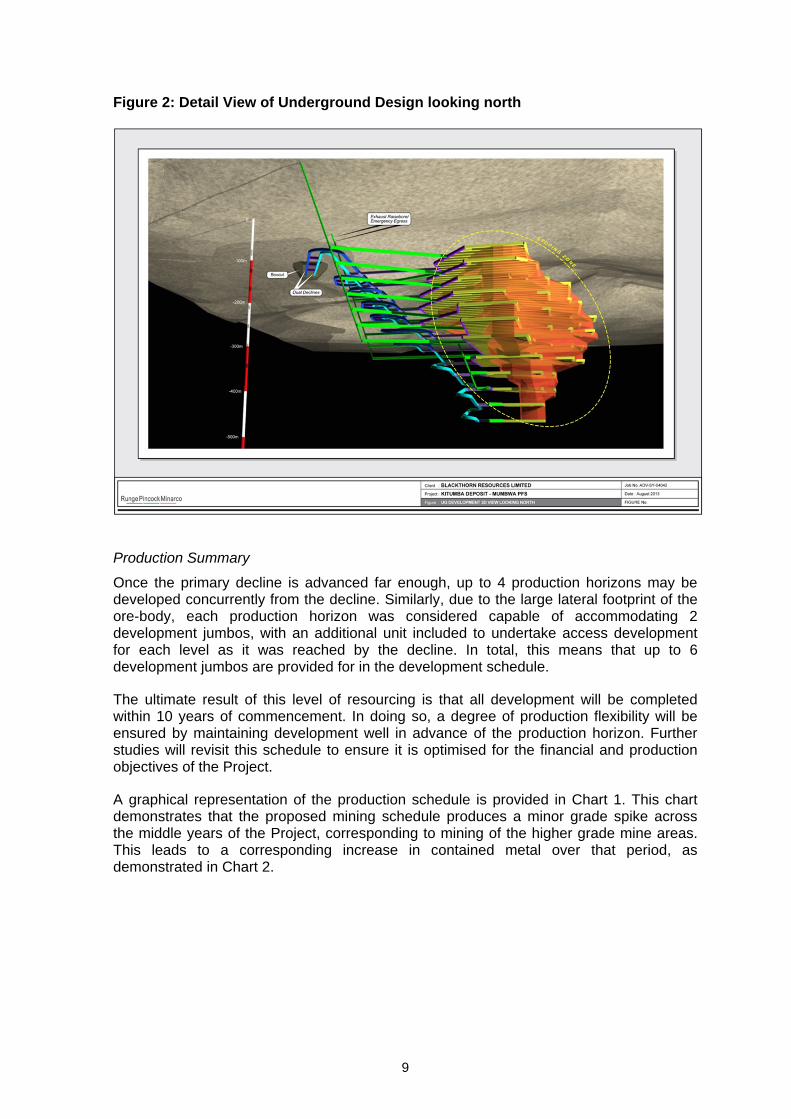
Figure 2: Detail View of Underground Design looking north
Production Summary
Once the primary decline is advanced far enough, up to 4 production horizons may be developed concurrently from the decline. Similarly, due to the large lateral footprint of the ore-body, each production horizon was considered capable of accommodating 2 development jumbos, with an additional unit included to undertake access development for each level as it was reached by the decline. In total, this means that up to 6 development jumbos are provided for in the development schedule.
The ultimate result of this level of resourcing is that all development will be completed within 10 years of commencement. In doing so, a degree of production flexibility will be ensured by maintaining development well in advance of the production horizon. Further studies will revisit this schedule to ensure it is optimised for the financial and production objectives of the Project.
A graphical representation of the production schedule is provided in Chart 1. This chart demonstrates that the proposed mining schedule produces a minor grade spike across the middle years of the Project, corresponding to mining of the higher grade mine areas. This leads to a corresponding increase in contained metal over that period, as demonstrated in Chart 2.

10
Chart 1 - Ore Production Schedule
Chart 2 - Summary Contained Copper Schedule

11
Metallurgy and Process Flow Sheet Development
Five diamond drill holes of the Phase 6 Drilling program provided the PFS metallurgical test-work samples.
The metallurgical test program was specified to provide key metallurgical design criteria to enable flow sheet selection and equipment sizing to a PFS level of accuracy.
A limited set of heavy liquid tests were proposed to evaluate possible ore beneficiation prior to milling.
Assay of feeds, concentrates and tailings were carried out to provide quantitative results for recovery and concentrate grades.
QEMSCAN evaluation of feed composite material was conducted to identify natural grain sizes and mineralogy to provide an indication of comminution extent for liberation, including concentrate regrind, and likely gangue materials.
The initial flow sheet selected for the PFS was based on the Scoping Study, namely a conventional copper sulphide copper oxide mineral concentrator, producing a single mixed sulphide oxide concentrate for sale. This flow sheet incorporated a Controlled Potential Sulphidisation (CPS) rougher flotation step where flotation of the oxide minerals is promoted by the addition of sodium hydrosulphide (NaSH).
As the test work progressed, it became apparent that this flow sheet would not provide an optimum outcome, at which time six alternative flow sheets were considered.
Following a ranking method that considered capital cost, operating cost, recovery and net revenue, a “Rougher Concentrate/ Leach” flow sheet providing an overall copper recovery of approximately 76% was selected as the base case for the PFS design, illustrated in Figure 3.
Process Plant
The process plant design is based on two key parts:
a concentrator producing approximately 24,000 tpa of 25% copper concentrate, and a solvent extraction electrowinning plant (SXEW) producing approximately 33,000 tpa
of copper cathode.
The concentrator will produce a copper concentrate which will then be acid leached to provide feed solution to the SXEW. Residue from the leached concentrate will then be processed to produce a copper concentrate.
The SXEW plant will treat the pregnant liquor (copper rich solution) resulting from the acid leaching of the bulk flotation concentrate to produce copper cathodes.
The initial plant design, mass balance and flow sheet were based on the processing of ore from a SLOS (sub-level open stoping) underground mining operation at a rate of 2.5 Mtpa.
Towards the end of the PFS, the SLC mining method at a production rate of 3 Mtpa was considered and subsequently adopted as the basis for the PFS, as it provided improved economics for the Project. The feed grade was estimated at 1.7% Cu compared with 2.0% Cu for the SLOS case.

12
Figure 3: Kitumba PFS flow sheet
Factored capital costs* and operating costs have been prepared for the 3 Mtpa SLC option.
The processing route remains the same for the increased throughput as does the size of the SXEW. However, to allow for the increased ROM feed rate, (375 tph compared to 312.5 tph), the following changes were made in the milling, flotation, leaching and neutralisation areas:
Larger SAG and Ball Mills with larger drive motors (6 MW as opposed to the original 5 MW selections)
One additional flotation cell in each of bank of sulphide rougher, oxide rougher and secondary sulphide rougher cells
Larger agitator drives for the concentrate leach surge tank, concentrate leach tanks, leach filter feed surge tank and neutralisation tanks.
*(reduced capital accuracy for the process plant)

13
The overall design of the process plant reflects:
Proved and reliable unit processes. A compact and accessible process plant layout serviced by mobile equipment. Maximum use of gravity for transport of slurry and tailings streams where possible,
to reduce pumping costs. A control philosophy that encompasses a low to moderate level of instrumentation
and control to minimise capital cost.
Underlying the engineering design philosophy is the requirement to minimise capital cost and the complexity of the flow sheet, whilst retaining as much operational flexibility as possible, and without compromising safety.
Water Supply
Specialist hydrogeological consultants were commissioned to develop a suitable water supply for the Project. The water modelling indicates that the site is water negative with a portion of the make-up water required from offsite sources (i.e. bore fields). Maximum water requirement from supplementary sources is estimated to be 14 l/sec. It is expected that this requirement can be supplied from bores surrounding the underground workings. A series of storage ponds and the tailings storage facility (TSF) will provide sufficient storage under all expected weather and production conditions. Three possible locations for water storage, using cross valley embankments, have been identified.
Mine Waste
The underground mine and process plant will produce waste rock and process tailings on a continuing basis. The former will be stored on a waste rock dump (WRD) and the tailings managed within a tailings storage facility (TSF). Water storage and other infrastructure will also be required as shown in Figure 4.
Support Infrastructure and Facilities
Daily operations will be supported by a total services infrastructure shown in Figure 5, including offices, stores and warehousing, laboratory and mine change rooms.
Accommodation for the construction and operations work force will be provided in a 450 room permanent village located adjacent to the existing exploration camp.
Access to the plant, mine and accommodation village will be controlled by security check points. The plant and mine access will be via a common access road and security gate, with separate access and control for vehicles and pedestrians.
The site will be fully fenced with an appropriate level of fencing to prevent access of wild animals.
Site Access
The site is accessed via 52 km of dirt road from Mumbwa. The road is generally in poor condition and will require upgrading to allow for construction traffic and ultimately operations traffic.
The Zambian government has recently announced its intention to upgrade the public portion of this road, and the PFS assumes that this will be done at no cost to the Project and in time for construction traffic.

14
Power Supply
Blackthorn Resources is negotiating with ZESCO, the Zambian national electricity provider, for the provision of power from the grid to the Project. The basis for the PFS is that the high voltage supply for the Kitumba Project will be sourced via a spur line off the proposed Northwest 330 kV power line interconnecting the Mumbwa substation and Kalumbila substation. This proposed new power line is part of the power supply for the First Quantum Sentinel project.*
Project Implementation
The Project implementation strategy assumed for the PFS is based on an EPCM approach. This will be a key consideration for the Feasibility Study.
Environmental and Social Impact
A specialist consultant has investigated the feasibility of the Project from an environmental and social impact management perspective, and facilitated the environmental impact assessment processes required under Zambian law and in accordance with the principles of sustainable development.
An Environmental Project Brief (EPB) was submitted to the Environmental Council of Zambia (ECZ) which is now known as the Zambia Environmental Management Agency (ZEMA) on 22 April 2010. The EPB was approved in a letter dated 28 May 2010.
Subsequently the Terms of Reference (ToR) for an Environmental Impact Assessment (EIA) was approved by ZEMA.
A draft Environmental Impact Study (EIS) in accordance with the approved ToR and the authorisation process for the proposed mining activities in terms of the relevant environmental legislation is currently in progress.
An environmental baseline investigation of the Project site and its surroundings was completed during 2012. The purpose of the baseline assessment was to obtain a better understanding of the broader Project context in order to facilitate and expedite subsequent processes associated with the Project, along with the identification of any potential adverse Project parameters so that these could have been addressed early in the Project planning.
As a result of these work programs, the PFS has incorporated the existing socio-economic and biophysical environments of and around the proposed Project site.
The PFS work has identified significant employment and related economic opportunities for the local population.
* Source – Zesco presentation to Zimec conference Lusaka, June 2012, and Company discussion with Zesco.

15
Figure 4: Overall Site Plan

16
Figure 5: Process Area, Mine Decline & Accommodation Camp

Operations
The Project is based on a full operations team based at site with a support office based in Lusaka. A workforce in excess of 420 persons is envisaged, including mine contractor personnel.
There will be an emphasis on employing Zambian nationals and residents, with the minority of positions being occupied by expatriates.
Sales and Marketing
Blackthorn Resources commissioned Base Metals Marketing Services Ltd (BMMS) to conduct a copper concentrates market study to examine the future market for the concentrates and cathodes to be produced, as well as an assessment of transport, and treatment and refining charges.
The outcomes of the BMMS study have been included in the financial modelling for the Project.
Capital Costs for the Project
CAPITAL ITEM Pre-Production
(US$M)
Mining
Pumps 1.0
Surface Fans 3.0
Portal Construction 1.5
Capital Development 62.9
Capital Haulage 7.7
Contingency 0.5
Processing Plant & Infrastructure
Process Plant 170.2
Tailings Dam 8.0
Admin & Infrastructure 41.2
Other 28.1
Contingency 33.6
Total Capital Cost 357.7

Operating Costs for the Project
COST ITEM UNIT COST USD/t ROM
USD/t Cu
USD/lb Cu
Operating Development (incl. Haulage)
USD / m 5,150 5.8 453 0.21
Production Haulage USD / t km 2.85 11.7 911 0.41 Drill, Blast, Load USD / t ore 14.0 13.1 1,015 0.46
Total Mining Cost USD / t ore 30.7 30.7 2,379 1.08
Power USD / t ore 7.14 7.1 554 0.25 Processing, Treatment, Refining and Transport
USD / t ROM 18.7 1,454 0.66
Administration USD / t ore 1.46 1.5 113 0.05 Sub-total Excluding Gov’t Royalties & Gov’t Charges
USD / t ROM 58.0 4,501 2.04
Risk Analysis
A risk analysis was undertaken to identify, analyse and formulate Project risk mitigation plans.
A risk workshop was held and all PFS participants contributed either by presence or written submission. Project risks were identified and quantified using a systematic approach, which:
Identified 82 Project-critical risks that could impact the success of the Project or potentially stop the Project.
Assigned an associated consequence and likelihood to risks, enabling risks to be prioritised. The combination of these two dimensions provided an overall risk rating.
No risks were identified in this process that could potentially prevent development of the Project.
The Project Risk Analysis will occur on a continuing basis throughout development of the Project. It is anticipated that new risks and other previously identified risks will emerge at each ‘new’ analysis. This is an iterative process and will enable the correct actions to be assigned to enable the risk to be managed.

Financial Analysis
RungePincockMinarco (RPM) has prepared a financial model for the Project using RPM’s proprietary financial modelling software, XERAS.
All results are based on a “real” constant dollar basis. (i.e., costs have not been inflated). Input data came from a variety of sources, including previous RPM work for the Project, external mining contractors, Blackthorn Resources and other members of the PFS team.
The financial model is based on the PFS strategy of the underground mining operations being contractor-operated, with Blackthorn Resources providing supervision and all other technical and management aspects of the Project.
Mine operating costs were developed from first principles with key physical inputs from the production schedule. These costs were benchmarked against current mining contractor rates and found to be reasonable. Non-mining operating costs were determined principally by Lycopodium, with contributions from Blackthorn Resources and other PFS team members.
In parallel, a capital expenditure schedule was developed to create a total cash outflow schedule for the Project.
Project revenue was determined using the quantities of copper cathode and copper concentrate developed in the PFS and sold at the associated sales price estimate. Sales prices, marketing, transportation, treatment charges and refining charges were provided by Blackthorn Resources.
Capital costs have been identified as initial (pre-production) and sustaining capital.
All capital costs, operating costs and revenues developed in the PFS as well as provision for Government royalties and an allowance for purchasing the Production Royalty, were inputs for the XERAS Financial Model.
Results of cash flow analysis are given in Table 2.
The Economic Model assumed the cash outflows for construction commence Year 1. The model considered cash flows from this point in time, with all previous expenses considered sunk costs. As per a standard PFS, the level of accuracy is in the area of +/-25% for CAPEX and for OPEX. More detailed technical studies following further upgrading of the Mineral Resource estimate will increase accuracy and confidence in the Project costs. This would include obtaining budget quotations from equipment suppliers. The key outputs of the financial evaluation for life of mine are summarised in Table 3.

Table 2: Key Statistics of the Financial Evaluation
METRIC STATISTIC
ROM Tonnes (Mt) 33.5
Head Grade (% Cu) 1.7
Recovered Cu Metal (kt) 432
Recovered Cu Metal (mlb) 953
Recovered Cu Metal (kt/yr) 39
Post-tax NPV @ 8% Discount Rate (USD M)
108
Post-tax real IRR (%) 12.7%
Development capital (USD M) 358
Total LOM capital incl. sustaining and mine rehab (USD M)
433
Mine Life 11
Mine Life (Total) 13
C1 Cash Cost (USD/lb Cu) 2.04
C1 Cash Cost (USD/t Cu) 4,501
Table 3: Project Sensitivity to Cu Price
COPPER PRICE Post-tax NPV8 (US$)
Post-tax IRR
$3.85/lb (Upside Case) 234M 17.9%
$3.50/lb (Base Case) 108M 12.7%
$3.30/lb (Current Spot) 35M 9.6%
Should you require further information please contact: Scott Lowe Managing Director Ph: + 61 2 9357 9000

ATTRIBUTION The information in this report which relates to mining analysis is based on information compiled by Mr Joe McDiarmid, who is a Chartered Professional member of The Australasian Institute of Mining and Metallurgy (MAusIMM). Mr McDiarmid has17 years’ experience in resource evaluation, mine planning and operations and is a full-time employee of RungePincockMinarco Limited. Mr McDiarmid by virtue of his education, experience and professional association is considered a Competent Person as defined by the 2004 Edition of the ‘Australasian Code for Reporting of Exploration Results, Mineral Resources and Ore Reserves’. Mr McDiarmid has verified that relevant data disclosed herein reflects the mining outcomes of the PFS and consents to the inclusion in this report of the matters based on his information in the form and context in which it appears.
ATTRIBUTION The information in this report which relates to Mineral Resources at the Mumbwa Project in Zambia is based on information compiled by Mr Jeremy C Witley, BSc (Hons), Pr.Sci.Nat., who is a member of The Geological Society of South Africa, which is a ‘Recognised Overseas Professional Organisation’ (‘ROPO’). Mr Witley has more than 20 years’ experience in base and precious metals exploration, mining geology and mineral resource estimation and is a Principal Consultant with the MSA Group. Mr Witley has sufficient experience, which is relevant to the style of mineralisation and type of deposit under consideration, to qualify as a Competent Person as defined in the 2004 Edition of the ‘Australasian Code for Reporting of Exploration Results, Mineral Resources and Ore Reserves’. Mr Witley has consented to the inclusion in this report of the matters based on his information in the form and context in which it appears.
ATTRIBUTION Dr Geoff Duckworth B.Eng. (Chem), M.Eng.Sc, PhD, FIChemE, MIEAust, RPEQ 2702, Study Manager for the PFS and Registered Professional Engineer, Qld, has, on behalf of Lycopodium Minerals Qld Pty Ltd, consented to the inclusion in this report of those matters prepared by Lycopodium relating to the process metallurgy, process plant design, process plant capital cost estimate and process plant operating cost estimate.
This announcement includes certain “forward-looking statements”. All statements other than statements of historical fact, included herein, including, without limitation, statements regarding future plans and objectives of the company, are forward-looking statements that involve various risks, assumptions, estimates and uncertainties. These statements reflect the current internal projections, expectations or beliefs of the company and are based on information currently available to the company. There can be no assurance that such statements will prove to be accurate, and actual results and future events could differ materially from those anticipated in such statements. All of the forward looking statements contained in this announcement are qualified by these cautionary statements and the risk factors described above.
An investment in the company is speculative due to the nature of the company's business. The ability of the company to carry out its growth initiatives as described in this announcement is dependent on the company obtaining additional capital. There is no assurance that the company will be able to successfully raise the capital required or to complete the growth initiatives described. Investors must rely upon the ability, expertise, judgment, discretion, integrity and good faith of the management of the company.