Battlefield Communication Solutions Enabled by Deploying Commercial-off-the-Shelf Technology
NASA/TM-2014-217395
Commercial Off-The-Shelf Graphics Processing Board
Radiation Test Evaluation Report
George A. Salazar
Johnson Space Center, Houston, Texas
Glen. F. Steele
Johnson Space Center, Houston, Texas
National Aeronautics and
Space Administration
Johnson Space Center
Houston, TX 77058
August 2014
NASA STI Program ... in Profile
Since its founding, NASA has been dedicated
to the advancement of aeronautics and space
science. The NASA scientific and technical
information (STI) program plays a key part in
helping NASA maintain this important role.
The NASA STI program operates under the
auspices of the Agency Chief Information
Officer. It collects, organizes, provides for
archiving, and disseminates NASA’s STI. The
NASA STI program provides access to the NASA
Aeronautics and Space Database and its public
interface, the NASA Technical Report Server,
thus providing one of the largest collections of
aeronautical and space science STI in the world.
Results are published in both non-NASA channels
and by NASA in the NASA STI Report Series,
which includes the following report types:
TECHNICAL PUBLICATION. Reports of
completed research or a major significant
phase of research that present the results of
NASA Programs and include extensive data
or theoretical analysis. Includes compilations
of significant scientific and technical data and
information deemed to be of continuing
reference value. NASA counterpart of peer-
reviewed formal professional papers but has
less stringent limitations on manuscript length
and extent of graphic presentations.
TECHNICAL MEMORANDUM. Scientific
and technical findings that are preliminary or
of specialized interest, e.g., quick release
reports, working papers, and bibliographies
that contain minimal annotation. Does not
contain extensive analysis.
CONTRACTOR REPORT. Scientific and
technical findings by NASA-sponsored
contractors and grantees.
CONFERENCE PUBLICATION. Collected
papers from scientific and technical
conferences, symposia, seminars, or other
meetings sponsored or co-sponsored
by NASA.
SPECIAL PUBLICATION. Scientific,
technical, or historical information from
NASA programs, projects, and missions,
often concerned with subjects having
substantial public interest.
TECHNICAL TRANSLATION. English-
language translations of foreign scientific
and technical material pertinent to
NASA’s mission.
Specialized services also include creating
custom thesauri, building customized databases,
and organizing and publishing research results.
For more information about the NASA STI
program, see the following:
Access the NASA STI program home page
at http://www.sti.nasa.gov
E-mail your question via the Internet to
Fax your question to the NASA STI Help
Desk at 443-757-5803
Phone the NASA STI Help Desk at
443-757-5802
Write to: NASA Center for AeroSpace Information
7115 Standard Drive
Hanover, MD 21076-1320

NASA/TM-2014-217395
Commercial Off-The-Shelf Graphics Processing Board
Radiation Test Evaluation Report
George A. Salazar
Johnson Space Center, Houston, Texas
Glen. F. Steele
Johnson Space Center, Houston, Texas
National Aeronautics and
Space Administration
Johnson Space Center
Houston, TX 77058
August 2014
The use of trademarks or names of manufacturers in this report is for accurate reporting and does not constitute an official endorsement, either expressed or implied, of such products or manufacturers by the
National Aeronautics and Space Administration.
Available from:
NASA Center for AeroSpace Information National Technical Information Service
7115 Standard Drive 5301 Shawnee Road
Hanover, MD 21076-1320 Alexandria, VA 22312
Available in electric form at http://ston.jsc.nasa.gov/collections/TRS
i
Abstract
Large round-trip communications latency for deep space missions will require more onboard
computational capabilities to enable the space vehicle to undertake many tasks that have traditionally
been ground-based, mission control responsibilities. As a result, visual display graphics will be required
to provide simpler vehicle situational awareness through graphical representations, as well as provide
capabilities never before done in a space mission, such as augmented reality for in-flight maintenance or
Telepresence activities. These capabilities will require graphics processors and associated support
electronic components for high computational graphics processing.
A preliminary test was performed on five commercial off-the-shelf (COTS) graphics cards in an effort to
understand the performance of commercial graphics card electronics operating in the expected radiation
environment. This paper discusses the preliminary evaluation test results of five COTS graphics
processing cards tested to the International Space Station low Earth orbit radiation environment. Three of
the five graphics cards were tested to a total dose of 6000 rads (Si). The test articles, test configuration,
preliminary results, and recommendations are discussed in this paper.
ii
Table of Contents
Abstract .......................................................................................................................................................... i
List of Figures .............................................................................................................................................. iii
List of Tables ............................................................................................................................................... iii
Acronyms ..................................................................................................................................................... iv
1.0 Introduction ....................................................................................................................................... 1
2.0 Testing............................................................................................................................................... 2
2.1 Test article description .................................................................................................................. 2
2.2 Test approach ................................................................................................................................ 3
2.3 Test results .................................................................................................................................... 5
3.0 Conclusion and Recommendations ................................................................................................... 7
3.1 Conclusions ................................................................................................................................... 7
3.2 Recommendations ......................................................................................................................... 7
4.0 References ......................................................................................................................................... 8

iii
List of Figures
Figure 1. GPC Radiation Test setup.............................................................................................................. 3
Figure 2. Graphics processing card jig ........................................................................................................ 7
Figure 3. Motherboard and support components radiation shielded ........................................................... 7
Figure 4. Windows startup display screen .................................................................................................. 8
Figure 5. Example graphic failure display error .......................................................................................... 8
List of Tables
Table 1. Graphic Processing Unit Key Specifications .................................................................................. 2
Table 2. Radiation Screening Results ........................................................................................................... 5
Table 3. Mean Time to Functional Interrupt Results .................................................................................... 6

iv
Acronyms
BEO beyond Earth orbit
CAT 5 Category 5
COTS commercial off-the-shelf
DUT device under test
FI functional interrupt
GPC graphics processing card
HD high definition
HDMI High Definition Multimedia Interface
IUCF Indiana University Cyclotron Facility
ISS International Space Station
LEO low Earth orbit
MTTFI Mean Time to Functional Interrupt
PCI-e Peripheral Component Interface-extension
Si silicon
3D three-dimensional
VGA Video Graphics Array

1
1.0 Introduction
NASA is investigating deep space mission concepts and the systems necessary to support those missions.
Large round-trip communications times for deep space missions will require more onboard computational
capabilities as the space vehicle is required to take on more of what used to be mission control
responsibilities. Architecture concepts under development require the use of graphics processing
hardware to enable increased situational awareness of the vehicle through high-resolution graphics.
Additionally, applications targeting the maintenance of astronaut health, both psychological and
physiological (i.e., Telepresence/Telemedicine and augmented reality for just-in-time training or
maintenance), will be necessary. However, no known radiation test of graphics processing cards (GPCs)
has been identified to understand how well they would work in the space environment.
Five commercial off-the-shelf (COTS) GPCs were tested to the International Space Station (ISS) low
Earth orbit (LEO) radiation environment to obtain initial radiation test data of electronic components
found in commercial GPCs The testing occurred at the Indiana University Cyclotron Facility (IUCF). It
should be understood that COTS GPCs were not designed or intended to operate in the space
environment—they were designed to operate in an ambient terrestrial application. However, the radiation
testing served to get an initial rough assessment of how well these specialized processing cards would
operate if their design were deployed in a space application.
This report is organized as follows. First, the test articles description is presented, including
specifications. Next, the test setup is described along with the methodology used to test the cards. Then,
the test results are disseminated. Finally, the report concludes with a brief summary of the test results and
recommended future GPC testing.
2
2.0 Testing
2.1 Test article description
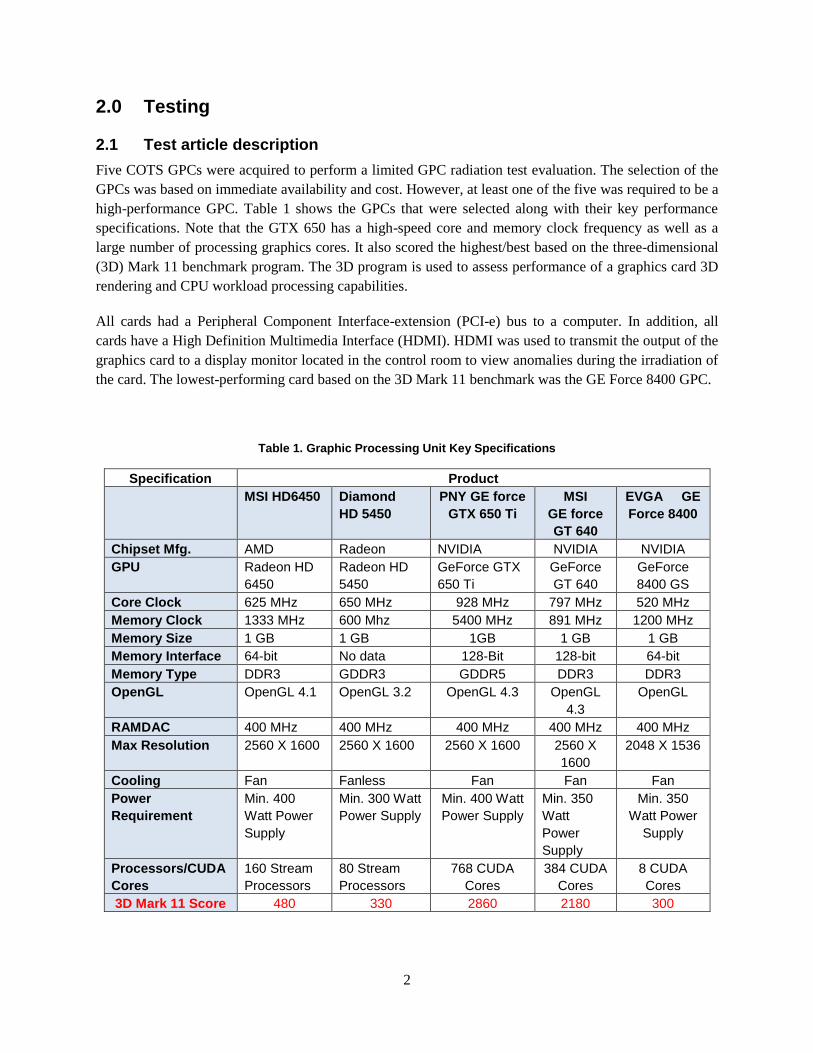
Five COTS GPCs were acquired to perform a limited GPC radiation test evaluation. The selection of the
GPCs was based on immediate availability and cost. However, at least one of the five was required to be a
high-performance GPC. Table 1 shows the GPCs that were selected along with their key performance
specifications. Note that the GTX 650 has a high-speed core and memory clock frequency as well as a
large number of processing graphics cores. It also scored the highest/best based on the three-dimensional
(3D) Mark 11 benchmark program. The 3D program is used to assess performance of a graphics card 3D
rendering and CPU workload processing capabilities.
All cards had a Peripheral Component Interface-extension (PCI-e) bus to a computer. In addition, all
cards have a High Definition Multimedia Interface (HDMI). HDMI was used to transmit the output of the
graphics card to a display monitor located in the control room to view anomalies during the irradiation of
the card. The lowest-performing card based on the 3D Mark 11 benchmark was the GE Force 8400 GPC.
Table 1. Graphic Processing Unit Key Specifications
Specification Product
MSI HD6450 Diamond
HD 5450
PNY GE force
GTX 650 Ti
MSI
GE force
GT 640
EVGA GE
Force 8400
Chipset Mfg. AMD Radeon NVIDIA NVIDIA NVIDIA
GPU Radeon HD
6450
Radeon HD
5450
GeForce GTX
650 Ti
GeForce
GT 640
GeForce
8400 GS
Core Clock 625 MHz 650 MHz 928 MHz 797 MHz 520 MHz
Memory Clock 1333 MHz 600 Mhz 5400 MHz 891 MHz 1200 MHz
Memory Size 1 GB 1 GB 1GB 1 GB 1 GB
Memory Interface 64-bit No data 128-Bit 128-bit 64-bit
Memory Type DDR3 GDDR3 GDDR5 DDR3 DDR3
OpenGL OpenGL 4.1 OpenGL 3.2 OpenGL 4.3 OpenGL
4.3
OpenGL
RAMDAC 400 MHz 400 MHz 400 MHz 400 MHz 400 MHz
Max Resolution 2560 X 1600 2560 X 1600 2560 X 1600 2560 X
1600
2048 X 1536
Cooling Fan Fanless Fan Fan Fan
Power
Requirement
Min. 400
Watt Power
Supply
Min. 300 Watt
Power Supply
Min. 400 Watt
Power Supply
Min. 350
Watt
Power
Supply
Min. 350
Watt Power
Supply
Processors/CUDA
Cores
160 Stream
Processors
80 Stream
Processors
768 CUDA
Cores
384 CUDA
Cores
8 CUDA
Cores
3D Mark 11 Score 480 330 2860 2180 300

3
2.2 Test approach
Resources and time limitations resulted in performing a coarse rather than a fine test of each GPC. This
meant that the entire card was irradiated rather than selective shielding of the different sections of the
GPC to determine what components were susceptible to radiation.
All five GPCs were first evaluated by an initial irradiance screening to determine how much fluence each
GPC accumulated after at least six data points of failures occurred. The top three performers were
selected to continue irradiating them until they reached a total ionizing dose of 6000 rads (Si). A demo
graphics benchmark program called Tropic from Unigine Corporation was launched, the entire card
irradiated, and the output of the GPC viewed on a display and recorded.
Figure 1 shows the setup used for testing each GPC. The chamber room contained the motherboard that
connected to the GPC via a PCIe extender cable. In addition to the motherboard, a hard disk and power
supply that powered the motherboard and GPC were co-located on the test table. The hard disk contained
the Windows Operating System files and the graphic card benchmark program used to run the GPC.
Four 100-foot cables ran from the control room to the system in the chamber: Category 5 (CAT 5)
Ethernet, Video Graphics Array (VGA), HDMI and a 2-wire remote switch. The CAT 5 Ethernet cable
was used to send keyboard commands from the laptop to the motherboard. The VGA cable provided
output status of the motherboard to a display in the control room. The HDMI cable provided the output of
the graphics card device under test (DUT) to another display in the control room. A high-definition (HD)
camera was used to record the GPC display and capture any anomalies that occurred.
Figure 1. GPC radiation test setup.
Control Room
Chamber Room
DUT Beam
Laptop
100’ HDMI
Motherboard & Hard drive Power Supply
PCIe Extender
Card
Shielding
Remote Power Switch
100’ CAT6
HD Camera
100’ VGA
Display
Display

4
Since the test objective was to irradiate the GPC and not the electronics that drove the card, a GPC test jig
was developed to permit radiation to reach the GPC DUT but protect the motherboard from the beam.
Figure 2 shows a block diagram of the test jig used to separate the motherboard and associated support
components and the GPC via the PCIe extender cable. Figure 3 shows the motherboard and associated
support components shielded with lead bricks and boron impregnated plastic.
Figure 2. Graphics processing card jig.
Figure 3. Motherboard and support components radiation shielded.
The 100-foot two-wire cable was used to provide a remote power switch function to control power to the
motherboard in case of a latch up or other hardware problem. In the event of a hard failure, a momentary
push button could be depressed to power cycle the motherboard and GPC. The motherboard power supply
contained over voltage/power and short circuit protection.
Graphics Card
Impregnated Boron
Lead Bricks
5
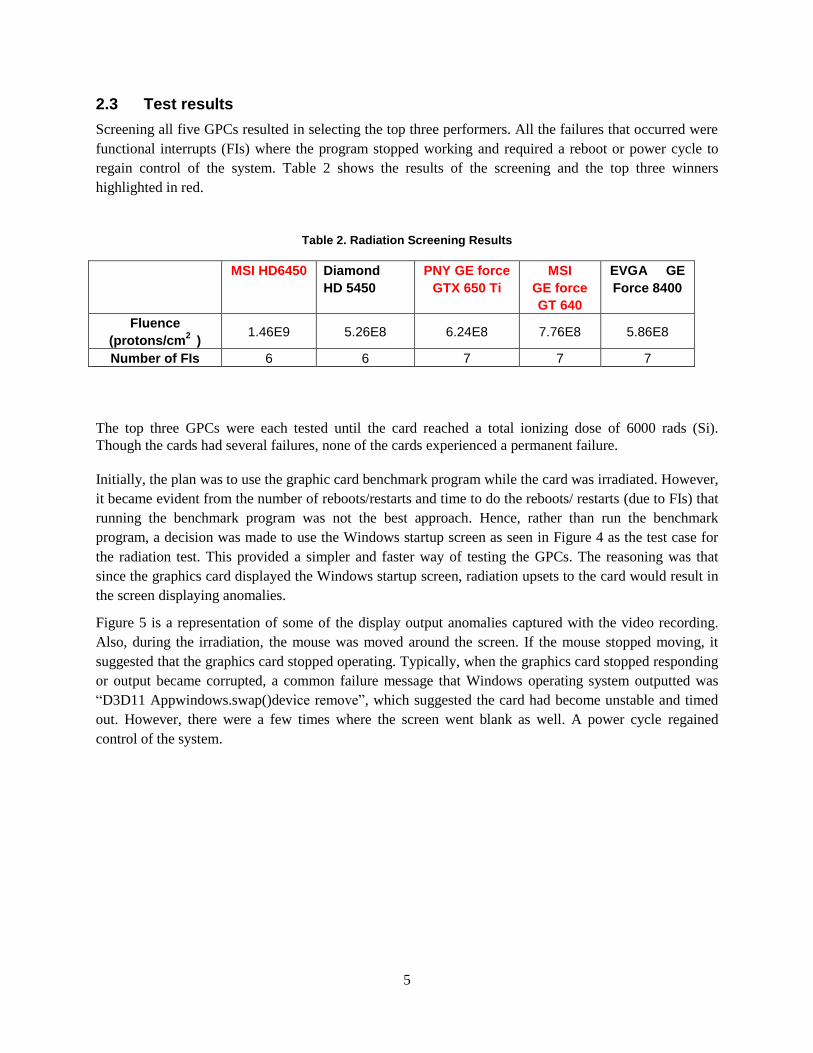
2.3 Test results
Screening all five GPCs resulted in selecting the top three performers. All the failures that occurred were
functional interrupts (FIs) where the program stopped working and required a reboot or power cycle to
regain control of the system. Table 2 shows the results of the screening and the top three winners
highlighted in red.
Table 2. Radiation Screening Results
MSI HD6450 Diamond
HD 5450
PNY GE force
GTX 650 Ti
MSI
GE force
GT 640
EVGA GE
Force 8400
Fluence
(protons/cm2 )
1.46E9 5.26E8 6.24E8 7.76E8 5.86E8
Number of FIs 6 6 7 7 7
The top three GPCs were each tested until the card reached a total ionizing dose of 6000 rads (Si).
Though the cards had several failures, none of the cards experienced a permanent failure.
Initially, the plan was to use the graphic card benchmark program while the card was irradiated. However,
it became evident from the number of reboots/restarts and time to do the reboots/ restarts (due to FIs) that
running the benchmark program was not the best approach. Hence, rather than run the benchmark
program, a decision was made to use the Windows startup screen as seen in Figure 4 as the test case for
the radiation test. This provided a simpler and faster way of testing the GPCs. The reasoning was that
since the graphics card displayed the Windows startup screen, radiation upsets to the card would result in
the screen displaying anomalies.
Figure 5 is a representation of some of the display output anomalies captured with the video recording.
Also, during the irradiation, the mouse was moved around the screen. If the mouse stopped moving, it
suggested that the graphics card stopped operating. Typically, when the graphics card stopped responding
or output became corrupted, a common failure message that Windows operating system outputted was
“D3D11 Appwindows.swap()device remove”, which suggested the card had become unstable and timed
out. However, there were a few times where the screen went blank as well. A power cycle regained
control of the system.

6
Figure 4. Windows startup display screen.
Figure 5. Example graphic failure display errors.
The Mean Time to Functional Interrupt (MTTFI) of each card, including the two that did not make the
final selection, is shown in Table 3. The MTTFI calculation is computed using the Bendel A method.
Table 3. Mean Time to Functional Interrupt Results
MSI
HD6450
Diamond
HD 5450
PNY GE
force
GTX 650 Ti
MSI
GE force
GT 640
EVGA GE
Force 8400
MTTFI ((Days) 43.1 15.5 15.7 19.6 14.8

7
3.0 Conclusion and Recommendations
3.1 Conclusions
Several design factors affect a system or card’s MTTFI performance, which includes the inherent
radiation tolerance of the components, operating voltages, and radiation single event effects mitigation
strategies. Commercial card manufacturers are not interested in designing for the radiation environment—
that market is small compared to the commercial market (i.e., gaming). The radiation test levels
environment for LEO, and to which these cards were subjected, is benign (Earth’s magnetic shielding
and spacecraft shielding) compared to beyond Earth orbit (BEO) where places such as the moon or Mars
have little to no magnetic shielding.
Though the radiation test of the five GPCs did not meticulously test the board, it did provide preliminary
data regarding the use of commercial GPCs operating in the LEO environment. However, because each
board was entirely irradiated, it is not known what component(s) caused each board’s failures. Further
detailed testing would be required to make that determination.
Based on the GPCs specifications and the MTTFI results, no correlation appears between high-
performing GPUs and radiation tolerance. The HD 6450 faired the best with respect to MTTFI of 43.1
days, though it was not the highest performing GPC when measured against the 3D Mark 11
benchmarking program. The highest performing GPC (GTX 650) scored near the bottom with respect to
MTTFI performance. The lowest 3D Mark 11 benchmark performing GPC was the GE Force 8400,
which also scored the lowest in MTTFI performance. However, the performance of an HD 6450 may
suffice depending on the LEO space application.
3.2 Recommendations
Based on the results of the testing, some recommendations are presented:
1. To identify/understand radiation-susceptible parts on the HD 6450 GPC, further testing should
include more detailed pre-test planning that includes x-raying each board, identify components used
on the board, and determining beam positions/shielding out components not of interest in the beam
position.
2. Since the testing was performed to the LEO radiation environment, it is unclear how well the best
performing board would operate in a BEO environment. Extrapolating the LEO results from LEO-to-
BEO results is not possible. Therefore, performing heavy ion testing is the only way to understand
BEO performance of the candidate GPC.
8
4.0 References
Bendel, W.L. and Peterson, E.L. ”Proton Upsets in Orbit,” IEEE Trans. Nuclear Science,NS-
30,4481,(Dec. 1983).
O’Neill, P.M. “Computer Code for Calculating On Orbit Single Event Effect (SEE) Rates Based on
Proton Test Data, “ NASA Internal Memo EA44-98-28, (Nov.1998).
Peterson, E.L. “The SEU Figure of Merit and Proton Upset Rate Calculations,” IEEE Trans. Nuclear
Science, (Dec. 1998).
Space Station Ionizing Radiation Design Environment, Rev C:International Space Station Alpha, NASA
SSP30512, Revision C, (June 1994).
Evaluation of the Organic Light Emitting Diode Display, JSC 66615 (August 2013).


REPORT DOCUMENTATION PAGE Form Approved OMB No. 0704-0188
Public reporting burden for this collection of information is estimated to average 1 hour per response, including the time for reviewing instructions, searching existing data sources, gathering and
maintaining the data needed, and completing and reviewing the collection of information. Send comments regarding this burden estimate or any other aspect of this collection of information, including
suggestions for reducing this burden, to Washington Headquarters Services, Directorate for Information Operations and Reports, 1215 Jefferson Davis Highway, Suite 1204, Arlington, VA 22202-4302,
and to the Office of Management and Budget, Paperwork Reduction Project (0704-0188), Washington, DC 20503.
1. AGENCY USE ONLY (Leave Blank) 2. REPORT DATE 3. REPORT TYPE AND DATES COVERED
August 2014 NASA Technical Memorandum
4. TITLE AND SUBTITLE
5. FUNDING NUMBERS
Commercial Off-The-Shelf Graphics Processing Board Radiation Test Evaluation Report
6. AUTHOR(S) George A. Salazar; Glen. F. Steele
7. PERFORMING ORGANIZATION NAME(S) AND ADDRESS(ES) 8. PERFORMING ORGANIZATION REPORT NUMBERS
Lyndon B. Johnson Space Center
Houston, Texas 77058
S-1161
9. SPONSORING/MONITORING AGENCY NAME(S) AND ADDRESS(ES) 10. SPONSORING/MONITORING
AGENCY REPORT NUMBER
National Aeronautics and Space Administration
Washington, DC 20546-0001
TM-2014-217395
11. SUPPLEMENTARY NOTES
12a. DISTRIBUTION/AVAILABILITY STATEMENT 12b. DISTRIBUTION CODE
Available from the NASA Center for AeroSpace Information (CASI) 7121 Standard Hanover, MD 21076-1320 Category: 32
13. ABSTRACT (Maximum 200 words)
Large round-trip communications latency for deep space missions will require more onboard computational capabilities to enable the
space vehicle to undertake many tasks that have traditionally been ground-based, mission control responsibilities. As a result, visual
display graphics will be required to provide simpler vehicle situational awareness through graphical representations, as well as provide
capabilities never before done in a space mission, such as augmented reality for in-flight maintenance or Telepresence activities. These
capabilities will require graphics processors and associated support electronic components for high computational graphics processing.
A preliminary test was performed on five commercial off-the-shelf (COTS) graphics cards in an effort to understand the performance
of commercial graphics card electronics operating in the expected radiation environment. This paper discusses the preliminary
evaluation test results of five COTS graphics processing cards tested to the International Space Station low Earth orbit radiation
environment. Three of the five graphics cards were tested to a total dose of 6000 rads (Si). The test articles, test configuration,
preliminary results, and recommendations are discussed in this paper.
14. SUBJECT TERMS 15. NUMBER OF
PAGES
16. PRICE CODE
deep space; radiation; computation; situational awareness; computer graphics;
International Space Station; 20
17. SECURITY CLASSIFICATION
OF REPORT
18. SECURITY CLASSIFICATION
OF THIS PAGE
19. SECURITY CLASSIFICATION
OF ABSTRACT
20. LIMITATION OF ABSTRACT
Unclassified Unclassified Unclassified Unlimited
Standard Form 298 (Rev Feb 89) (MS Word Mar 97) Prescribed by ANSI Std. 239-18 298-102
NSN 7540-01-280-5500