Commercial Banking Investor Presentation · Commercial Banking Investor Presentation Simon Cooper...
19
Commercial Banking Investor Presentation Simon Cooper – Group Managing Director, CEO of Global Commercial Banking March 2014
Transcript of Commercial Banking Investor Presentation · Commercial Banking Investor Presentation Simon Cooper...
Commercial Banking Investor Presentation Simon Cooper – Group Managing Director, CEO of Global Commercial Banking
March 2014
Forward-looking statements
This presentation and subsequent discussion may contain certain forward-looking statements with respect to the financial condition, results of operations, capital position and business of the Group. These forward-looking statements represent the Group’s expectations or beliefs concerning future events and involve known and unknown risks and uncertainty that could cause actual results, performance or events to differ materially from those expressed or implied in such statements. Additional detailed information concerning important factors that could cause actual results to differ materially is available in our Annual Report and Accounts. Past performance cannot be relied on as a guide to future performance.
This presentation contains non-GAAP financial information. Reconciliation of non-GAAP financial measures to the most directly comparable measures under GAAP are provided in the ‘reconciliations of non-GAAP financial measures’ supplement available at www.hsbc.com.
Agenda Commercial Banking Investor Presentation
Strategy
Financial results
B
A
1
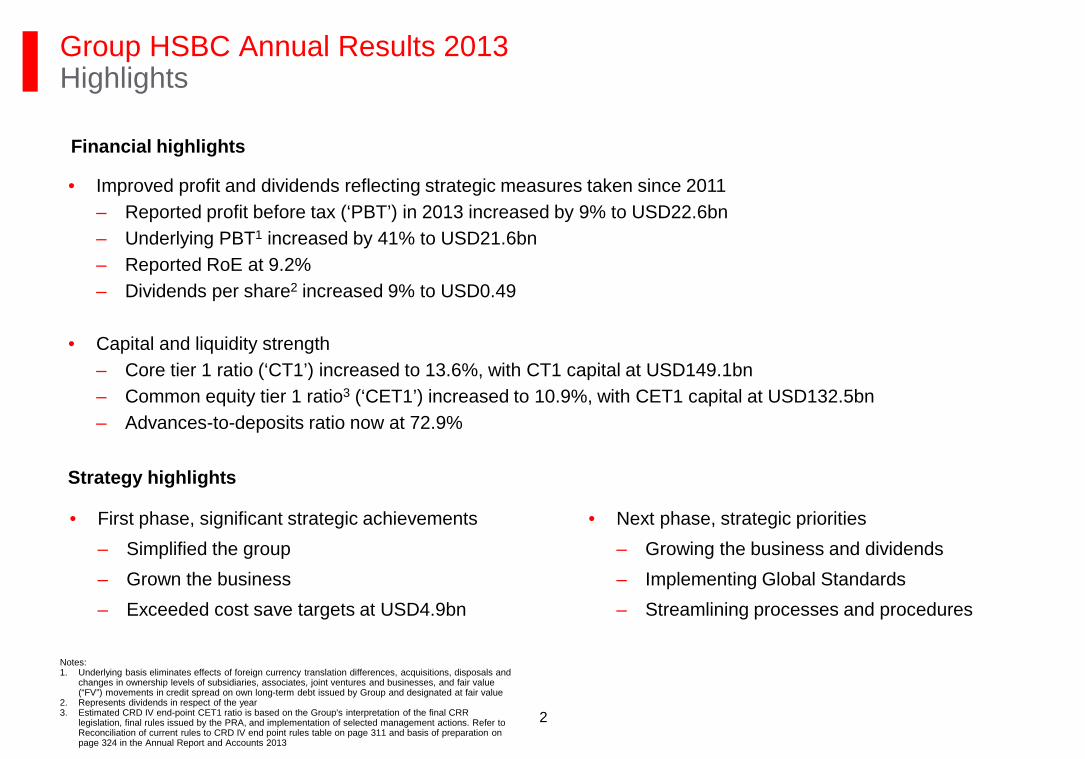
Group HSBC Annual Results 2013 Highlights
· Improved profit and dividends reflecting strategic measures taken since 2011 – Reported profit before tax (‘PBT’) in 2013 increased by 9% to USD22.6bn – Underlying PBT1 increased by 41% to USD21.6bn – Reported RoE at 9.2% – Dividends per share2 increased 9% to USD0.49
· Capital and liquidity strength – Core tier 1 ratio (‘CT1’) increased to 13.6%, with CT1 capital at USD149.1bn – Common equity tier 1 ratio3 (‘CET1’) increased to 10.9%, with CET1 capital at USD132.5bn – Advances-to-deposits ratio now at 72.9%
Strategy highlights
· First phase, significant strategic achievements – Simplified the group – Grown the business – Exceeded cost save targets at USD4.9bn
· Next phase, strategic priorities – Growing the business and dividends – Implementing Global Standards – Streamlining processes and procedures
Notes: 1. Underlying basis eliminates effects of foreign currency translation differences, acquisitions, disposals and
changes in ownership levels of subsidiaries, associates, joint ventures and businesses, and fair value (“FV”) movements in credit spread on own long-term debt issued by Group and designated at fair value
2. Represents dividends in respect of the year 3. Estimated CRD IV end-point CET1 ratio is based on the Group's interpretation of the final CRR
legislation, final rules issued by the PRA, and implementation of selected management actions. Refer to Reconciliation of current rules to CRD IV end point rules table on page 311 and basis of preparation on page 324 in the Annual Report and Accounts 2013
Financial highlights
2
Group HSBC Annual Results 2013 Financial highlights1
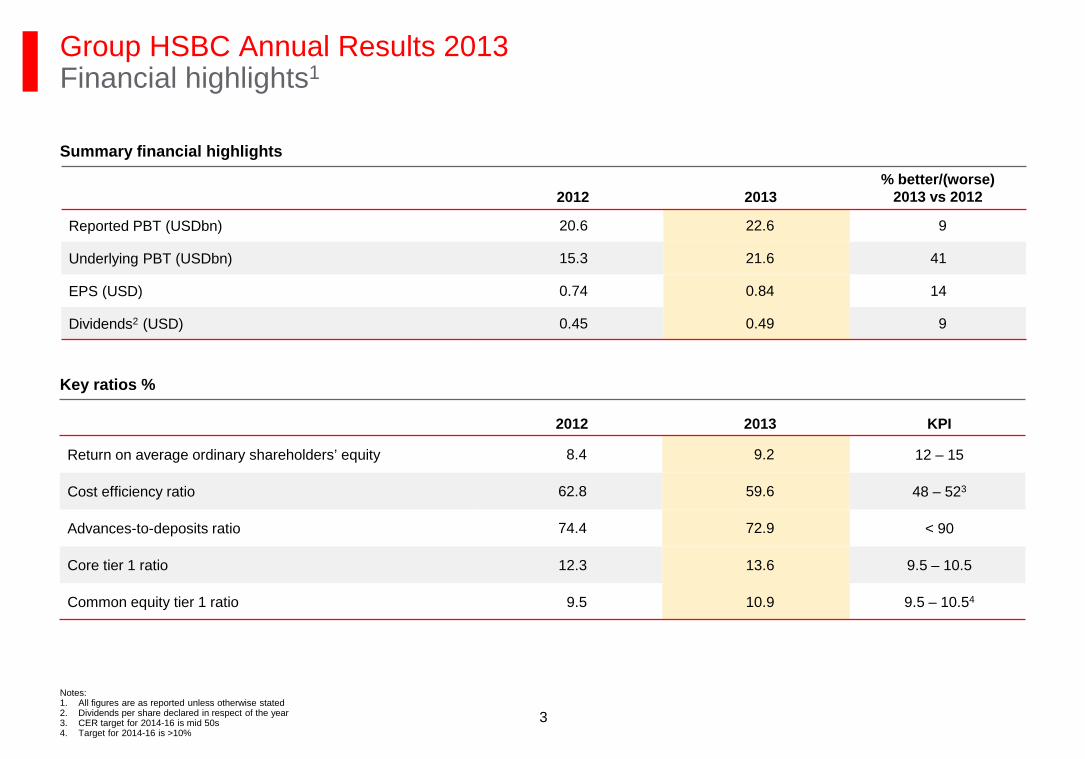
Summary financial highlights
Key ratios %
Notes: 1. All figures are as reported unless otherwise stated 2. Dividends per share declared in respect of the year 3. CER target for 2014-16 is mid 50s 4. Target for 2014-16 is >10%
2012 2013 % better/(worse)
2013 vs 2012
Reported PBT (USDbn) 20.6 22.6 9
Underlying PBT (USDbn) 15.3 21.6 41
EPS (USD) 0.74 0.84 14
Dividends2 (USD) 0.45 0.49 9
2012 2013 KPI
Return on average ordinary shareholders’ equity 8.4 9.2 12 – 15
Cost efficiency ratio 62.8 59.6 48 – 523
Advances-to-deposits ratio 74.4 72.9 < 90
Core tier 1 ratio 12.3 13.6 9.5 – 10.5
Common equity tier 1 ratio 9.5 10.9 9.5 – 10.54
3
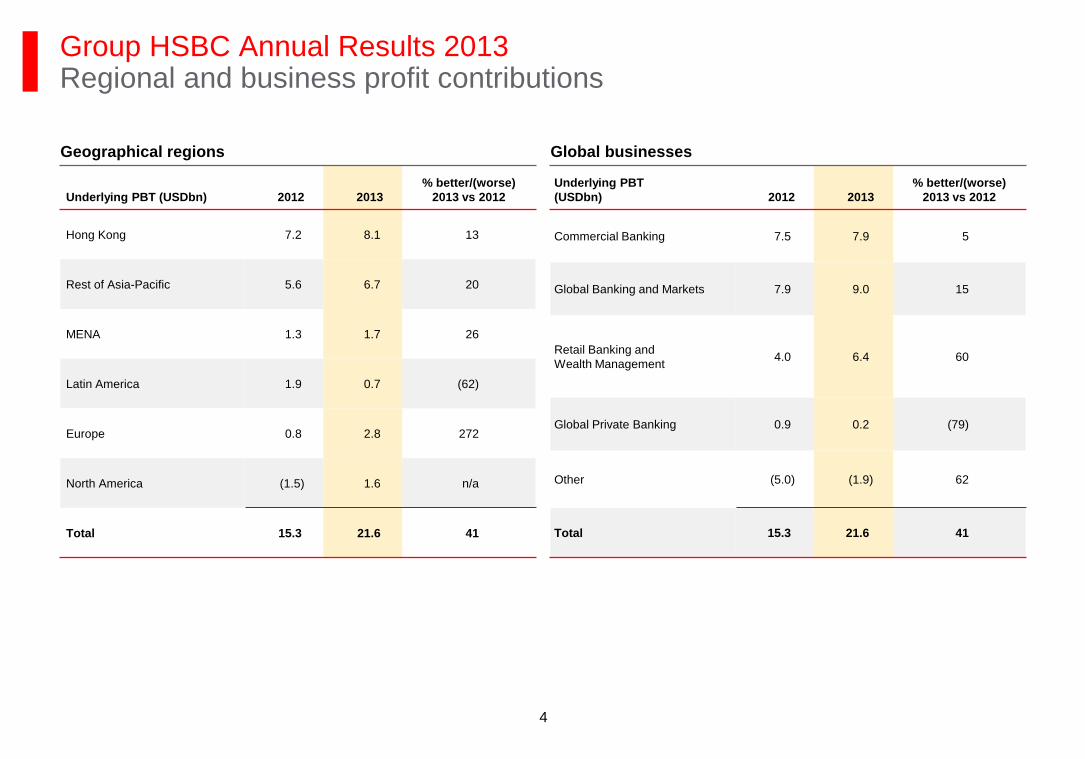
Geographical regions
Underlying PBT (USDbn) 2012 2013 % better/(worse)
2013 vs 2012
Hong Kong 7.2 8.1 13
Rest of Asia-Pacific 5.6 6.7 20
MENA 1.3 1.7 26
Latin America 1.9 0.7 (62)
Europe 0.8 2.8 272
North America (1.5) 1.6 n/a
Total 15.3 21.6 41
Global businesses
Underlying PBT (USDbn) 2012 2013
% better/(worse) 2013 vs 2012
Commercial Banking 7.5 7.9 5
Global Banking and Markets 7.9 9.0 15
Retail Banking and Wealth Management 4.0 6.4 60
Global Private Banking 0.9 0.2 (79)
Other (5.0) (1.9) 62
Total 15.3 21.6 41
Group HSBC Annual Results 2013 Regional and business profit contributions
4
32%
33%
16%
6%
13%
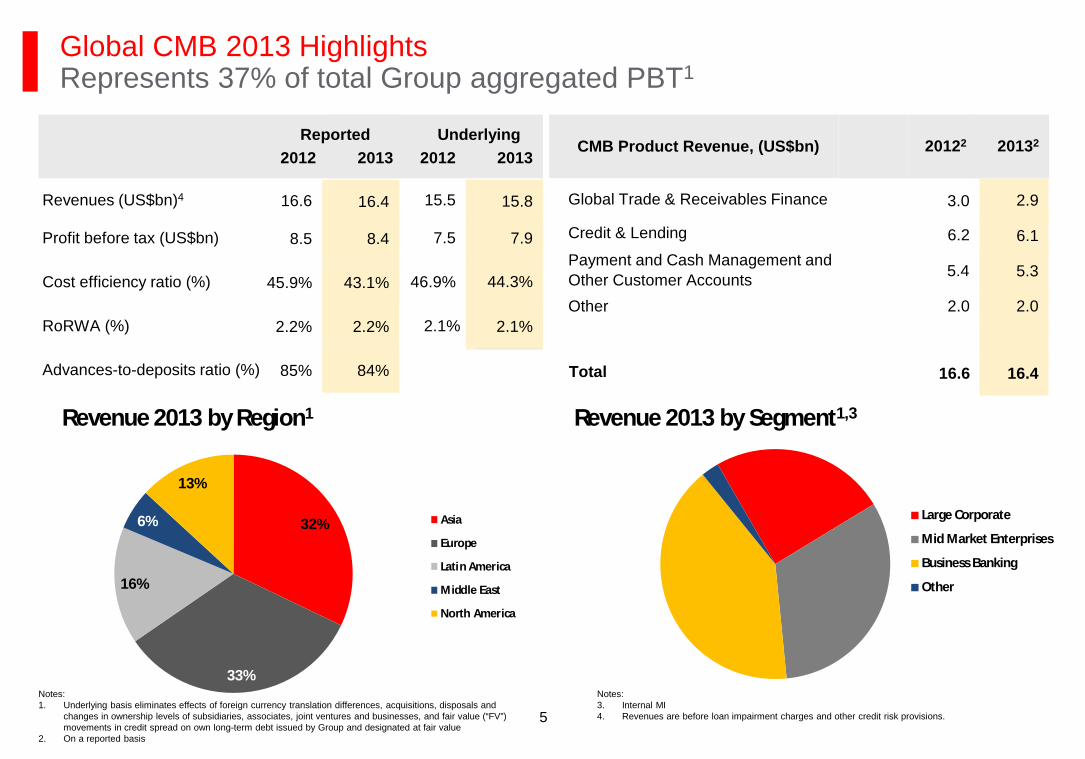
Revenue 2013 by Region1
Asia
Europe
Latin America
Middle East
North America
Global CMB 2013 Highlights Represents 37% of total Group aggregated PBT1
2.0 2.0 Other
6.1
Global Trade & Receivables Finance
Credit & Lending
Payment and Cash Management and Other Customer Accounts
CMB Product Revenue, (US$bn)
Total 16.4 16.6
20132 20122
6.2
2.9 3.0
5.3 5.4
Notes: 1. Underlying basis eliminates effects of foreign currency translation differences, acquisitions, disposals and
changes in ownership levels of subsidiaries, associates, joint ventures and businesses, and fair value (“FV”) movements in credit spread on own long-term debt issued by Group and designated at fair value
2. On a reported basis
5
Advances-to-deposits ratio (%)
44.3%
7.9 7.5 Profit before tax (US$bn)
46.9% Cost efficiency ratio (%)
RoRWA (%)
15.8 15.5 Revenues (US$bn)4
2013 2012 Reported Underlying
2012 2013
84% 85%
2.2%
43.1%
8.4 8.5
45.9%
2.2%
16.4 16.6
2.1% 2.1%
Revenue 2013 by Segment1,3
Large Corporate
Mid Market Enterprises
Business Banking
Other
Notes: 3. Internal MI 4. Revenues are before loan impairment charges and other credit risk provisions.
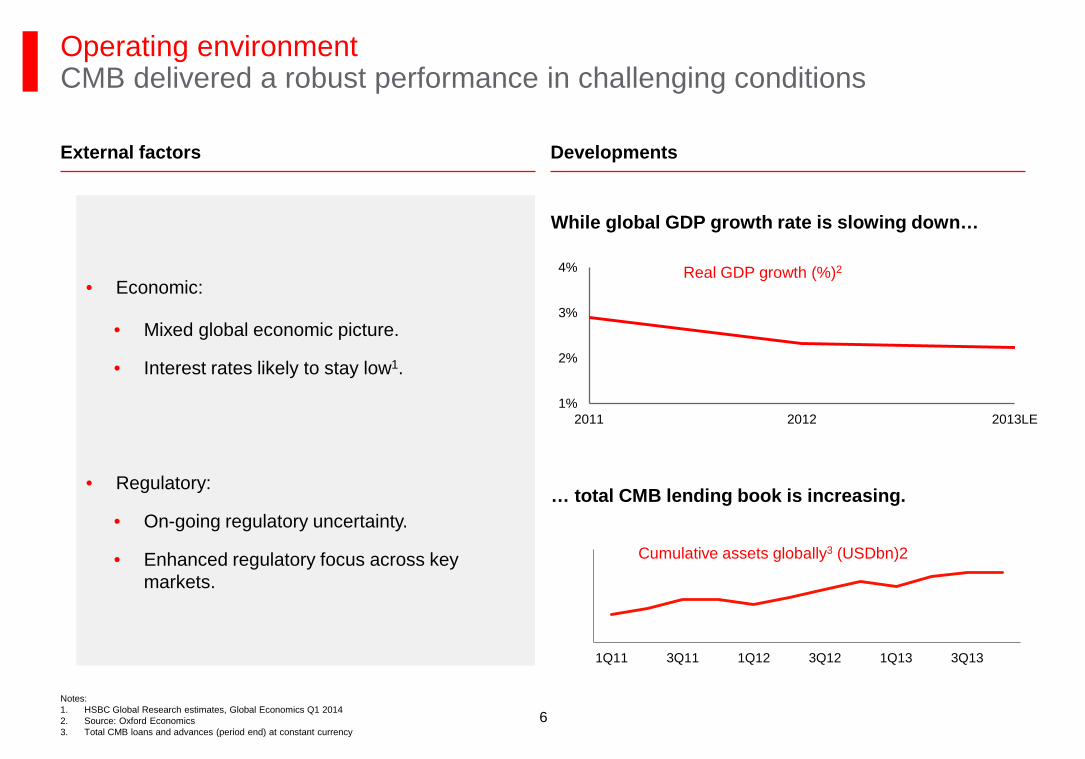
Notes: 1. HSBC Global Research estimates, Global Economics Q1 2014 2. Source: Oxford Economics 3. Total CMB loans and advances (period end) at constant currency
Real GDP growth (%)2
1%
2%
3%
4%
2011 2012 2013LE
Cumulative assets globally3 (USDbn)2
While global GDP growth rate is slowing down…
… total CMB lending book is increasing.
Operating environment CMB delivered a robust performance in challenging conditions
External factors Developments
· Economic:
· Mixed global economic picture.
· Interest rates likely to stay low1.
· Regulatory:
· On-going regulatory uncertainty.
· Enhanced regulatory focus across key markets.
220
240
260
280
300
320
1Q11 3Q11 1Q12 3Q12 1Q13 3Q13
6
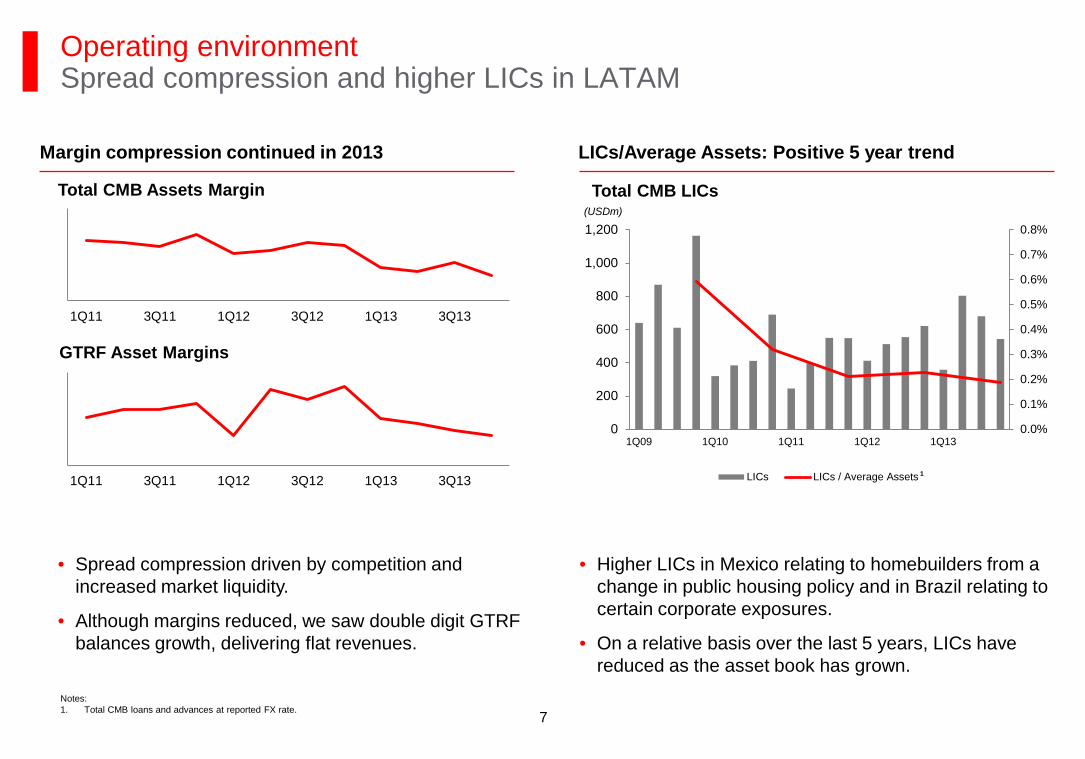
Operating environment Spread compression and higher LICs in LATAM
(USDm)
Total CMB Assets Margin
GTRF Asset Margins
LICs/Average Assets: Positive 5 year trend Margin compression continued in 2013
· Higher LICs in Mexico relating to homebuilders from a change in public housing policy and in Brazil relating to certain corporate exposures.
· On a relative basis over the last 5 years, LICs have reduced as the asset book has grown.
· Spread compression driven by competition and increased market liquidity.
· Although margins reduced, we saw double digit GTRF balances growth, delivering flat revenues.
0.0%
0.1%
0.2%
0.3%
0.4%
0.5%
0.6%
0.7%
0.8%
0
200
400
600
800
1,000
1,200
1Q09 1Q10 1Q11 1Q12 1Q13
LICs LICs / Average Assets0
0
0
0
1Q11 3Q11 1Q12 3Q12 1Q13 3Q13
0
0
0
1Q11 3Q11 1Q12 3Q12 1Q13 3Q13
Total CMB LICs
Notes: 1. Total CMB loans and advances at reported FX rate.
1
7
Agenda Commercial Banking Investor Presentation
Strategy
Financial results
B
A
8
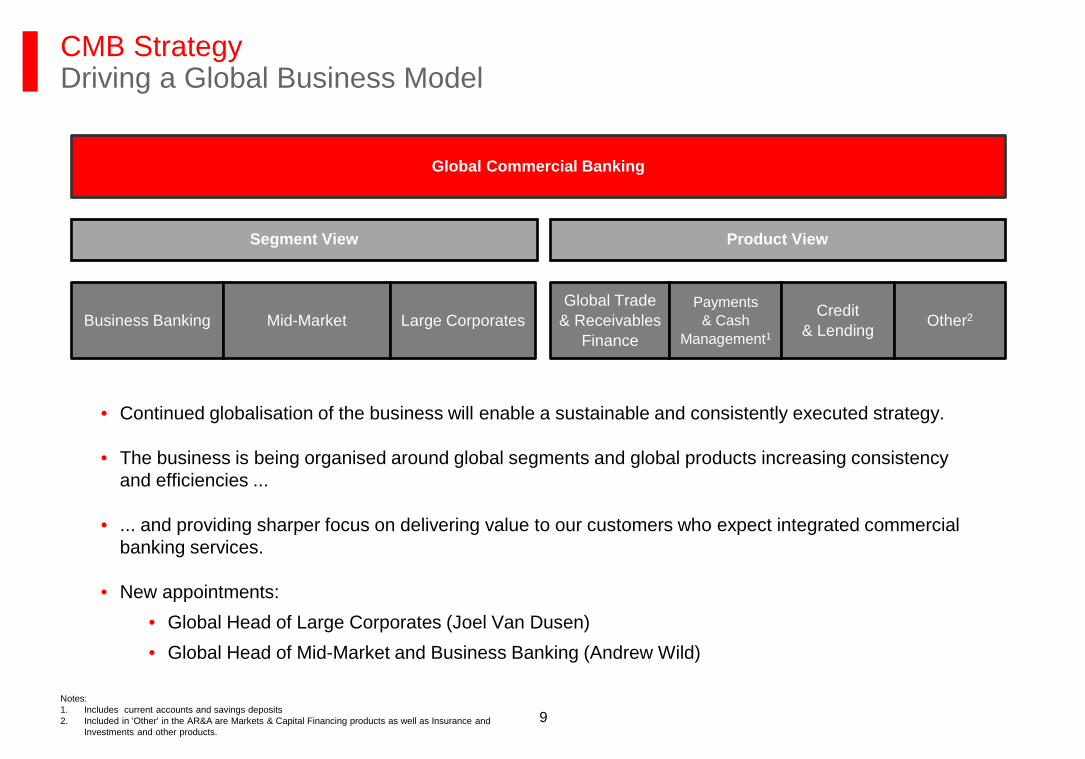
CMB Strategy Driving a Global Business Model
Global Commercial Banking
· Continued globalisation of the business will enable a sustainable and consistently executed strategy.
· The business is being organised around global segments and global products increasing consistency and efficiencies ...
· ... and providing sharper focus on delivering value to our customers who expect integrated commercial banking services.
· New appointments: · Global Head of Large Corporates (Joel Van Dusen) · Global Head of Mid-Market and Business Banking (Andrew Wild)
Segment View Product View
Business Banking Mid-Market Large Corporates Global Trade
& Receivables Finance
Payments & Cash
Management1
Credit & Lending Other2
Notes: 1. Includes current accounts and savings deposits 2. Included in 'Other' in the AR&A are Markets & Capital Financing products as well as Insurance and
Investments and other products. 9
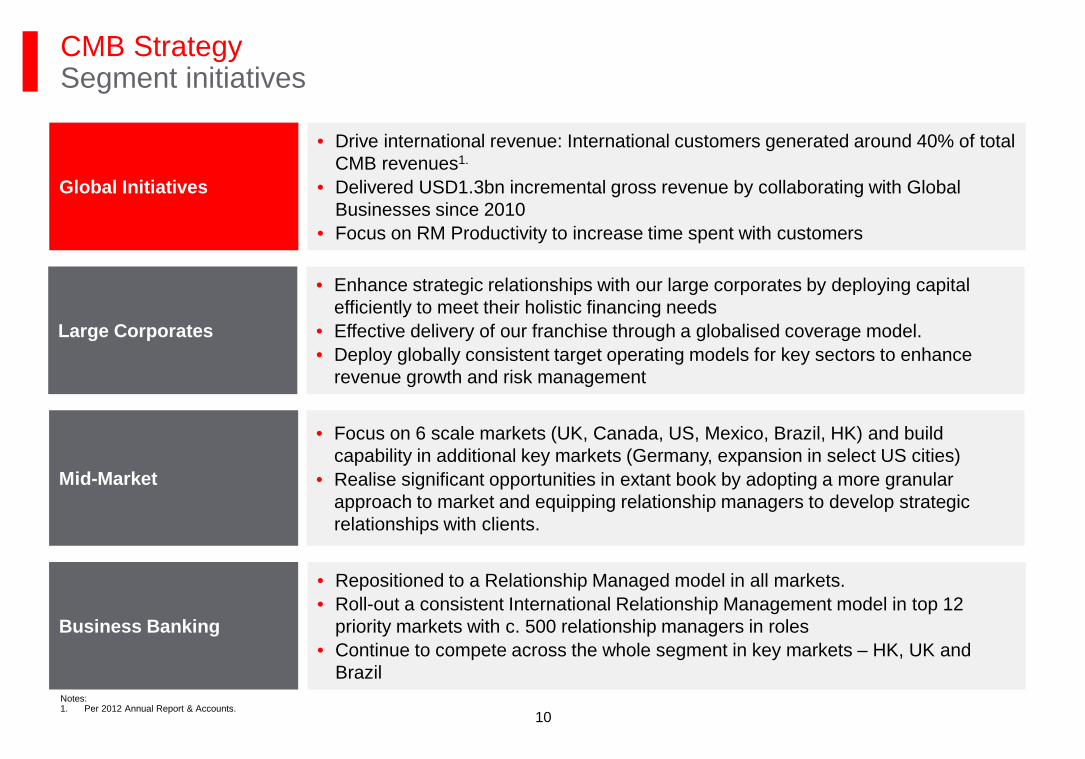
CMB Strategy Segment initiatives
Large Corporates
• Enhance strategic relationships with our large corporates by deploying capital efficiently to meet their holistic financing needs
• Effective delivery of our franchise through a globalised coverage model. • Deploy globally consistent target operating models for key sectors to enhance
revenue growth and risk management
Global Initiatives
• Drive international revenue: International customers generated around 40% of total CMB revenues1.
• Delivered USD1.3bn incremental gross revenue by collaborating with Global Businesses since 2010
• Focus on RM Productivity to increase time spent with customers
• Focus on 6 scale markets (UK, Canada, US, Mexico, Brazil, HK) and build capability in additional key markets (Germany, expansion in select US cities)
• Realise significant opportunities in extant book by adopting a more granular approach to market and equipping relationship managers to develop strategic relationships with clients.
Mid-Market
• Repositioned to a Relationship Managed model in all markets. • Roll-out a consistent International Relationship Management model in top 12
priority markets with c. 500 relationship managers in roles • Continue to compete across the whole segment in key markets – HK, UK and
Brazil
Business Banking
Notes: 1. Per 2012 Annual Report & Accounts.
10
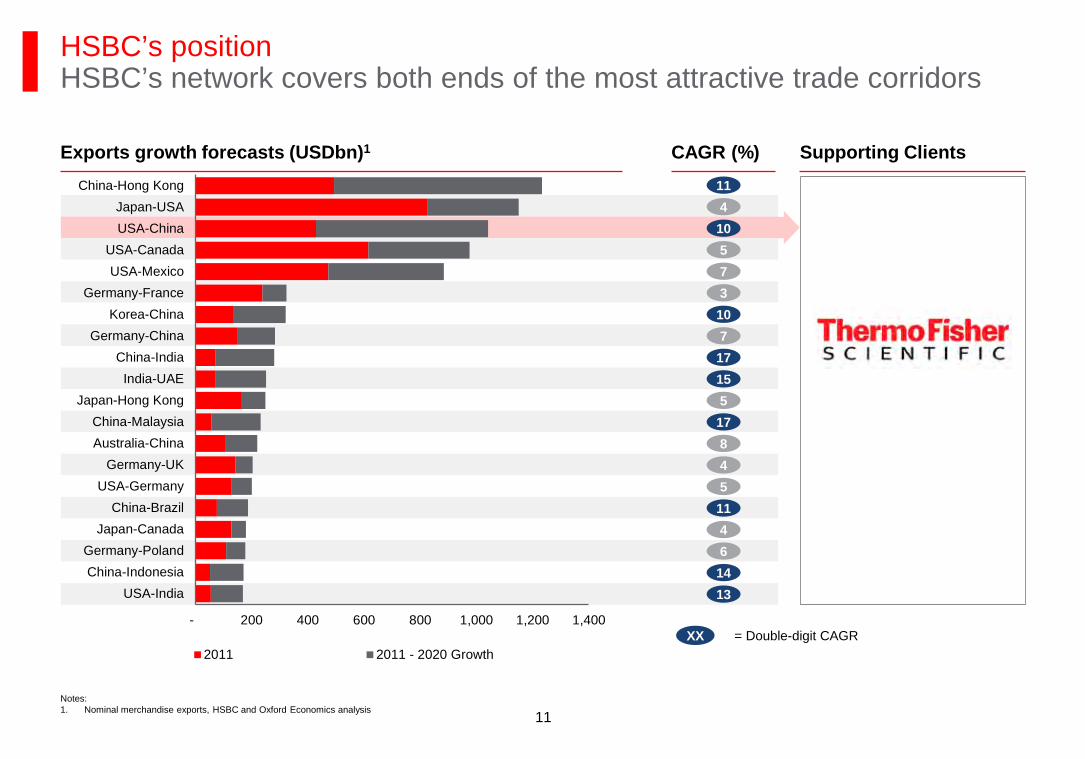
HSBC’s position HSBC’s network covers both ends of the most attractive trade corridors
- 200 400 600 800 1,000 1,200 1,400
USA-IndiaChina-IndonesiaGermany-Poland
Japan-CanadaChina-Brazil
USA-GermanyGermany-UK
Australia-ChinaChina-Malaysia
Japan-Hong KongIndia-UAE
China-IndiaGermany-China
Korea-ChinaGermany-France
USA-MexicoUSA-Canada
USA-ChinaJapan-USA
China-Hong Kong
2011 2011 - 2020 Growth
11 4 10 5 7 3 10 7 17 15 5 17 8 4 5 11 4 6 14 13
XX = Double-digit CAGR
Exports growth forecasts (USDbn)1 CAGR (%) Supporting Clients
Notes: 1. Nominal merchandise exports, HSBC and Oxford Economics analysis 11
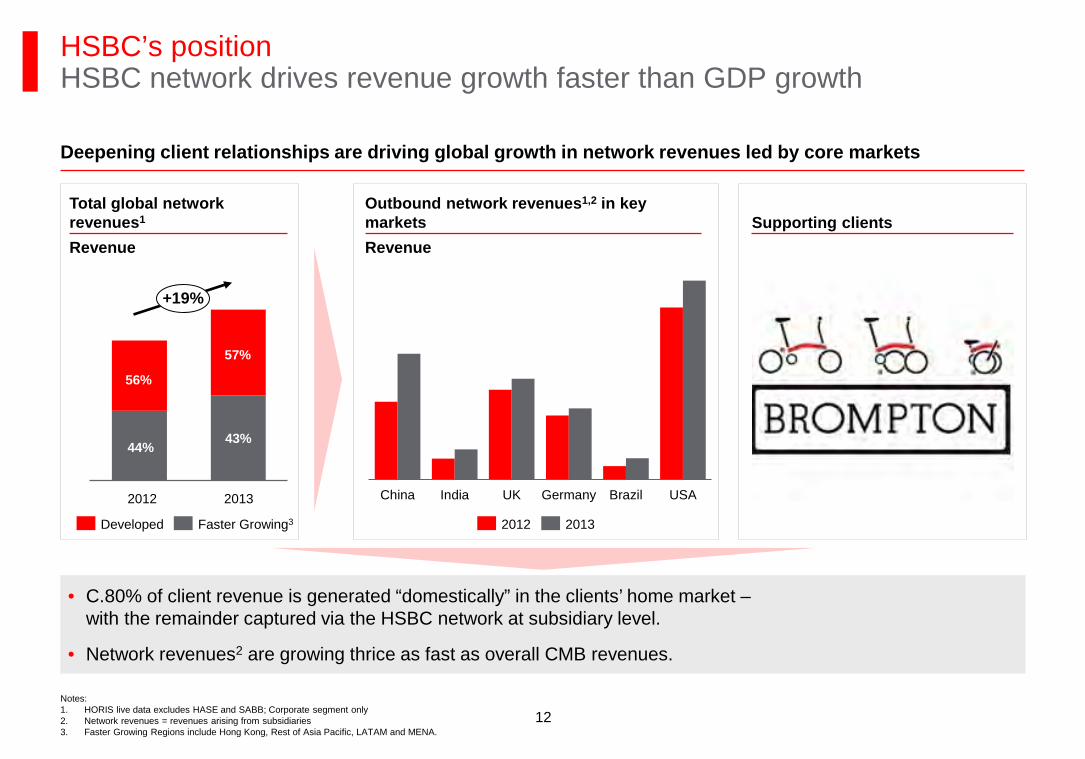
· C.80% of client revenue is generated “domestically” in the clients’ home market – with the remainder captured via the HSBC network at subsidiary level.
· Network revenues2 are growing thrice as fast as overall CMB revenues.
HSBC’s position HSBC network drives revenue growth faster than GDP growth
Deepening client relationships are driving global growth in network revenues led by core markets
2012 2013
56%
Developed Faster Growing3
44% 43%
2013
57%
2012
56%
China India UK Germany Brazil USA
+19%
Total global network revenues1
Revenue Revenue
Outbound network revenues1,2 in key markets Supporting clients
Notes: 1. HORIS live data excludes HASE and SABB; Corporate segment only 2. Network revenues = revenues arising from subsidiaries 3. Faster Growing Regions include Hong Kong, Rest of Asia Pacific, LATAM and MENA.
12
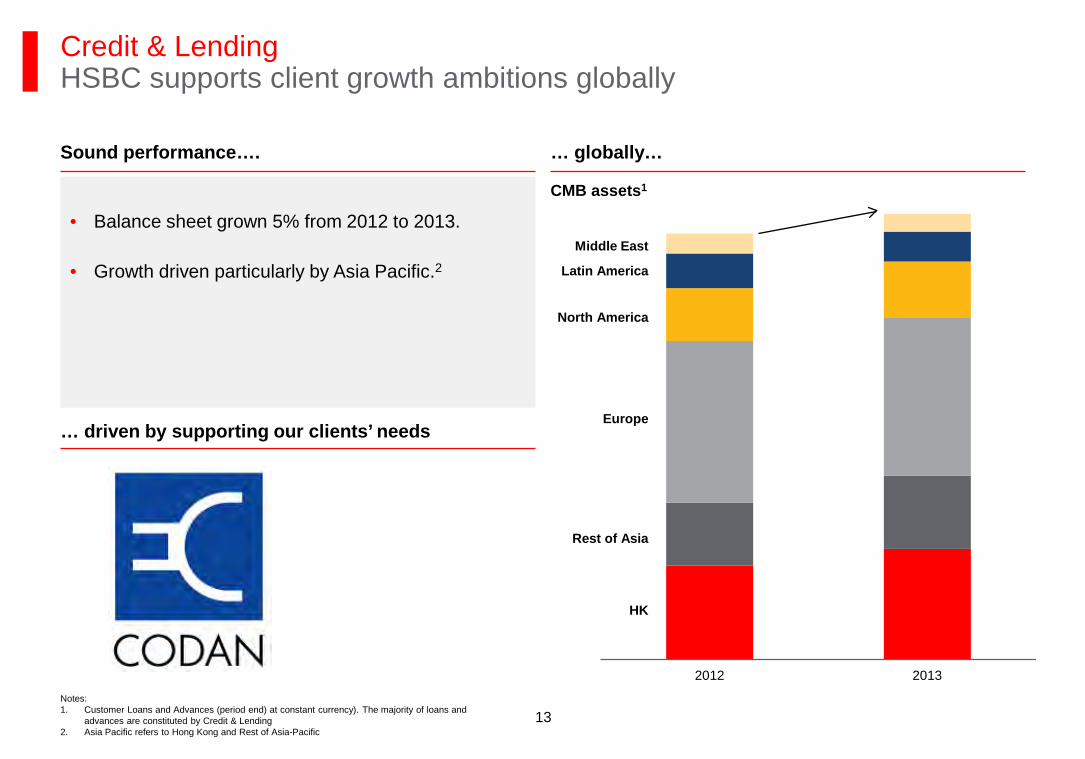
Credit & Lending HSBC supports client growth ambitions globally
Show client examples
CMB assets1 · Balance sheet grown 5% from 2012 to 2013.
· Growth driven particularly by Asia Pacific.2
2012 2013
Latin America
North America
Middle East
Europe
Rest of Asia
HK
Sound performance…. … globally…
… driven by supporting our clients’ needs
Notes: 1. Customer Loans and Advances (period end) at constant currency). The majority of loans and
advances are constituted by Credit & Lending 2. Asia Pacific refers to Hong Kong and Rest of Asia-Pacific
13
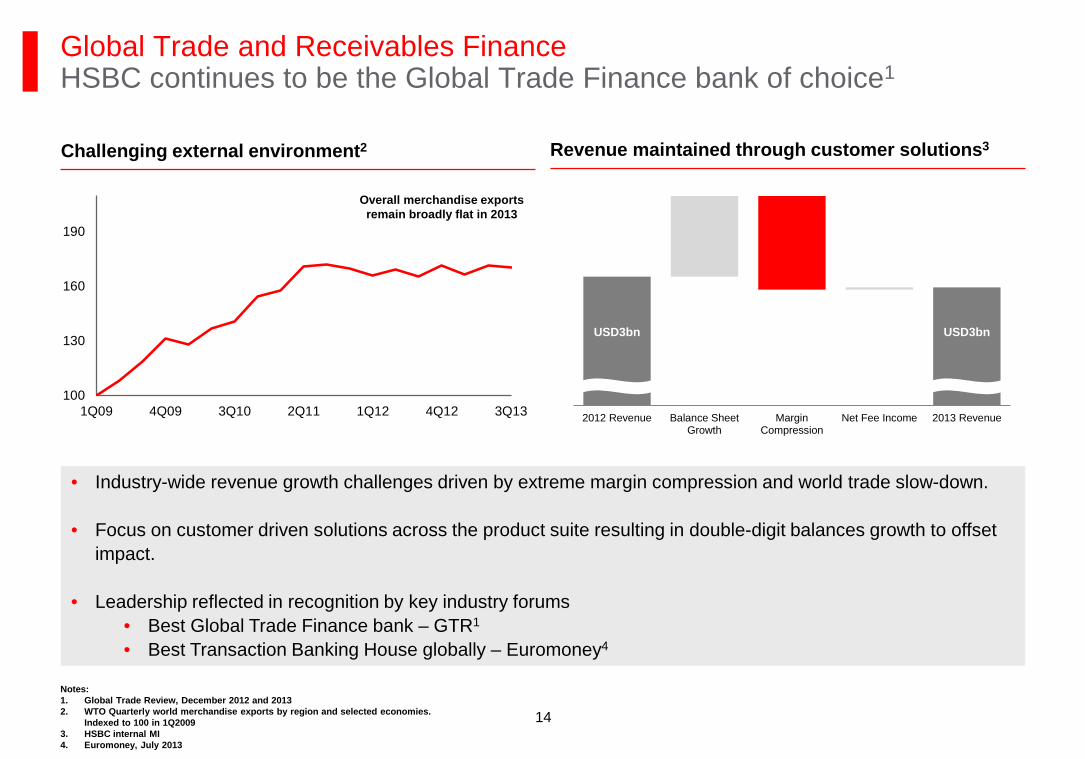
Global Trade and Receivables Finance HSBC continues to be the Global Trade Finance bank of choice1
Revenue maintained through customer solutions3 Challenging external environment2
· Industry-wide revenue growth challenges driven by extreme margin compression and world trade slow-down.
· Focus on customer driven solutions across the product suite resulting in double-digit balances growth to offset impact.
· Leadership reflected in recognition by key industry forums · Best Global Trade Finance bank – GTR1
· Best Transaction Banking House globally – Euromoney4
100
130
160
190
1Q09 4Q09 3Q10 2Q11 1Q12 4Q12 3Q13
Notes: 1. Global Trade Review, December 2012 and 2013 2. WTO Quarterly world merchandise exports by region and selected economies.
Indexed to 100 in 1Q2009 3. HSBC internal MI 4. Euromoney, July 2013
Overall merchandise exports remain broadly flat in 2013
2012 Revenue Balance SheetGrowth
MarginCompression
Net Fee Income 2013 Revenue
USD3bn USD3bn
14
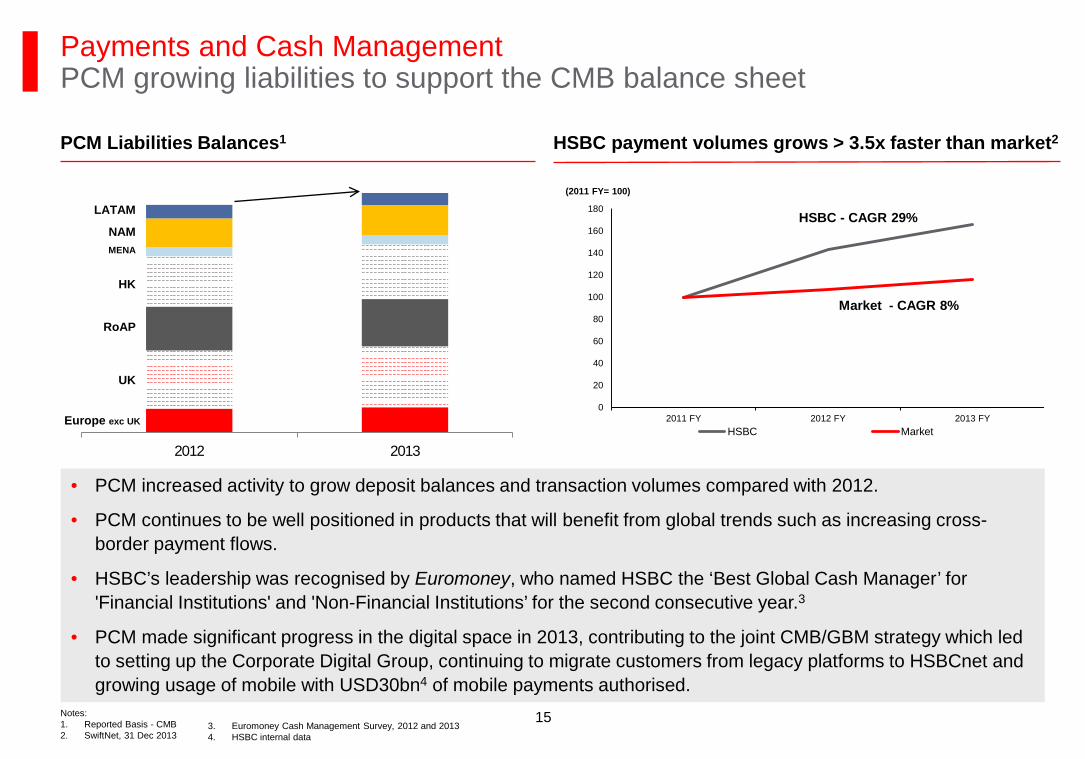
Payments and Cash Management PCM growing liabilities to support the CMB balance sheet
· PCM increased activity to grow deposit balances and transaction volumes compared with 2012.
· PCM continues to be well positioned in products that will benefit from global trends such as increasing cross-border payment flows.
· HSBC’s leadership was recognised by Euromoney, who named HSBC the ‘Best Global Cash Manager’ for 'Financial Institutions' and 'Non-Financial Institutions’ for the second consecutive year.3
· PCM made significant progress in the digital space in 2013, contributing to the joint CMB/GBM strategy which led to setting up the Corporate Digital Group, continuing to migrate customers from legacy platforms to HSBCnet and growing usage of mobile with USD30bn4 of mobile payments authorised.
Market - CAGR 8%
HSBC - CAGR 29%
HSBC payment volumes grows > 3.5x faster than market2
Notes: 1. Reported Basis - CMB 2. SwiftNet, 31 Dec 2013
0
20
40
60
80
100
120
140
160
180
2011 FY 2012 FY 2013 FYHSBC Market
(2011 FY= 100)
PCM Liabilities Balances1
3. Euromoney Cash Management Survey, 2012 and 2013 4. HSBC internal data
2012 2013
Europe exc UK
RoAP
MENA
NAM
LATAM
UK
HK
15
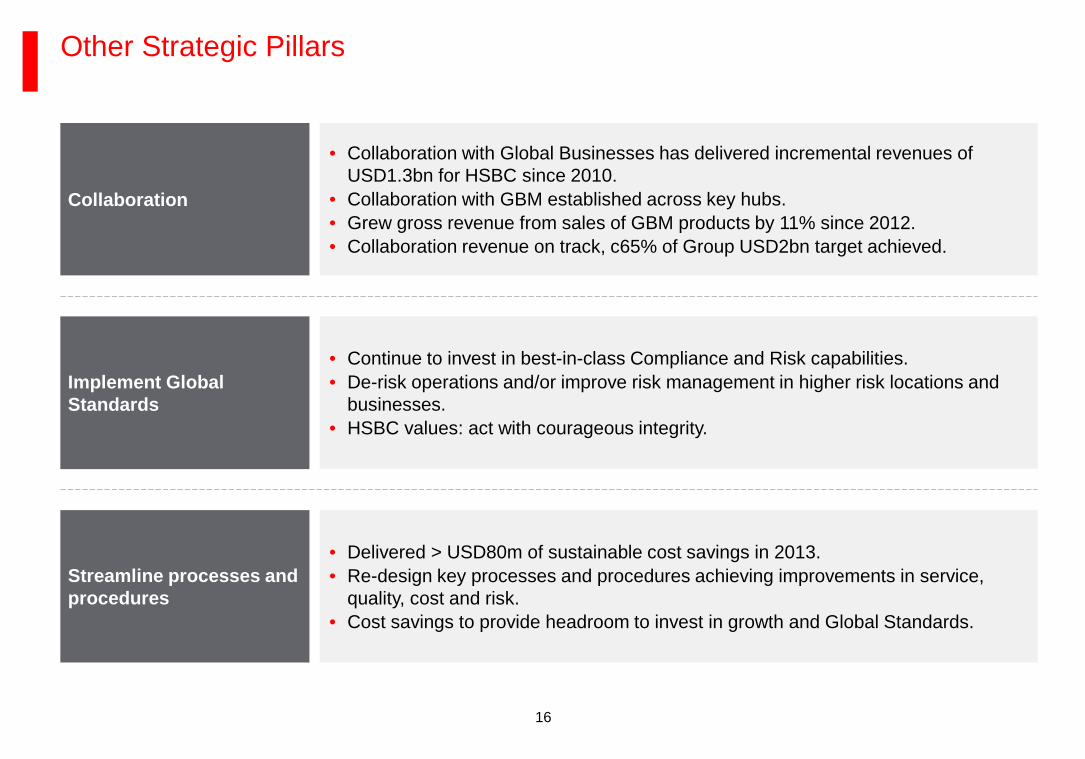
Other Strategic Pillars
• Continue to invest in best-in-class Compliance and Risk capabilities. • De-risk operations and/or improve risk management in higher risk locations and
businesses. • HSBC values: act with courageous integrity.
Implement Global Standards
• Delivered > USD80m of sustainable cost savings in 2013. • Re-design key processes and procedures achieving improvements in service,
quality, cost and risk. • Cost savings to provide headroom to invest in growth and Global Standards.
Streamline processes and procedures
Collaboration
• Collaboration with Global Businesses has delivered incremental revenues of USD1.3bn for HSBC since 2010.
• Collaboration with GBM established across key hubs. • Grew gross revenue from sales of GBM products by 11% since 2012. • Collaboration revenue on track, c65% of Group USD2bn target achieved.
16
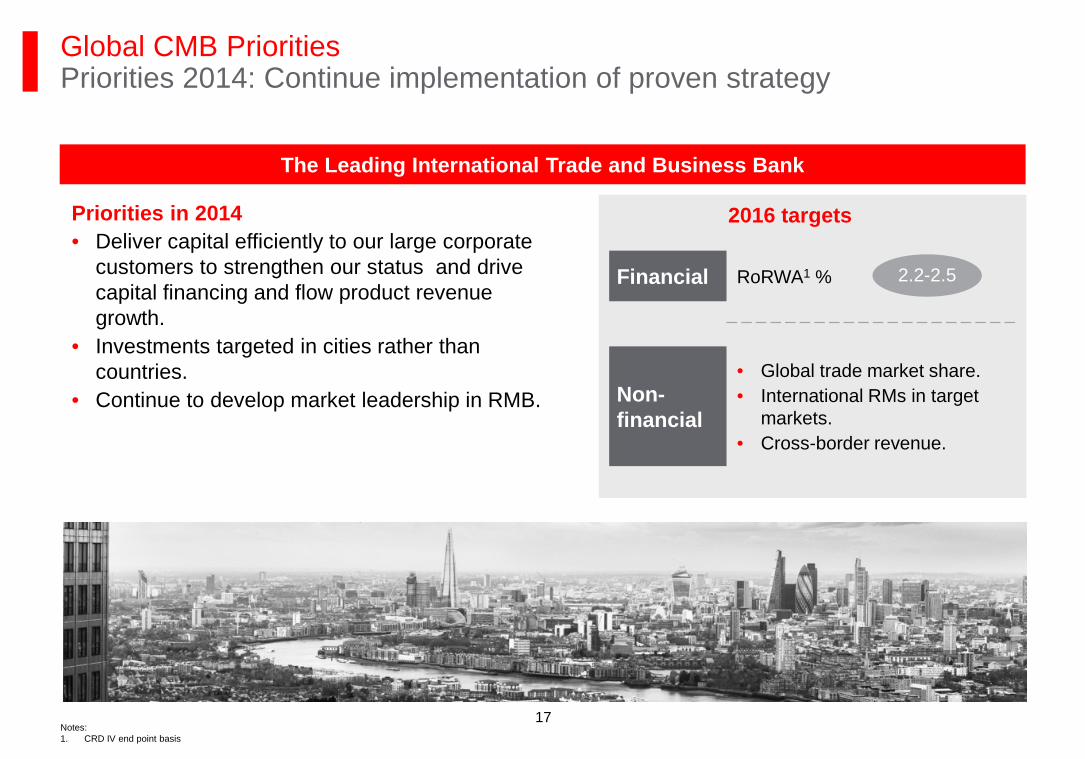
Global CMB Priorities Priorities 2014: Continue implementation of proven strategy
2016 targets Priorities in 2014 · Deliver capital efficiently to our large corporate
customers to strengthen our status and drive capital financing and flow product revenue growth.
· Investments targeted in cities rather than countries.
· Continue to develop market leadership in RMB.
Financial
Non-financial
RoRWA1 %
· Global trade market share. · International RMs in target
markets. · Cross-border revenue.
2.2-2.5
The Leading International Trade and Business Bank
Notes: 1. CRD IV end point basis
17
![Modern commercial banking []](https://static.fdocuments.in/doc/165x107/55a494801a28ab081b8b4639/modern-commercial-banking-wwwbconnect24com.jpg)