Comments on the Statistical Aspects of the NRC's Report...
13
B. Devlin, 1 Ph.D.; Neil Risch, 2 Ph.D.; and Kathryn Roeder, 3 Ph.D. Comments on the Statistical Aspects of the NRC's Report on DNA Typing REFERENCE: Devlin, B., Risch, N., and Roeder, K., "Comments on the Statistical Aspects of the NRC's Report on DNA Typing," Journal of Forensic Sciences, JFSCA, Vol. 39, No. 1, January 1994, pp. 28-40. ABSTRACT: The goal of the NRC report on DNA typing was to answer a "crescendo of questions concerning DNA typing," many of them in the areas of population genetics and statistics. Unfommately, few of these questions were answered adequately. In lieu of an- swering these questions, the panel proposed another conservative method of forensic infer- ence, the "ceiling principle." Aside from its extreme conservativeness, this new method is difficult to justify because it is based on inadequate population genetics and statistical theory. Moreover, in its ultimate implementation, the panel's method will depend on a population genetics study whose rationale is questionable. In this article, we elaborate some of the general comments we made about the NRC report in a recent article [1]. Specifically we cover three topics. First we question the statistical basis for the ceiling principle, showing that the empirical results that motivated the method are likely to be misinterpreted and showing, by power calculations, that the effects of population substructure cannot be sub- stantial. Second, we show that the study design to determine "ceiling" allele frequencies has several undesirable statistical properties. Finally, we discuss the estimation of handling errors from the statistical perspective, a subject treated inadequately by the report. The NRC recently released a report on DNA typing that endorsed its use in the courts [2]. It does not lend much enlightenment to the population genetics debate, however, beyond recognizing its existence. In fact the report itself contains numerous inaccuracies regarding human population genetics and statistical inference [1,3-10]. More impor- tantly, the research proposed by the NRC report could fuel the debate over the validity of population genetic assumptions rather than resolve the debate with useful data. In a recent critique of the NRC report [I], we discuss three major areas of disagreement we have with the committee's conclusions and recommendations. The first area involves the scientific motivation for the committee's recommended method of calculating geno- type "probabilities," which they called the ceiling principle. The second area of disa- greement involves the design of the population genetic study that will be the basis for ceiling principle calculations. And the third area of disagreement involves the interpre- tation of the evidence in court. In this article we elaborate the statistical details behind Received for publication 30 Nov. 1992; revised manuscript received 14 May and 24 June 1993; accepted for publication 25 June 1993. 1Department of Epidemiology and Public Health, Yale University School of Medicine. 2Departments of Epidemiology and Public Health and Genetics, Yale University School of Medicine. 3Department of Statistics, Yale University. 28 Copyright © 1994 by ASTM International
Transcript of Comments on the Statistical Aspects of the NRC's Report...

B. Devlin, 1 Ph.D.; Neil Risch, 2 Ph.D.; and Kathryn Roeder, 3 Ph.D.
Comments on the Statistical Aspects of the NRC's Report on DNA Typing
REFERENCE: Devlin, B., Risch, N., and Roeder, K., "Comments on the Statistical Aspects of the NRC's Report on DNA Typing," Journal of Forensic Sciences, JFSCA, Vol. 39, No. 1, January 1994, pp. 28-40.
ABSTRACT: The goal of the NRC report on DNA typing was to answer a "crescendo of questions concerning DNA typing," many of them in the areas of population genetics and statistics. Unfommately, few of these questions were answered adequately. In lieu of an- swering these questions, the panel proposed another conservative method of forensic infer- ence, the "ceiling principle." Aside from its extreme conservativeness, this new method is difficult to justify because it is based on inadequate population genetics and statistical theory. Moreover, in its ultimate implementation, the panel's method will depend on a population genetics study whose rationale is questionable. In this article, we elaborate some of the general comments we made about the NRC report in a recent article [1]. Specifically we cover three topics. First we question the statistical basis for the ceiling principle, showing that the empirical results that motivated the method are likely to be misinterpreted and showing, by power calculations, that the effects of population substructure cannot be sub- stantial. Second, we show that the study design to determine "ceiling" allele frequencies has several undesirable statistical properties. Finally, we discuss the estimation of handling errors from the statistical perspective, a subject treated inadequately by the report.
The NRC recently released a report on DNA typing that endorsed its use in the courts [2]. It does not lend much enlightenment to the population genetics debate, however, beyond recognizing its existence. In fact the report itself contains numerous inaccuracies regarding human population genetics and statistical inference [1,3-10]. More impor- tantly, the research proposed by the NRC report could fuel the debate over the validity of population genetic assumptions rather than resolve the debate with useful data.
In a recent critique of the NRC report [I], we discuss three major areas of disagreement we have with the committee's conclusions and recommendations. The first area involves the scientific motivation for the committee's recommended method of calculating geno- type "probabilities," which they called the ceiling principle. The second area of disa- greement involves the design of the population genetic study that will be the basis for ceiling principle calculations. And the third area of disagreement involves the interpre- tation of the evidence in court. In this article we elaborate the statistical details behind
Received for publication 30 Nov. 1992; revised manuscript received 14 May and 24 June 1993; accepted for publication 25 June 1993.
1Department of Epidemiology and Public Health, Yale University School of Medicine. 2Departments of Epidemiology and Public Health and Genetics, Yale University School of
Medicine. 3Department of Statistics, Yale University.
28
Copyright © 1994 by ASTM International

DEVLIN ET AL. ~ NRC's REPORT ON DNA TYPING 2 9
our arguments, especially with regard to the first two areas of disagreement. We will not discuss the third area here because the statistical arguments have been discussed exten- sively elsewhere [1,3,11,12]. Finally we will discuss a few ancillary statistical issues raised by the NRC report, in particular the subject of laboratory or chain of custody errors during the process of evaluating DNA evidence.
Motivation for the Ceiling Principle
When a visual match is declared between an evidentiary and suspect sample, the information contained in that match is evaluated by calculating the profile's probability in a reference population. The reference population is that group of individuals who could have committed the crime. This population will depend on the location of the crime, the individuals who had access to the crime scene, and so on. Thus the reference population could be as narrow as two brothers or as broad as anyone in a large, densely populated region. Most commonly, the profile probability is evaluated in several general reference populations (equivalently ethnic groups; for example, Caucasians, African Americans, and so on). See Evett and Weir [11] and Weir and Evett [12] for theoretical justification for using general populations as reference populations. These calculations usually assume independence of alleles within and between loci, and it is those inde- pendence assumptions that have been the focus of the population genetics debate [13- 21]. Those who argue against independence frequently claim the dependency is due to population heterogeneity, by which we mean each general population is composed of subpopulations having different allele frequencies. Such heterogeneity would formally violate independence assumptions. Nevertheless its effect depends on the magnitude of the allele frequency differences: small differences have essentially no effect, large dif- ferences can have substantial effects [17,24].
Recently, Lewontin and Hartl [16] argued that inference should be based on the prob- ability of observing the true perpetrator's profile in the ethnic subpopulation of the suspect. It" it were known with certainty that the perpetrator were from that particular subpopulation, this is clearly the correct approach. But such information is rarely if ever known for the ethnically-mixed U.S. population. For instance, even if the true perpetrator is known to be Caucasian by eyewitness testimony, the eyewitness will rarely be able to classify the perpetrator by subpopulation. When it is only the ethnic group of the perpetrator that is known, the most justifiable alternative is to take a weighted average of the genotype probability over all subpopulations of that ethnic group, weighting ac- cording to frequency. This calculation will not be very different from a single estimate based on the general U.S. population of that ethnic group unless subpopulations of that ethnic group differ substantially. Such differences are unlikely because the major ethnic groups have shown no large deviation from expectations under independence [19-23].
Nevertheless, the NRC panel argues that subpopulations of an ethnic group differ more from each other than do the major ethnic groups, basing this claim on the 1972 results of Lewontin [25], as did Lewontin and Hartl [16] before them. These results were the major population genetic motivation for the NRC panel's method of inference, the ceiling principle. In our recent critique we show these results do not provide an accurate de- scription of what is known about human population genetics and, in particular, what is known about U.S. populations. The expectation for general U.S. populations, based on standard genetic markers, is relatively homogeneous populations and greater differences among the major ethnic groups. Not surprisingly, much recent evidence suggests that the same is true for the VNTR data currently used for forensic inference [5,18,20-22,26].
Aside from the population genetic results, there are statistical reasons to doubt Le- wontin's original finding. These reasons are embodied, albeit subtly, in the results of a study performed by Latter [27]. Latter, using Lewontin's own methods and similar pop-

30 JOURNAL OF FORENSIC SCIENCES
ulations and loci, but with larger samples, failed to replicate the finding that gene di- versity of ethnic groups was less than subpopulations; in fact, Latter found the opposite.
The method Lewontin used to partition gene diversity is simply a hierarchical appli- cation of the Shannon information. That is to say, for an allele distribution P with allele frequencies p , the Shannon information is evaluated as -E~ Pl log p~. This method of partitioning diversity can run into difficulties because it treats the allele frequencies as known constants rather than estimates. It will tend to exaggerate differences between subpopulations of an ethnic group more than it will the differences between the ethnic groups, especially for small samples, as we now show.
We start by establishing some notation: let k index alleles, k = 1 . . . . . K; let j index subpopulations within ethnic groups, j = 1 . . . . , J, let i index ethnic groups, i = 1 . . . . . I; and let c index sampled alleles within subpopulation j and ethnic group i, c = 1 . . . . . 2C. Assume an equal number of individuals C is randomly sampled per subpopulation, and likewise an equal number of subpopulations J is randomly sampled per ethnic group.
For the c'th allele, let X,j~ be 1 if the allele is Ak and 0 otherwise. Random mating is assumed within a subpopulation so there is no need to distinguish between alleles within or between individuals.
Within the i, j'th level, the probability X,~kc = 1 is p~jk. A conditionally unbiased esti-
mator of p~jk is P0k = ~ ~cX~J~ �9 Because the alleles within the i, j'th level are indepen-
dent and identically distributed, the variance of the estimator, conditional on Pok, is
varIPo~lp,A = 1p,Tk(1 - p~jk)
We assume P0k varies over the subpopulations and has conditional expectation P~.k and variance pLk(1 -- p~.k)Os where Os is analogous to Wright's Fsr [28]. Such variability induces correlation in the genes of individuals of a common group:
E[X,j~clp,.d = p,.k
A conditionally unbiased estimator of p~.~ is
1 ~ 1 j ~ . ~ P~.k = ) p,, , = ~ x,,~c
Conditional on PLy, the variance of the estimator is [29]
1 Var[~,.klp,.~] = ~-~p~.k(1 -p,.k)[1 + (2C - 1)Os].
Following the same pattern we allow Pl.k to vary over ethnic groups with expectation p..k. This induces correlation between alleles sampled from the same ethnic group with
DEVLIN ET AL. �9 NRC's REPORT ON DNA TYPING 31
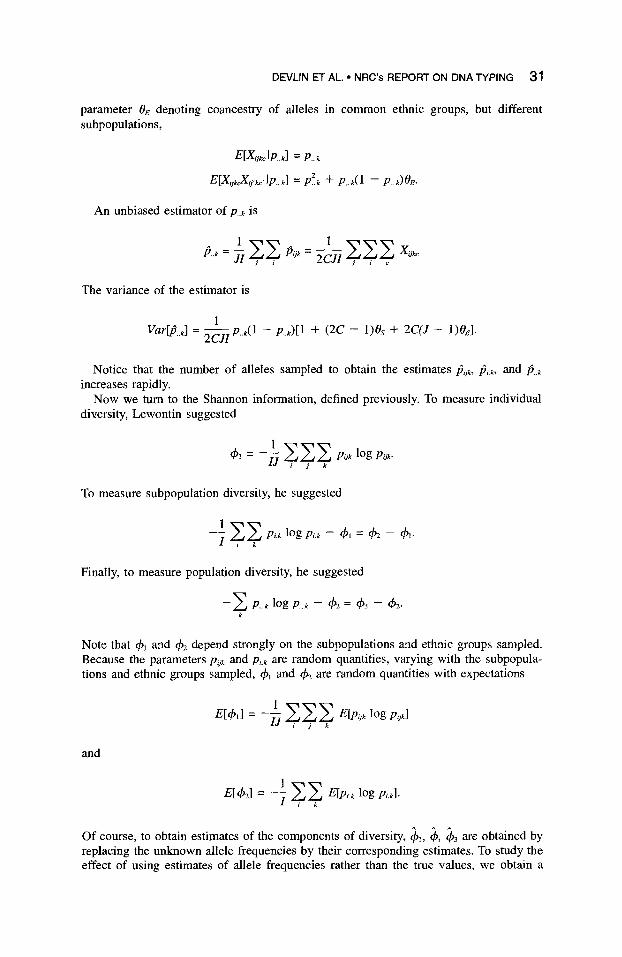
parameter Oe denoting coancestry of alleles in common ethnic groups, but different subpopulations,
E [ X o ~ I P . . k ] = P . . k
E [ X o h X u , ~ , l p . . k ] = p 2 k -k- p . . k ( 1 - - p . . k ) O ~ .
An unbiased estimator of P..k is
fi . .k = ~ . . 2 C ] I �9 �9
The variance of the estimator is
1 Var[!3. .k] = ~ - ~ I p . . k ( 1 - p..k)[1 + (2C - 1 ) O s + 2 C ( J - 1)0el.
Notice that the number of alleles sampled to obtain the estimates/~iik, /~i.~, and/~..~ increases rapidly.
Now we turn to the Shannon information, defined previously. To measure individual diversity, Lewontin suggested
1 4,1=
i j k
To measure subpopulation diversity, he suggested
- I P,.k log p, . , - 4 ' , = 4'2 - 4 ' , .
Finally, to measure population diversity, he suggested
- Z P..k log P . . k - - 4'2 = 4'3 - - 4'2. k
Note that 4'2 and 4'z depend strongly on the subpopulations and ethnic groups sampled. Because the parameters P,jk and P,.k are random quantities, varying with the subpopula- tions and ethnic groups sampled, 4', and 4'2 are random quantities with expectations
E[4',] = - E[pok log Pu~] i j k
and
Of course, to obtain estimates of the components of diversity, ~ , ~, ~3 are obtained by replacing the unknown allele frequencies by their corresponding estimates. To study the effect of using estimates of allele frequencies rather than the true values, we obtain a

32 JOURNAL OF FORENSIC SCIENCES
Taylor series expansion of /~ about p , the expected value of/~sp:
1 1 E[p, log p,] ~ p, log p, + -~ V Var[fi,]
Pl
(We have used a new index l to convey that this is a generic result to be used for all levels of population structure.)
It follows from the approximation above that ~3 yields a biased estimate of ~b3
1 } E[~3] ~ - p..k log P..k + ~ Var[fi..k]
1 = - P_k log P..k + 4---~
To obtain E[~2], we perform an iterated expectation, expanding P,.k log P~.k first about its conditional expectation P~.k to obtain
1 E[P~.k log p,.~lp,.fl ~ p,.k log p,.k + ~ - ) (1 - p~.~)[1 + 2 ( c - 1)0s].
Hence conditional on P~.k, dP2 yields a biased estimate of dp2. In the next step, take the expectation with respect to P~.k to obtain
E[~z] ~ ff . E[p,.k log p j + ~ - ~ (1 -- p..~)[1 + 2(C - DOs] �9
Subtracting E [ ~ ] from E[~3] yields the expectation of Lewontin 's measure of ethnic diversity E[~b3] - E[~2] plus a bias that arises because of sampling error.
1 ethnic bias =-7---~ ( K - 1)[1 + ( 2 C - DOs]
4Cd
1 4CJI (K - 1)[1 + (2C - DOs + 2C(J - DOe]
If there is no heterogeneity between subpopulations or ethnic groups (Os = 0e = 0), then the ethnic bias is clearly positive. This holds because 1 < I and hence the estimated allele frequencies within an ethnic group have a larger variance. In general, unless the heterogeneity is quite large, the estimate of ethnic diversity will be overestimated. This effect is made smaller as CJ increases.
A similar calculation reveals that ~3 is a biased estimator of q~3 with the following estimate of the subpopulation diversity bias:
1 subpopulation bias = ~-~ (K - 1)
1
4CJ - - - ( K - 1)[1 + (2C - DOs].

DEVLIN ET AL. �9 NRC's REPORT ON DNA TYPING 33
Provided there is a moderate to small amount of subpopulation diversity, the bias is again positive because 1 < J with the bias decreasing as C gets large.
Unless there is a great deal of population structure it is clear by subtraction that the subpopulation bias is greater than the ethnic bias because 1 < J < IJ. Hence, using this method of partitioning diversity, sampling error can cause ethnic diversity to appear smaller than subpopulation diversity, when in fact the reverse is tree. An approximation for the excess bias defined as subpopulation bias minus ethnic bias can be obtained:
e x c e s s b i a s - K - 1 { [ ~ C + 2 - - 2cIJ 2cJ + s - i ) - +
For small C (relative to 0~,0e) this bias is dominated by the first term, which is positive. Moreover this bias will be exacerbated when K is large. These results may be sufficient to explain Lewontin's original result and Latter's contradictory result because Latter's study had larger sample sizes. (The results on bias will also be illustrated by simulations in a subsequent section of this manuscript.) For large C the excess bias can be negative, but only if OE/Os <- 2I/J. In human populations, because of considerable gene flow between subpopulations, it may not be uncommon that Os and Oe are of the same order of magnitude.
For U.S. populations, gene diversity is greater among ethnic groups than among sub- populations [30]. This fact also contradicts the committee's argument that information on differences among subpopulations cannot be inferred by examining variation between ethnic groups. In fact, examination of the effects of mixture of ethnic groups arguably provides an upper bounds on the effects of subpopulation mixture. When mixture of ethnic groups has been examined [24], the effects of mixture on estimates of genotype frequencies in general ethnic databases have been found to be relatively small.
Supporting evidence for the expectation that subpopulations of an ethnic group are relatively homogeneous comes from the results of tests of the independence assumptions. These tests reveal little or no violations of independence when electrophoretic phenom- ena (for example, correlated measurement error, coalescence, and null alleles) are taken into account [19-23]. Nevertheless, some researchers have suggested that the tests lack power. The NRC panel apparently agreed with this logic, arguing that subpopulation differentiation could be substantial, even though analyses find no significant violations of independence assumptions in forensic databases. While such tests are not very sen- sitive to mixture of similar populations, they are sensitive if the mixture induces mean- ingful differences between the true genotype frequencies and those estimated assuming Hardy Weinberg and Linkage equilibrium (HWE and LE respectively). In other words, no test is powerful against a weak alternative hypothesis.
To illustrate this fact, we previously examined the power of a composite test for heterozygote excess or deficiency [19] to detect mixture of African American and Can- casian populations [31]. We found that, for a sample of 1000 individuals from each ethnic group in the Lifecodes database, the assumption of HWE could be rejected 21, 55.5 and 100% of the time for the loci D17S79, D2S44, and D14S13.
To test the power to detect violations of LE (technically multilocus genotype equilib- rium), we again mixed samples of African Americans and Caucasians, with each sub- population in LE. We used the Lifecodes Corporation database to artificially create a mixed population of African Americans and Caucasians by randomly sampling and com- bining single-locus profiles. To test power, each of the N multilocus profiles was a random combination of single locus profiles for a particular ethnic group. The data were analyzed using a standard chi-square statistic for two locus matching [20], and by count- ing three locus matches; 1000 such data sets were analyzed. The null distribution was

34 JOURNAL OF FORENSIC SCIENCES
also simulated using the procedure outlined above with the sole exception that multilocus profiles were a random combination of single locus profiles irrespective of ethnic group.
When each subpopulation consisted of 500 individuals, we found 68.5, 60.8 and 57.7% power to detect mixture for the locus pairs D2-D17, D2-D14 and D14-Dl7 respectively. For three loci, the power to detect mixture was 32.6%. For sample sizes of 1000 African Americans and Caucasians, power to detect mixture was at least 95% for all pairs of loci and 81% for the triplet of loci:
We note that the tests described above, being composite tests (over heterozygotes, all matching genotypes), are not necessarily the most powerful tests available. Weir [22,23] has described likelihood ratio tests that are potentially more powerful. As we stated previously, tests of independence reveal little or no violations when electrophoretic phe- nomena are taken into account. Nevertheless we believe that it is beneficial to thoroughly examine the effects of mixture of ethnic groups on genotype frequency estimates because such analyses do provide information on the effects of mixture in general ethnic data bases. Plots of multilocus genotype frequencies for one ethnic group versus another are also informative [5,22,23,26], but this approach exaggerates the error in genotype fre- quency estimates calculated from a general ethnic database because the error induced by mixture of populations is a function of variances and covariances, not the values themselves.
In summary, we conclude that there is no scientific motivation for the NRC panel's ceiling principle. On the other hand, the population genetic results for traditional genetic markers and VNTR loci are sufficient to conclude that the ceiling principle is conser- vative as long as the appropriate reference population is a general ethnic population, or a subpopulation that is not severely inbred or severely out of Hardy Weinberg or linkage equilibrium: on this point there is undoubtedly consensus. In our view, the population genetic results show that the NRC's method will almost always be extremely conser- vative. As we noted elsewhere [1], we recognize that the appropriate degree of conser- vativeness is a decision for legal scholars, not population geneticists or statisticians.
Design of the Population Genetics Study
Based on their unfounded arguments concerning human population genetics and based on a desire to be conservative, the NRC panel described a novel method for calculating genotype "probabilities." Their suggestion, which they call the ceiling principle, is to study 15 to 20 "relatively genetically homogeneous" populations, with examples being English, Germans, Russians, Navajos, Puerto Ricans, West Africans, among others. One would estimate allele frequencies from these populations for the VNTR loci commonly used for forensics. Then, for any particular profile's set of sizings, one would choose the maximum allele frequency found among the study populations (the ceifing). In ad- dition, they add the condition that no allele frequency should be below 10% or possibly 5%; the lower bound would be used in the unlikely event that no significant population heterogeneity is found. For discussion of this method, see Morton [7] and Morton et al. [8]. To assess population heterogeneity and determine ceiling frequencies, the panel recommends collecting 100 individuals from each population. For either objective, this sample size is far too small.
We said above that it was an unlikely evem that no heterogeneity would be found by the proposed study because existing databases are sufficient to determine that significant differences exist among the major ethnic groups and even some subpopulations. Because the ethnic allele distributions are already known to be different, only two relevant pop- ulation genetic questions remain: Are allele distributions of subpopulations of the same ethnic group very different; and, how much of the genetic variance or genetic diversity is attributable to ethnic groups, to subpopulations within ethnic groups and to individuals

DEVLIN ET AL. �9 NRC's REPORT ON DNA TYPING 35
within subpopulations? The proposed experimental design is unlikely to yield any sat- isfactory answers to these questions. It will sample too many ethnic groups at the expense of subpopulations, and it will sample too few individuals within subpopulations. Thus it will incur huge sampling errors. These errors will exaggerate variation between subpopu- lations, and frequently used measures of genetic similarity will exhibit substantial bias. This bias can be extreme for VNTR loci, especially given the panel's design, because the bias is inversely related to sample size, and directly related to the number of alleles and evenness of the allele distribution.
We illustrate this bias by simulation paralleling the NRC study design. For the sim- ulation we randomly generated 15 populations of 100 individuals based on an identical allele distribution. For this allele distribution, we used the "fixed bin [32]" African American allele distribution for the D1S7 locus, estimated from the FBI database (Fig. la). (The fixed bin approach is simply an arbitrary partition of the data into 31 size categories, resulting in far fewer categories than the number of alleles at this locus.) We use Nei's standard genetic similarity [33] to evaluate the similarity S of each simulated population to its true value. S ranges from 1 when the allele distributions are identical to 0 when the populations share no allele; for the simulation, the distance from 1 is a measure of the bias. Comparing populations to the true value, the mean value of S was 0.955; for the pairwise comparisons across simulated populations, the mean value of S was 0.916. See Fig. lb and lc for the two most dissimilar distributions. Although these results reveal substantial bias, the bias is even greater when the allele distribution is analyzed rather than alleles binned into categories: we found a mean value of S = .78 for the HaeIII-derived D2S44 allele distribution estimates compared to their true value for a sample size of 100 individuals [24]. Notably, recently-developed methods reveal even greater variation--perhaps thousands of alleles [34] compared with about 120 for the D2S44 distribution just discussed.
Greater insight into the potential pitfalls of the proposed research can be gained by introducing a second ethnic group into the simulations. This simulation also illustrates the bias of the Shannon information method for evaluating gene diversity, which was described in the previous section. For the second ethnic group, we selected an allele distribution very similar to that presented in Fig. la (S = 0.97). We then randomly generated 15 subpopulations of 100 individuals from each of the ethnic allele distribu- tions. To partition the gene diversity, we used the Shannon information method. Averaged over 5 simulations, most gene diversity was within subpopulations (97.34%), with most of the remainder apportioned to diversity between subpopulations (2.22%). Only 0.44% of the diversity is assigned to ethnic variation. Notice that the diversity of subpopulations is five times larger than the ethnic group diversity when, in fact, the true diversity of subpopulations is 0.
Clearly, if the panel's study is implemented, any sensible partition of the genetic variance should find that most of the variance is attributable to sampling error, much less to variation between subpopulations and between ethnic groups. A method of ana- lyzing allele frequencies, similar to Analysis of Variance, may be most appropriate [29,35,36]. Nevertheless, it is obvious that it will be quite difficult, if not impossible, to partition variances very accurately. Consequently the value of the proposed study, as it is currently designed, is questionable from the population genetics perspective. It will not yield may new insights into whether ethnic groups are significantly differentiated-- they are. Nor will it yield reliable results on how the genetic variation is distributed within and among ethnic groups.
The panel also fails to mention the statistical properties of their study design in relation to choosing ceiling allele frequencies; in fact this approach adds another layer of con- servativeness, because it does not account for sampling error. For example, if populations

> u n n
0.0
1 I t 3
I
I
0.06
I,,
J
I
0.12
I
I
I I I
Alle
le F
requ
ency
0.
0 0.
06
0.12
I
I I
t I
I
--3
q 3 I
] 1 I
J
m I
1
I
0.0 k
0.06
I
I
--7
Z I
-q
I I
I I 1
] I 1
I I
0.12
I
I
CO
c ~J
z >
t-
O
-n
"13
0 ~J
m
z oo
o_
Ill
z m
GO
FIG
. l-
-(a)
Loc
us D
IS7
bin
freq
uenc
ies
for
the
FB
I's
Afr
ican
Am
eric
an s
ampl
e. B
in fr
eque
ncie
s w
ere
obta
ined
usi
ng t
he F
Bl'
s fi
xed
bin
met
hod.
Sec
tion
s (b
) an
d (c
) ar
e th
e m
ost
extr
eme
of
the
freq
uenc
y di
stri
buti
ons
base
d on
15
popu
lati
ons
gene
rate
d fr
om
(a)
wit
h th
e sa
mpl
e si
ze o
f 10
0 in
divi
dual
s, a
s re
com
men
ded
by t
he p
anel
.

DEVLIN ET AL. * NRC's REPORT ON DNA TYPING 3 7
differ only due to sampling error, all of the ceiling frequencies will be overestimated. The inflation can be substantial, as we now derive.
Let X(,) denote the largest observation from a sample of n standard normals. For large n, P(a ,{X( , , ) - b,}) < t) = e x p ( - e -t) [37], where a, = X/2-1og n and b, = X/2 log n - I/2[log log n + log(47r)]/X/2 log n. For n = 15, the 50' th and 95'th per- centiles of X~,)'s distribution are approximately 1.73 and 2.85 respectively. That is, 50% (5%) of the time the largest of the 15 allele frequencies will be 1.73 (2.85) standard deviations above its true value. Applying a normal approximation to the binomial, it follows that when the true allele probability is 0.025 (0.005, 0.200), the sample standard deviation is 0.011 (0.005, 0.028). Thus, for a 40 allele locus having equiprobable alleles, it would be likely to observe some sample frequencies 2.24 times their true values, and about half would be 1.75 times as large. Larger overestimates are obtained for uncommon alleles, and the converse obtains for common al le les-- though in terms of absolute dif- ferences, the overestimate for common alleles is still substantial. These results are based on large sample theory; for the relatively small samples advocated by the NRC report, the exaggeration in allele frequencies could be even more substantial.
In summary, we conclude that the proposed population genetic study should either be abandoned or revised. Abandoning the method does not necessarily imply abandoning the ceiling principle, however, if the courts desire such calculations. Clearly the NRC's interim ceiling principle could be applied. We would favor, however, more sound statis- tical methods [3, 7].
Chain of Custody and Laboratory Error Rates
Existing data on laboratory error rates are frequently misinterpreted. Tile panel 's report does nothing to clarify these misconceptions. The panel states "One commercial labo- ratory reported one false match in 50 samples from each of the first two blind proficiency tests . . . . " Nothing more is said about the proficiency tests, leaving the reader with impression that the error rate is 1/50 = .02. This is consistent with other arguments presented in court. What the panel fails to mention is critical: the tests were structured so that the laboratory had to draw an inference for all possible pairwise comparisons of the 50 samples [38]. Even ignoring the greater difficulty of this test compared to the standard forensic case, the error rate for this lab would be 1/1255 < 0.0008 if the lab indeed made all possible comparisons.
The panel argues that the probability of handling error should not be entangled in the calculation of genotype probabilities. We agree. The reason for this resides in what information is contained in each calculation. The genotype probability calculation con- tains information on only one issue: Were the two samples from the same person? Cal- culation of the probability of a handling error yields information on a different question: Is the information provided by a match irrelevant to the case? The reader can grasp this issue easily by imagining that there was a sample mix-up so that the same sample was loaded twice on the gel. In this case, and given highly polymorphic markers, we still expect the information that the same person was measured twice to be substantial because it is true. Nevertheless the information is also irrelevant because, under the circum- stances, it contributes no information of value to the jurors.
Results from proficiency testing do not provide a valid estimate of the probability of handling error in a particular case, however. For a specific case, there is information available that affects the probability of a handling error: chain of custody documentation, number of different profiles analyzed, various controls and other biological information. Such information cannot be ignored. For instance, suppose two samples are analyzed, one a fresh sample and the other degraded. Then bacterial tests of these samples should

38 JOURNAL OF FORENSIC SCIENCES
yield very different information. If there is no handling error, one sample should be contaminated while the other is not.
Moreover, we do not feel that proficiency testing is, by itself, an efficient means of estimating the a priori probability of a handling error. Statistical methods of estimating error rates exist [39-41]. Such calculations would, in essence, evaluate the complexity and safeguards involved in sample handling to estimate the a priori probability of a handling effort. Proficiency testing also contributes information in this regard. If it is the only information used, however, interpretative problems arise until one has the results from a large number of proficiency tests. How does one evaluate, for instance, the fact that the laboratory has passed its first proficiency test? Furthermore, suppose the labo- ratory takes steps to eliminate the cause of a failed proficiency test?
Finally the panel argued that the presentation of the genotype probability without an estimate of the probability of a handling error was scientifically invalid. We do not agree. As we argued above, the two probabilities contribute information on very different ques- tions. The appropriate question to pose, in this regard, is whether it is legally valid. Only legal scholars are qualified to answer this question.
Conclusions
We have shown here that the claimed basis for the ceiling principle, the larger gene diversity between subpopulations than ethnic groups found by Lewontin [25], can be explained, in part, by bias in the method of partitioning diversity. Notably, subsequent studies of diversity found larger diversity among ethnic groups than among subpopula- tions [1,30]. In addition, we demonstrate via power calculations that population substruc- ture cannot be substantial in U.S. populations.
We show that the study design to determine "ceiling" allele frequencies has several undesirable statistical properties. We demonstrate how sampling error, due to the rela- tively small number of individuals sampled per subpopulation, leads to apparently large differences among "subpopulations" even when no variability is present.
Finally, we discuss the problem of errors in handling samples (either chain of custody or laboratory errors) from the statistical perspective. We argue that the report's discussion of handling errors is misleading, and an a priori estimate of a handling error is not sufficient to evaluate the probability of a handling error in any particular case.
Acknowledgments
Supported by NIH grants HG00648 and CA45052 (to DMS2901211 and DMS9257006 (to K.R.).
N.R.) and NSF grants
References
[I] Devlin, B., Risch, N., and Roeder, K., "Statistical Evaluation of DNA Fingerprinting: A Critique of the NRC Report," Science, Vol. 259, 1993, pp. 748-749, 873.
[2] National Research Council, "DNA Typing: Statistical Basis for Interpretation," DNA Tech- nology in Forensic Science, Chapter 3, Washington, D.C., National Academy Press, 1992, pp. 74-96.
[3] Weir, B. S., "Forensic Population Genetics and the NRC," American Journal of Human Genetics, 1993, Vol. 52, 1993, pp. 437-439.
[4] Evett, I. W., Scrange, J., and Pinchin, R., "An Illustration of the Advantages of Efficient Statistical Methods to RFLP Analysis in Forensic Science," American Journal of Human Genetics, Vol. 52, 1993, pp. 498-505.
[51 Budowle, B., Monson, K. L., Guisti, A. M., and Brown, B. L., "The Assessment of Frequency Estimates in Hae HI--Generated VNTR Profiles in Various Reference Databases," Journal of Forensic Sciences, Vol. 39, No. 2, March 1994, in press.

DEVLIN ET AL. �9 NRC's REPORT ON DNA TYPING 39
[6] Chakraborty, R., Jin, L., Zhong, Y., Srinivasan, M. R., and Budowle, B., "On Allele Fre- quency Computation from DNA Typing Data," American Journal of Human Genetics (submitted).
[7] Morton, N. E., "Genetic Structure of Forensic Populations," Proceedings of the National Academy of Sciences, Vol. 89, 1992, pp. 2556-2560.
[8] Morton, N. E., Collins, A., and Balaz, I., "Kinship Bioassay on Hypervariable Loci in Blacks and Caucasians," Proceedings of the National Academy of Sciences U.S.A., Vol. 90, 1993, pp. 1892-1896.
[9] Weir, B. S., "Population Genetics in the Forensic Debate," Proceedings of the National Academy of Sciences U.S.A., Vol. 89, pp. 11654-11659.
[10] Weir, B. S. and Evett, I. W., "Reply to Lewontin," American Journal of Human Genetics," Vol. 52, 1993, p. 206.
[11] Evett, I. W. and Weir, B. S., "Flawed Reasoning in Court," Chance, Vol. 4, 1992, pp. 19- 21.
[12] Weir, B. S. and Evett, I. W., "Whose DNA?," American Journal of Human Genetics, Vol. 50, 1992, p. 869.
[13] Cohen, J. E., "DNA Fingerprinting for Forensic Identification: Potential Effects on Data Interpretation of Subpopulation Heterogeneity and Band Number Variability," American Jour- nal of Human Genetics, Vol. 46, 1990, pp. 358-368.
[14] Cohen, J. E., "The Ceiling Principle Is Not Always Conservative in Assigning Genotype Frequencies for Forensic DNA Testing," American Journal of Human Genetics, Vol. 51, 1992, pp. 1165-1167.
[15] Lander, E., "DNA Fingerprinting on Trial," Nature, Vol. 339, 1989, pp. 501-505. [16] Lewontin, R. C. and Hartl, D. L., "'Population Genetics in Forensic DNA Typing," Science,
Vol. 254, 199I, pp. 1745-1750. [17] Chakraborty, R. and Kidd, K. K., "The Utility of DNA Typing in Forensic Work," Science,
Vol. 254, 1991, pp. 1735-1739. [18] Chakraborty, R. and Jin, L., "Heterozygote Deficiency, Population Substructure and their
Implications in DNA Fingerprinting," Human Genetics, Vol. 88, 1992, pp. 267-272. [19] Devlin, B., Risch, N., and Roeder, K., "No Excess Homozygosity at DNA Fingerprinting
Loci," Science, Vol. 249, 1990, pp. 1416-1420. [20] Risch, N. and Devlin, B., "On the Probability of Matching DNA Fingerprints," Science, Vol.
255, 1992, pp. 717-720. [21] Devlin, B. and Risch, N., "A Note on Hardy-Weinberg Equilibrium of VNTR Data Using
the FBI's Fixed Bin Method," American Journal of Human Genetics, Vol. 51, 1992, pp. 549- 553.
[22] Weir, B. S., "Independence of VNTR Alleles Defined by Fixed Bins," Genetics, Vol. 130, 1992, pp. 873-887.
[23] Weir, B. S., "Independence of VNTR Allele Defined as Floating Bins," American Journal of Human Genetics, Vol. 51, 1992, pp. 992-997.
[24] Devlin, B. and Risch, N., "Ethnic Differentiation at VNTR Loci, with Special Reference to Forensic Applications," American Journal of Human Genetics, Vol. 51, 1992, pp. 534-548.
[25] Lewontin, R. C., "The Apportionment of Human Diversity," Evolutionary Biology, Vol. 6, 1972, pp. 381-398.
[26] Balazs, I., "Population Genetics of t4 Ethnic Groups Using Phenotypic Data from VNTR Loci," Second International Conference on DNA Fingerprinting, S. D. J. Pena, R. Chakra- borty, J. T. Epplen, A. J. Jeffries, Eds., Birhauser Verlag, New York, 1993, pp. 193-210.
[27] Latter, B. H. D., "Genetic Differences Within and Between Populations of the Major Human Subgroups," The American Naturalist, Vol. 116, 1980, pp. 220-237.
[28] Wright, S., "Evolution and the Genetics of Populations. Vol. 2. The Theory of Gene Fre- quencies," The University of Chicago Press, 1969, Chicago.
[29] Cockerham, C. C., "Variance of Gene Frequencies," Evolution, Vol. 23, 1969, pp. 72-84. [30] Chakraborty, R., "NRC Report on DNA Typing," Science, Vol. 260, 1993, pp. 1059-1060. [31] Devlin, B., Risch, N., and Roeder, K., "Forensic DNA Tests and Hardy Weinberg Equilib-
rium," Science, Vol. 243, 1991, 1039-1041. [32] Budowle, Giusti, A. M., Waye, J. S., Baechtel, E S., Fourney, R. M., Adams, D. E., Presley,
L. A., Deadman, H. A., and Monson, K. L., "Fixed-Bin Analysis for Statistical Evaluation of Continuous Distributions of Allelic Data from VNTR Loci for Use in Forensic Compari- sons," American Journal of Human Genetics, Vol. 48, 1991, pp. 841-855.
[33] Nei, M., "Molecular Evolution Genetics," Columbia University Press, 1987, New York. [34] Jeffries, A. J., MacLeod, A., Tamaki, K., Neil, D., and Moncton, D., "Minisatellite Repeat
Coding as a Digital Approach to DNA Typing," Nature, Vol. 354, 199I, pp. 204-209. [35] Weir, B. S., "Genetic Data Analysis," 1990 Sinauer Associates, Inc., Sunderland,
Massachusetts.

40 JOURNAL OF FORENSIC SCIENCES
[36] Long, J. C., Smouse, P. E., and Wood, J. W., "The Allelic Correlation Structure of the Gainj- and Kalam-Speaking People. II. The Genetic Distance Between Population Subdivisions," Genetics, Vol. 117, 1987, pp. 273-283.
[37] David, H. A., "Order Statistics," 1970, Wiley, New York. [38] California Association of Crime Lab Directors, Report to the Directors. [39] Hartigan, J. A., "Partition Models," Communications in Statistical Theory and Methods, Vol.
19, 1990, pp. 2745-2756. [40] Lavine, M., "Problems in Extrapolation Illustrated with Space Shuttle ORing Data (with
discussion)," Journal of the American Statistical Association, Vol. 86, 1991, pp. 919-923. [41] Martz, H. F. and Zirnmer, W. J., "The Risk of Catastrophic Failure of the Solid Rocket
Boosters on the Space Shuttle," The American Statistician, Vol. 46, 1992, pp. 42-47.
Address requests for reprints or additional information to B. Devlin Epidemiology and Public Health Yale University School of Medicine 60 College St. New Haven, CT 06510