Comments on Shin and Shin Bank of Korea Research Conference May 31- June 1, 2010 Mark M. Spiegel...
25
Comments on Shin and Shin Bank of Korea Research Conference May 31- June 1, 2010 Mark M. Spiegel Vice President, Economic Research Director, Center for Pacific Basin Studies Comments are my own and not those of the Federal Reserve
-
date post
20-Dec-2015 -
Category
Documents
-
view
214 -
download
0
Transcript of Comments on Shin and Shin Bank of Korea Research Conference May 31- June 1, 2010 Mark M. Spiegel...
Comments on Shin and Shin
Bank of Korea Research ConferenceMay 31- June 1, 2010
Mark M. SpiegelVice President, Economic ResearchDirector, Center for Pacific Basin Studies
Comments are my own and not those of the Federal Reserve

Paper examines information in money aggregates for macro-prudential policy
• Ratios of credit to money likely to be positively correlated with financial leverage – Such aggregates may therefore provide indications of
financial vulnerabilities– Typically characterize assets as being more “money
like” on basis of ease of settlement• However, this criterion not always useful for
indentifying financial vulnerability• Ex.: Overnight repos highly liquid, but can be
source of systemic vulnerability

“Core” vs. “Non-core” liabilities
• Identity of claims holder is relevant• Core liabilities:
– Claims held by domestic household sector• Non-core liabilities:
– Repos and other claims held by banks and other financial sector firms
– Foreign liabilities, particularly short-term and denominated in hard currencies

Korean non-core liabilities
• Demonstrates major buildups prior to 1997 Asian and 2008 Global Financial crises
• Also finds close correlations between measure of non-core liabilities and market-based measures of financial vulnerability
• Suggests evidence lends support to argument for tax on non-core liabilities

Gross positions and maturities matter
• Inflation of bank balance sheets positively related to financial vulnerability
• Collapses (e.g. Northern Rock) typically preceded by substantial buildup of non-core liabilities
• Also finds buildup of short-term liabilities immediately preceding collapse

Extension to open economy
• Adrian, Etula, Shin (2009)– Repos and outstanding CP of U.S. banks suggest
increased global appetite for risk– Reduces currency premium on foreign holdings– Implies reduced appreciation of foreign currency
• This paper tests hypothesis for won/dollar– Confirms that non-core liabilities growth
negatively correlated with won valuation– Argues consistent with “risk appetite” theory

Comments

Four questions
• Do we want to limit buildup of gross liabilities and interbank lending in financial system?
• Do we want to limit foreign liabilities?• Is it desirable to use a tax policy to achieve
these goals?• Questions concerning parametric results

I. Interbank liabilities
• Source of systemic risk– Interbank liabilities can cause contagion, as difficulties
weaken creditor bank balance sheets– Vehicle for excessive leverage growth
• CP/M2 grew in Korea during boom
– Encouraged shorter-term liabilities to support complex financing chains
• Limits policy responses– Can prove difficult to unwind quickly in crises, limiting
scope for intervention– Sometimes difficult to even know who is exposed

Do we know that inter-bank lending harmed crisis performances?
• Rose-Spiegel (2009)– Used “MIMIC” approach to gauge crisis
performance of broad cross-section in 2008– Compared to proposed causes measured in 2006
• Financial conditions had some effect– One measure of leverage significant at 10%
confidence level– Equally plausible other proxies insignificant
• Don’t directly measure inter-bank claims

Rose-Spiegel results for financial conditionsExtra Cause Default Euromoney,
not II Drop
Exchange Rate Different Estimator
Region/Income Dummies
Financial Conditions Domestic Credit
Private Sector, %GDP 2006
-.06 (.05)
-.05 (.04)
-.05 (.04)
-.05 (.03)
-.091* (.045)
Domestic Bank Credit, %GDP 2006
-.06 (.04)
-.06* (.03)
-.02 (.04)
-.056* (.025)
-.09* (.04)
Private Sector Credit Access, 2006
-.34 (1.66)
-.15 (1.68)
.25 (1.80)
-.28 (2.63)
.68 (1.51)
Bank Non-Performing Loans, % Loans 2006
-1.00 (.53)
-1.04 (.53)
-1.00 (.53)
-1.10* (.42)
n/a
Bank Liquid Reserves, %Assets 2006
.03 (.11)
.05 (.06)
.01 (.10)
.05 (.06)
-.06 (.08)
Bank Capital, %Assets 2006
.21 (.69)
.24 (.62)
.61 (.89)
.21 (.60)
-.19 (.76)
Bank Claims, %Deposits 2006
-9.1* (4.3)
-6.39* (2.92)
-8.53* (3.94)
-6.2* (2.7)
.01 (.01)

Bank Claim/Deposits at 10% Confidence
0-5
0-1
00
0 1 2 3 4
Stock Market Change
-50
050
100
0 1 2 3 4
Depreciation against SDR
10-1
0-3
0
0 1 2 3 4
Country Credit Rating Change
155
-5
0 1 2 3 4
GDP Growth Rate
2006 Bank Claims (%Deposits), IFS
2008 Crisis Manifestations against Bank Claim/Deposit Ratio

Bank Leverage Insignificant0
-50
-100
5 10 15 20 25
Stock Market Change
-50
050
100
5 10 15 20 25
Depreciation against SDR
10
-10
-30
5 10 15 20 25
Country Credit Rating Change
15
5-5
5 10 15 20 25
GDP Growth Rate
2006 Bank Capital (%Assets), WDI
2008 Crisis Manifestations against Bank Capital Adequacy

Other concerns
• Moving assets “off grid”– Paper argues analysis should also apply to “… securities firms and other intermediaries”– Easier said than done– Stricter bank regulation could move assets “off-grid” to
non-banks, reducing regulatory oversight• Diversification
– Used to talk about need to reduce exposure to specific areas (e.g. agriculture)
– Now appreciate systemic component more, but idiosyncratic issues still there, notably for small banks
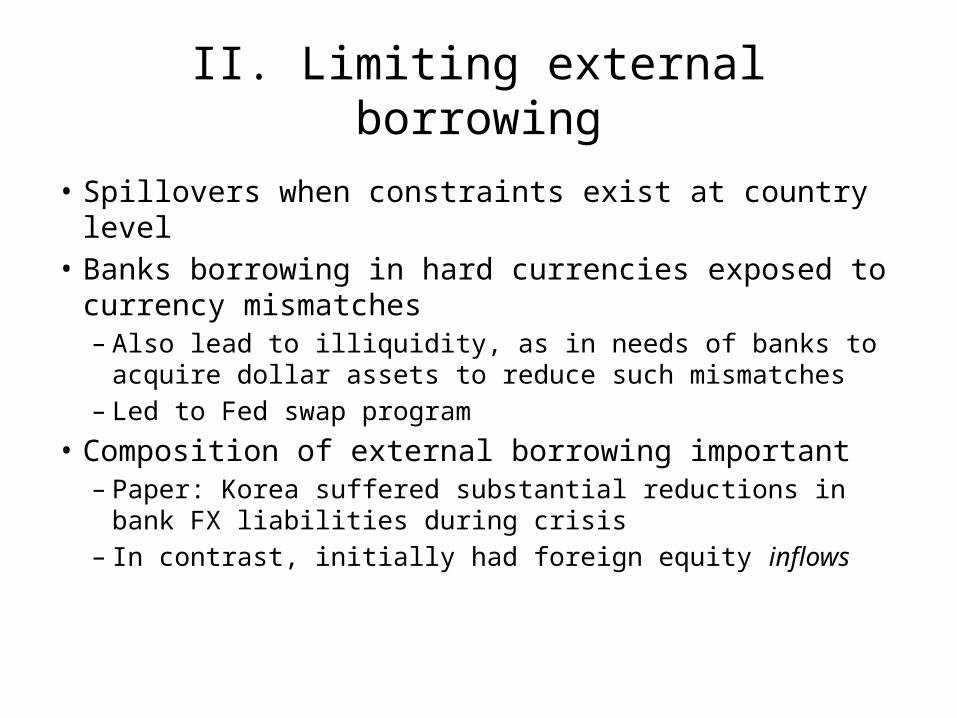
II. Limiting external borrowing
• Spillovers when constraints exist at country level • Banks borrowing in hard currencies exposed to
currency mismatches– Also lead to illiquidity, as in needs of banks to acquire
dollar assets to reduce such mismatches– Led to Fed swap program
• Composition of external borrowing important– Paper: Korea suffered substantial reductions in bank FX
liabilities during crisis– In contrast, initially had foreign equity inflows

Rose-Spiegel results for int’l imbalancesExtra Cause Default Euromoney,
not II Drop Exchange
Rate Different Estimator
Region/Income Dummies
International Imbalances Net External Position,
%GDP 2004 4.23
(2.58) 5.07* (2.11)
3.36 (2.66)
5.07* (2.12)
2.1 (3.6)
Current Account, %GDP 2006
.56** (.17)
.57** (.18)
.41** (.17)
.54** (.16)
-.08 (.16)
Debt Service, % Exports 2006
-.17 (.42)
-.17 (.41)
-.36 (.38)
-.01 (.16)
n/a
External Debt, %GNI 2006
-.01 (.18)
-.01 (.17)
n/a .24** (.06)
n/a
Gross Financing via international
capital markets, % GDP 2006
2.32** (.31)
.0000 (.0002)
-.84 (.63)
2.20** (.31)
n/a
Real Effective Exchange Rate 2006 (2000=100)
-.22 (.13)
-.22 (.13)
-.23 (.15)
-.19 (.10)
n/a
Total Reserves, %external debt 2006
-.00 (.01)
-.028** (.007)
.01 (.01)
-.002 (.004)
-.013* (.005)
Short-Term Debt, %Reserves 2006
.36** (.08)
.00010* (.00002)
-.10 (.10)
.13** (.03)
.36** (.04)
Total Reserves, import months 2006
.36 (.43)
.40 (.33)
.14 (.38)
.40 (.35)
-.15 (.36)
M2, %(total reserves–gold) 2006
0 -.000001 (.00003)
.26 (.17)
-.00001 (.00006)
.02 (.14)
M2, %(Central Bank foreign assets) 2006
1.7e-7 (1.6e-6)
0 .09 (.05)
0 .-02 (.05)

0-5
0-1
00
0 10 20 30
Stock Market Change
-50
050
100
0 10 20 30
Depreciation against SDR
10-1
0-3
0
0 10 20 30
Country Credit Rating Change
155
-5
0 10 20 30
GDP Growth Rate
World Development Indicators
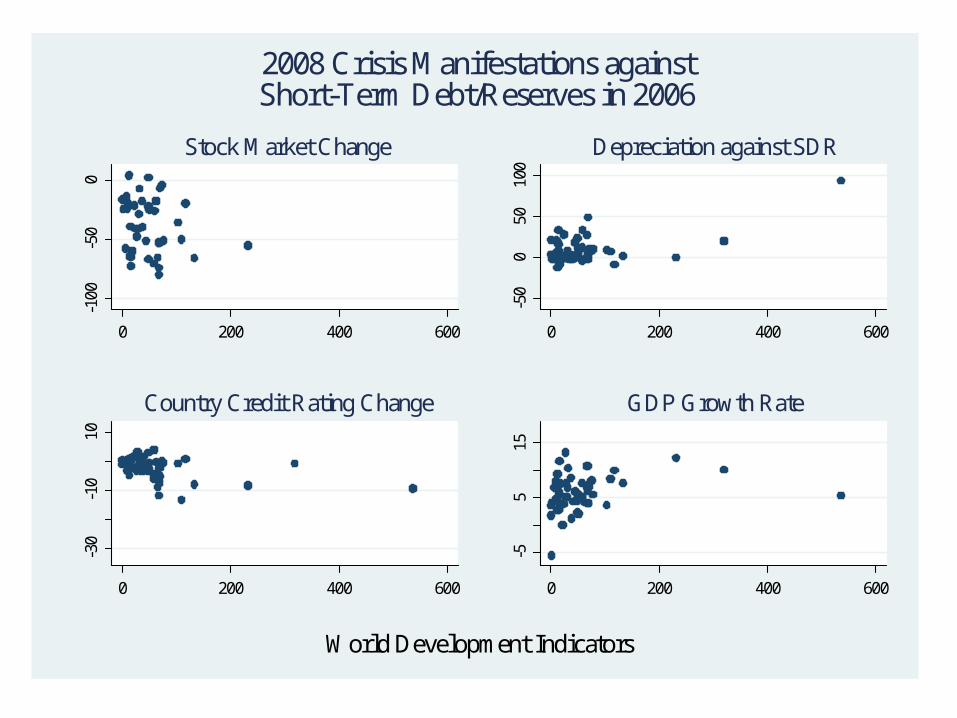
2008 Crisis Manifestations againstGross Financing via Int'l Capital Markets (%GDP) in 2006
0-5
0-1
00
0 200 400 600
Stock Market Change
-50
050
100
0 200 400 600
Depreciation against SDR
10-1
0-3
0
0 200 400 600
Country Credit Rating Change
155
-5
0 200 400 600
GDP Growth Rate
World Development Indicators
2008 Crisis Manifestations againstShort-Term Debt/Reserves in 2006

III. Is tax levy the desirable policy?
• While paper focuses on tax levies on non-core liabilities, it acknowledges alternatives– Time-varying capital requirements (Basel III)– Capital surcharges for large and complex financial
institutions • Claim that levies desirable as they are “priced”
– Induces banks to take account of externality– But if banks are in heterogeneous financial conditions,
willingness to pay tax may be greatest among weakest banks “gambling for resurrection”
• Could use all instruments in optimal combination
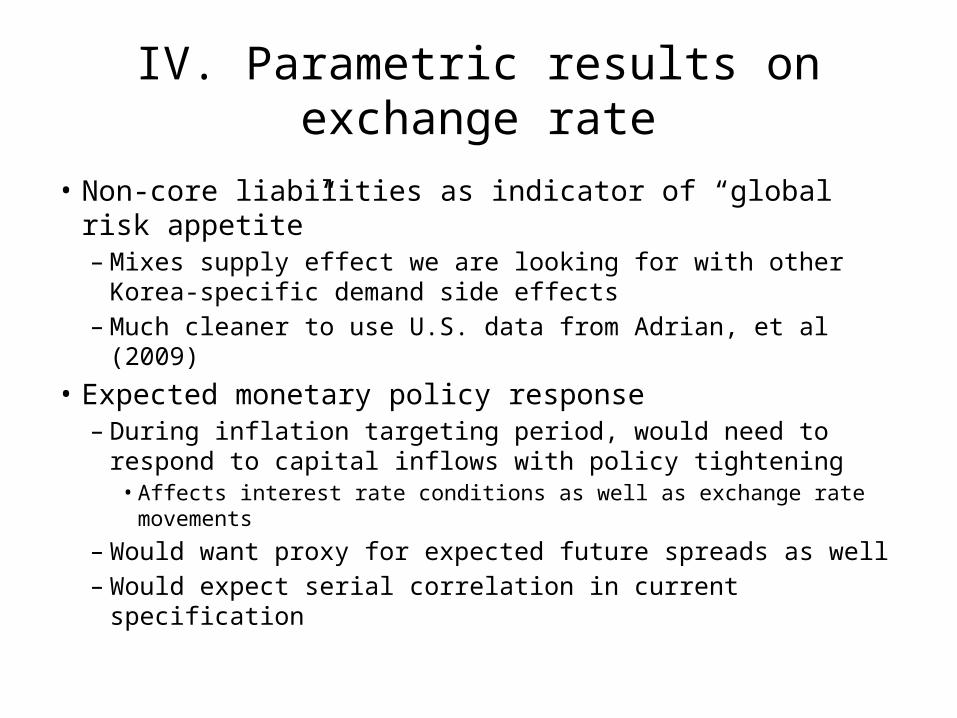
IV. Parametric results on exchange rate
• Non-core liabilities as indicator of “global risk appetite”– Mixes supply effect we are looking for with other Korea-
specific demand side effects– Much cleaner to use U.S. data from Adrian, et al (2009)
• Expected monetary policy response– During inflation targeting period, would need to respond to
capital inflows with policy tightening• Affects interest rate conditions as well as exchange rate movements
– Would want proxy for expected future spreads as well– Would expect serial correlation in current specification

2005-2008 BOK raised policy rate in response to financial inflows
-50
-40
-30
-20
-10
0
10
20
0
1
2
3
4
5
6
2002 2003 2004 2005 2006 2007 2008 2009 2010Source: CEIC data
2002 Q1 to 2010 Q1Korea: Monetary Policy Rate & Financial Inflows
Percent USD Bn
Financial Account (right)
Policy Rate (left)

Episode coincided with won appreciation
0.0004
0.0006
0.0008
0.0010
0.0012
0
1
2
3
4
5
6
2002 2003 2004 2005 2006 2007 2008 2009 2010Source: CEIC data
2002 Q1 to 2010 Q1Korea: Monetary Polity Rate & Exchange Rate
Percent USD/KRW
Policy Rate (left)
USD/KRW (right)

Credit spread results• Paper claims that increased non-core liabilities
should be associated with increased credit spreads– Explanation is that financial intermediaries would be
willing to borrow at higher rates• Seems contradictory with exchange rate story
– That story stresses supply side, global appetite for risk– This story on demand side, based on bank risk appetites
• Need more structure for both specifications to deal with identification– U.S.-based proxy for “global risk appetite” could help
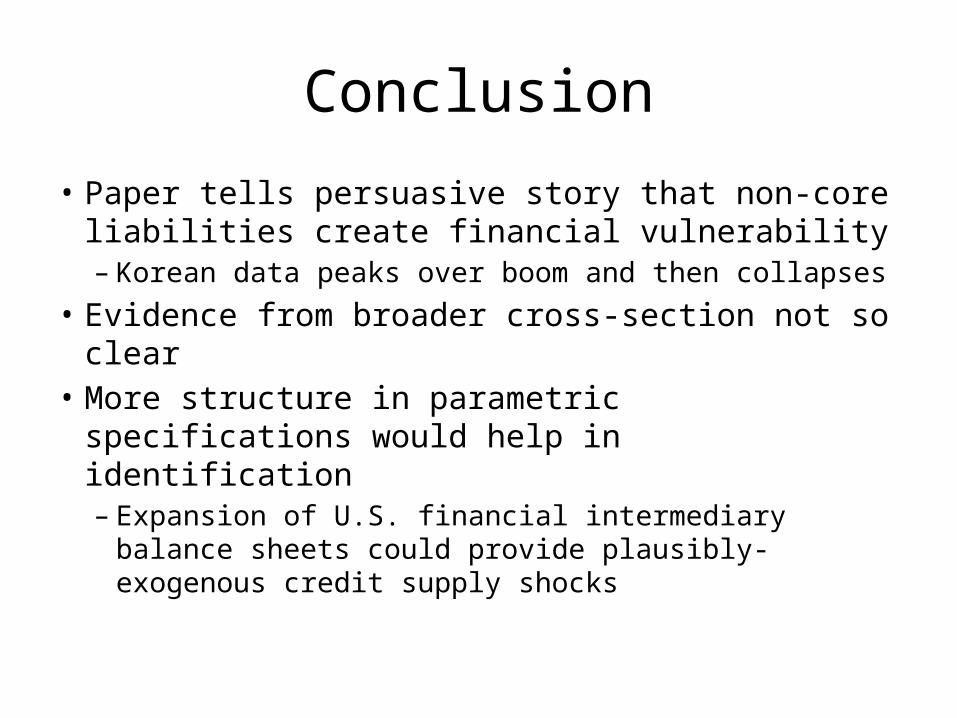
Conclusion
• Paper tells persuasive story that non-core liabilities create financial vulnerability– Korean data peaks over boom and then collapses
• Evidence from broader cross-section not so clear • More structure in parametric specifications
would help in identification– Expansion of U.S. financial intermediary balance
sheets could provide plausibly-exogenous credit supply shocks