PROPOSED REMEDIAL ACTION PLAN G.E. Fort Edward Plant Site ...

SDMS DocID 2171343
UNITED STATES ENVIRONMENTAL PROTECTION AGENCY REGION III
841 Chestnut Building Philadelphia, Pennsylvania 19107
VIA CERTIFIED MAIL RETURN RECEIPT REQUESTED
Mr. Ron L Conaway Environmetal Manager LCP S i t e - Project Coordinator LCP Chemicals - West V i r g i n i a , Inc. P.O. Drawer J Moundsville, WV 26041
MAR 8 • 1990
Re: LCP Chemicals Sulfuric Acid Spill Site, Moundsville, WV
Dear Ron:
We have reviewed the Work Plan (the plan) submitted by Geraghty and M i l l e r , Inc. (GMI) on behalf of LCP Chemicals - West V i r g i n i a , Inc. This plan was submitted pursuant to the requirements of the EPA Consent Order issued to LCP Chemicals December 8, 1989 (Docket No. III-89-34-DC).
The Work Plan seems complete and reaches appropriate conclusions as f a r as the hydrogeologic i n v e s t i g a t i o n and operational a c t i v i t i e s are concerned. However, the plan does not include information regarding the Health and Safety Plan (HASP), the methodology to be used and schedule of implementation for the t r e a t a b i l i t y study, the i d e n t i t y and q u a l i f i c a t i o n s of the laboratory to be u t i l i z e d for sample analysis and a s p e c i f i c schedule of implementation for the operational phase of the project.
The plan s p e c i f i c a l l y i d e n t i f i e s the constituents which t y p i c a l l y comprised the spent s u l f u r i c acid stored i n tank 002. The hydrogeologic investigation performed by GMI, indicates that these and several other organic contaminants are present i n the subsurface s o i l s and groundwater beneath the 002 tank farm. Because of t h i s information, we f e e l that additional discussion i s warranted before f i n a l s e lection of the remedy and the scope of such remedy i s determined. More s p e c i f i c a l l y , i f s o i l mixing i s implemented we f e e l that the data you have provided suggests that some sort of vapor extraction or c o l l e c t i o n system should be performed p r i o r to, or concurrently with the s o i l mixing. Ad d i t i o n a l l y , we have some concern that there i s a need f o r a i r monitoring from a worker health and safety standpoint.
The data also indicates that a pH below the ARAR l e v e l was i d e n t i f i e d at a depth 18 - 20 feet. A d d i t i o n a l l y , the plan states that the depth of mixing w i l l be determined by taking an average
1CG023

2
of the pH for that particular boring. Therefore, we feel that i f soil mixing is implemented, the equipment used should have the capacity to mix the soils at depths greater than 20 feet below grade and that pH of the deepest sample should determine the depth of treatment.
Please contact me so that we can develop a revised Work Plan that reflects these comments. I suggest that you, myself and Tim Ratvasky of GMI meet personally or via teleconference as soon as possible but no later than 10 APR 90 to discuss these issues.
Sincerely,
Harry T. Daw, Enforcement Project Manager Enforcement and Title III Section.
cc: Tim Ratvasky, GMI Diane Ajl, ORC [3RC22]
100024

PROPOSED REMEDIAL WORK PLAN FOR THE LCP SULFURIC ACID
SPlLirSrTE
LCP CHEMICALS-WEST VIRGINIA, INC. MOUNDSVILLE, WEST VIRGINIA
JANUARY 5, 1990
Prepared for
LCP CHEMICALS-WEST VIRGINIA, INC. MOUNDSVILLE, WEST VIRGINIA
Prepared by
GERAGHTY & MILLER ,INC. ENVIRONMENTAL SERVICES
429 WASHINGTON TRUST BUILDING WASHINGTON, PA 15301
100025
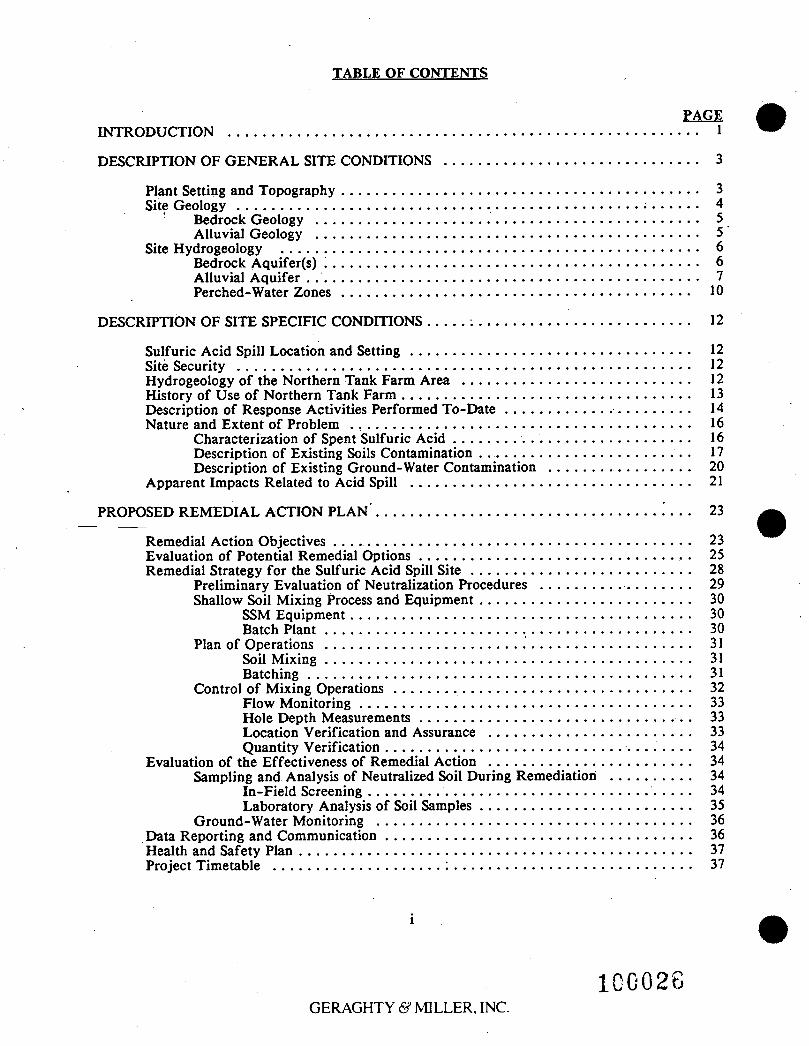
TABLE OF CONTENTS
PAGE INTRODUCTION 1
DESCRIPTION OF GENERAL SITE CONDITIONS 3
Plant Setting and Topography 3 Site Geology • 4
1 Bedrock Geology 5 Alluvial Geology 5
Site Hydrogeology 6 Bedrock Aquifer(s) 6 Alluvial Aquifer . 7 Perched-Water Zones 10
DESCRIPTION OF SITE SPECIFIC CONDITIONS 12
Sulfuric Acid Spill Location and Setting 12 Site Security 12 Hydrogeology of the Northern Tank Farm Area 12 History of Use of Northern Tank Farm 13 Description of Response Activities Performed To-Date 14 Nature and Extent of Problem 16
Characterization of Spent Sulfuric Acid 16 Description of Existing Soils Contamination . . 17 Description of Existing Ground-Water Contamination 20
Apparent Impacts Related to Acid Spill 21
PROPOSED REMEDIAL ACTION PLAN' 23
Remedial Action Objectives 23 Evaluation of Potential Remedial Options . 25 Remedial Strategy for the Sulfuric Acid Spill Site 28
Preliminary Evaluation of Neutralization Procedures 29 Shallow Soil Mixing Process and Equipment 30
SSM Equipment 30 Batch Plant 30
Plan of Operations 31 Soil Mixing 31 Batching 31
Control of Mixing Operations 32 Flow Monitoring 33 Hole Depth Measurements . 33 Location Verification and Assurance 33 Quantity Verification 34
Evaluation of the Effectiveness of Remedial Action 34 Sampling and Analysis of Neutralized Soil During Remediation 34
In-Field Screening 34 Laboratory Analysis of Soil Samples 35
Ground-Water Monitoring 36 Data Reporting and Communication 36 Health and Safety Plan 37 Project Timetable . : 37
GERAGHTY & MILLER, INC. 100026

LIST OF TABLES
TABLE 1 CLASSIFICATION OF UNCONSOLIDATED SOILS BASED UPON GRAIN-SIZE DISTRIBUTION
TABLE 2 RESULTS OF LABORATORY ANALYSES AND CONSTANT HEAD PERMEABILITY OF SELECTED SOIL SAMPLES
TABLE 3 RANNEY WELL PUMPING RATES, JANUARY 1985 THROUGH MARCH 1989
TABLE 4 RESULTS OF PUMPING TESTS PERFORMED ON ALLUVIAL AQUIFER TEST HOLES AT ROUND BOTTOM, WEST VIRGINIA
TABLE 5 SELECTED OHIO RIVER STAGE DATA OCTOBER 1985 TO SEPTEMBER 1986 MARTINS FERRY, OHIO MEASURING STATION
TABLE 6 GROUND-WATER ELEVATION DATA
TABLE 7 GROUND WATER ELEVATIONS WITHIN THE NORTHERN TANK FARM AREA (SEPTEMBER 12, 1989)
TABLE 8 CALCULATED GROUND-WATER FLOW VELOCITIES IN THE VICINITY OF THE NORTHERN TANK FARM
TABLE 9 CHRONOLOGY OF RESPONSE ACTIONS AND PRINCIPAL EVENTS, SULFURIC ACID SPILL
TABLE 10 COMPOSITION OF SPENT SULFURIC ACID
TABLE 11 SULFURIC ACID CONCENTRATIONS IN SOIL SAMPLES COLLECTED WITHIN THE CONTAINMENT AREA
TABLE 12 FREE SULFURIC ACID CONCENTRATIONS IN SOIL SAMPLES COLLECTED FROM BORING AS-AH-1
TABLE 13 RESULTS OF ANALYSES FOR CONTRACT LABORATORY PROGRAM (CLP) METALS IN SOIL SAMPLE AS-AH-1, 4 TO 6 FEET
TABLE 14 RESULTS OF ANALYSES FOR HALOGENATED VOLATILE ORGANIC COMPOUNDS IN SELECTED TANK 002 CONTAINMENT AREA SOIL SAMPLES
TABLE 15 VOLATILE ORGANIC COMPOUNDS IN SELECTED SOIL SAMPLES COLLECTED FROM BORING AS-AH-1
TABLE 16 VOLATILE ORGANIC COMPOUNDS OF THE USEPA SUPERFUND TARGET COMPOUND LIST IN SOIL SAMPLE NUMBER AS-AH-1, 4 TO 6 FEET
TABLE 17 GROUND-WATER QUALITY IN THE VICINITY OF OBSERVATION WELL CLUSTER 32
TABLE 18 RESULTS OF ANALYSES FOR pH, SPECIFIC CONDUCTANCE, TEMPERATURE AND SULFATE IN TANK FARM MONITORING WELLS, JANUARY 8, 1989
TABLE 19 RESULTS OF GROUND-WATER MONITORING, SULFURIC ACID SPILL SITE
l i
GERAGHTY & MILLER, INC. 100027

LIST OF TABLES (continued)
TABLE 20 VOLATILE ORGANIC CHEMICAL CONCENTRATIONS IN SELECTED TANK FARM MONITORING WELLS (WELLS SAMPLED JULY 20, 1989)
TABLE 21 VOLATILE ORGANIC CHEMICAL CONCENTRATIONS IN SELECTED TANK FARM MONITORING WELLS (WELLS SAMPLES AUGUST 21, 1989)
TABLE 22 WATER-QUALITY ANALYSES TO BE PERFORMED ON GROUND-WATER SAMPLES FROM TANK FARM MONITORING WELLS
TABLE 23 MONITORING WELLS TO BE SAMPLED UNDER THE SULFURIC ACID SPILL REMEDIAL ACTION PROGRAM
LIST OF FIGURES
FIGURE 1 LOCATION MAP
FIGURE 2 LOCATION OF RIVER TERRACES
FIGURE 3 GENERALIZED STRATIGRAPHIC SECTION OF BEDROCK BENEATH WEST VIRGINIA'S NORTHERN PANHANDLE
FIGURE 4 STRUCTURAL DEFORMATION (FAULTING AND FOLDING) IN BEDROCK BENEATH WEST VIRGINIA'S NORTHERN PANHANDLE
FIGURE 5 STRUCTURAL CONTOUR MAP OF THE BURIED BEDROCK SURFACE BENEATH THE LCP CHEMICALS-WEST VIRGINIA, INC. MOUNDSVILLE PLANT
FIGURE 6 REPRESENTATIVE CROSS SECTION OF THE OHIO RIVER VALLEY AT ROUND BOTTOM
FIGURE 7 ORIENTATION OF GEOLOGIC CROSS-SECTIONS
FIGURE 8 GENERALIZED GEOLOGIC CROSS SECTION A-A'
FIGURE 9 GENERALIZED GEOLOGIC CROSS SECTION B-B'
FIGURE 10 GENERALIZED GEOLOGIC CROSS SECTION C - C
FIGURE 11 GENERALIZED GEOLOGIC CROSS SECTION D-D'
FIGURE 12 GENERALIZED GEOLOGIC CROSS SECTION E-E'
FIGURE 13 GENERALIZED GEOLOGIC CROSS SECTION F - F
FIGURE 14 GENERALIZED GROUND-WATER FLOW PATTERNS WITHIN THE LOWER PORTION OF THE ALLUVIAL AQUIFER AS OF JULY 27, 1988
FIGURE 15 GENERALIZED GROUND-WATER FLOW PATTERNS WITHIN THE LOWER PORTION OF THE ALLUVIAL AQUIFER AS OF SEPTEMBER 27, 1988
i n
100028
GERAGHTY & MILLER, INC.

LIST OF FIGURES (continued)
FIGURE 16 GENERALIZED GROUND-WATER FLOW WITHIN THE LOWER PORTION OF THE ALLUVIAL AQUIFER, OCTOBER 30, 1989
FIGURE 17 LOCATIONS OF WATER-SUPPLY WELLS
FIGURE 18 ASSUMED CONDITIONS SERVING AS A BASIS FOR CALCULATION OF VERTICAL FLOW VELOCITIES
FIGURE 19 LOCATION OF THE LCP NORTHERN TANK FARM
FIGURE 20 INFERRED UPPER ALLUVIAL AQUIFER FLOW PATTERNS BENEATH LCP'S NORTHERN TANK FARM, SEPTEMBER 12, 1989
FIGURE 21 A P P R O X I M A T E L O C A T I O N S OF SOIL B O R I N G S A N D MONITORING/RECOVERY WELLS
FIGURE 22 SLURRY FEED SYSTEM
FIGURE 23 SOIL TREATMENT PATTERN
FIGURE 24 DAILY REPORT FORM
FIGURE 25 CALIBRATION REPORT FORM
FIGURE 26 APPROXIMATE LOCATIONS FOR TREATED SOIL SAMPLE COLLECTION
LIST OF APPENDICES
APPENDIX A
APPENDIX B
SPECIFICATIONS FOR TANK 002
DESCRIPTION OF FIELD PROCEDURES NORTHERN TANK FARM INVESTIGATION
APPENDIX C GERAGHTY & MILLER, INC. FIELD LOGS
APPENDIX C-l
APPENDIX C-2
APPENDIX C-3
SOIL BORING LOGS FOR WELLS AS-AH-1, TW-1, TW-2, TW-5, TW-6, RW-1 AND RW-2
WELL CONSTRUCTION LOGS FOR TANK FARM MONITORING AND RECOVERY WELLS
SOIL BORING LOGS FOR HAND-AUGER BORINGS
IV
GERAGHTY & MILLER, INC.
100029

LIST OF APPENDICES (continued)
APPENDIX C-4 WATER SAMPLING LOGS FOR THE AUGUST 21,1989 NORTHERN TANK FARM MONITORING WELL SAMPLING EVENT
APPENDIX D PROCEDURES TO BE EMPLOYED DURING THE SULFURIC ACID SPILL SITE REMEDIATION
APPENDIX D-l SOIL SAMPLING PROCEDURES
APPENDIX D-2
APPENDIX D-3
APPENDIX D-4
APPENDIX D-5
GROUND-WATER SAMPLING PROCEDURES
SAMPLE CUSTODY
QUALITY CONTROL PROCEDURES
DATA AND RECORDS MANAGEMENT
APPENDIX E LABORATORY REPORTS AND ASSOCIATED DATA
APPENDIX E - l
APPENDIX E-2
APPENDIX E-3
APPENDIX E-4
RESULTS OF ANALYSES FOR VOLATILE ORGANIC CHEMICALS IN CONTAINMENT AREA SOILS, AUGUST 15, 1989
RESULTS OF ANALYSES PERFORMED ON SOIL SAMPLES COLLECTED FROM BORING AS-AH-1, NOVEMBER 28, 1989
RESULTS OF ANALYSES FOR VOLATILE ORGANIC CHEMICALS IN TANK FARM MONITORING WELL-WATER SAMPLES, SEPTEMBER 11, 1989
RESULTS OF ANALYSES PERFORMED ON SOIL VAPOR SAMPLES COLLECTED WITHIN SPILL CONTAINMENT AREA
v
100030
GERAGHTY & MILLER, INC.


PROPOSED REMEDIAL WORK PLAN FOR THE LCP SULFURIC ACID SPILL SITE
LCP CHEMICALS-WEST VIRGINIA, INC.
MOUNDSVILLE, WEST VIRGINIA
INTRODUCTION
The United States Environmental Protection Agency (USEPA) and LCP Chemicals-West
Virginia, Inc. have agreed to an Administrative Order by Consent (Order) under the Comprehensive
Environmental Response, Compensation, and Liability Act of 1980 as amended by the Superfund
Amendments and Reauthorization Act of 1986. This Order requires LCP to conduct a sampling and
removal action in response to the June 29, 1989 release of approximately 250,000 gallons of spent
sulfuric acid from an above-ground storage tank. The effective date of the Order is December 8,
1989.
Under the requirements incorporated as part of the Order, LCP is to provide USEPA with
an evaluation of existing conditions, which includes an assessment of the magnitude and extent of
spill-related contamination, and is to perform cleanup measures sufficient to eliminate any danger
posed by the release to human health and the environment.
The "Description of Existing Conditions" presents the results and interpretations of an
investigation of the sulfuric acid spill site performed by Geraghty & Miller, Inc. (Geraghty & Miller)
during the Summer of 1989, to address the data gathering and reporting requirements of the Order.
Principal findings of the spill investigation have been incorporated into the development and
review of potential remedial alternatives from which a preferred remedial option has been selected
by LCP. The remedial option proposed by LCP for implementation is described under the "Proposed
1
GERAGHTY & MILLER, INC.
1G0032

Remedial Action Plan", in conjunction with quality control criteria and sampling and analysis
procedures to be employed during remedial activities.
2
GERAGHTY & MILLER, INC
1G0033

DESCRIPTION OF GENERAL SITE CONDITIONS
Plant Setting and Topography
LCP Chemicals - West Virginia, Inc. is an industrial facility specializing in the production
of chlorine, caustic soda, and chloromethanes. The plant site is located within the Ohio River valley
in Marshall County, West Virginia, approximately three miles downstream from Moundsville (see
Figure 1). Adjoining LCP's southern property boundary is an 18-hole golf course owned and
maintained by the Moundsville Country Club. The LCP facility occupies the midnorthern portion
of Round Bottom, which is a sickle-shaped bottomland alluvial deposit situated along the inside of
a sharp meander (bend) in the Ohio River. Round Bottom extends approximately four miles in
length and, at its widest point, is approximately one-half mile across.
Bordering the LCP plant to the north is the Olin Chemicals Group facility, which is now
inactive. The Olin facility produced toluene diisocyanate, methylene dianiline, and hydrochloric
acid. Allied Chemical Corporation formerly owned both the Olin and LCP facilities, and has
retained ownership of Allied Park, a small portion of their former site which contains several trash
dumps and closed waste ponds. Allied af one time produced aniline, fumaric acid, nitrobenzene, and
maleic anhydride at the Olin facility and vinyl chloride (produced from acetylene) at the LCP
facility.
Four river terraces have been identified within Round Bottom. These river terraces are
labeled Tj through T 4 on Figure 2 and represent alternating incision and flooding events of the Ohio
River during early Wisconsin glacial retreat (Simard, 1987). Studies conducted by Simard (personal
communication) indicate that river terraces along the Ohio River cannot be differentiated by
mineralogical character or by degree of sorting.
100034
GERAGHTY & MILLER, INC.

The land surface elevation of each terrace decreases toward the Ohio River, averaging about
730, 690,660, and approximately 640 feet, msl. The upper three terraces are situated above the 100-
year flood-stage elevation of the Ohio River (approximately 649 feet, msl). The Ohio River pool
elevation near Round Bottom is about 624 feet, msl, and as a result of the Hannibal lock and dam
(located about 18 miles downstream from Round Bottom), tends to remain fairly constant throughout
normal-range flow conditions.
The relatively flat-lying bottomland deposits are bounded to the east by a steep valley wall
that ascends to an elevation of more than 1200 feet, msl, over a distance of about one-half mile.
These upland areas can be quite rugged and are characterized by steep slopes and strong relief.
Stream erosion and transport in conjunction with weathering and mass-wasting of slope materials are
largely responsible for the existing topographic expression of the upland areas (Price, et.al., 1956).
Surface drainage patterns in the region can best be described as dendritic, where larger
tributaries branch irregularly and angularly into smaller tributaries, resembling (in plan view) the
profile of a branching tree (Glossary of Geology, 1974). The Ohio River generally constitutes the
feature of lowest elevation throughout the area and, under natural conditions, receives virtually all
of the regional drainage from tributaries, surface runoff, overland flow, and ground-water discharge.
Site Geology
Geologic and subsurface hydrogeologic conditions existing beneath the northern and north-
central portions of Round Bottom have been characterized as a result of numerous hydrogeologic
investigations performed on the LCP, Allied-Signal and Olin properties. The following is a summary
of existing geologic and hydrogeologic investigations and findings obtained during emergency
response activities.
10003O
GERAGHTY & MILLER, INC.
Bedrock Geology
Alluvial deposits beneath the LGP facility are underlain by bedrock strata of the
Pennsylvanian-aged Monongahela Formation. These strata consist mainly of sandstones, silts tones,
shales, limestones and coals. Stratigraphic relationships of these units are indicated on Figure 3. The
bedrock strata beneath the entire Round Bottom area do not appear to have been subject to any
major structural deformation, i.e., no major faulting and folding (see Figure 4). Where exposed in .—
outcrops, such as road cuts, the bedrock units exist as distinct, relatively level layers, which can be
continuous over long distances. Exposures along West Virginia Route 2 have been mapped and
correlated by Price, et.al. (1956).
The bedrock structure contour map (Figure 5) constructed from drilling data from the Round
Bottom area illustrates the buried bedrock surface sloping from the valley wall (675 feet, msl) toward
the Ohio River (565 feet, msl). In cross-section (see Figure 6), the bedrock basement of the Ohio
River Valley exists generally as a U-shaped trough, which was aggraded (filled) by glacial outwash
deposits composed predominantly of sand and gravel. Subsequent deposition of river floodplain
deposits has, particularly beneath more riverward parts of Round Bottom, capped the coarse glacial
outwash with relatively fine-textured surficial deposits (i.e., silt, clay, fine sand, and mixtures of
these). In areas adjacent to the valley wall, outwash deposits pinch out against the valley-wall
bedrock strata, and are commonly capped with colluvium (clay, silt, rock fragments, and other mud
slide-type debris), which tends to thin with distance towards the river.
Alluvial Geology
As previously described, • the sand and gravel outwash deposits comprise the principal
subsurface unit beneath the LGP facility and the northern tank farm. Grain-size analyses performed
on representative soil samples indicate that the bulk of this alluvium consists of a gravelly sand with
varying amounts of silt and clay (see Table 1).
. . . . 5 .
100036
GERAGHTY & MILLER, INC.

Geologic cross-sections constructed from drilling records reveal that alluvial deposits achieve
a maximum thickness of 104 feet in central plant areas and thin toward the valley wall and the Ohio
River (Figures 7 through 13). Silt- and clay-rich deposits, and in some areas fine sands, commonly
cap the sand and gravel outwash. These fine-textured deposits are characterized by cation-exchange
capacities ranging from about 7 to 35 milliequivalents/100 grams and vertical permeabilities ranging
from 1.2 x 10"6 to 1.1 x 10"5 cm/sec (see Table 2). Beneath much of the main plant area, the
uppermost surficial deposits consist of reworked soil or earthern fill.
Surficial soils in the vicinity of the north tank farm range from sandy silts and clays in
relatively undisturbed areas to silty and clayey sand. These fine-textured horizons extend to
approximately 15 feet below land surface, and grade into the silty and/or clayey sand and gravel
comprising the alluvial aquifer.
Site Hydrogeology
Bedrock Aquifer(s)
Bedrock strata are recharged mainly in upland areas by infiltrating precipitation, with
discharge occurring in the low-lying areas; regionally and within the subject area, the Ohio River
Valley serves as this discharge zone. This provides a mechanism for flushing soluble minerals and
connate waters from the upper bedrock. In this way, ground water moving through the bedrock
system(s) can represent a combination of connate waters introduced during bedrock deposition, and
precipitation recharge occurring in highland and outcrop areas above the valley floor.
Given the layered nature of the bedrock strata and the presence of shale and other low-
permeability confining layers, bedrock tends to become less well flushed with depth, particularly
beneath areas where there is relatively little vertical fracturing. As a result, ground water occurring
within the bedrock underlying the river valley alluvial deposits, which exist at a substantially lower
6
GERAGHTY & MILLER, INC.
100037

elevation than the main bedrock recharge areas, can contain appreciable amounts of dissolved natural
constituents due to the limited flushing of these strata.
Owing to the relatively mineralized quality of ground water within the bedrock, the fact that
yields from bedrock wells can be very low, and the availability of abundant and generally good-
quality ground-water supplies from the river valley alluvial (outwash) deposits, the bedrock ground
water system(s) have not been developed as a source of water supply within the subject area.
Alluvial Aquifer
The alluvial aquifer occurs within the sand and gravel outwash deposits which underlie
Round Bottom. This aquifer extends beneath all of the subject area except where the sand and
gravel unit pinches out against the steeply rising bedrock of the valley wall (see Figures 7 through
13).
The alluvial aquifer exists predominantly as a water-table (unconfined) system beneath much
of the LCP plant. Near Ranney Well D, the aquifer becomes semi-confined beneath the overlying
layer of silt- and clay-rich alluvium.
Under natural (non-pumping) conditions, the alluvial aquifer is recharged by infiltrating
precipitation and, to some degree, by discharges from the bedrock system(s). Discharge of ground
water from the alluvial aquifer under natural conditions is to the Ohio River.
Under existing conditions, Ranney Wells A and D are continuously pumped at combined rates
averaging about 1000 gpm. Pumping rates are kept fairly constant, in order to meet plant production
demands and to prevent the migration of ground water off-site. The influence of Ranney Wells A
and D on ground-water flow patterns beneath the LCP plant are depicted in Figures 14, 15, and 16.
As shown on these Figures, the combined pumping of Ranney Well A and Ranney Well D depresses
100038
GERAGHTY & MILLER, INC.

ground-water levels beneath the LCP plant, and produces a composite cone of influence which
induces flow from offsite areas and from the Ohio River onto the LCP property. Through
continuous pumping of the Ranney wells a ground-water divide is maintained between LCP and the
Moundsville Country Club well, located 1500 feet south of Ranney Well A. The Washington Lands
well field, located approximately 3000 feet to the south of the LCP plant, does not appear to
influence ground-water flow patterns beneath the LCP site (see Figure 17).
Minimum Ranney well pumping rates necessary to prevent off-site migration have recently
been determined by Geraghty & Miller using the MODFLOW computer modelling program.
Minimum pumping rates were found to be approximately 300 gpm for Ranney well A and 200 gpm
for Ranney well D.
Four years of averaged monthly pumping data for Ranney Wells A and D are presented on
Table 3. Pumping rates are measured weekly by LCP from totalizing incrementors located on
Ranney well discharge lines. Installed at the time of well construction (in the early 1950s), the
incrementors are no longer capable of providing accurate pumping data. In light of existing flow
meter limitations, the data presented in Table 3 should be considered approximations of actual
pumping rates. LCP has indicated that operation of high capacity Ranney well pumps below
approximately 300 gpm would result in damage to the pump and/or motor, and is unlikely to have
occurred. LCP is in the process of replacing the incrementors with flow measuring devices capable
of providing accurate pumping rate data for Ranney Wells A and D.
The overlapping of the cones of influence created around Ranney Wells A and D establish
a ground-water divide beneath the south-central portion of the plant. By way of this condition,
ground water to the south of the divide flows toward and is intercepted by Ranney Well A, while
ground water to the north of the divide flows toward and is intercepted by Ranney Well D. The
position of this ground-water divide at a given time is influenced mainly by the individual pumping
8
100039
GERAGHTY & MILLER, INC.

rates of each Ranney well, and may shift considerable distances in response to variations in Ranney
well pumping rates, as illustrated on Figure 14, 15 and 16.
It should be noted that the Generalized Ground-Water Contour Maps were constructed using
data obtained from deep "A-series" wells (wells screened in the lower portion of the alluvial aquifer.
Flow patterns observed within the "upper" portion of the aquifer (reflecting data obtained from
shallow "B-series" wells) are generally the same as those illustrated by Figures 14, 15 and 16; i.e.,
alluvial aquifer water-level elevations measured in the shallow and deep well of a given cluster are
generally the same.
Under the pumping conditions that exist within Round Bottom, the dominant source of
recharge to the alluvial aquifer is by induced inflow from the Ohio River. During prolonged periods
of heavy rainfall or major snow melts, the portion of recharge to the alluvial aquifer derived from
infiltration of precipitation can increase. However, at no time during past or recent monitoring
has precipitation recharge been sufficient to offset river recharge; i.e., a hydraulic gradient from the
Ohio River to the alluvial aquifer has been maintained via pumping.
The hydraulic properties of the alluvial aquifer have been determined by long-term (3-day)
aquifer pumping tests performed by the Ranney Method Water Supplies, Inc., of Columbus, Ohio.
These aquifer testing data are presented in Appendix D. Based upon these results, the transmissivity
within the alluvial aquifer ranges from about 205,000 to 400,000 gallons per day per foot,
corresponding to a range of hydraulic conductivity from 3.2x10"* to 4.5 x 10"1 cm/sec (see Table 4).
The river pool elevation in the Round Bottom area is controlled by the Hannibal Lock and
Dam, located approximately 20 miles downriver from the LCP plant. Under normal conditions, river
stage is generally maintained within a foot of normal pool elevation, with water-level fluctuations
generally not exceeding plus or minus one foot on a given day (William Salesky, U.S.G.S., personal
9
1C0040
GERAGHTY & MILLER, INC.

communication). The influence of a navigation/flood control dam (such as the one at Hannibal,
Ohio) on river stage characteristically decreases with distance upstream from the dam. As a result,
river stage measurements collected at locations more remote from the dam can be expected to exhibit
greater fluctuations than those at more downstream, near-dam locales.
The river stage data summarized in Table 5 were measured at Martins Ferry, Ohio, located
approximately 20 miles north (upstream) of Moundsville and 40 miles upstream of the Hannibal Lock
and Dam. Due to the considerable distance from the dam, these data likely reflect greater
fluctuations than normally observed at downriver locations.
Perched-Water Zones
Perched ground water can be encountered within areas where loose, relatively permeable fill
or natural soil horizons overlie silt- and clay-rich deposits exhibiting lower permeability or greater
compaction. Water infiltrating from the surface tends to collect on top of the confining layers,
producing a saturated zone within the overlying, relatively permeable deposits. Perched ground
water was encountered in a low-lying area north of Ranney Collector D, and at several locations
within the Chloromethanes Production (CMP) area. Review of the soil boring logs from monitoring
wells situated north of Ranney Well D (monitoring well MW-8A, MW-8B, and MW-8C) indicate
that the low permeability confining layer upon which ground water is perched consists of silt- and
clay-rich alluvial deposited. The horizon occupied by the perched water consists of a ten-foot-
thick clayey sand (see Figure 8).
A principal discharge route for fluids within perched ground-water bodies is vertically
downward, by infiltration through the subjacent confining unit, into the upper portions of the
alluvial aquifer. A calculated flow velocity of 0.77 foot/year has been determined for the vertical
10
100041
GERAGHTY & MILLER, INC.

DESCRIPTION OF SITE SPECIFIC CONDITIONS
Sulfuric Acid Spill Location and Setting
The northern tank farm is located within the northern portion of the LCP plant site. The
tank farm is bounded to the north by a Consolidated Gas Company right-of-way, and adjoins
property owned by the Olin Corporation to the east. Three 580,000 gallons storage tanks located
within earthen bermed containment areas comprise the tank farm. Fluids can be transferred to or
from each tank via either pipeline or tank truck.
Site Security
Due to its location within the LCP facility, and to adjoining land uses, the tank farm is not
readily accessible to the public. Access to the tank farm is monitored by LCP and Olin security,
which require all visitors to sign-in at the main plant gates. The tank farm proper is bounded by
a chain-link fence. This fence is currently being refurbished by LCP to further limit site entry to
plant and other authorized personnel.
Hydrogeology of the Northern Tank Farm Area
Ground-water flow beneath the northern tank farm and adjacent area is influenced by the
continuous pumping of Ranney Well D, located approximately 900 feet west of the tank farm.
Generalized ground-water flow beneath the tank farm area has been interpreted from ground-water
elevation data collected from tank farm monitoring wells and is depicted on Figure 20.
The rate (velocity) of lateral migration of water in the alluvial aquifer is controlled by the
hydraulic conductivity and effective porosity of the aquifer materials and by the hydraulic gradients
existing within the alluvial aquifer.
12
GERAGHTY & MILLER, INC. 1G0043

Hydraulic conductivity data were used in conjunction with.alluvial aquifer water-level data
presented in Table 7 to estimate the lateral flow velocity of ground water passing beneath the
northern tank farm. This rate of migration was calculated by the equation:
V = Kl/n
Where: V = linear velocity K = hydraulic conductivity n = assumed effective porosity I = hydraulic gradient; dh/dl
= (hydraulic head difference/distance between wells)
This lateral flow velocities was calculated using an average hydraulic conductivity value of
3.9 x 10"1 cm/sec. The effective porosity of the sand and gravel was assumed to be 0.25, which was
based upon the sand and silt content of aquifer materials (Freeze and Cherry, 1979). The hydraulic
gradient was determined using the difference between the water-level elevations obtained from
monitoring wells and the linear distance between the wells in which water levels were measured. As
shown by the data presented in Table 8, lateral flow velocities beneath the tank farm range from 4.0
to 4.4 feet per day (1460 to 1606 feet per year).
History of Use of Northern Tank Farm
The northern tank farm was constructed for the former site owner by the Chicago Bridge and
Iron Company during late 1960 and early 1961. Tank 002 was erected during the third quarter of
1960, and was constructed of three-eighths-inch-thick steel sidewalls and bottom, with quarter-
inch thick steel cover. Construction specifications for tank 002 are given in Appendix A. Existing
records indicate that the former owner used tank 002 for the storage of benzene and toluene
feedstocks and diesel fuel.
13
100044 GERAGHTY & MILLER, INC.

LCP purchased the northern tank farm in April, 1987 for the storage of chloromethane
products and spent sulfuric acid for recycling. Tank 001 and 002 have been used solely for the
storage of spent sulfuric acid, while methylene chloride has been stored in tank 003.
On June 29, 1989 LCP discovered that approximately 250,000 gallons of concentrated (70
percent) spent sulfuric acid had leaked from tank 002 into its earthen containment berm and
percolated into the soil. All surface discharge was contained within the tank berm. Following
discovery of the release, LCP notified the National Response Center of the incident, which in turn
notified the EPA On-Scene Coordinator. LCP retained Geraghty & Miller on June 30, 1989 to
evaluate the environmental impacts of the sulfuric acid spill, and to coordinate emergency response
activities.
Description of Response Activities Performed To-Date
Following discovery of the sulfuric acid release, LCP initiated emergency response actions
which consisted of removing free sulfuric acid remaining within tank 002 and ponded upon the soil
surface. Other emergency response activities included placement of plastic over contaminated soil
material to reduce infiltration of precipitation into contaminated soil, cleaning of tank 002 in
accordance with a RCRA closure plan in preparation for tank dismantling, and periodic monitoring
of spent sulfuric acid levels in tank 001.
Tank 002 and associated structures were dismantled and removed from the containment area
during December, 1989. Following removal of the storage tank, contaminated soils within the
containment area were graded and capped with a 30 mil synthetic liner. Installation of this ^ J
temporary cap was performed in order to reduce the potential for continued migration of sulfuric ^
acid in conjunction with infiltrating precipitation, and to remove the potential for exposure of
personnel and the environment to contaminants within affected soils. Table 9 chronologically
presents principal activities performed in response to the sulfuric acid release.
14
GERAGHTY & MILLER, INC. 100045

Site grading and capping operations were performed by Geo-Con, Inc. of Pittsburgh,
Pennsylvania under the supervision of LCP personnel. Grading of containment area soils was
accomplished by working 4-inch diameter limestone gravel into the relatively soft surficial soils with
a Caterpillar D4 bulldozer. Upon completion of grading operations, a 40 mil HDPE liner constructed
with heat-welded seams was installed over the containment area. Vents were installed through the
liner to provide for off-gassing of carbon dioxide from the contaminated soils, a result of chemical
reactions between the sulfuric acid and limestone gravel.
To determine the extent of subsurface contamination associated with the spent sulfuric acid
spill, Geraghty & Miller implemented a field investigation of the spill site and northern tank farm
area. Activities employed as part of the investigation included the following: drilling and
installation of six, two-inch diameter monitoring wells and three four-inch diameter shallow recovery
wells at locations proximal to the tank 002 containment berm; hand-auger and hollow-stem auger
soil borings within the spill containment area with soil sampling and laboratory analysis; periodic
sampling of tank farm monitoring wells for ground-water pH, specific conductance, and
temperature; and sampling of selected monitoring wells with analysis for volatile organic compounds
and other water-quality parameters. The investigation was initiated on July 1,1989, with the drilling
and installation of tank farm monitoring wells and shallow recovery wells. Activities performed
during this investigation are detailed in Appendix B. Principal findings are discussed in the
following sections.
Proposed response activities and results of activities and investigations were reported to the West
Virginia Department of Natural Resources (WVDNR) and USEPA Region III representatives during
site visits, formal meetings and monthly progress reports submitted to USEPA in compliance with
an existing RCRA Consent Order.
15
GERAGHTY & MILLER, INC. 100048

Nature and Extent of Problem
Evaluation of the extent of soil and ground-water contamination resulting from the release
of spent sulfuric acid from tank 002 was accomplished through the sampling and analysis of affected
soils within the containment area, and ground-water collected from existing and newly-installed
monitoring wells. As described in the following sections, assessment of impacts from the spill are
complicated by pre-existing soil- and water-quality conditions. To the extent possible, impacts
attributable to the sulfuric acid spill are identified, and areas subject to question are discussed below.
Characterization of Spent Sulfuric Acid
Spent sulfuric acid is generated by the LCP chloromethanes production process, which
employs concentrated sulfuric acid as a drying agent for crude chloromethane feedstocks. Spent acid
(68 to 77 percent )is temporarily stored in two in-plant storage tanks and the northern tank farm for
shipment to Stauffer Chemical for reclaimation. Presently, the material is being shipped to Stauffer's
Baton Rouge facility.
As a result of direct contact drying of crude chloromethanes, the spent sulfuric acid retains
varying concentrations of impurities. The composition of spent sulfuric acid was determined by
Allied in December 1978, and by LCP in January 1989 and is summarized on Table 10. These
analytical data represent the existing information available regarding the composition of the spent
sulfuric acid.
16
.100047 GERAGHTY & MILLER, INC.

Description of Existing Soils Contamination
As previously described, free sulfuric acid released from tank 002 was contained within the
earthen containment berm surrounding the tank, and infiltrated into underlying soil. The potential
for lateral migration of sulfuric acid within the soil profile was addressed through the measurement
of soil pH during the drilling of perimeter monitoring well boreholes (see Appendix B for a
description of the soil boring program and Appendix C for soil boring logs). The relatively neutral
pH values obtained for perimeter soils imply that lateral migration of sulfuric acid through the soil
profile had not occurred at the time of the borings. Acid-affected soils appear restricted to beneath
the bermed containment area of tank 002.
To define the extent of migration of sulfuric acid within containment area soils and to
determine residual concentrations of acid-related substances within affected soils, 11 hand-auger
borings and a single hollow-stem auger boring were performed within the containment area, with
analysis of soil samples for free sulfuric acid concentration. The maximum sampling depth achieved
with each hand-auger borehole was controlled by the presence of gravel and larger particle size
material in the subsoil, which resulted in auger refusal. Free sulfuric acid concentrations in shallow
containment area soils are summarized in Table 11. Soil boring locations are shown on Figure 21.
Drilling and sampling methodologies are described in Appendix B.
On October 5, 1989 a soil boring was advanced through acid-affected soils using hollow stem
auger drilling methods, to estimate the maximum extent of vertical sulfuric acid migration through
the subsurface. The boring, designated AS-AH-1, was located proximal to tank 002 within an
portion of the containment area considered to be most contaminated with sulfuric acid. Boring AS-
AH-1 was advanced until relatively unaffected soils were encountered, as indicated by a soil pH of
approximately 6. Laboratory soil pH measurements and associated sulfuric acid concentrations,
performed by Martel Laboratories of Baltimore, Maryland, are presented in Table 12.
17
100048 GERAGHTY & MILLER, INC.

Analyses for heavy metals of the Contract Laboratory Program were performed on soil
collected from the 4 to 6 foot interval of soil boring AS-AH-1. These data are presented on Table
13.
Results of soil sampling analyses indicate that spent sulfuric acid concentrations within
affected soils generally decrease with depth, and vary spatially across the containment area. Free
sulfuric acid concentrations in hand-augered soil samples varied between 0.084 and 39.7 percent
sulfuric acid by weight. The approximate depth of sulfuric acid advance at boring AS-AH-1 is
approximately 20 feet below ground surface.
Results of analyses for volatile organic compounds (VOCs) in representative containment area
soil samples are summarized on Tables 14, 15 and 16. Soil samples were analyzed for halogenated
volatile organics (SW-846 Method 8010, 12 samples), chlorinated aromatic compounds (SW-846
Method 8020,2 samples from boring AS-AH-1), and for Contract Laboratory Program (CLP) volatile
organic compounds (SW-846 Method 8240, one sample from boring AS-AH-1). Sample collection,
handling and chain-of-custody procedures are described in Appendices B and D. All VOC analyses
were performed by Martel Laboratories.
As illustrated by the data presented in Tables 14 and 15, VOCs were detected generally within
the upper 10 feet of affected containment area soils, and only sporadically at greater depths. YQCfi.
detected at depths greater than 10 feet included bromodichloromethane, tejtra^hloj thylene, and
toluene, at concentrations less than 0.06 mg/kg. In addition to halogenated volatile organic
compounds, aromatic compounds not associated with current tank-farm usage or in LCP processes
were detected in containment area soils (see Table 15). The presence of benzene, toluene, ethyl-
benzene and xylene isomers in acid-affected soils implies that past releases of diesel fuel or process
feedstocks likely occurred within the tank 002 containment area.
18
100049 GERAGHTY & MILLER, INC.

Results of analyses for CLP volatile organic compounds in sample AS-AH-1, (4-6 feet) is
presented in Table 16. Comparison of these data with results obtained by conventional gas
chromatograph analyses for the same sample interval (Table 15) reveals that VOC concentrations
obtained via the standard CLP sampling and analysis protocols (utilizing gas chromatqgraph/mass
spectroscopy) are generally lower than those measured with gas chromatography. This discrepancy
is believed to be due primarily to sample collection technique and not to analytical practice. Samples
submitted for GC analysis were collected using brass sleeves (inserts) within the split spoon sampling
device. This procedure minimizes sample handling and subsequent volatilization (see Appendix B).
Soil samples designated for GC/MS analysis were collected following standard USEPA protocols,
which incorporate considerably greater handling of the sample during filling of the sample containers
(glass vials with teflon septum-lined lids), and greater potential for volatilization of soil contents.
Analyses were not performed for dimethyl sulfate (DMS) in containment area soil samples,
due to complications in the analytical procedure employed for determining DMS. To address the lack
of analytical data on DMS in affected soils and to further characterize those volatile organic
compounds that could represent a potential hazard to remedial action personnel, a soil vapor survey
of the containment area was conducted on September _22,_JL9&9. A description of sampling
methodologies, sample handling and custody, and analytical procedures is presented in Appendix B.
Based upon results of the soil vapor survey, DMS does not appear to be present in containment area
soils (see Appendix C). Principal organic constituents identified in shallow containment area soils
by the survey include methyl chloride, chloroform, methylene chloride, methanol, and methane.
In reviewing data acquired by soil gas sampling and analysis, it should be recognized that the
reported soil gas concentrations represent point-in-time measurements. The overall concentration
of these constituents in the soil atmosphere at any given time may be affected by a number of factors
including the following: soil characteristics (i.e., mineralogy, porosity, permeability, moisture and
organic matter content, etc.); the homogeneity/heterogeneity of the soil; weather conditions; and
icons GERAGHTY & MILLER, INC.

chemical processes which exist in both the vadose and saturated zones. Additionally, the
concentration and extent of VOCs in the soil atmosphere are dependent upon the individual physical
properties (solubility, vapor pressure, molecular weight) of each compound. Due to these factors,
the actual distribution and concentration of potential contaminants in containment area soils are
based upon the results of soil sample analyses.
Description of Existing Ground-Water Contamination
In 1977, Geraghty & Miller performed an investigation of the former Allied Chemical north
plant (now owned by Olin Corporation) at the request of the former owner. During this
investigation, a three-well monitoring cluster (observation wells 32A, 32B, and 32C) was installed
downgradient of the north tank farm (see Figure 20) and sampled for characterization of ground
water quality. Results of the investigation are contained in the report "Ground-Water Contamination
at Allied Chemical Corporation (North) Plant Site". A summary of ground-water quality data for
observation well cluster 32 is given on Table 17.
Results of ground-water quality analyses performed during the initial investigation reveal the
presence of volatile and semi volatile organic compounds (principally chlorobenzene and aniline)
within the alluvial aquifer at concentrations exceeding one ppm. Analyses for halogenated volatile
organic compounds associated with LCP's processes were not performed as part of this study.
Concentrations of sulfate and chloride in ground water also approached or exceeded current drinking
water standards for these constituents. Elevated values for alkalinity and specific conductance were
also measured in water quality samples collected from well cluster 32.
To assess the impacts of the June 28, 1989 sulfuric acid spill on ground-water quality, six
ground-water monitoring wells were drilled and installed along the perimeter of the tank 002
containment area. Drilling, soil sampling, and well installation procedures are described in Appendix
B. Following installation, each monitoring well was developed, and sampled on a gradually
20
GERAGHTY & MILLER, INC.
10005

decreasing frequency for evidence of sulfuric acid impacts on ground-water quality via the analysis
of ground-water pH, temperature, and specific conductance. Results of sulfate analyses performed
on samples collected from tank farm monitoring wells is given in Table 18. Five months of ground
water quality measurements are summarized in Table 19.
Selected tank farm monitoring and shallow recovery wells were sampled by Geraghty and
Miller for analysis of volatile organic compounds by the LCP laboratory on July 20, 1989, and by
Martel Laboratories on August 21, 1989. Results of analyses performed by LCP (via gas
chromatograph) show varying concentrations of methylene chloride, chloroform, and carbon
tetrachloride in all monitoring wells sampled, including up-and cross-gradient monitoring wells
TW-3 and TW-4, and in deep alluvial aquifer monitoring well TW-2 (see Table 20). Results of the
August 21 volatile organic compound analyses (Table 21) identified benzene, toluene and
chlorobenzene in each of the four water-quality samples, and chloroform in ground-water samples
from monitoring wells TW-1 and TW-5.
Apparent Impacts Related to Acid Spill
As indicated by the data presented in the previous sections, soil and ground-water quality
in the northern tank farm area had been degraded prior to the June 28, 1989 sulfuric acid release,
possibly as a result of production activities and/or by releases from one or more of the storage tanks
comprising the tank farm. Water-quality degradation associated with past activities appears to consist
primarily of aniline and other base-neutral extractable compounds, benzene, toluene, xylene, and
inorganics including sulfate and chloride. Due primarily to the degradation of ground-water quality
by these substances, ground water usage by LCP, Allied, and Olin has been restricted to process,
cooling, and aquifer gradient control purposes.
Contamination associated with the June 28,1989 sulfuric acid release has been shown to exist
primarily within the upper 20 feet of soil beneath the containment area, and to consist of both free
21
1.00052
GERAGHTY & MILLER, INC.

sulfuric acid and VOCs within the affected soil. The rate of advance of sulfuric acid through
subsurface soils is believed to have been controlled in part by the relatively low permeability of silt
and clay rich deposits, by the buffering capacity of the soil, and reactions with organic and clay
fractions within the soil matrix.
To-date, no direct sulfuric acid-related effects on ground water passing beneath the tank
farm have been observed, as indicated by fairly constant trends in ground-water pH, specific
conductance, and temperature from downgradient monitoring wells (see Table 19). However,
chloroform, a product of LCP's chloromethanes process and constituent of the spent sulfuric acid,
has been detected in monitoring wells downgradient of the spill site. Although chloroform in
downgradient monitoring wells could be attributable to releases of the spent sulfuric acid from tank,
002, the mechanism of this transfer is subject to question. Contamination of ground water from
acid-related VOCs would imply a separation of the volatile compounds from the sulfuric acid, and/or
the advance of a VOC "slug" ahead of the acid through the soil. LCP has indicated that the presence ' \
of such a dense phase organic layer within the storage tank is not likely to have occurred. Similarly,
existing soils data indicate that VOC contamination associated with the spill decreases significantly
with depth, and is generally not detected below 10 to 12 feet below the ground surface. In light of
these observations, it is possible that elevated chloroform concentrations detected in ground water
could have come from a source other than the June 29 sulfuric acid spill.
The presence of benzene, toluene, ethylbenzene, and xylene in tank farm monitoring wells
and soil samples implies that past releases of materials stored within the tank farm have occurred.
Since the past contents of tanks 001 and 003 are not currently known, it is possible that chloroform
detected in downgradient monitoring wells might represent the remnants of a past spill within the
tank farm.
22
100053
GERAGHTY & MILLER, INC.

PROPOSED REMEDIAL ACTION PLAN
The following Remedial Action Plan has been developed to address contamination resulting
from the June 29, 1989 release of spent sulfuric acid from tank 002. This plan outlines remedial
action objectives to be achieved, the review and selection of remedial options, methodologies to be
employed, bench-scale testing to evaluate the proposed neutralization procedure, and describes
sampling and analytical procedures to determine the effectiveness of remedial activities in achieving
program objectives.
Remedial Action Objectives
The selection of an acceptable remedial option for implementation at the LCP sulfuric acid
spill site involved the development and evaluation of several potential remedial alternatives and their
relative ability to achieve established remedial objectives. Remedial objectives established to guide
the selection of a remedial option include:
• The option must be capable of removing the potential threat of ground-water contamination, and exposure to the environment.
• The option must be capable of reaching any achievable cleanup goals established by the USEPA or other regulatory authority.
• The remedial alternative must be technically feasible, reliable in operation, and implementable under existing site conditions.
• Handling of contaminated materials should be minimized to prevent atmospheric releases and to minimize the potential for contact with contaminated media.
• The option should not affect adjacent land uses or jeopardize the integrity of adjacent containment areas or storage tanks.
• The selected option should achieve program objectives in a cost-effective manner.
Several remedial options not described in this work plan were rejected after preliminary
review, for not achieving the objectives outlined above. Alternatives which required further
23
100054 GERAGHTY & MILLER, INC.
consideration included the following: Excavation and removal of contaminated soil for offsite
disposal/incineration; in-situ neutralization of acidic soils and residual sulfuric acid; excavation,
neutralization and backfilling of contaminated soils; and no action with continued monitoring.
As described above, achievement of attainable cleanup goals is a principal factor in the
selection of a remedial option. Cleanup goals established by USEPA for this remedial action consist
of Applicable or Relevant and Appropriate Requirements (ARARs) for ground water pH and
contamination by sulfate. The ARARs specified by USEPA for these parameters are secondary
drinking water standards for sulfate (250 ppm) and for pH (ground water must remain between a pH
of 6.5 and 8.5).
Each of the remedial options listed above (other than no action) are capable of achieving the
performance standards for ground-water pH. However, attainment of the performance standard for
sulfate by any of the proposed remedial options may be difficult, if not impossible, and may be
inappropriate under existing conditions. Difficulty in achieving this performance standard is due
to pre-existing sulfate concentrations in ground water and the chemical properties of substances
formed by sulfuric acid neutralization.
The main goal of remediation is to remove the potential threat to human health and the
environment through treatment or removal of acid-contaminated soils within the containment area.
To achieve this goal, all options involving on-site remediation require the treatment of remnant
sulfuric acid and affected soils with a basic (i.e., high pH) neutralizing or stabilizing agent. Physical
properties of soil stabilizing agents, such as silicate cements, bentonite admixtures, and Portland
cement, are adversely affected by low pH environments, elevated sulfate concentrations, or by
inorganic salts such as calcium or sodium. These substances could have limited effectiveness in
immobilizing soluble sulfate or in completely neutralizing contaminated soils.
24
GERAGHTY & MILLER, INC.
100055

Commonly available neutralizing agents consist of lime (CaC03), magnesium hydroxide, and
sodium hydroxide. The principal mode of action of these agents is to break down sulfuric acid
present in the contaminated soil into elemental substances (COz, water) and sulfate compounds of
varying solubilities (CaS04, MgS04, NaS04). Regardless of the neutralizing agent employed, or on-
site remedial option selected, free sulfate could be released into the ground-water system over time.
As described in previous sections, pre-existing ground-water quality beneath the northern
tank farm has been degraded by organic and inorganic substances including sulfate, which ranges
from 224 ppm to 1,134 ppm (see Tables 17 and 18). Since the ARAR for sulfate is already exceeded
throughout much of the alluvial aquifer's saturated thickness, this performance standard cannot
practically be applied to the proposed remedial activity. In addition, water quality within this
portion of the alluvial aquifer has been sufficiently degraded by other contaminants not associated
with the June 29, 1989 spill to have precluded its use for human consumption.
Evaluation of Potential Remedial Options
Each of the following remedial options were developed and considered for implementation.
The following paragraphs provide a brief description of each option, and discuss the advantages and
disadvantages associated with each alternative. Estimated costs for each option were provided by
subcontractors providing remedial services and do not include monitoring and analytical charges or
utility fees.
Enhanced Soil Vapor Extraction. A soil vapor extraction system would be installed within
the containment area. The system would consist of both deep and shallow extraction/injection wells
installed on an appropriate grid system. Vapor extraction would be initially performed to remove
residual volatile organics and sulfuric acid vapor. Neutralizing agent would then be injected into
shallow wells and extracted from the deep recovery wells. This option would provide in-situ
treatment of contaminated soils. Estimated cost is $700,000.
25
10005
GERAGHTY & MILLER, INC.

Excavation with Neutralization. Contaminated soils would be excavated from a small portion
of the containment area in shallow lifts and mixed with neutralizing agent prior to removal or upon
stockpiling. After permitting sufficient reaction time, as confirmed by soil sampling, the neutralized
material would be returned to the excavation, and the process advanced to another portion of the
containment area. The maximum depth that can be reached with conventional equipment is about
15 to 20 feet. Vapor emissions could Decontrolled with suppressant foam. Estimated cost for treating
up to 15 feet of contaminated soil is $530,000 to $580,000.
Shallow Soil Mixing. Contaminated soils would be mixed with neutralizing agent in-situ
through the use of specially designed mixing augers. Neutralizing agent would be injected and mixed
at a controlled rate through the auger bore as the device is advanced through contaminated soil.
Additional mixing would be performed as the augers are withdrawn. Vapor emissions could be
collected and treated, if deemed necessary. Estimated costs for treating up to 15 feet of soil with
lime slurry is $400,000.
Excavation of Contaminated Soils with Off Site Disposal/Destruction. Contaminated soil
would be excavated and transported off-site to an EPA-approved disposal site, or incinerator. The
excavation would be backfilled with clean soil. Preliminary estimates of this option range up to
$3,000,000.
No Action. The containment area would remain in its current condition. Ground-water
monitoring would be conducted on a periodic basis for an indefinite period. No initial capital
expenditure on remediation other than for ground-water monitoring.
Remedial alternatives involving the excavation and treatment of contaminated soils allow
for monitoring and sampling of treated soils and ready assessment of program completeness.
Disadvantages to this option include an increased potential for employee exposure to soil-borne
contaminants and atmospheric releases; instability of deep excavations which could affect adjoining
26
10005
GERAGHTY & MILLER, INC.

land uses and structures and produce a safety hazard for remediation personnel; and the potential
inability of conventional construction equipment to achieve the depths necessary for remediation.
Based upon these potential shortcomings, these options were removed from consideration.
Enhanced soil vapor extraction circumvents the potential problems associated with excavation
and treatment. This option can also be modified to contain and treat vapor emissions resulting from
the neutralization process. However, potential difficulties exist with achieving sufficient treatment
of contaminated soils, since precipitates may form rapidly around injection zones, occluding
migration pathways for the neutralizing agent. Injection of a slurry, such as lime, may also
physically clog soil pores and prevent uniform soil treatment, possibly limiting the use of certain
neutralization media. After consideration of the potential shortcomings and high cost of this option,
it was dropped from consideration.
Shortcomings associated with the excavation and off-site disposal option include a greater
potential for human and environmental exposure to contaminated media during excavation and
transport, potential hazards associated with side wall instability in deep excavations, locating a
disposal/destruction site for the contaminated media, and exorbitant cost for implementation.
Although this remedial option would ultimately result in the removal of the potential health and
environmental hazards, its potential shortcomings and excessive cost were.considered sufficient for
its removal from consideration.
Based upon obligations assumed under the December 8, 1989 Order, LCP is required to
address the sulfuric acid spill site to pre-spill conditions. As a result of this obligation, the no-
action alternative is not an acceptable option for remediation.
Temporary grading and capping of the tank 002 containment area has effectively reduced the
potential for human and environmental exposure to contaminated media and should afford short-
term protection of the ground water resource by preventing the infiltration of precipitation and
27
GERAGHTY & MILLER, INC.
10005
subsequent mobilization of sulfuric acid and associated substances. This will be followed by the
shallow soil mixing alternative to provide long-term neutralization and stabilization of the acid-
affected soils.
The shallow soil mixing (SSM) option was selected for implementation by LCP as a result of
its ability to achieve the established remedial objectives in a cost-effective manner. Reasons for the
selection of SSM over other proposed options include:
• SSM technology has been successfully employed in other remediation programs, and has been evaluated and positively reviewed under the Superfund Innovative Technology Evaluation (SITE) program.
• SSM technology can inject and mix a variety of treatment additives to depths exceeding 20 feet, and can be modified to contain and treat emissions resulting from the treatment processes.
• The addition of treatment chemicals to contaminated media can be varied, as required by site conditions.
• Adjacent land uses would not be adversely impacted by remedial activities.
• Potential hazards associated with deep excavations and the handling of contaminated materials should be significantly reduced.
The following sections provide a description of the SSM procedure, equipment to be used in
remediation of contaminated soils, and outline quality control procedures and guidelines developed
to aid in achieving the remedial action goals.
Remedial Strategy for the Sulfuric Acid Spill Site
In-situ neutralization of sulfuric acid-contaminated soils will be accomplished through the
direct injection and mixing of a neutralizing agent with affected soils throughout contaminated soil
depths.
Operational goals are to raise the average pH of acid-contaminated soils to between 6.5 and
8.5 throughout the containment area while maintaining the neutrality of unaffected soils. The
28
100059
GERAGHTY & MILLER, INC.

Y A. neutralizing agent to be used, optimum mix design, and application rates will be evaluated prior to
initiation of remedial activities through bench-scale testing. Effects of treatment chemicals on
,,\ ^ uncontaminated soils will also be assessed in this manner. Based upon results of the bench scale tests,
cy provisions can be made for addressing potential reactions which might be encountered during mixing.
The overall effectiveness of achieving soil neutrality through shallow soil mixing will be
assessed through field-screening of treated soil samples with follow-up analysis for sulfuric acid
content and soil pH. Treatment effects on ground-water quality will be assessed through the periodic
sampling and analysis of tank-farm monitoring wells before, during and after soil treatment.
Within 30 days of completion of soil treatment activities a report summarizing the remedial
action program and results of soil and ground-water analyses will be prepared and submitted to
USEPA for review and approval, as specified in the Order.
Preliminary Evaluation of Neutralization Procedures
A treatability study will be conducted prior to commencement of site activities in order to
select a treatment chemical and to evaluate the neutralization procedure. This study will be
performed by an independent analytical laboratory subcontracted by the remedial contractor. A
work plan for the treatability tests to be performed will be prepared by the laboratory prior to
commencement of testing. Analytical procedures, protocols, data quality levels and program
objectives will be outlined within the plan.
The treatability study will be restricted to the analysis of two relatively available additives;
lime slurry and magnesium hydroxide. Preliminary tests involving lime slurry have produced
successful results for acid neutralization. However, the effect of lime slurry on the pH of
uncontaminated soils have not been evaluated.
29
100060
GERAGHTY & MILLER, INC.

Magnesium hydroxide has the potential for maintaining the pH of uncontaminated soils below
pH 9, while raising the pH of contaminated soils into the 6.5 to 8.5 range. In addition to evaluating
potential additives, the treatability tests will provide the optimum treatment-media/soil/water mixing
ratios for neutralizing acid-contaminated soils.
Shallow Soil Mixing Process and Equipment
SSM Equipment
The SSM process was designed by Geo-Con for injecting and mixing chemicals with
contaminated sludges or soil. The SSM system consists of a single, crane-mounted auger unit and
slurry supply (batch) plant. SSM equipment to be used on the remedial program at LCP will include:
• Crane-mounted auger unit.
• A single shaft with one set of cutting blades and two sets of mixing blades. The shaft
is equipped with slurry output nozzles on the auger cutting head. The mixing auger
diameter is 72 inches.
Batch Plant
The slurry supply (batch) plant will consist of the following major pieces of equipment as
shown on Figure 22:
• One silo rotary feeder.
• Two Geo-Con five c.y. Lightning mixers (mixing).
• Transfer pump.
• Additive supply pump
• Automatic readout of flow volume, flow rate and pressure with pump controls located at the mixing plant.
• Associated hoses, fittings, etc., as required.
30
100061
G E R A G H T Y & MILLER, INC.

The plant is designed to produce sufficient slurry for the total requirements of the SSM rig's
operations. Slurry will be mixed in one of Geo-Con's five c.y. high-speed turbine mixers and held
over in a second mixer while waiting for the slurry demand from the SSM equipment. Automatic
controls adjust slurry flowrate and total quantity to match the demand of the SSM mixer.
Plan of Operations
Soil Mixing
The SSM unit will track into position over a presurveyed column location. Horizontal
alignment of the unit will be checked against a presurveyed grid system. Vertical alignment will be
continuously monitored by the use of an inclinometer mounted in the mixing unit.
After checking position, the auger will be slowly advanced to the maximum treatment depth
while injecting the required volume of slurry. One hundred percent of the slurry will be injected
on the downward stroke to enable the slurry to be mixed with soil on both the downward and return
strokes of the auger. Additional cycles of mixing can be performed, when required, to ensure
sufficient treatment of contaminated soils. Slurry flow rate and total volume will be controlled and
recorded through the slurry monitoring system. Mix design and slurry requirement will be
determined by the treatability study.
Soil columns will be completed in an alternating primary/secondary sequence shown on
Figure 23. Primary columns will be drilled first, then secondary strokes between the primaries will
be completed. Column positioning will result in sufficient overlap to avoid untreated areas. Each
hole will be logged as to depth, total flow, flow rate, and cycle time on Form 2 (see Figure 24).
Batching
One silo carrying additive will be equipped with bin activators, bin level indicators, and
volumetric feeders. Additive is measured by the accumulative rotation of the feeder, which shall
31
100062
G E R A G H T Y & MILLER, INC.

be calibrated prior to remedial site activities. Water will be controlled by a volumetric flow meter
with valve.
The slurry will be transferred to a centrifugal-type Lightning slurry mixer, and then
transferred to a second mixer for holding or discharge to the pumps. Accuracy of slurry mixing will
be verified through the use of a mud scale, which verifies both the accuracy of amount of
components and homogeneous mixing of the slurry. The material supplier will be required to provide
documentation as to actual specific gravity of the additive.
Calibration of mixing components will be done at the beginning of the project and monthly
throughout the project. Calibrations will be reported on the Form 1 shown on Figure 25. The
method of calibration is to weigh the additive coming out of the feeder over time with a scale
traceable to the National Bureau of Standards. Specific gravity is also measured by mud scale to
verify the mix.
Control of Mixing Operations
Flow Monitoring
Slurry flow will be monitored by slurry controllers. The system will inject slurry according
to total penetration. Based on an operator preset production rate (gallons per foot), the system would
adjust the pump speed to ensure that the correct volume is injected.
Adjustments are accomplished through internal calculations within the monitoring system.
Pump speed would be adjusted based on the penetration rate of the SSM machine. Pumps will be
calibrated during initial startup so the actual volume of slurry per revolution is known. The pumps
are of the positive displacement type and pump a specific volume of slurry per revolution. A
tachometer will count revolutions to monitor volume. The pump speed will be adjusted based on
penetration rate through the use of variable speed pump drive controllers.
32
100G63 GERAGHTY & MILLER, INC.

Hole Depth Measurements
Depth of penetration measurement will be made by using a fixture containing a small
tracking wheel attached to a digital tachometer. This fixture will be mounted at the top of the
mixing auger gear head, and will track the head as it moves along the lead assembly. As the auger
moves up and down, the tachometer will output pulses that are proportional to the amount of travel
distance up or down. The tachometer output will be cabled back to the console, where it will be
scaled and displayed. The digital display will be 0 - ± 99.9 feet, and can be reset to zero at any point
by operator command. In addition to the elevation display, the output of the tachometer will also
be fed to a time-gated counter, where the penetration rate will be calculated and displayed. Mixing
depth is also measured by determining length of auger rod penetration at a given time.
Location Verification and Assurance
Two different types of location verification and assurance will be performed. Prior to
installation of columns the site will be surveyed and a grid system and survey reference markers will
be established. This grid system will be used to site injection point locations. Should column
installation deviate from this coordinate identification system, any untreated areas will be addressed
through supplemental injections. In order to control the vertical orientation of the hole,
measurements of the fore-aft and left-right vertical mast positions will be performed. This
measurement will be accomplished by placing two inclinometers on a fixture mounted at right angles
to each other, with their sensitive axis in the horizontal plane. When mounted to the lead structure,
one unit will be sensitive only to the fore-aft (pitch) of the lead, and the other will only be sensitive
to the left-right (roll) axis of the lead. The output of these units will be routed back to the console
for scaling and display. Resolution and accuracy of this method is predicted to be to within about
one-tenth of a degree. In addition to the display, the outputs will be compared to preset levels of
±0.1 degree, and when exceeded, will result in a signal to the crane operator. The signal will
illuminate lights in a remote box in a preset pattern, which will guide the operator in adjustment of
the vertical lead:
33
GERAGHTY & MILLER, INC. 100064

Quantity Verification
Total daily quantities and total linear feet of treated column will be reported daily on Form
2. Copies of all additive delivery tickets will also be retained.
Evaluation of the Effectiveness of Remedial Action
The effectiveness of shallow soil mixing in achieving remedial objectives will be determined
through the sampling and analysis of treated containment area soils and ground-water. Ongoing
remedial activities will be evaluated and controlled through the collection and on-site analysis of
samples from treated soil columns. Confirmation of the overall effectiveness of deep soil mixing will
be through laboratory analysis of treated soil samples and by the periodic evaluation of ground
water quality downgradient of the containment area.
Sampling and Analysis of Neutralized Soil During Remediation
In-Field Screening
As described in previously, the maximum depth of sulfuric acid penetration into subsurface
soils appears to vary spatially within the containment area (see Table 11 and 12). In-field screening
of treated soil pH will be performed to confirm that affected soils have been treated to the maximum
depth of acid penetration, and to assess the uniformity of the lime mixing procedure.
Treated soil samples will be collected immediately following completion of mixing from
primary soil columns at the general locations shown on Figure 26. Samples will be collected at ten-
foot depth intervals at nine of the sampling locations, so as to provide up to three treated soil
samples per sampling location; at the ground surface, at a depth of approximately 10 feet, and at the
treated-soil/natural-soil interface. Soil samples will also be collected from the treated-soil/natural-
soil interface at a rate of one per day. Treated soil samples from each sampling location will be
field-screened for soil pH, and will then be composited for laboratory analysis. Detailed descriptions
34
GERAGHTY & MILLER, INC. 100065

of the procedures and protocols for collecting and handling soil samples are presented in Appendix
D.
Field screening of soil pH for interface samples will provide a means of confirming
maximum treatment depth during soil mixing operations. Prior to start-up of remedial activities,
the pH of treated, uncontaminated soils will be established. This soil pH will be used as a guide to
determine whether or not treatment to a greater depth is required. Should interface soil pH fall
below this minimum value, the soil column will be advanced until interface soil achieves the
minimum pH standard.
Field screening of treated soil samples will also be employed as a measure of shallow soil
mixing performance. Lime slurry feed rates will be adjusted accordingly when treated soil pH falls
outside of the designated range.
Neutralization of affected soils will be considered satisfactory when the average pH of
samples collected at a sampling location is within the performance criteria. Application of additional
lime slurry will be performed if the mean soil pH falls below the performance standard.
Laboratory Analysis of Soil Samples
Treated soil samples to be collected during remedial activities will be packaged and shipped
to a laboratory having a documented Quality Assurance Program complying with USEPA guidance
document QAMS-005/80 for confirmatory soil analyses. Sample packaging, handling, and chain of
custody procedures, will be in accordance with procedures described in Appendix D.
Treated soil samples will be analyzed for soil pH and percent sulfuric acid. Results of soil
analyses will provide documentation of the effectiveness of soil neutralization and confirmation of
field pH analyses.
35
GERAGHTY & MILLER, INC.

Ground-Water Monitoring
Remediation of contaminated soils via shallow soil mixing will also be evaluated through the
collection and analysis of ground-water quality samples. Baseline ground-water quality will be
determined through pre-remediation sampling of tank-farm monitoring wells with analysis for the
parameters given on Table 22. Additional ground-water sampling events will be performed once
during implementation of shallow soil mixing and on a biannual basis for a period of two years(s)
thereafter. Monitoring parameters which do not show significant change within one year following
completion of remedial activities will be considered for removal from the sampling program.
Monthly monitoring for ground-water pH, temperature, specific conductance, and sulfate
concentration will be performed until remedial activities are initiated. Monitoring wells to be
sampled during this program are listed in Table 23. Results of post-remediation analyses will be
used to assess the effectiveness of shallow soil mixing in preventing further degradation of water-
quality within the alluvial aquifer.
All ground-water sample collection, packaging, handling and chain-of-custody procedures
to be followed during remedial activities and post-remediation monitoring will be in accordance with
procedures given in Appendix D. The laboratory selected to perform water-quality analyses will be
required to have in effect a documented Quality Assurance program complying with USEPA
guidance document QAMS 005/80.
Data Reporting and Communication
A report describing remediation activities conducted at the LCP sulfuric acid spill site will
be prepared and submitted to USEPA within 30 days of completing the prescribed activities. This
report will include a description of the remedial action program, any problems encountered during
implementation, results of field screening and laboratory analyses, treatment chemical volumes used
in remediation, and copies of all pertinent field reporting forms.
36
100067 GERAGHTY & MILLER, INC.

LCP will submit to USEPA monthly progress reports containing the types of information
prescribed in Section VIII G of the Order. Progress reports will be submitted to the USEPA Project
Coordinator on or before the 15th day of the month following the time period covered by the
progress report.
Health and Safety Plan
LCP will submit for review and approval a written site-specific Health and Safety Plan
describing safety measures to be implemented during the remedial action program. This Health and
Safety program will be in accordance with Occupational Safety and Health Administration (OSHA)
requirements for hazardous waste site operations as defined in 29 CFR 1910.120.
Project Timetable
LCP proposes to conduct the neutralization of sulfuric acid-contaminated soils during the
third quarter of 1990. Monitoring well sampling and analysis to develop baseline ground-water
quality data will be performed within 3 weeks of USEPA approval of the proposed Scope of Work.
Collection and analysis of water-quality samples will be performed on a monthly frequency until
remedial activities are commenced.
37
100063 GERAGHTY & MILLER, INC.

REFERENCES
Freeze, R. A., and Cherry, J.A., 1979. Groundwater; Prentice-Hall.
Gary et al., (eds.), 1972. Glossary of Geology, American Geological Institute Publication, Washington, D.C.
Geraghty and Miller, Inc., 1978. Ground-Water Contamination at Allied Chemical Corporation (North) Plant Site, Moundsville, West Virginia, May 1978.
Price, et al., 1956. Geology and Economic Resources of the Ohio River Valley in West Virginia: Volume XXII, West Virginia Geological Survey, Part I-Geology.
Salesky, William, 1988. United States Geologic Survey. Personal communication to T. Ratvasky,. Geraghty & Miller, Inc., July 19, 1988.
Simard, Claudette, 1987. Legacy from the Ice Age, Mountain State Geology Magazine. West Virginia Geologic Survey Publication MSG-87, p. 29-32.
GERAGHTY & MILLER, INC.
100069

TABLE 1
CLASSIFICATION OF UNCONSOLIDATED SOILS BASED UPON GRAIN-SIZE DISTRIBUTION
LCP CHEMICALS - WEST VIRGINIA, INC. MOUNDSVILLE, WEST VIRGINIA
DEPTH BORING/WELL(l) (IN FT. BELOW MAJOR GROUP TYPICAL NUMBER GROUND SURFACE) DIVISION SYMBOL NAMES
MW-1 MW-1
MW-2 MW-2
MW-3 MW-3
MW-4 MW-4
MW-5 MW-5
MW-MW-
MW-MW-
MW-8 MW-8
MW-9 MW-9
MW-10 MW-10
SB-2/P-1
SB-3/P-2A SB-3/P-2A SB-3/P-2A
SB-5 SB-5
55.0 75.0
70.0 90.0
50.0 30.0
30. 50.
55.0 30.0
30.0 65.0
30.0 65.0
60.0 35.0
60. 80.
75.0 90.7
18.0 70.0 90.0
4.0 20.0
57.0 77.0
72.0 91.5
51.5 31.5
31.5 52.0
56.5 31.5
31.5 66.5
31.5 66.5
61.5 36.5
61.5 81.5
76.5 92.2
25.0 - 27.0
20.0 72.0 92.0
6.0 22.0
SAND SM sand with l i t t l e s i l t GRAVEL GC gravel with l i t t l e clay
SAND SM sand with l i t t l e s i l t SAND SM sand with l i t t l e s i l t
SAND SM sand with l i t t l e s i l t SAND SM sand with l i t t l e s i l t
SAND SM sand with l i t t l e s i l t SAND SM sand with l i t t l e s i l t
SAND SM-SC sand with s i l t & clay SAND SM-SC sand with s i l t & clay
SAND SM sand with l i t t l e s i l t SAND SM sand with l i t t l e s i l t
GRAVEL GM gravel with l i t t l e s i l t SAND SM sand with l i t t l e s i l t
SAND SM sand with l i t t l e s i l t SAND SW well graded sand
SAND SM sand with l i t t l e s i l t SAND SM sand with l i t t l e s i l t
SAND SM sand with l i t t l e s i l t SAND SM sand with some s i l t
SAND SP poorly graded sand
SAND SW well graded sand SAND SW well graded sand SAND SW well graded sand
SAND SP poorly graded sand SAND SP poorly graded sand
GERAGHTY & MILLER, INC. 100071

TABLE 1 (continued)
CLASSIFICATION OF UNCONSOLIDATED SOILS BASED UPON GRAIN-SIZE DISTRIBUTION
LCP CHEMICALS - WEST VIRGINIA, INC. MOUNDSVILLE, WEST VIRGINIA
DEPTH BORING/WELL(1) (IN FT. BELOW MAJOR GROUP NUMBER GROUND SURFACE) DIVISION SYMBOL
TYPICAL NAMES
10.0 - 12.0
SB-6 6.0 - 8.0 SB-6 18.0 - 20.0
SB-7 10.0 - 12.0 SB-7 20.0 - 22.0
SB-8 2.0 - 4.0 SB-8 8.0 - 10.0 SB-8 12.0 - 14.0
SB-9
SB-10/MW-11B 28.0 - 3.0 SB-10/MW-11B 55.0 - 57.0 SB-10/MW-11B 70.0 - 72.0
SB-ll/MW-12 12.0 - 14.0 SB-ll/MW-12 45.0 - 47.0
SB-12/MW-13 10.0 - 12.0 SB-12/MW-13 30.0 - 2.0 SB-12/MW-13 40.0 - 42.0
SB-14/MW-14 12.0 - 14.0 SB-14/MW-14 30.0 - 32.0
SAND SAND
SAND SAND
SAND SAND SAND
SAND
SAND SAND SAND
SAND SAND
SAND SAND SAND
SAND SAND
SW well graded sand SM-SC sand with silt and clay
SM-SC sand with sil t and clay well graded sand
SP poorly graded sand SP poorly graded sand
SM-SC sand with s i l t and clay
SP poorly graded sand
SW well graded sand SW well graded sand
SM-SC sand with sil t and clay
SP poorly graded sand SW well graded sand
SM-SC sand with s i l t and clay SP poorly graded sand SP poorly graded sand
SM-SC sand with s i l t and clay SM-SC sand with s i l t and clay
(1) Soil Boring/Well Designations:
MW: Monitoring well P: Piezometer SB: Soil Boring
GERAGHTY & MILLER, INC. 100072

TABLE 2
RESULTS OF LABORATORY ANALYSES AND CONSTANT HEAD PERMEABILITY OF SELECTED SOIL SAMPLES
LCP CHEMICALS - WEST VIRGINIA, INC. MOUNDSVILLE, WEST VIRGINIA
MONITORING WELL NUMBER
SAMPLING INTERVAL (feet)
NATURAL MOISTURE CONTENT m
CONSTANT HEAD (LABORATORY) PERMEABILITY (cm/sec)
CATION EXCHANGE CAPACITY (mea/lOQq)
TYPE OF MATERIAL SAMPLED
MW-1 MW-4B MW-6B MW-7B MW-8B MW-8C MW-lOB
17-19 10-12 25-27 10-12 20-22 5-7 5-6.7
11.5 17.8 19.7 17.0 22.1 30.5 10.2
4.5 1.2 1.1 5.4 1.1 1.1
10 10 10 10 10 10-
-6 -6 -5 -7 -7
7.6 18 20 18 19 35 15
Clayey Silt Fine Sand & Clay Silty Fine Sand Fine Sandy Clay Silt & Clay Silt & Clay Silt & Clay
O o o <I
GERAGHTY & MILLER. INC.

YEAR
1985
1986
1987
MONTH
JANUARY FEBRUARY
MAY JUNE JULY AUGUST SEPTEMBER OCTOBER NOVEMBER DECEMBER
YEARLY AVERAGE: (8 MONTH)
JANUARY FEBRUARY MARCH APRIL MAY JUNE JULY AUGUST SEPTEMBER OCTOBER NOVEMBER DECEMBER
YEARLY AVERAGE:
APPROXIMATE MONTHLY AVERAGE PUMPING RATE
(gpm)
1637 1266
796 870 759 828 953 1164 1285 426
885
- RANNEY WELL A
MAXIMUM WEEKLY PUMPING RATE
(gpm)
1711 1430
821 901 828 828 1248 1311 1730 621
1036
578 676 (Inc.) 692 (Inc.) 836 761 770 762 1115 871 910 1221 1008
660 709 842 1104 770 770 770 1351 1089 1128 1307 1281
TABLE 3 RANNEY WELL PUMPING RATES
JANUARY 1985 THROUGH MARCH 1989 LCP CHEMICALS-WEST VIRGINIA. INC.
MINIMUM WEEKLY PUMPING RATE
(gpm)
1430 1120
782 854 483 828 647 961 936 300
850 982
724
500 660 481 600 735 770 760 847 152 600 1075 862
670
APPROXIMATE MONTHLY AVERAGE PUMPING RATE
(gpm)
- RANNEY WELL D
MAXIMUM WEEKLY PUMPING RATE
(gpm)
346 346
700 753 (Inc.) 600 (inc.) 600 568 379 420 (Inc.) 726
593
820 511 760 639 822 1070 1132 1005 1024 1041 1124 1003
1000 520 931 849 936 1161 1164 1356 1212 1233 1208 1064
MINIMUM WEEKLY PUMPING RATE
(gpm)
796 906 600 600 659 455 440 1000
682
633 600 600 600 455 300 400 530
515
320 492 614 348 722 816 1083 615 769 785 1030 899
913 1053
NOTES: * Flow meter Inoperable, pumping rate calculated from chart recorder or estimated.
(Inc.) Data set incomplete for.given month.
O o o -si
GERAGHTY & MILLE^IC.

TABLE 3 (CONTINUED) RANNEY WELL PUMPING RATES
JANUARY 1985 THROUGH MARCH 1989 LCP CHEMICALS-WEST VIRGINIA, INC.
YEAR
1988
1989
MONTH
JANUARY FEBRUARY MARCH APRIL MAY JUNE JULY AUGUST SEPTEMBER OCTOBER NOVEMBER DECEMBER
YEARLY AVERAGE:
JANUARY FEBRUARY MARCH APRIL MAY JUNE JULY AUGUST SEPTEMBER OCTOBER NOVEMBER
YEARLY AVERAGE: (11 MONTHS)
APPROXIMATE MONTHLY AVERAGE PUMPING RATE
(gpm)
1000 812 914 996 820 1035 1106 714 580 942 807 744
Inc.)
872.5
751 (Inc 843.5 828
881.5 935 1034 513.5 394 811 193 271
Inc.)
(Inc.
- RANNEY WELL A
MAXIMUM WEEKLY PUMPING RATE
(gpm)
1279 1787 1058
1068.5 1010 1253 1280 872 644 1001 869
767.5
1139
853 907 934 925 1059 1180 1084 640 823 589 459
MINIMUM WEEKLY PUMPING RATE
(gpm)
525 411 733 954 586 817 869 518 518 861 736 716
659
734 765 554 796 851 829 370 220 805 74 100
APPROXIMATE MONTHLY AVERAGE PUMPING RATE
(gpm)
686 753 542 653 534 750 1476 630 711 (Inc.) 763 711 678
741
697 655.5 666 735 883 864 852 757 745 760 758
(Inc.)
- RANNEY WELL D
MAXIMUM WEEKLY PUMPING RATE
(gpm)
917 833.5 622 783 743 908 1980 957 1032 831 760 760
975
750 681 751 1015 1039 967 1245 1305 779 783 786
678 859 554 761 918
MINIMUM WEEKLY PUMPING RATE
(gpm)
511 726 316 597 259 416 1210 239 105 691 668 523
487
668.5 641 620 635 755 687 61 550 671 688 751
612
NOTES: * Flow meter Inoperable, pumping rate calculated from chart recorder or estimated.
(Inc.) Data set incomplete for given month.
O o o -si
GERAGHTY & MILLER, INC.

TABLE 4
RESULTS OF PUMPING TESTS PERFORMED ON ALLUVIAL AQUIFER TEST HOLES AT ROUND BOTTOM, WEST VIRGINIA
LCP CHEMICALS-WEST VIRGINIA INC. MOUNDSVILLE, WEST VIRGINIA
WELL NUMBER
Test Hole A*
Test Hole B*
TEST PUMPING RATE (gpm)
TRANSMISSIVITY, T (gpd/ft.)
SATURATED AQUIFER THICKNESS. PERMEABILITY, M (ft.) P (gpd/ft.z)
HYDRAULIC CONDUCTIVITY, K (cm/sec) TEST METHOD
pump test
pump test
pump test
pump test
pump test
COMMENTS TEST DATE
450
500
National Aniline Div.** 530
Test Hole C*
Test Hole D*
520
210
317,000
249,000
400,000
228.000
205,000
36
31
42
24
30
8,800
8,030
9,500
9,500
6,830
4.15 x 10' •1
3.8 x 10
4.5 x 10"
4.5 x 10"
-1
3.2 x 10 -1
near Ranney
Collector B; 4/52
near Ranney Collector C; 4/52 near Ranney Collector E; data reported In Carlston and Graeff (1955) 8/52
near Ranney
Collector D 8/53
near Ranney Collector A 9/53
Pump tests were performed by Ranney Method Water Supplies, Inc.
The duration of each pumping test was 3 days.
Additional Information regarding these test pumping programs has been obtained from Ranney, Inc. and 1s provided in Appendix D of the Hydrogeologic Investigation Report.
* Results of pumping tests performed on these test holes were obtained directly from Ranney, Inc.
* Results of testing performed by Ranney, Inc. were not available through Ranney, Inc. and were obtained from Carlston and Graeff (1955).
O
o •si £ £ GERAGHTY©'MILLE JC.

TABLE 5
SELECTED OHIO RIVER STAGE DATA OCTOBER 1985 TO SEPTEMBER 1986
MARTINS FERRY, OHIO MEASURING STATION
LCP CHEMICALS - WEST VIRGINIA MOUNDSVILLE, WEST VIRGINIA
MONTH
RANGE IN MEAN DAILY GAGE HEIGHT
FOR MONTH (feet)
MINIMUM MAXIMUM
DIFFERENCE OF MEAN DAILY GAGE
HEIGHT* ffeetl
October November December January February March April May June July August September (through 9/24/86)
12.05 12.60 12.84 12.36 14.17 13.14 12.53 12.46 12.60 12.71 12.22 12.50
13.55 32.44 26.27 23.69 33.56 25.96 16.93 14.11 20.25 17.26 13.36 13.12
1.50 19.84 13.43 11.33 19.39 12.82 4.40 1.65 7.65 4.55 1.14 0.62
Note: River Stage data for late fall-early winter reflect the impact of greater-than-normal precipitation.
GERAGHTY & MILLER, INC. 100077

TABLE 6 GROUND-WATER ELEVATION DATA
LCP CHEMICALS - WEST VIRGINIA INC. MOUNDSVILLE. WEST VIRGINIA
WELL NUMBER
ELEVATION AT TOP OF CASING (ft. above MSL)
JULY 27. DEPTH TO WATER
BELOW TOP OF CASING
(feet)
1988— ELEVATION
OF GROUND WATER (ft. above MSL)
SEPTEMBER 27. DEPTH TO WATER
BELOW TOP OF CASING
(feet)
1988 ELEVATION
OF GROUND WATER (ft. above MSL)
Observation Wells
1 707.10 2 700.39 5 670.60 6 642.40 7 643.32 9 642.24 10 668.42 11 680.24 12 693.70 13 705.20 14 686.63 32A 652.86 32B 653.22 32C 652.39 33A 631.84 33B 631.84 34A 639.56 34B 638.39 34C 640.17 37A 647.94 37B 647.74 38A 638.12 38B 638.57 38C 638.88 39 689.17
35.31 61.70 52.69 25.62 25.40 22.81 48.90 59.91 73.98 58.85 66.95 37.18 35.50 36.90 7.63* 1.10* 23.85 21.80 24.40 31.90 30.20 21.86 22.15 22.12 37.40
671.79 638.69 617.91 616.78 617.92 619.44 619.52 620.33 619.72 646.35 619.68 615.68 617.72 615.49 624.42 630.57 615.71 616.59 615.77 616.04 617.54 616.26 616.42 616.76 651.77
36.20 62.21 50.71 23.48 23.73 21.65 47.76 59.55 73.05 59.05 65.90 34.79 35.59 36.97 8.05 0.90 20.10 19.55 20.72 28.13 30.27 18.86 19.26 19.30
670.90 638.18 619.89 618.92 619.59 620.59 620.66 620.69 620.65 646.15 620.73 618.07 617.63 615.42 623.79* 630.77* 619.46 618.84 619.45 619.81 617.47 619.26 619.31 619.58
HG-Series Wells
HG-1 HG-2A HG-2B HG-2C HG-3 HG-4 HG-5A HG-5B HG-5C HG-6A HG-6B HG-7A HG-7B HG-8A HG-8B HG-9A HG-9B HG-1OA HG-1OB
669.42 668.85 669.10 669.36 669.15 700.34 677.85 678.38 678.99 660.26 660.13 660.28 660.23 659.70 659.62 642.63 642.70 641.87 642.05
32.05 51.95 52.22 DRY 52.20 50.50 60.33 60.86
DRY 43.74 43.36 43.30 43.34 42.70 42.58 25.50 25.54 24.99 25.11
637.37 616.90 616.88 DRY 616.95 649.84 617.52 617.52 DRY 616.52 616.77 616.88 616.89 617.00 617.04 617.13 617.16 616.88 616.94
32.48 49.98 50.09 DRY 49.75 52.97 58.46 59.09 DRY 41.20 41.02 41.36 41.30 40.82 40.50 23.73 23.64 22.94 23.02
636.94 618.87 619.01 DRY
619.40 647.37 619.39 619.29 DRY
619.06 619.11 618.92 618.93 618.88 619.12 618.90 619.06 618.93 619.03
GERAGHTY & MILLER, INC. 100078

TABLE 6 (continued) GROUND-WATER ELEVATION DATA
LCP CHEMICALS - WEST VIRGINIA INC. MOUNDSVILLE, WEST VIRGINIA
WELL NUMBER
ELEVATION AT TOP OF CASING (ft. above MSL)
JULY 27. DEPTH TO WATER
BELOW TOP OF CASING
(feet)
1988 ELEVATION
OF GROUND WATER (ft. above MSL)
SEPTEMBER 27, DEPTH TO WATER
BELOW TOP OF CASING
(feet)
1988 . ELEVATION
OF GROUND WATER (ft. above MSL)
MW-Series Wells
MW-1 MW-2A MW-2B MW-3 A MW-3B MW-4A KW-4B MW-5 A MW-5B MW-6A MW-6B MW-7A MW-7B MW-8A MW-8B MW-8C MW-9A MW-9B MW-lOA MW-1OB BARGE DOCK
704.94 685.39 684.95 642.40 642.52 643.82 643.74 645.94 646.01 648.69 648.40 639.42 639.42 632.56 632.40 632.41 669.69 670.04 690.81 691.22 649.80
24.94 64.76 65.25 23.45 23.46 26.03 25.92 28.60 28.65 33.15 32.83 22.62 22.66 18.13 18.56 8.25
52.30 52.89 72.88 73.18 25.60
680.00 620.63 619.70 618.95 619.06 617.79 617.82 617.34 617.36 615.54 615.57 616.80 616.76 614.43 613.84 624.16 617.39 617.15 617.93 618.04 624.20
48.20 64.73 64.21 22.10 22.20 24.28 24.17 26.54 26.60 29.09 28.76 19.21 19.35 OBSTRUCTED 13.01 8.65 50.17 50.69 71.28 71.72 26.14
656.74 620.66 620.74 620.30 620.32 619.54 619.57 619.40 619.41 619.60 619.64 620.21 620.07
619.39 623.76 619.52 619.35 619.53 619.50 623.66
NOTE: The measuring point for all observation wells was the top of the steel casing. The remaining HG-series and MW-series wells were measured from the top of PVC.
* Wells without protective caps and possibly damaged. Readings unreliable.
GERAGHTY & MILLER, INC.
100079

TABLE 6 (continued) GROUND-WATER ELEVATION DATA
LCP CHEMICALS - WEST VIRGINIA INC. MOUNDSVILLE. WEST VIRGINIA
OCTOBER 30. 1988 DEPTH TO WATER ELEVATION
ELEVATION AT BELOW OF TOP OF CASING TOP OF CASING GROUND WATER
NUMBER (ft. above MSL) (feet) (ft. above MSL)
Observation Wells
1 707.10 33.36 673.74 2 700.39- 61.34 639.05 5 670.60 50.94 619.66 6 642.40 N.M Destroyed 7 643.32 22.72 620.60 9 642.24 20.75 621.49 10 668.42 46.92 621.50 11 680.24 58.65 621.59 12 693.70 71.93 621.77 13 705.20 57.75 647.45 14 686.63 64.97 621.66 32A 652.83 33.02 619.81 32B 653.22 63.18 590.04 32C 652.39 N.M N.M 33A 631.84 N.M N.M 33B 631.84 N.M. N.M 34A 639.56 19.64 619.92 34B '638.39 N.M Damaged 34C 640.17 20.80 619.37 37A 647.94 27.82 620.12 37B 647.74 27.15 620.59 38A 638.12 18.30 619.82 38B 638.57 18.45 620.12 38C 638.88 16.74 622.14 39 689.17 37.00 652.17
HG-series Wells
HG-1 HG-2A HG-2B HG-2C HG-3 HG-4 HG-5A HG-5B HG-6A HG-6B HG-7A HG-7B HG-8A HG-8B HG-9A HG-9B HG-1OA HG-lOB
669.42 668.85 669.10 669.36 669.15 700.34 677.85 678.38 660.26 660.13 660.28 660.23 659.70 659.62 642.63 642.70 641.87 642.05
31.68 48.58 48.80 49.02 48.79 48.85 57.00 57.54 40.07 39.85 40.03 39.94 39.40 39.21 22.31 22.34 21.59 21.75
637.74 620.27 620.30 620.34 620.36 651.49 620.85 620.84 620.19 620.28 620.25 620.29 620.30 620.41 620.32 620.36 620.28 620.30
MW-Series Wells
MW-1 MW-2A MW-2B MW-3A MW-3B MW-4A MW-4B MW-5A
704.94 685.39 684.95 642.40 642.52 643.82 643.74 645.94
46.78 63.82 63.31 21.22 21.29 23.30 23.20 25.57
658.16 621.57 621.64 621.18 621.23 620.52 620.24 620.37
1000 GERAGHTY & MILLER. INC.
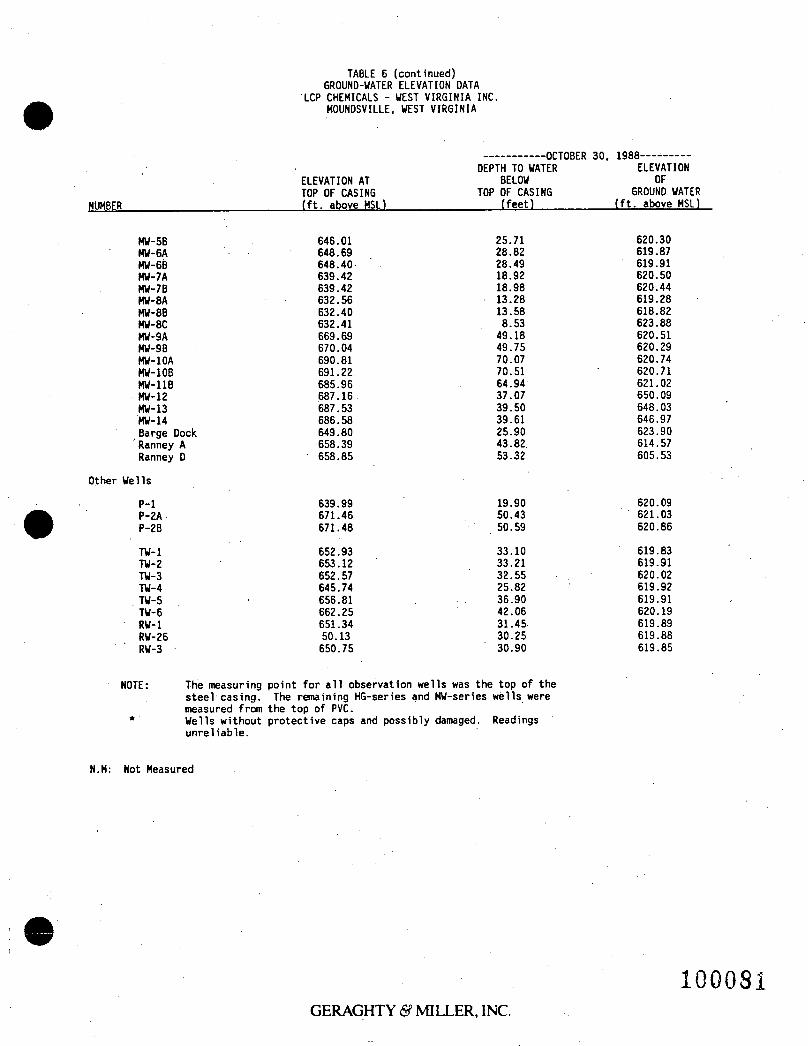
TABLE 6 (continued) GROUND-WATER ELEVATION DATA
LCP CHEMICALS - WEST VIRGINIA INC. MOUNDSVILLE, WEST VIRGINIA
OCTOBER 30, 1988— DEPTH TO WATER ELEVATION
ELEVATION AT BELOW OF TOP OF CASING TOP OF CASING 6R0UND WATER
NUMBER (ft. above MSL) (feet) (ft. above MSL)
MW-5B MW-6A MW-6B MW-7A MW-7B MW-8A MW-8B MW-8C MW-9A MW-9B MW-1OA MW-10B MW-11B MW-12 MW-13 MW-14 Barge Dock * Ranney A Ranney D
Other Wells
646.01 648.69 648.40 639.42 639.42 632.56 632.40 632.41 669.69 670.04 690.81 691.22 685.96 687.16 687.53 686.58 649.80 658.39 658.85
25.71 28.82 28.49 18.92 18.98 13.28 13.58 8.53
49.18 49.75 70.07 70.51 64.94 37.07 39.50 39.61 25.90 43.82 53.32
620.30 619.87 619.91 620.50 620.44 619.28 618.82 623.88 620.51 620.29 620.74 620.71 621.02 650.09 648.03 646.97 623.90 614.57 605.53
P-l P-2A P-2B
639.99 671.46 671.48
TW-1 TW-2 TW-3 TW-4 TW-5 TW-6 RW-1 RW-26 RW-3
652.93 653.12 652.57 645.74 656.81 662.25 651.34 50.13 650.75
19.90 50.43 50.59
620.09 621.03 620.86
33.10 33.21 32.55 25.82 36.90 42.06 31.45 30.25 30.90
619.83 619.91 620.02 619.92 619.91 620.19 619.89 619.88 619.85
NOTE: The measuring point for all observation wells was the top of the steel casing. The remaining HG-series and MW-series wells were measured from the top of PVC.
* Wells without protective caps and possibly damaged. Readings unreliable.
N.M: Not Measured
GERAGHTY & MILLER, INC.
100081
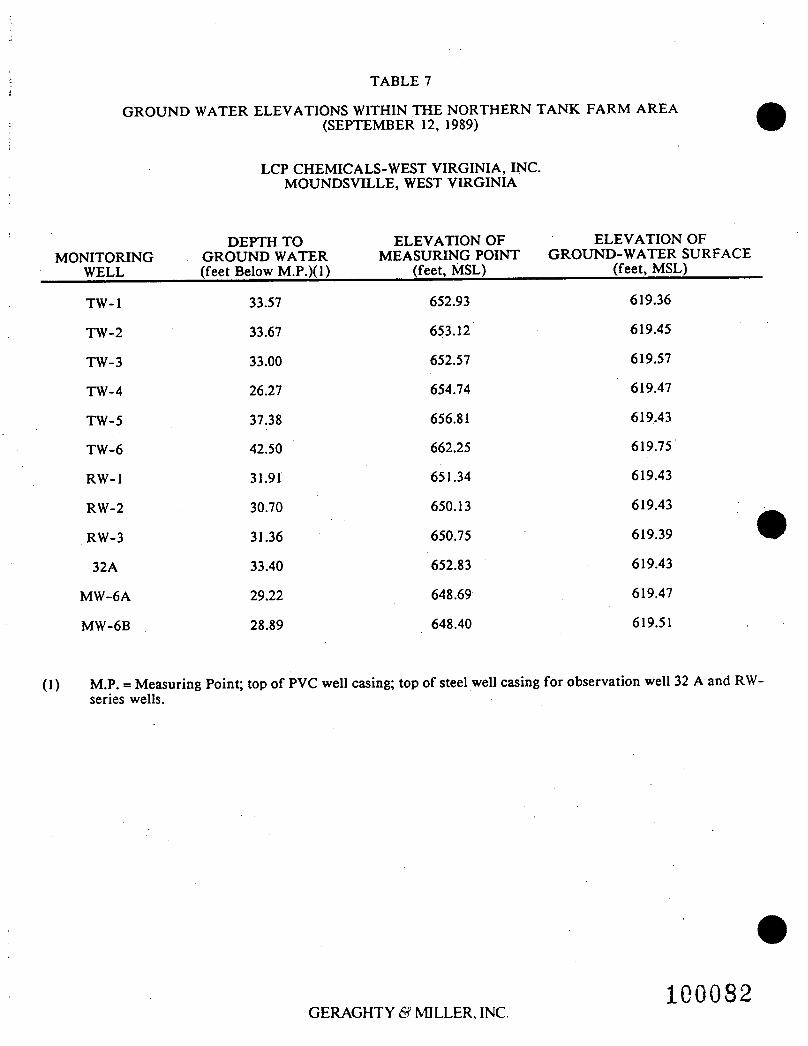
TABLE 7
GROUND WATER ELEVATIONS WITHIN THE NORTHERN TANK FARM AREA (SEPTEMBER 12, 1989)
LCP CHEMICALS-WEST VIRGINIA, INC. MOUNDSVILLE, WEST VIRGINIA
DEPTH TO ELEVATION OF ELEVATION OF MONITORING GROUNDWATER MEASURING POINT GROUND-WATER SURFACE
WELL (feet Below M.P.)(1) (feet, MSL) (feet, MSL)
TW-1 33.57 652.93 619.36
TW-2 33.67 653.12 619.45
TW-3 33.00 652.57 619.57
TW-4 26.27 654.74 619.47
TW-5 37.38 656.81 619.43
TW-6 42.50 662.25 619.75
RW-1 31.91 651.34 619.43
RW-2 30.70 650.13 619.43
RW-3 31.36 650.75 619.39
32A 33.40 652.83 619.43
MW-6A 29.22 648.69 619.47
MW-6B 28.89 648.40 619.51
(1) M.P. = Measuring Point; top of PVC well casing; top of steel well casing for observation well 32 A and RW-series wells.
GERAGHTY & MILLER, INC. 100082
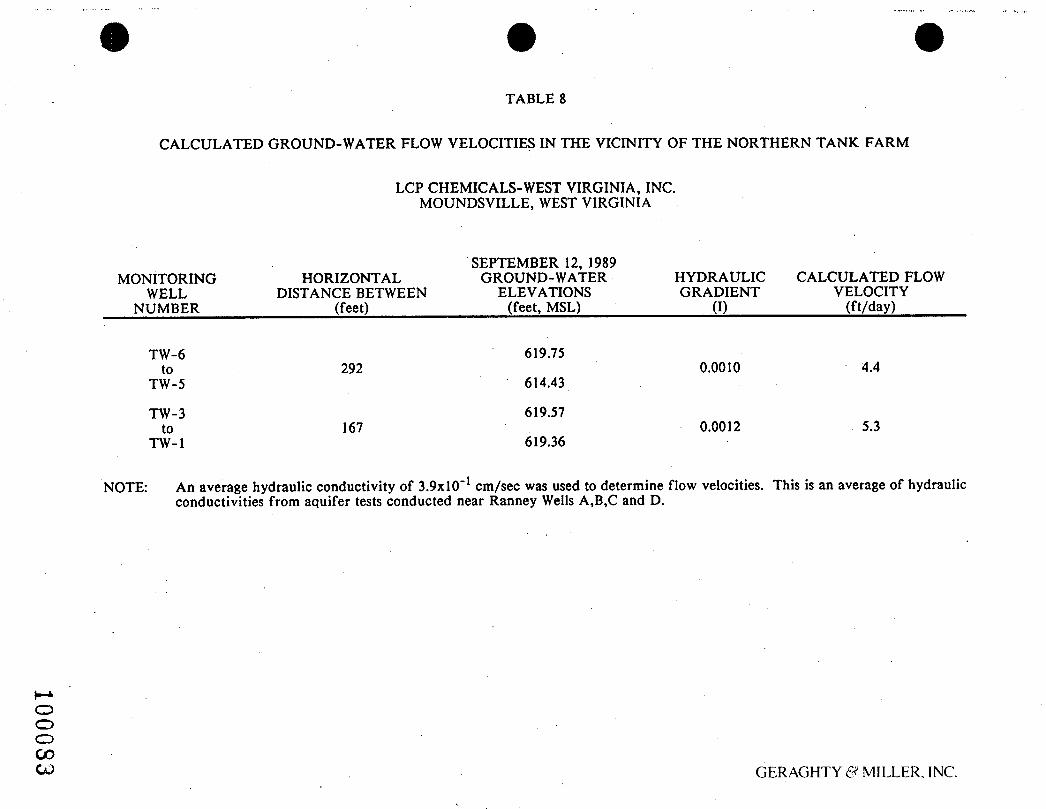
TABLE 8
CALCULATED GROUND-WATER FLOW VELOCITIES IN THE VICINITY OF THE NORTHERN TANK FARM
LCP CHEMICALS-WEST VIRGINIA, INC. MOUNDSVILLE, WEST VIRGINIA
MONITORING WELL
NUMBER
HORIZONTAL DISTANCE BETWEEN
(feet)
SEPTEMBER 12, 1989 GROUND-WATER
ELEVATIONS (feet, MSL)
HYDRAULIC GRADIENT
(I)
CALCULATED FLOW VELOCITY
(ft/day)
TW-6 to
TW-5
TW-3 to
TW-1
292
167
619.75
614.43
619.57
619.36
0.0010
0.0012
4.4
5.3
NOTE: An average hydraulic conductivity of 3.9xl0_1 cm/sec was used to determine flow velocities. This is an average of hydraulic conductivities from aquifer tests conducted near Ranney Wells A,B,C and D.
O O O CO CO GERAGHTY & MILLER, INC.

TABLE 9
CHRONOLOGY OF RESPONSE ACTIONS AND PRINCIPAL EVENTS SULFURIC ACID SPILL
LCP CHEMICALS-WEST VIRGINIA, INC. MOUNDSVILLE, WEST VIRGINIA
DATE EVENT/RESPONSE
June 29, 1989
June 29, 1989
June 30, 1989
June 30, 1989
July 1, 1989
July 3, 1989
July 27, 1989
August 1, 1989
August 26, 1989
September 19, 1989
October 2, 1989
November 27, 1989
December 8, 1989
December 14, 1989
December 27, 1989
January 6, 1990
Sulfuric acid release from tank discovered by LCP.
LCP notifies National Response Center of release.
USEPA Technical Assistance Team (TAT) inspects site of release.
Removal of remaining spent sulfuric acid from tank 002 and containment area initiated.
Initiation of spill area hydrogeologic investigation by Geraghty & Miller.
Contaminated soils within containment area lined with plastic to minimize infiltration.
Meeting between USEPA, WVDNR, and LCP at LCP facility. Draft Consent Order, findings to date and remedial measures discussed.
Cleaning of tank 002 initiated to facilitate tank removal and to investigate location of reason for sulfuric acid leak.
Report on investigation of tank failure completed.
Meeting between LCP and USEPA to discuss Consent Order revisions.
LCP retains Geo-Con, Inc. to perform remedial activities at the tank 002 containment area.
USEPA notified of LCP's intent to remove tank 002 for scrap and grade and line containment area.
USEPA approves Consent Order Docket No. 111-89-34-DC, pertaining to the June 29,1989 spent sulfuric acid spill and associated remediation.
Tank 002 and associated structures removed from containment area.
Grading and temporary capping of containment area initiated.
Grading and temporary capping of containment area completed.
GERAGHTY & MILLER, INC. 100084

TABLE 10
COMPOSITION OF SPENT SULFURIC ACID
LCP CHEMICALS-WEST VIRGINIA, INC. MOUNDSVILLE, WEST VIRGINIA
CONSTITUENT
SULFURIC ACID COMPOSITION*1'
DECEMBER 1978 (PERCENT)
SULFURIC ACID COMPOSITION(2)
JANUARY 1989 (PERCENT)
Sulfuric Acid Dimethyl Ether Methanol Methyl Hydrogen Sulfate Dimethyl Sulfate Methylene Chloride Chloroform Carbon Tetrachloride Water Total Chlorinated Hydrocarbons
70.0-75.0 0.0-7.1 0.6-1.0 4.5-20.0 0.0-0.5 N.A.
0.3-0.5 N.A.
Residual N.A.
71.1-95.8 (acid and water) 0.0-7.1 0.6-1.0 3.3-20.0 0.0-20.0
N.A. N.A. N.A. N.A. 0.25
(1) Analyses performed by Allied Corporation
(2) Analyses performed by Technical Testing Laboratory and LCP
1 N.A.: Not Analyzed VJK^ t t > J c '
10008 3
GERAGHTY & MILLER, INC.

TABLE 11 SULFURIC ACID CONCENTRATIONS IN SOIL SAMPLES COLLECTED WITHIN THE CONTAINMENT AREA
LCP CHEMICALS-WEST VIRGINIA. INC. MOUNDSVILLE. WEST VIRGINIA
Sulfuric Date of Sampling Acid
Boring Sample Depth Concentration Number Collection (feetb.g.l.) (percent)
AB-1 7/2/89 0-1 31.18 7/2/89 . 2-3 29.99 7/2/89 2.5-3 22.05 7/2/89 3-3.5 15.44
Sulfuric Date of Sampling Acid
Boring Sample Depth Concentration Number Collection (feetb.g.l.) (percent)
E-l 7/14/89 0-1 0.63 7/14/89 2-3 16.39 7/14/89 4-5 4.40 7/14/89 6-7 0.86 7/14/89 9-10 0.21
AB-2 7-2-89 0-1 31.73 7-2-89 2-2.5 0.084
PUDDLE 7-2-89 — 27.60
AB-3 7-2-89 0-1 20.08 7-2-89 1-2 30.48 7-2-89 2-3 39.76 7-2-89 3-4 20.45
E-2 7/14/89 0-1 14.94 7/14/89 2-3 21.19 7/14/89 4-5 21.12
E-3 7/14/89 0-1 11.27 7/14/89 2-3 27.35 7/14/89 4-5 20.83
N-l 7/13/89 0-1 0.71 7/13/89 2-3 26.51 7/13/89 4-5 0.38 7/13/89 6-6.5 0.97
AH-1 7/8/89 1-2 1.67 2-2.5 6.94
AH-2 7/8/89 1-2 5.11 7/8/89 2-2.5 13.57 7/8/89 3-3.5 24.66 7/8/89 4-4.5 28.56 7/8/89 4.5-5.3 25.07 7/8/89 5.3-5.8 26.30 7/8/89 6-7 18.11 7/8/89 7.5-8 11.21
BY AB-3 7/8/89 1-1.5 34.73 7/8/89 2.5-3 32.30 7/8/89 3.5-4 26.24
N-2 7/13/89 0-1 24.67 7/13/89 2-3 31.26 7/13/89 4-4.8 20.63
N-3 7/13/89 0-1 29.67 7/13/89 4-5 29.67 7/13/89 6-7 15.48
Note: Su l fu r i c ac id concentrations in s o i l samples determined v i a t i t r a t i o n .
GERAGHTY & MILLER, INC. 100036

TABLE 12
FREE SULFURIC ACID CONCENTRATIONS IN SOIL SAMPLES COLLECTED FROM BORING AS-AH-1
LCP CHEMICALS, WEST VIRGINIA, INC. MOUNDSVILLE, WEST VIRGINIA
SAMPLE SULFURIC ACID SOIL INTERVAL CONCENTRATION PH
(feet below ground) (units shown) (standard units)
0-2 23.8% 0.6
2-4 22.2% 0.3
4-6 24.0% 0.7
6-8 13.8% 0.9
(upper portion)
6-8 18.0% 1.5
(lower portion)
8-10 14.7% 1.3
10-12 22.4% 0.6
12-14 7.8% 2.4
14-16 8.5% 1.8
16-18 <200 mg/kg 6.1
18-20 <200 mg/kg v 4.7 )
GERAGHTY & MILLER, INC.
10C0

TABLE 13
RESULTS OF ANALYSES FOR CONTRACT LABORATORY PROGRAM
(CLP) METALS IN SOIL SAMPLE AS-AH-1, 4 TO 6 FEET
LCP CHEMICALS-WEST VIRGINIA, INC.
MOUNDSVILLE, WEST VIRGINIA
CONCENTRATION
CLP METAL UNITS (mg/L)
Arsenic mg/L 7.9
Barium mg/L 114
Cadmium mg/L <1
Chromium mg/L 31
Lead mg/L 31
Mercury mg/L . <0.1
Selenium mg/L . 3.1
Silver mg/L <1
Aluminum percent 2.1
Antimony mg/L 13
Beryllium mg/L < 1
Cobalt mg/L 7.9
Copper mg/L 1650
Iron percent 3.81
Nickel mg/L 12
Thorium mg/L <2
Vanadium mg/L 30
Zinc mg/L 580
Note: Elevated concentratins for iron and aluminum may indicate contamination of sample by metal sampling sleeve.
GERAGHTY & MILLER, INC.
1000

TABLE 14
RESULTS OF ANALYSES FOR HALOGENATED VOLATILE ORGANIC COMPOUNDS IN SELECTED TANK 002 CONTAINMENT AREA SOIL SAMPLES
LCP CHEMICALS-WEST VIRGINIA, INC. MOUNDSVILLE, WEST VIRGINIA
(1)
Boring Number Sample Interval (feet below ground)
Sample Collection Date
N-l 0-1
7/13/89
N-2 4-4.8
7/13/89
N-3 6-7
E - l 4-5
E-2 4-5
E- l 9-10
7/13/89 7/14/89 7/14/89 7/14/89
iMogeriatsd Volatile^25
(mg/kg)ff^
Chloromethane <0.1 Bromomethane <0.1 Vinyl Chloride <0.1 Chloroethane <0.1 Methylene Chloride >'' 2.7 1,1-Dichloroethylene <0.1 1.1- Dichloroe thane <0.1 Trans-1,2-Dichloroethylene <0.1 Chloroform./ 2.3 1.2- Dichloroethane <0.1 1.1.1- Trichloroethane <0.1 Carbon Tetrachloride <0.1
romodichloromethane <0.1 ,2-Dichloropropane <0.1
Trans-1,3-Dichloropropylene <0.1 Trichloroethylene <0.1 Chlorodibromomethane <0.1 1.1.2- Trichloroethane <0.1 cis-l,3-Dich!oropropylene <0.1 2-Chloroethylvinyl ether <0.1 Bromoform <0.1 1,1,2,2-Tetrachloroethane / 1.1 Tetrachloroethylene <0.1 Chlorobenzene <0.1
<0.1 <0.1 <0.1 <0.1 3.9 <0.1 <0.1 <0.1 2.8 <0.1 <0.1 <0.1 <0.1 <0.1 <0.1 <0.1 <0.1 <0.1 <0.1 <0.1 <0.1 0.8 <0.1 <0.1
<0.1 <0.1 <0.1 <0.1 0.1 <0.1 <0.1 <0.1 <0.1 <0.1 <0.1 <0.1 <0.1 <0.1 <0.1 <0.1 <0.1 <0.1 <0.1 <0.1 <0.1 0.2 <0.1 <0.1
<0.1 <0.1 <0.1 <0.1 1.2
<0.1 <0.1 <0.1 0.6 <0.1 <0.1 <0.1 <0.1 <0.1 <0.1 <0.1 <0.1 <0.1 <0.1 <0.1 <0.1 0.21 <0.1 <0.1
<0.5 <0.5 <0.5 <0.5 <0.5 <0.5 <0.5 <0.5 6.0 <0.5 <0.5 <0.5 <0.5 <0.5 <0.5 <0.5 <0.5 <0.5 <0.5 <0.5 <0.5 0.8 <0.5 <0.5
<0.1 <0.1 <0.1 <0.1 <0.1 <0.1 <0.1 <0.1 <0.1 <0.1 <0.1 <0.1 <0.1 <0.1 <0.1 <0.1 <0.1 <0.1 <0.1 <0.1 <0.1 <0.1 <0.1 <0.1
NOTES:
(1) Soil samples were collected from containment area with a hand-operated bucket auger.
(2) Halogenated volatile organic compound analyses were determined using a gas chromatograph (EPA Method 601) with methanol extraction.
GERAGHTY & MILLER, INC.
100089

TABLE 15
VOLATILE ORGANIC COMPOUNDS IN SELECTED SOIL SAMPLES COLLECTED FROM BORING AS-AH-1
LCP CHEMICALS-WEST VIRGINIA, INC. MOUNDSVILLE, WEST VIRGINIA
Sample Interval (feet below ground)
Analysis Performed (SW-846 Method No.)
2-4
8010
4-6
8010/8020
8-10
8010
12-14
8010
16-18
8010
18-20
8010/8020
Chloromethane <0.05 Bromomethane <0.05 Vinyl Chloride <0.05 Chloroethane <0.05 Methylene Chloride 2.50 1,1-Dichloroethylene <0.05 1.1- Dichloroethane <0.05 Trans-1,2-Dichloroethylene <0.05 Chloroform/ 0.51 1.2- Dichloroethane <0.05 1.1.1- Trichloroethane <0.05 Carbon Tetrachloride <0.05 Bromodichloromethane 0.07 1,2-Dichloropropane <0.05 Trans-1,3-Dichloropropylene <0.05 Trichloroethylene <0.05 Chlorodibromomethane <0.05 1.1.2- Trichloroethane <0.05 cis-l,3-Dichloropropylene <0.05 2-Chloroethylvinyl ether <0.05 Bromoform <0.05 1,1,2,2-Tetrachloroethane <0.05 Tetrachloroethylene u- 0.34 Chlorobenzene <0.05 Benzene NA Toluene NA Ethylbenzene NA m-Xylene NA (o&p) Xylenes NA
<0.5 <0.5 <0.5 <0.5 <0.5 <0.5 <0.5 <0.5 5.90 <0.5 1.80 <0.5 .87 <0.5 <0.5 1.40 <0.5 <0.5 <0.5 <0.5 <0.5 <0.5 1.70 <6.5 1.20 1.30 1.10 1.80 2.10
<0.05 <0.05 <0.05 <0.05 0.55 <0.05 <0.05 <0.05 0.41 <0.05 <0.05 <0.05 0.064 <0.05 <0.05 <0.05 <0.05 <0.05 <0.05 <0.05 <0.05 <0.05 <0.05 <0.05 NA NA NA NA NA
<0.025 <0.025 <0.025 <0.025 <0.025 <0.025 <0.025 <0.025 <0.025 <0.025 <0.025 <0.025 <0.025 <0.025 <0.025 <0.025 <0.025 <0.025 <0.025 <0.025 <0.025 <0.025 0.036 <0.025
NA NA NA NA NA
<0.05 <0.05 <0.05 <0.05 <0.05 <0.05 <0.05 <0.05 <0.05 <0.05 <0.05 <0.05 <0.05 <0.05 <0.05 <0.05 <0.05 <0.05 <0.05 <0.05 <0.05 <0.05 <0.05 <0.05 NA NA NA NA NA
<0.05 <0.05 <0.05 <0.05 <0.05 <0.05 <0.05 <0.05 <0.05 <0.05 <0.05 <0.05 0.059 <0.05 <0.05 <0.05 <0.05 <0.05 <0.05 <0.05 <0.05 <0.05 <0.05 <0.05 <0.025 0.029 <0.025 <0.025 <0.025
NA: Not Analyzed; parameters not included in analyses under SW-846 Method 8010.
100090 GERAGHTY & MILLER, INC.

TABLE 16
VOLATILE ORGANIC COMPOUNDS OF THE USEPA SUPERFUND TARGET COMPOUND LIST IN SOIL SAMPLE NUMBER AS-AH-1, 4 TO 6 FEET
LCP CHEMICALS - WEST VIRGINIA, INC. MOUNDSVILLE, WEST VIRGINIA
VOLATILE ORGANIC COMPOUND RESULT (ug/ke)
Acetone <100 Acrolein <7 Acrylonitrile <5 Bromomethane <10 Carbon Disulfide <5 Chjoroethane <10
'".Chloroform • 14,000 Chloromethane <10 Dichlorodifluorome thane <100 1.1- Dichloroethane <5 1.2- Dichloroethylene (total) <5 1.1- Dichloroethylene <5 1.2- Dichloroethane 8
^Methylene chloride * 890 Vinyl chloride <10 Benzene <5 Bromodichldromethane <5 Bromoform <5 2-Butanone <100 Carbon tetrachloride 20 Chlorodibromomethane <5 2-Chloroethyl vinyl ether <10 Dibromomethane <100 l,4-Dichloro-2-butene <100 1,2-Dichloropropane <5 cis-l,3-Dichloropropylene <5 trans-1,3-Dichloropropylene <5 1.1.1- Trichloroethane <5 1.1.2- Trichloroethane <5 Trichloroethylene 8 Vinyl acetate <50 Bromofluorobenzene <5 Chlorobenzene <5 Ethylbenzene <5 Ethyl methacrylate <100 2-Hexanone <50 4-Methyl-2-pentanone <50 Styrene <5 1,1,2,2-Tetrachloroethane <5 Tetrachloroethylene <5
^pTuene . 5 7 1.2.3- Trichloropropane <10 Xylenes <5
GERAGHTY & MILLER, INC. 100091

TABLE 17
GROUND-WATER QUALITY IN THE VICINITY OF OBSERVATION WELL CLUSTER 32
LCP CHEMICALS - WEST VIRGINIA, INC. MOUNDSVILLE, WEST VIRGINIA
WELL NO.
DATE OF SAMPLING
32A (Deep) 2/21/78
32B (Intermediate)
2/21/78
32C (Shallow) 2/21/78
INORGANICS(l) UNITS
pH Specific Cond.
Alkalinity (CaC03) Hardness Calcium Sodium Potassium Magnesium Manganese Iron Lead Nickel Mercury Cadmium Chromium Sulfate Chloride
S.U. umhos/cra
mg/L mg/L mg/L mg/L mg/L mg/L mg/L mg/L mg/L mg/L mg/L mg/L mg/L mg/L mg/L
6.5 6050
600 1980 780 470 14.9
80 27.5 0.04 0.13 0.09 <0.5 0.01
<0.01
263 1576
6.4 3580
962 2090
650 190 7.8 121
19.9 3.00 0.14 0.08 <0.5 0.01
<0.01 722 549
6.6 1950
1824 1640 360 85
5.4 48
10.4 1.86 0.11 0.04
<0.5 <0.01 <0.01
224 255
ORGANICS(2)
Toluene mg/L Chlorobenzene mg/L Dichlorobenzene mg/L Nitrobenzene mg/L Aniline mg/L Nitrotoluene mg/L Dinitrotoluene mg/L Toluidines mg/L Toluenediamine mg/L Phenol mg/L
0.3 0.7 <0.1 2.8 <0.1 <0.1 4.1 <0.1 <0.1
<0.1 <0.1 <0.1 19 2 <1
<0.1 <0.1 <0.1 <0.1 <0.1 <0.1
<1 <1 <1 <1 <1 <1 <1 <1 <1
(1) Analyses for inorganic parameters were performed by Penn Environmental Consultants of Pittsburgh, PA.
(2) Organic chemical analyses were performed by Allied Chemical.
GERAGHTY & MILLER, INC. 1G0092

TABLE 18
RESULTS OF ANALYSES FOR pH, SPECIFIC CONDUCTANCE, TEMPERATURE AND SULFATE IN TANK FARM MONITORING WELLS, JANUARY 8, 1989
LCP CHEMICALS - WEST VIRGINIA, INC. MOUNDSVILLE, WEST VIRGINIA
WELL NUMBER
pH (std. units)
SPECIFIC CONDUCTANCE
(umhos/cra) TEMPERATURE
(C)
SULFATE (mg/L)
TW-1
TW-2
TW-3
TW-4
TW-5
TW-6
6.6
6.5
6.6
6.4
6.5
6.6
1520
2500
1480
700
1100
3100
14
14
13
13.5
15.5
15
529
NA
320
173
263
1134
NOTES: Sulfate analyses were performed by the LCP laboratory. Specific conductance, pH, and temperature were measured immediately following sample collection.
GERAGHTY & MILLER, INC. 100093

DATE 1989
pH (s.u.)
TW-1 SPECIFIC
CONDUCTANCE (umhos/cm)
TEMPERATURE (degrees C)
TABLE 19 RESULTS OF GROUND-WATER MONITORING
SULFURIC ACID SPILL SITE
LCP CHEMICALS - WEST VIRGINIA. INC. MOUNDSVILLE. WEST VIRGINIA
TW-2 SPECIFIC
pH CONDUCTANCE (s.u.) (umhos/cm)
TEMPERATURE (degrees C)
pH (s.u.
TW-3 SPECIFIC
CONDUCTANCE (umhos/cm)
TW-4 SPECIFIC
TEMPERATURE pH CONDUCTANCE TEMPERATURE (degrees C) (s.u.) (umhos/cm) (degrees C)
: 3 B S S S S : : G E S 3 3 S S S S S E S 3 S S 3 S
7-1 7-2 7-3 7-4 7-5 7-6 7-7 7-8
7- 9 7-10 7-11 7-12 7-13 7-14 7-15 7-18 7-20 7-22 7-26 7- 28 8- 2 8-4 8-8 8- 11 8-18 8- 21 9- 12 11- 8 12- 20 1-5-90
6.6 6.6 6.8
6.3 6.6 6.5 6.5
6.6 7
6.6 6.1 6.5 6.5 6.5 6.6 6.6 6.6 6.4 6.6 6.6 6.7 6.7 6.7 6.6 6.6 6.7 6.5 6.3 6.6
900
860 790 650 900
920
625 686 660 900 845 1180 1100 1160 1080 1280
1100 1250 1050 1000 1200 1280 1660 1580 1520
17
16
16 18 17
17
16
16 18 16 16 16
17.5 19.5 14.5 14 12 17
15.5 15.5 13.5 14
5.8* 6.2*
6.5 6.5 6.5 7
6.9
6.4 6.8 6.6 6.5 6.8
6.5 6.65
6.6 6.8 6.5 6.4 6.5
700* 850*
2200 830 2900
1795
1770 2000 1900 2800 2500
2200 2075
2300 2090 2300 2000 2500
18* 15*
17 17 18
18 16
18 17
13 17
18 17 17 15 14
6.6* 6.6
6.4 6;7 7
6.8 6.0 6.7 6.6 6.6 6.6 7.6 7.5 6.3 6.5 6.7 6.8 6.8 6.7 6.65
6.7 6.6 6.4 6.6
800* 18*
2200 1200
694 512 695 980 655 1075 900 1090 1050 1120 950 1025 1100 1000 1000
1070 1500 1570 1480
17 17
16
15
16 16 17 17 14
18.5 18 14 14
14.5
15 15 14 13
6.6* 6.6
6.5 6.4 6.3 6.3 6.4 6.4 7
6.6
6.5 6.3 6.4 6.5 6.6 6.3 6.1 6.4 6.6
6.5 6.7 6.6
6.8 6.5 6.1 6.4
1000* 700
650 600 600 600 730 800
530
576 700 511 740 750 760 720 760 625
700 600 600
710 920 940 700
18* 15.5
15 18 15 16 17
17
16 18
15.5 15 11
14.5
14 14
14.5
15 15
13.5 13.5
O o o CO
Note: Blank data column Indicates that no samples were taken on that date. pH value rounded to nearest whole number was obtained with litmus paper. All other pH measurements obtained with pH-meter.
* Indicates that sample was collected from hollow-stem auger bore.
GERAGHTY & MILLL^WC.

TABLE 19 (continued) RESULTS OF GROUND-WATER MONITORING
SULFURIC ACID SPILL SITE
LCP CHEMICALS - WEST VIRGINIA, INC. MOUNDSVILLE, WEST VIRGINIA
TW-5 SPECIFIC
DATE pH CONDUCTANCE TEMPERATURE 1989 (s.u.) (umhos/cm) (degrees C)
TW-6 SPECIFIC
pH CONDUCTANCE TEMPERATURE (s.u.) (umhos/cm) (degrees C)
RW-1 SPECIFIC
pH CONDUCTANCE TEMPERATURE (s.u.) (umhos/cm) (degrees C)
32A SPECIFIC
pH CONDUCTANCE TEMPERATURE (s.u.) (umhos/cm) (degrees C)
s a c B = x a s s s = a E B & s s s a s s s s a s :
7-1 7-2 7-3 7-4 7-5 7-6 7-7 7-8
7-9 7-10 7-11 7-12 7-13 7-14 7-15 7-18 7-20 7-22 7-26 7- 28 8- 2 8-4 8-8 8-11 8-16 8- 21 9- 12 11-8 12-20 1-5-90
6.6 7
6.4
6.3 6.4 6.5 6.4 6.6 6.5 6.1 6.5 6.7 6.7 6.7 6.7 6.5 6.7 6.8 6.4 6.3 6.5
990
595
569 850 585 800 900 920 855 960 1000 775 1100 950 800 990 970 1290 1330 1100
17
17 17
16 18 17
17 21 18
14.5 15 15 17
15.5 11.5 15.5 15.5
6.6 6.6 6.5 6.7 6.4 6.4 6.6
2560 2400 3000 2720 3200 2800 3100
15 15
18.5 17
16.5 15 15
6.3 6.6 7
6.6 6.5 6.6 6.7 6.6 6.6 6.7 6.3 6.2 6.6 6.6 6.8 6.7 6.8 6.7
6.7
900 1050
733 865 892 1030 798 1160 1100 1100 1100 1220 1150 1050 1100 1000 1000
1300
18
16 15
15 16.5 16
15.5 13 17 17 14 15
14.5
15
6.5 6.0
6.7 6.6 6.9 7
6.9
7.0 7.0 7.0 7.2 6.7
6.9 7
6.9
3800 4000
3200 2800 3250
2340
1740 2100 1972 2500 2200
2000 2080
2270
17
17 17 18
18 17
16.5 18
16 20
18
J—* o o o CO
Note: Blank data column Indicates that no samples were taken on that date. pH value rounded to nearest whole number was obtained with litmus paper. All other pH measurements obtained with pH-meter.
* Indicates that sample was collected from hollow-stem auger bore.
GERAGHTY & MILLER, INC.

TABLE 20
VOLATILE ORGANIC CHEMICAL CONCENTRATIONS IN SELECTED TANK FARM MONITORING WELLS
(WELLS SAMPLED JULY 20, 1989)
LCP CHEMICALS-WEST VIRGINIA, INC. MOUNDSVILLE, WEST VIRGINIA
METHYLENE CARBON WELL CHLORIDE CHLOROFORM TETRACHLORIDE
NUMBER (mg/L); (mg/L) (ug/L)
TW-1 234 23446 11
TW-2 31 / 17 4
TW-3 47 62 16
TW-4 5 ND ND
TW-5 1,357 65,731 5
RW-1 240 1,978 ND
MW-32A 37 19 5
ND = Not Detected
Analyses performed by LCP laboratory
GERAGHTY & MILLER, INC. 100096

TABLE 21 VOLATILE ORGANIC CHEMICAL CONCENTRATIONS IN SELECTED TANK FARM MONITORING WELLS
(WELLS SAMPLED AUGUST 21, 1989)
LCP CHEMICALS-WEST VIRGINIA, INC. MOUNSVILLE, WEST VIRGINIA
DETECTION TW-6 TW-1 TW-2 TW-5 PARAMETER LIMIT (Background)
Cbloromethane Bromomethane Vinyl Chloride Chloroethane Acrolein
<50 <50 <50 <50 <500
BDL BDL BDL BDL BDL
BDL BDL BDL BDL BDL
BDL BDL BDL BDL BDL
BDL BDL BDL BDL BDL
Aciylonitrile Methylene Chloride Trichlorofluoromethane 1,1 -Dichloroethylene 1,1-Dichloroethane
<500 <50 <25 <25 <25
BDL BDL BDL BDL BDL
BDL BDL BDL BDL BDL
BDL BDL BDL BDL BDL
BDL BDL BDL BDL BDL
Chloroform 1,2-Dichloroethane 1,1,1 -Trichloroethane Carbon Tetrachloride Bromodichloromethane
<25 <25 <25 <25 <25
BDL BDL BDL BDL BDL
9600 BDL BDL BDL BDL
BDL BDL BDL BDL BDL
49000 BDL BDL BDL BDL
1,1,2,2-Tetrachloroethane <25 1,2-DichIoropropane <2S Trans-l,3-Dichloropropylene <25 Trichloroethylene <25 Chlorodibromomethane <25
BDL BDL BDL BDL BDL
BDL BDL BDL BDL BDL
BDL BDL BDL BDL BDL
BDL BDL BDL BDL BDL
1,1,2-TrichIoroethane Benzene cis-1,3-Dichloropropylene 2-Chloroethylvinyl ether Bromoform
<25 <25 <25 <50 <25
BDL 270 BDL BDL BDL
BDL 56 BDL BDL BDL
BDL 470 BDL BDL BDL
BDL 29 BDL BDL BDL
Tetrachloroethylene Toluene Chlorobenzene Ethylbenzene Xylenses (0-, m-, p-)
<25 <25 <25 <25 <25
BDL 32 93 BDL BDL
BDL BDL 40 BDL BDL
BDL BDL 170 BDL BDL
BDL 48 BDL BDL BDL
BDL = Below Detection Limit
GERAGHTY & MILLER, INC.
1GG097

TABLE 22
WATER-QUALITY ANALYSES TO BE PERFORMED ON GROUND-WATER SAMPLES FROM TANK FARM MONITORING WELLS
LCP CHEMICALS-WEST VIRGINIA, INC. MOUNDSVILLE, WEST VIRGINIA
pH (field and laboratory) Specific Conductance (field and laboratory) Temperature (field) Alkalinity Total Dissolved Solids Total Organic Carbon Chloride Fluoride Sulfate
Sodium Potassium Calcium Magnesium Manganese Iron Aluminum
Chloromethane Bromomethane Vinyl Chloride Chloroethane Methylene Chloride Acetone Carbon Disulfide 1,1 -Dichloroethene 1,1 -Dichloroethane trans-1,2-Dichloroethene Chloroform 1,2-Dichlroethane 2-Butanone 1,1,1 -Trichloroethane Carbon Tetrachloride Vinyl Acetate Bromodichloromethane 1,1,2,2-Tetrachloroethane
1,2-Dichloropropane trans-1,3-Dichloropropene Trichloroethene Dibromochloromethane 1,1,2 -Trichloroethane Benzene cis-1,3-Dichloropropene 2-Chloroethyl Vinyl Ether Bromoform 2-Hexanone 4-Methyl-2-pentanone Tetrachloroethene Toluene Chlorobenzene Ethyl Benzene Styrene Total Xylenes
GERAGHTY & MILLER, INC.
100098

TABLE 23
MONITORING WELLS TO BE SAMPLED UNDER THE SULFURIC ACID SPILL REMEDIAL ACTION PROGRAM
LCP CHEMICALS-WEST VIRGINIA, INC. MOUNDSVILLE, WEST VIRGINIA
TW-1
TW-2
TW-3
32 A
TW-4
TW-5
TW-6
GERAGHTY & MILLER, INC. 1CCG99

PROPERTY LINE -L C P CHEMICALS, INC.
WATER SUPPLY WELL
S C A L E
0 2000 '
CONTOUR I N T E R V A L 20 F E E T LCP Chemicals-West Virginia, Inc. Moundsvi l le, West Virg in ia
(Source: Bus inessburg, Ohio 7 .5 ' U.S.G.S. Quadrangle)

PROPERTY LINE -L C P CHEMICALS, INC.
T 2 RIVER T E R R A C E S
S C A L E
0 2000
Loco t i on of River Terroces C O N T O U R I N T E R V A L 20 F E E T
L C P Chemicals, Inc. Moundsvi l le, West Virginia
(Source: Businessburg, Ohio 7.5 ' U.S.G.S. Quadrangle)

^•'GERAGHTY '& MILLER, INC.
Environmental Services
r- 50 F t
2 UJ
I-to >-CO
< > _j
>-CO
UJ 0_
Q. 3 O
or CD
UJ X < CD
z o z o
APPROX. AREA REPRESENTED BY SECTION
Waynesburg Coal
Uniontown Sandstone
Uniontown Coal Uniontown Limestone L. Uniontown Coal Arnoldsburg Sandstone Arnoldsburg Limestone Fulton Green Shale
Benwood Limestone
Sewickly Coal L. Sewickly Sandstone L. Sewickly Coal
Fishpot Coal Fishpot Limestone
Redstone Sandstone
Redstone Coal
Redstone Limestone
Pittsburgh Coal
F l G U R E 3
(Obta ined from Geologic and Economic Resources of the Ohio R i ve r Val ley in
West V i rg in ia , " P r i c e , 1955 )
G E N E R A L I Z E D S T R A T I G R A P H I C S E C T I O N OF B E D R O C K B E N E A T H W E S T VIRGINIA'S N O R T H E R N P A N H A N D L E
L C P C H E M I C A L S - W E S T V I R G I N I A , INC. M O U N D S V I L L E , W E S T V IRGINIA
100102
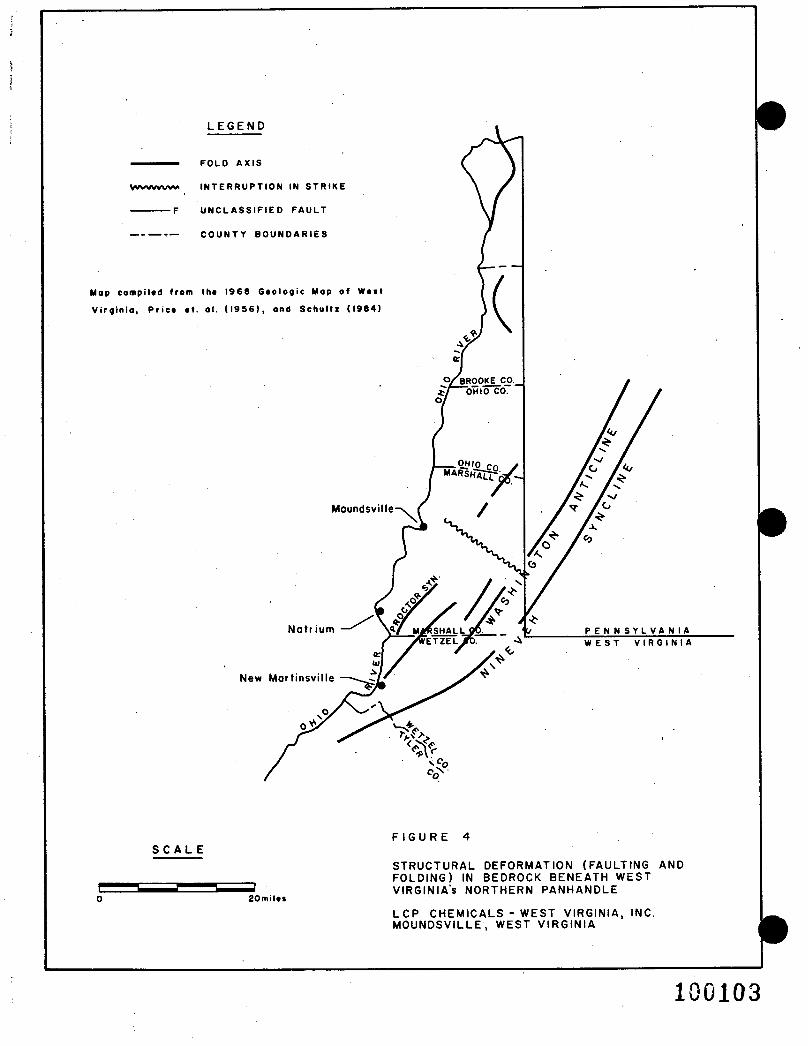
S C A L E
20miles
F I G U R E 4
S T R U C T U R A L D E F O R M A T I O N ( F A U L T I N G AND F O L D I N G ) IN B E D R O C K B E N E A T H W E S T VIRGINIA'S N O R T H E R N P A N H A N D L E
L C P C H E M I C A L S - W E S T VIRGINIA, INC. M O U N D S V I L L E , W E S T V IRGIN IA
100103

100104

cr o C'1
OHIO R I V E R
LEGEND
SANDSTONE SHALE SILTSTONE AND C L A Y S T O N E
CALCAREOUS SHALE AND SILTSTONE
SANDSTONE L E N S E S IN S H A L E
COAL
INTERBEDDED LIMESTONE WITHIN SILTSTONE ANO SHALE
S C A L E O 2 0 0 ' HORIZONTAL
0 4 0 V E R T I C A L
V E R T I C A L EXAGGERATION = 5X
-780
•760
-740
-720
-700
-680
-660
-640
F I G U R E 6
R E P R E S E N T A T I V E C R O S S S E C T I O N OF T H E OHIO R I V E R V A L L E Y AT R O U N D B O T T O M
L C P C H E M I C A L S - W E S T V I R G I N I A , INC. M O U N D S V I L L E , W E S T V I R G I N I A

100106

A A'
WEST EAST
o o
o
680
670
660 •
650
5* 6 4 0
S UJ
> 630 CD
620 ui ui u. ? 610
P 600 > UJ
ui 590
580
570
560
550
MW-6A,B,C M W - 6 A . B
(projected ~ 80'north)
20A,B,C
(projected ~ 50' south)
2IA.B
Bedrock
Bedrock
F I G U R E 8
G E N E R A L I Z E D G E O L O G I C C R O S S S E C T I O N A - A '
L C P C H E M I C A L S - W E S T V I R G I N I A , INC. M O U N a S t f l L L E , W E S T V I R G I N I A O U N ^ ^ I L
S C A L E
0 200 Fe«l
V E R T I C A L E X A G G E R A T I O N = I0»
K = I . U I 0 - 7 H Y D R A U L I C CONDUCTIV ITY OF SOIL M A T E R I A L ( c m / i e c ) F R O M S A T A K E N AT D E P T H INOICATE l f
r WELL DEPTH
L E G E N D
•S- G R O U N D - W A T E R E L E V A T I O N ( 7 / 2 7 / 8 8 )
- S C R E E N E D I N T E R V A L
680
670
660
650
640
630
620
- 610
- 600
590
580
570
560
550
- > G E N E R A L G R O U N D - W A T E R F L O W D I R E C T I O N

B
WEST
B'
EAST
O O r—*•
o CO
710 -
700 -
690 -
680 -
670 -
660 -> o 00
< 650
1? 640 -
630
4 uj 620 _ i UJ
HG-IOA.B H0-7A.B HG-2A.B.C HG-5A,B,C MW-12 HG-4 (projected ~ 50'south) (projected ~ 100' south) (projected ~ 15G'south) (projected - 80'north)
Ohio River
610 -
600
590 -
580
570
FIGURE 9
Silty clay Pool Ei«v. / and sand 624 2 0 / (fine)
Bedrock
SCALE W E L L
D E P T H
GENERALIZED GEOLOGIC CROSS SECTION B - B'
L C P CHEMICALS - WEST VIRGINIA, INC. MOUNDSVILLE, WEST VIRGINIA
0 200F«»I
VERTICAL EXAGGERATION = I0»
L E G E N D
Is- GROUND-WATER ELEVATION ( 7 / 2 7 / 8 8 )
J - SCREENED INTERVAL
—> GENERAL GROUND-WATER FLOW DIRECTION
710
700
690
680
670
660
650
640
630
620
610
600
590
580
570

c WEST
c EAST
HG-9A.B
o o o CO
710
700
690
680
670 _i co 3 660 > o 5 650 !-• UJ
£ 640 z
z* 630 o
S 620 _ l UJ
610
600
590
580
570
MW-9 A,B (projected ~ 5' north)
Sand
F I G U R E 10
G E N E R A L I Z E D G E O L O G I C C R O S S S E C T I O N C - C
L C P C H E M I C A L S - W E S T V I R G I N I A , INC. M O U N Q f i l U L L E , W E S T V I R G I N I A
Bedrock
Bedrock
S C A L E
0 2 0 0 Feet
V E R T I C A L E X A G G E R A T I O N = I 0»
W E L L D E P T H
weathered sandstone
L E G E N D
I 2- G R O U N D - W A T E R E L E V A T I O N ( 7 / 2 7 / 8 8 )
! - S C R E E N E D I N T E R V A L
710
700
690
680
670
660
650
640
630
620
610
600
590
580
570
- * G E N E R A L G R O U N D - W A T E R FLOW D I R E C T I O N

D
WEST
D'
E A S T
710
700
690
680
670
1 660 ui > o 3 650
ui V 640
630
£ 620
610
600
590
580
570
10 II (projected -70'north) (projected ~60'north)
MW-1
Sand (med.-ca) and gravel (med.)
with silt
Sand (coarse) and gravel (med.)
with silt
Bedrock
Bedrock
S C A L E r O O
F I G U R E II
GENERALIZED GEOLOGIC CROSS SECTION 0 - D 1
L C P CHEMICALS -WEST VIRGINIA, INC. MOUNDSVILLE, WEST VIRGINIA
0 200 Fwt
VERTICAL EXAGGERATION = I0»
HYDRAULIC CONDUCTIVITY OF SOIL MATERIAL (cm/sec) FROM SAMPLE TAKEN AT DEPTH INDICATED
WELL DEPTH
L E G E N D
GROUND - WATER ELEVATION (7/27/88)
J - SCREENED INTERVAL
—> GENERAL GROUND-WATER FLOW DIRECTION
710
700
690
680
670
660
650
640
- 630
- 620
610
600
590
580
570

NORTH
E'
SOUTH
660
650
640
630 _i in
w 620 > o CO < 610
m u. 600 z
590
u , 580
570
560
550
540
O O
38A.B.C HG-I0A.B H6-9A.B MW-5B.A MW-4 A,B 7 I (projected"BO west)
1
9
(projected 50' eost)
MW-3A.B
Bedrock
WELL DEPTH
LEGEND
G R O U N D - W A T E R E L E V A T I O N ( 7 / 2 7 / 8 8 )
J - S C R E E N E D I N T E R V A L
-i 660
- 650
- 640
- 630
- 620
- 610
- 600
- 590
- 580
- 570
- 360
- 530
- 540
- > G E N E R A L G R O U N D - W A T E R FLOW D I R E C T I O N
SCALE
0 2 0 0 Fe«l
V E R T I C A L E X A G G E R A T I O N = I0«
K = I . 2 « I 0 " ' H Y D R A U L I C CONDUCTIV ITY OF SOIL M A T E R I A L to/itt) F R O M S A M P L E T A K E N AT D E P T H INDICATED
F I G U R E 12
G E N E R A L I Z E D G E O L O G I C C R O S S S E C T I O N E - E '
L C P C H E M I C A L S - W E S T V I R G I N I A , INC. M O U N D S V I L L E , W E S T V I R G I N I A

NORTH
F'
S O U T H
O
o
710 •
700 -
690 -
680 -
670 • _ i to s 660 ui > o 3 650 H" UI
£ 640 •
z 630 o
£ 620 • _ i ui
610 •
600
590
580
570
HG-5A.B.C MW-I0A.B M W - 2 A . B
Pond 3 closed
Silt
Gravel (fine-co.) and silty sand
Sand (fine-co.) and gravel (fine-co.)
1 ^ - v jo Coarse — J sand
Sand (fine-co.) ond gravel (fine-co.)
F I G U R E 13
GENERALIZED GEOLOGIC CROSS SECTION F - F '
L C P CHEMICALS - WEST VIRGINIA, INC. MOUNDSVILLE, WEST VIRGINIA
S C A L E
0 200 Feet
VERTICAL EXAGGERATION = I0»
' Sand, gravel sand silty clay
Gravel (fine-co.) and silty sand
Sand (fine-co.) and gravel (fine-co.)
Clay and weathered sandstone
Bedrock
F i l l , soil
Sand (fine-co.) and gravel (fine-co.)
Sond, gravel and silt iv
Sand (fine-co.) and gravel (fine-co.)
Gravel (fine-co.) and silty sand
r W E L L
D E P T H
L E G E N D
• 2 - GROUND-WATER ELEVATION ( 7 / 2 7 / 8 8 )
710
- 700
• 690
680
670
660
650
640
630
620
610
600
590
580
570
I . SCREENED INTERVAL

L C P CHEMICALS - WEST VIRGINIA, INC. MOUNDSVILLE, WEST VIRGINIA
100113

F I G U R E IS
GENERALIZED GROUND-WATER FLOW PATTERNS WITHIN THE LOWER PORTION OF THE ALLUVIAL AQUIFER AS OF SEPTEMBER 27, I9B8
L C P CHEMICALS - WEST VIRGINIA, INC. MOUNDSVILLE, WEST VIRGINIA
100114

F I G U R E 16
GENERALIZED GROUND-WATER FLOW WITHIN THE LOWER PORTION OF THE A L L U V I A L AQUIFER, OCTOBER 30, 1989
MOUNDSVILLE, WEST VIRGINIA
100115

2000 '
Locotions of Water-Supply Wells C O N T O u n I N T E R V A U 2 0 F E E T LCP Chemicals-West Virginia, Inc. Moundsville, West Virginia
(Source: Businessburg, Ohio 7.5' U.S.G.S. Quadrangle)

F I G U R E 18 A S S U M E D C O N D I T I O N S S E R V I N G A S A B A S I S F O R
C A L C U L A T I O N OF V E R T I C A L F L O W V E L O C I T I E S
L C P C H E M I C A L S - W E S T V I R G I N I A , INC.
M O U N D S V I L L E , W E S T V I R G I N I A
M W - 8
C B A
S I L T A N D C L A Y
C L A Y E Y S A N D =
S I L T A N D C L A Y
A L L U V I A L A Q U I F E R
PERCHED - ZONE WATER LEVEL
APPROXIMATE BOTTOM OF PERCHED ZONE 1
A L L U V I A L AQUIFER W A T E R L E V E L
h = HYDRAULIC HEAD DIFFERENCE BETWEEN THE PERCHED ZONE AND THE ALLUVIAL AQUIFER
d = THICKNESS OF THE SILT AND CLAY CONFINING LAYER
I = VERTICAL HYDRAULIC GRADIENT = h / d
100117
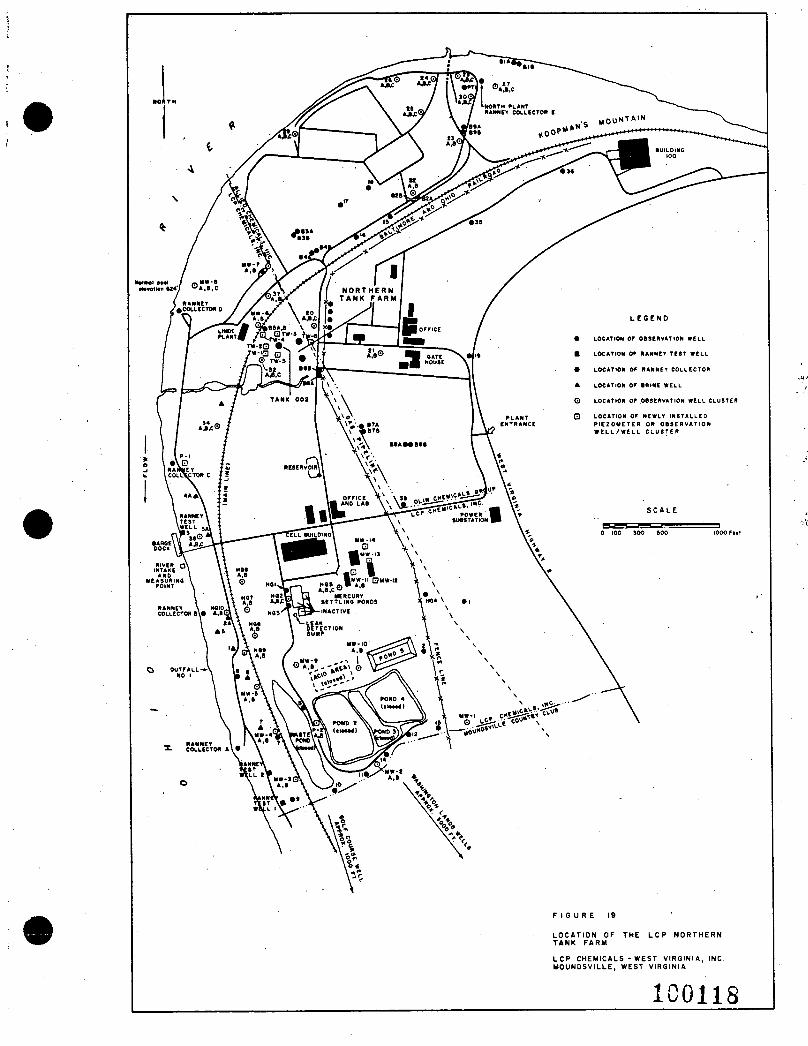
LOCATION OF THE L C P NORTHERN TANK FARM
L C P CHEMICALS - WEST VIRGINIA, INC. MOUNDSVILLE, WEST VIRGINIA
100118

AW GERAGHTY AV&c MILLER, INC.
•^kjjjSr Ground— Wattr ConrultarUw
COMPILED BY! T. RATVASKY
PREPARED S. LOFTUS
PROXCT nan.
T. RATVASKY
DATC:
9/17/69
SCALE:
l" = 100'
m Ha P A 0 0 4 0 8
PREPARED FOR:
L C P C H E M I C A L S - W E S T V I R G I N I A , INC.
M O U N D S V I L L E W E S T V I R G I N I A
o o
CD
619.5-
L E G E N D
MONITORING W E L L WITH DESIGNATION
LINE OF E Q U A L G R O U N D WATER E L E V A T I O N , IN F E E T , M.S.L. ( D A S H E D WHERE I N F E R R E D )
^ G R O U N D - W A T E R FLOW
100 Feel
INFERRED UPPER A L L U V I A L AQUIFER FLOW PATTERNS B E N E A T H LCP's NORTHERN TANK FARM, SEPTEMBER 12, 1989
FIGURE
2 0

A W GERAGHTY A V k MILLER. INC.
T. R A T V A S K Y
S f " T. R A T V A S K Y 8 / 4 / B 9
L C P C H E M I C A L S - W E S T V I R G I N I A , I N C .
M O U N D S V I L L E W E S T V I R G I N I A
I £ G £ N D
— 2 - I N C H - D I A M E T E R M O N I T O R t N O W E L L
| T W '* W , T M t O E N T i n C A T I O N N U M B E R ( R W - D F o f l M E R I D E N T I F I C A T I O N N U M B E R
3 R W - I 4 - I N C H - D I A M E T E R R E C O V E R V W E L L
+ } ' ' H A N D ~ A U O E R B O R 1 N 0 W I T H D E P T H 9 , * F T .
H O L L O W - S T E M A U O E R B O R I N G
" A S - A H - 1
O O H-* to o
5 C A L £.
TW-4 gr. / /
/ / / /
/ / / /
/ /
R W - l ( J ( R W - 5 1 A
RW - 3 (RW-T)
T W - . ~ I R W - r ) a '
3 2 A . B . C
A C C E S S ( D I R T ) R O A D
N - 5 ' T F T .
C - 3
S E T .
+
S T E E L L A O D E R
TW - S ( R W - 8 1
P I P E L I N E ( O V E R H E A O )
A T - OR A D C P I P E L I N E
- P I P E L I N E ( A T - 6 R A D E I
A P P R O X I M A T E L O C A T I O N S OF S O I L B O R I N G S A N D M O N I T O R I N G / R E C O V E R Y W E L L S
FIGURE
2 I

GEO'CON INC.
AnOTTTVE STORAGE
BVLK STORAGE
BXTCHTHG CONTROL
.xz. WATER SUPPLY
PQWIR SOTOCE
QDmmuriication i s maintained between operators at r i g and plant.
SSM operator has readout of verticality and flow.
• C-fltlTBOT. SENSORS
-FLOW LINE
-.COMMUNICATIONS LINE
CONTROL LINE
FIGU[p^22. Slurry Feed System

'& GEO'CON INC.

GEO-CON INC. FIGURE 24
FORM 2
DAILY REPORT NO.
PROTECT NO.
MACHINE NO.
WEATHER
HtoTECT KICATION
COMPLETED COLUMN NO.
DATE _
SHIFT
COLUMN NO.
TOTALS
TOP ELEVATION
DEPTH
CYCLE TIME (MLN)
ADDITIVE RATIO
GALLONS PER FOOT
VOLUME (C.F.)
ADDITIVE (LBS.)
REMARKS
100123
GEO-CON, INC. OWNER

FIGURE 25
GEO-CON INC. FORM 1
CMJBRATTON REPORT
DATE: ECOTFMENT:
METHOD:
RESULT:
GEO-CON RFJPRESEOTATTVE —
OWNER REPRESFJ^TATTVE

j m r GERAGHTY J r & MILLER. INC.
T. R A T V A S K Y
T. R A T V A S K Y
P A 0 0 4 0 0 L C P C H E M I C A L S - W E S T V I R G I N I A , I N C .
M O U N O S V I L L E W E S T V I R G I N I A
L e G e N o
2 - I N C H - D I A M E T E R M O N I T O R I N G W E L L W I T H I D E N T I F I C A T I O N N U M B E R F O R M E R I D E N T I F I C A T I O N N U M B E R
O R W - I 4 - I N C H - D I A M E T E R R E C O V E R Y W E L L
O A P P R O X I M A T E S O I L S A M P L I N O L O C A T I O N
© T W - I ( R W - I )
T W - 4 f i / / ( R W - 4 ) ' 3 ' / /
/ / * * * / /
/ / / / / /
SCALE
o
I - J I 0 *
•«-' 3 I R W - 5 I
( R W - 71
3
3 2 A . B . C
A C C E S S { D I R T > R O A D
r-3 ~
TW-5 ~ (R W- 9 ) W
-X X -K X X X X-
O O
O O
o o
APPROXIMATE LOCATIONS FOR TREATED SOIL SAMPLE COLLECTION
FICIJ°F
26

APPENDIX A
SPECIFICATIONS FOR TANK 002
GERAGHTY & MILLER, INC.

o
w 100123
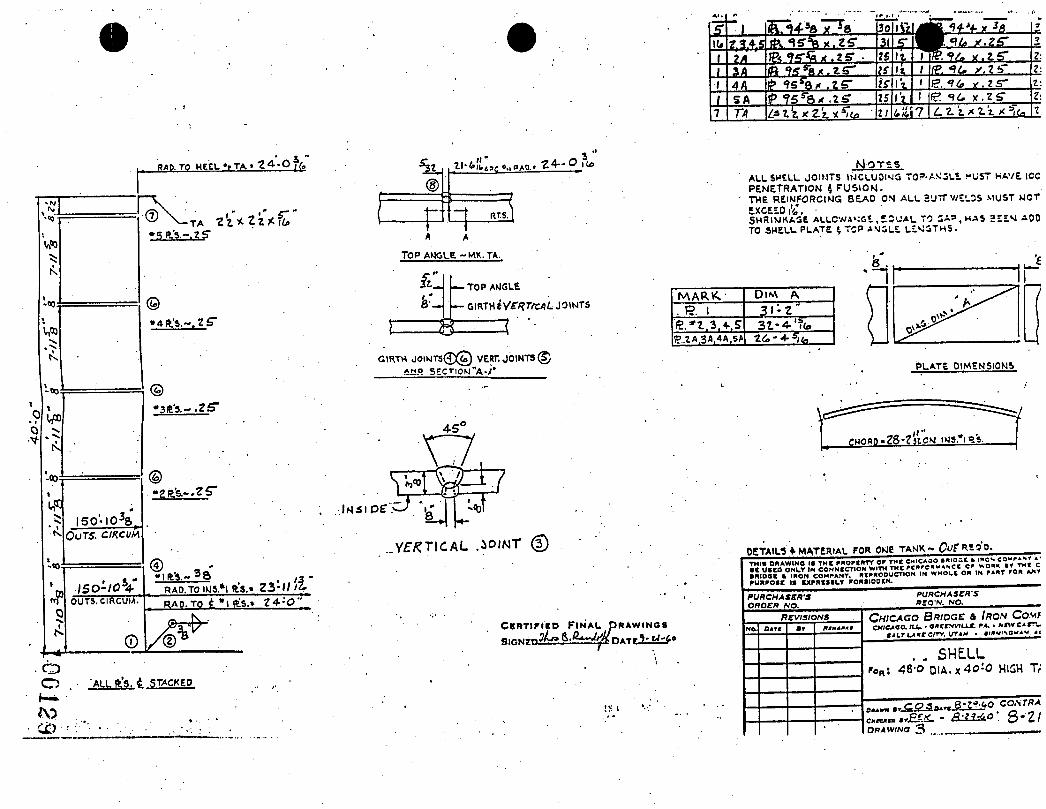
30
31
25 i i it?. ^ y . 2 6"
4J_ g . - T & y . Z S -
SA
WD
«>
-00
R»D. TO HEEL »t TA ' 1 4- - O / U
® >—TA *q it.'}.-,;?
i " - . ' * 5 " "
®
4 R.T.S.
TOP AMGLE — MK. TA.
• i
-«0:
I
JD
0
150-10%.
OuTS. C/KCUM
• ISO-10% OUTS.CIRCUM.
'A f t . ' S . - . gg '
© , -- i t ' s . - 3 a , -
RA0.TO IU3.*! ft's.» Z3-U Itr
t
— TOP ANGLE
— GIRTH iVeRTf tAL JOINTS
8 3 GIRTtA J O I N T S © @ VERT. JOINTS (?)
*H.o S E C T | Q M " A - / '
...YfKTICAL .iOJNT (3)
RAD. TO £ * l ftls.» 2 4 : Q '
V
M O T S S ALL SHELL. JOIMTS INCLUDING T O ^ A M J L E MUST HAVE ICC PENETRATION 4 F U S I O N . THE REINFORCING B E A D OS A L L 3'JTT WEL3S MUST MOT EXCEED i ' i . • S H R I N K A G E A L L C W A S S t , * 5 ' J A L TO 2 A » , H A S 2 E E N ADO TO SHELL PLATE I TCP A U 5 L E L E N G T H S .
M A R W
e. i lg.*t.3,4-.S rg..2A.3A,4A,5A
D I M A
3 1 - 2
C B R T I F I K O F I N A L D R A W I N G S
O ALL fe's, 4 STACKEO
P L A T E OIMSNSIONS
^HOBO • 2 8 ON IMS.'l g'S.
DETAILS » MATERIAL FOR ONE TANK — CofWor
T H I . DRAWING • * TMK P A O P J R T Y S . V e
0 » 0 « " ' e « S C ? ' S o « l " ' ™ ! V • t U K O O N L Y IN CONNECTION ^ > ^ T ^ " K ' S Z ^ i % Bm t H t K H X r O H U > y • m o o t 4 IRON C O M P A N Y . REPRODUCTION IN W M O L f OP. IN PAP.T POP. » T P U R P O M IS U P B U I L T fORSIOOCN. ^ ^ ^ ^ ^ ^
PURCHASER'S OROER NO.
PURCHASER'S REO'N. NO.
REVISIONS CHICAGO BRIDGE a IRON COMF CHICAGO. IU. • ORtCNVlUX PA. • »*W CAiri.
SALT lAXtCITY. UTAH • "
. . SHELL r o a : 48-0 DIA.x40-0 HIGH TV
*»«. . * £SZa»~3Z2* ° CCAT«A
C M I K B S I - . a ^ i ^ 8 - 2 / ORAWINO 3

DRAWINGS FITTINGS FUHWSHEOt.IMSTAU.E0 BY C.6.<LC0.
M A R K I D R A W I N C tfidol • D E S C R I P T I O N
G E N E R A L P L A N
BOTTOM
7 a " r U f l » a L f / c o n r w n t f u f y u f f f f f )
suns < T - t « f . < F T C n t > pg H ' « H : < a f f l U - W f i L P i p e i Finir.r
« l T I M - W f f L L A - O - I O N C . S W
S £ 3
PIG . S T - Z O O I WITH F I B O W fcV-aso
C 3 - f . C 3 - I l ' - tSQ m &-P. SHELt NOZZLES (/«rt«f«cc cowrcai'
•tatm. t ' . I M V V f . . t . F l l N O X T t P S C ^ F C T T V A C V C )
sooa f M J c i o . f e o a 6«GE HOLE c o v g g RKCA B S 5 t - l t ? « < e o F MQZZLE. ( { « t » « i . t ) ( v f w r
3 -IIS" HOOF H O I U e < V t X T l
3 ' BLIND FLAN6C ( » C » T >
>0 SUft t MAWHOtf
H<0> I * C o o o * C U T r i i i i » t i W i ^ T » f » H » w f i i )
f J S » f » f l l f H V A J L V E g H . i M K S
< l - < t « J c i » w f I B R g S T e g P I C . S T - a f c a
P H T F C B M « . C / P F ^ 3 P T S
S T A l B W f l V ^ P l f l T F O R . M
TOP URNnaaiL Pt/Trgenr1 {AXCHBB na,r S£T.
e r » p T » « t . » » T t i » ' . .
TANK TO BE OF AU. WELDED CONSTRUCTION. WELDING TO BE AS SHOWN ON DETAILS, • •
A L L V E R T I C A L * G I R T H J O I N T S O N S H E L L T O N A V E K » « P E N E T R A T I O N A F U S I O N . T H E R E I N F O R C I N G B E A D O N A U . BUTT* W E L D S M U S T NOT E X C E E D l / l « " . . A L L S H E L L J O I N T S T O B E S E C T l O N e p A S REOUIREO B Y C O D E . F O U N D A T I O N . B r O T H E R S E R E C T I O N . B Y C H I C A G O B R I D G E * IRON C O M P A N Y SERVICE . TOLUE.MC . , , - ..-' CAPACITY - 5 4 / . 3 S O Q A L S - C ' 2 8 9 ° BBLS) S P E C I F I C A T I O N S - A P I - I Z C S T E E L - P L A T E S A t U G - . C S T R U C T U R A L AT
• N S P E C H O N . y ^ f o r f Y i K C T l F l O m o N .
' " r ^ . ^ * ; t ^ C * I S T O M « . ' J T O * Y * M 0 T I F I C / 1 T I O N -
" O C U N S - M O
PAINTING - U O N E B Y W l * * . F I T T I N G S - T O B E L O C A T E D A S S H O W N OR T O S W T C U S T O M E R W F I E L D .
< C O S E S O F A D J A C E N T R E I N F O R C I N G P L A T E S M U S T B E A T L E A S T A P A R T . N O Z Z L E B O L T H O L E S . T O S T R A D D L E V E R T I C A L ft RADIAL. C E N T E R U N E S .
DETAILS t.MATERIAL FOR ONE TAMK-QNE REQ'o. V M M D M W M W THC P H O P f «TT O P TME O K i M • • i O « « ft M O W C O — A M O I I T Q
u « > o O K I w e o « « t c T K > " " m r i « n » e « n « a op * o - « . r T X < O K U O • • • o o f • M O * eo»p««». »«p joo«e t io« M a m o u . M M P » « T m M I m u pw«po«c M a m * M ro««*oo«M.
OA-OTA- P/O. 3 Q - f a ' S 3 r-VftCMAAXR-S pfo-w. wo.
CHICAGO BRIDGE a /now COMPANY c*»o. «u. M u m i t u P A . . pftw CAarcc a n . * A i r c * « r c * r r . UTAH . a f — w o « * « .
, , G E N E R A L PI AN
" IA.TIONA.1 AKMHf niVALLieoX^EfACop.f
H . ~ J A . C ^ „ e i H a C O N T R A C T H O . c w . C O * j . - J J t i ^ O O A 4 W W O I o r
r L A N S M A D E A T G R E E N V I L L E R A M O O L P M I ^ C H A J U E

APPENDIX B
DESCRIPTION OF FIELD PROCEDURES NORTHERN TANK FARM INVESTIGATION
LCP CHEMICALS - WEST VIRGINIA, INC. MOUNDSVILLE, WEST VIRGINIA
GERAGHTY & MILLER, INC.
100131

APPENDIX B
DESCRIPTION OF FIELD PROCEDURES NORTHERN TANK FARM INVESTIGATION
LCP CHEMICALS - WEST VIRGINIA, INC. MOUNDSVILLE, WEST VIRGINIA
During the Summer and Fall of 1989, Geraghty & Miller, Inc. (Geraghty & Miller) designed
and implemented a hydrogeologic investigation of the northern tank farm at LCP Chemicals-West
Virginia, Inc.'s Moundsville, West Virginia facility. The principal objectives of this investigation
were to (1) identify the extent of surface and subsurface contamination resulting from a June 29,
1989 spent sulfuric acid release form storage tank 002; and (2) to obtain site specific information to
facilitate selection of a remedial option for the sulfuric acid spill site.
Activities performed during this investigation included:
• Drilling, soil sampling and installation of six, two-inch diameter monitoring wells and
three four-inch diameter shallow recovery wells;
• Ground-water sampling and analysis for general indicator parameters (pH, specific
conductance, temperature) and volatile organic compounds (VOCS);
• Perform 11 hand-auger borings within the tank 002 containment area, and collect soil
samples for analysis of sulfuric acid concentration and VOCs;
• Perform one deep hollow-stem auger boring within the spill containment area to
characterize acid-affected subsurface soils;
• Conduct a soil vapor survey of the containment area.
GERAGHTY & MILLER, INC.
100132

APPENDIX B - 2 -
Drilling. Soil Sampling, and Well Installation Procedures
Drilling and Soil Sampling Procedures
On July 1, 1989, Geraghty and Miller, Inc., initiated a drilling and ground-water sampling
program designed to identify the impacts of spent sulfuric acid on soil and ground-water quality
within and downgradient of the spill containment area, and to install an emergency ground-water
recovery system to be employed in the event of ground-water contamination resulting from the spill.
A total of eight soil borings (TW-1 through TW-5 and RW-1 through RW-3) were advanced
at selected locations within the northern tank farm. Each soil boring was subsequently utilized for
either monitoring well or recovery well, installation (see Figure 20 for locations of these wells).
Drilling, soil sampling and well installation were performed by the H. C. Nutting Company of
Charleston, WV, under the supervision of a Geraghty & Miller, Inc. scientist. Two additional soil
borings (TW-6 and AS-AH-1) were completed at a later date by the Pennsylvania Drilling Company
of Pittsburgh, PA (on 8/3/89 and 10/5/89 respectively). TW-6 was completed as an upgradient well
to the northeast of the containment area and AS-AH-1 served as a test boring within the containment
area itself (Figure 20). Soil boring logs and well construction specifications are provided in
Appendix C.
Boreholes were advanced using a truck-mounted drill rig in conjunction with 4 1/4-inch I.D.
hollow stem augers. Each borehole was advanced into the upper 15 to 20 feet of the alluvial aquifer.
Drilling fluids were not used unless absolutely needed to control running sands; in those instances,
clean plant water (from Washington Lands Public Water Supply) was used to flush the augers.
Soil samples were collected and described at two- and/or five-foot intervals in selected
boreholes (see boring logs in Appendix C). A split-spoon sampling device (two-inch diameter) was
GERAGHTY & MILLER, INC.

APPENDIX B -3-
driven ahead of the lead auger in accordance with ASTM procedure D-1586-84. Upon opening the
spoon, soil samples were analyzed with a flame ionization detector (Foxboro Model 128 OVA) to
identify the presence of volatile organic compounds (VOCs). Boreholes outside of the containment
area (TW- and RW-series) were routinely monitored for soil pH as well. Soil was then removed from
the split spoon and described for gross composition, texture, color, moisture, and overall appearance.
All field descriptions and field parameters were recorded on drilling logs (see Appendix C). A
representative portion of each sample was placed in a glass sample jar, sealed, labelled, and stored
for later reference and mechanical analyses. Split-spoons were thoroughly cleaned (laboratory-grade
detergent) and rinsed (distilled water) between each sampling interval.
Soil samples from borehole AS-AH-1 were subjected to more rigorous sampling procedures.
Six-inch long brass liners were used inside of the split spoon to facilitate sample collection. As
described above, soil samples were first monitored for organic vapors and field pH. The brass liner
containing the most soil (usually the first or second tube in the split spoon) was then removed,
enclosed with tightly-fitting plastic end caps, and sealed with electrical tape. Sample containers
were correspondingly labelled with the project name, soil boring designation, depth interval, OVA
reading, and date. Sealed sample tubes were stored in an iced cooler chest to best preserve in-situ
chemical parameters. Soil remaining in the split spoon was subsequently described and documented
as previously described. Soil samples were also collected for later reference, as described above.
Split-spoons and brass liners were thoroughly decontaminated between each sampling interval using
a laboratory grade detergent wash and multiple distilled water rinses.
Results of the OVA field screening and soil descriptions were used to select representative
samples from borehole AS-AH-1 for laboratory analysis. Selected soil samples were analyzed for
percent sulfuric acid, Contract Lab Program (CLP) metals, volatile organic compounds (CLP and SW-
846 Method 8010/8020). Soil samples were shipped within 24 hours to Martel Laboratory Services
100134 GERAGHTY & MILLER, INC.

APPENDIX B -4-
of Baltimore, Maryland, following strict chain-of-custody procedures. Results of soil chemical
analyses are discussed in the Work Plan text.
Well Installation
Six, two-inch diameter monitoring wells (TW-series) and three, four-inch diameter recovery
wells (RW-series) were installed in the boreholes located along the perimeter of the spill
containment/northern tank farm area (Figure 20). The TW-series monitoring wells were constructed
using 2-inch-diameter schedule 40 PVC casing with a 20 slot PVC screen. The RW-series wells were
constructed using 4-inch-diameter stainless steel riser and continuous-slot, stainless steel screen,
individual wells were equipped with not more than 20 feet of machine-slotted well screen. All
screen-to-casing and casing-to-casing joints were made with flush-threaded couplings. No
cementing compounds were used in well construction. Details of well installation are given on well
construction logs located in Appendix C.
After setting the well assemblies into the inner bore of the augers, the auger string was slowly
withdrawn in short increments to about 4 feet above the top of the well screen. Gradual withdrawal
of the auger string permitted natural formation collapse around the well screen. The height of
formation collapse was measured at each increment of auger withdrawal with a weighted steel tape,
and clean silica gravel was added to supplement the formation pack, where necessary (see well
construction logs in Appendix C). Upon completion of the gravel-packing operation, the augers were
filled with a thick bentonite slurry using a down-hole tremie pipe. Drilling tools were slowly
removed to allow downward flow of bentonite, filling the remaining annular space and sealing
borehole walls. The uppermost five feet of borehole was filled with concrete and a five-foot-long
Iockable steel protective cover was set over the well head. Stainless steel recovery wells were
completed with flush-mounted valve boxes.
GERAGHTY & MILLER, INC. 100135

APPENDIX B -5-
Borehole AS-AH-1 was abandoned upon completion of drilling by filling the auger bore with
thick bentonite slurry as the augers were withdrawn.
Well Development Procedures
Monitoring wells were developed in the weeks following installation to minimize the effects
of drilling on aquifer performance. Well development removes fine sediment from the formation
pack surrounding the well screen, thus promoting uninhibited groundwater flow into the well.
Development also enables a more accurate assessment of groundwater geochemistry.
Development of tank farm monitoring wells was accomplished by using a combination of
hand bailing and/or prolonged pumping with a manually-operated cylinder pump. A stainless steel
bailer was used to first remove five to ten gallons of water from each well. Wells were then pumped
until the evacuated water was relatively free of turbidity. Generally, it was necessary to remove 100
to 200 gallons of water to reach an acceptable level of turbidity.
Four-inch diameter recovery wells were developed through pumping with a submersible
pump. Each well was pumped until the pump discharge was relatively free of turbidity. Well
development was facilitated by the repeated raising and lowering of the pump (i.e., surging) within
the well and repeated starting/stopping of the pump. Well development records are presented on well
construction logs in Appendix C.
Hand-Aucer Borings
Eleven hand-auger borings were advanced into affected soil materials at the approximate
locations shown on Figure 21. A hand-operated bucket auger equipped with a three-inch diameter
by six inch-long stainless steel collection barrel was used to bore from 2.5 to 9.5 feet into acid-
100136
GERAGHTY & MILLER, INC.

APPENDIX B -6-
affected within the spill containment area . Soil samples were collected from each boring and
described for visually definable characteristics (see boring logs in Appendix C). Upon completion
of each borehole, the bucket auger was thoroughly washed with laboratory-grade detergent and
rinsed with distilled water until free of any remaining soil.
Samples collected from hand-auger borings were submitted to LCP's laboratory for
determination of sulfuric acid concentration. Selected samples were submitted to Martel
Laboratories, Inc. of Baltimore, MD for volatile organics analyses (SW-846 Method 8240). Upon
collection, soils was removed from the bucket auger, placed into a stainless steel bowl, and
thoroughly mixed. Samples to be analyzed for sulfuric acid content were placed into pint-size glass
jars with tight fitting lids, and forwarded to the LCP laboratory for analysis. Samples intended for
VOC analysis were placed into 40 mL glass vials equipped with teflon-lined lids (standard VOC vials)
and placed into an iced cooler. Each vial was completely filled with soil so as to avoid the creation
of an air pocket, i.e., headspace, between the soil sample and teflon septum. All sample handling
equipment was thoroughly washed (laboratory-grade detergent) and rinsed (multiple distilled water
rinses) between each sample. Standard Geraghty & Miller chain of custody procedures were followed
during the shipping of soil samples (see Appendix D).
Ground-Water Sampling
Ground-water sampling has been conducted in the northern tank farm since late July, 1989.
Field parameters such as pH, specific conductance, and temperature have been monitored since well
installation (see Table 19). A more comprehensive sampling program involving the TW-series wells
was conducted in the tank farm area during the week of August 21, 1989. (see Appendix C for
Water Sampling Logs). During the August 21 sampling event water samples were collected from
selected TW-series wells and analyzed for volatile organic compounds (EPA method 624), and general
water chemistry parameters. Sample containers were obtained directly from the contracted analytical
GERAGHTY & MILLER, INC. 100137

APPENDIX B -7-
firm, Martel Laboratories, Inc. of Baltimore, MD. All ground-water sampling and handling
procedures were conducted in accordance with standard Geraghty & Miller protocols described in
Appendix D.
Prior to sampling, a complete round of water-level measurements were collected from the
monitoring wells. Water levels were measured using an electronic measuring tape (m-scope) that was
rinsed with distilled water between each well. Water level measurements were used in conjunction
with total well depth to calculate volumes of standing water within the wells. Wells selected for _ TM
sampling were purged of three times the volume of standing water using a Teflon or stainless steel
bailer. Wells were then allowed to recover for several minutes and a water sample was collected for
measurement of field parameters (temperature, specific conductivity, and pH). All data were
recorded on Water Sampling Logs (see Appendix C). Sample containers were then filled for volatile
organic compounds (VOCs). Sample containers were correspondingly labelled with the well number,
date, time, samplers, and parameters of interest. Samples were immediately placed on ice after
collection. Sampling bailers (Teflon,™ or stainless steel) were thoroughly cleansed between wells with
laboratory-grade detergent and rinsed with distilled water to prevent cross-contamination.
Samples were promptly delivered within 24 hours to Martel Laboratories Inc. of Baltimore,
MD following standard Chain-of-Custody protocols. Chain-of-Custody forms are included in
Appendix E, along with the original laboratory reports.
Soil Gas Survey
On September 21st, a limited soil vapor survey was conducted within the northern tank
farm. Soil vapor samples were collected from within the spill containment area at the locations
shown on Figure B-1. The purpose of this survey was to qualitatively identify organic compounds
100138 GERAGHTY & MILLER, INC.

4T< On
GERAGHTY & MILLER. INC.
T. R A T V A S K Y
T. R A T V A S K Y
P A 0 0 4 O S
I / I S / B O
L C P C H E M I C A L S - W E S T V I R G I N I A , I N C .
M O U N D S V I L L E W E S T V I R G I N I A
© T W - I <nw- i>
L £ 6 £ N D
2 - I N C H - D I A M E T E R M O N I T O R I N G W E L L W I T H I D E N T I F I C A T I O N N U M B E R F O R M E R I D E N T I F I C A T I O N N U M B E R
3 R W - I 4 - I N C H - D I A M E T E R R E C O V E R Y W E L L
O S O I L - O A S S A M P L I N G L O C A T I O N
+ D M S S A M P L I N G P O I N T A T S A M P L I N G
L O C A T I O N
S C A L E
o o
A C C E S S ( D I R T ) R O A O
T W - 4 _ / • ( R W - 4 ) ' 3 ' / /
/ / /
/ / / / / /
/
R W - I ( 3 ( R W - 3 )
RW - 3
( R W - 7)
o
- X X X X -
CO CO
32A.B.C
9
A P P R O X I M A T E L O C A T I O N S OF SOIL VAPOR S A M P L I N G STAT IONS IN THE T A N K 0 0 2 C O N T A I N M E N T A R E A
FIGURF.
B-I

APPENDIX B -8-
which may be present in the acid-affected soils. Soil vapor samples were collected at eight locations
within the tank berm (see Figure B-l).
The soil gas sampling system consisted of a drive rod, a soil-gas sampler, and gas sample
containers. The drive rod is comprised of a 10 pound slide hammer connected to a 5/8-inch
diameter solid steel rod. The steel drive rod was used to create a hole from which the soil gas sample
was extracted. The soil-gas sampler consisted of a hollow stainless steel rod approximately 5 feet
long through which 1/8-inch stainless steel tubing was machine-fitted. The lower foot of the 1/8-
inch tubing is perforated to allow the entry of soil gases into the probe. The upper end of the probe
is attached via a stainless steel "T" valve to a 250 milliliter glass/teflon magnum syringe (Dynatech
Precision Sampling Corp.). The magnum syringe is used for collection of the soil-gas sample and to
fill the evacuated sample containers. The sampling probe is also fitted with a flexible butylene collar
in order to provide an air-tight surface seal. All sampling equipment was decontaminated and
purged prior to field work.
The gas sample containers consisted of 40 ml and 125 ml glass containers (or equivalent)
which have been fitted with teflon-faced silicon rubber or isobutylene septa and silica gel absorption
tubes. All 125 ml and 40 mL containers were baked in an oven set to at least 120° C, allowed to
cool, then evacuated to a vacuum of about 27 inches of mercury prior to use.
Background concentrations of plant-related organic compounds in the atmosphere at the
northern tank farm were determined prior to collection of soil vapor samples. Results of this air
blank were compared to concentrations of plant-related organic compounds in the soil vapor samples.
An air blank was also collected after collection of the final sample and field-cleaning of the sampling
device. Resultant contamination concentration data were used to assess the effectiveness of gas-
sampler purging between locations. The gas chromatograph and associated analytical equipment were
calibrated according to the analytical laboratories protocols.
GERAGHTY & MILLER, INC. 100140

APPENDIX B -9-
At each soil-gas sample station (see Figure B-l), a steel rod was driven to the desired
sampling depth (approximately 3 feet) and then removed, thus creating a hole into which the
sampling probe was inserted. Immediately upon removal of the drive rod, the soil-gas sampler was
placed into the hole, making sure that the flexible collar was wedged between the probe and ground
surface. 100 ml of soil gas was drawn through the probe into the magnum syringe and expelled
through the T-valve in order to purge the soil-gas sampler of atmospheric air. Following evacuation,
a representative soil-gas sample was collected at a locality. This sample was injected into an
evacuated glass sample bottle via the magnum syringe. The syringe was then promptly removed from
the teflon septum of the sample bottle. The glass bottles were pressurized to approximately 7 psi
with the gas sample, thus preventing dilution or contamination by outside sources. All sample
containers were labelled and placed in an iced cooler for subsequent transport to the contract
laboratory. The soil-gas probe was thoroughly decontaminated by purging the device a minimum
of 10 times and heating the sampling tube with a torch between sample localities.
Soil vapor samples were hand-delivered to Microseeps, Ltd. for analysis of methanol,
methylene chloride, chloroform, carbon tetrachloride, trichloroethylene, tetrachloroethylene,
methane, and other C4 to C8 hydrocarbons. Pennrun Laboratory was contracted for analysis of
dimethyl sulfate (4 samples). Soil vapor samples to be analyzed for dimethyl sulfate were collected
by passing eight liters of soil atmosphere collected from four sample probes (2 liters per probe hole)
through a single silica gel collection tube. The sample tube was then capped, labelled, and placed
in an iced cooler for transport to the laboratory. This sample collection procedure was employed at
four locations within the tank berm (see Figure B-l). Soil-gas concentrations were reported as
relative response in parts per million. Results of the analyses are given in Appendix E.
GERAGHTY & MILLER, INC.
100141

APPENDIX C
GERAGHTY & MILLER, INC. FIELD LOGS
APPENDIX C - l SOIL BORING LOGS FOR WELLS AS-AH-1, TW-1, TW-2, TW-5, TW-6, RW-1 AND RW-2
APPENDIX C-2 WELL CONSTRUCTION LOGS FOR TANK FARM MONITORING AND
RECOVERY WELLS
APPENDIX C-3 SOIL BORING LOGS FOR HAND-AUGER BORINGS
APPENDIX C-4 WATER SAMPLING LOGS FOR THE AUGUST 21, 1989 NORTHERN TANK FARM MONITORING WELL SAMPLING EVENT
GERAGHTY & MILLER, INC. 100142

APPENDIX C - l
SOIL BORING LOGS FOR WELLS AS-AH-1, TW-1, TW-2, TW-5, TW-6, RW-1 AND RW-2
GERAGHTY & MILLER, INC. 1G0143

^ G E R A G H T Y MILLER, INC.
*\WEnvironmental Services S A M P L E / C O R E L O G
Bchnng/WelU^^HJ—Project/No. LCP -PflOOVOSr
Ligation A c i d S p i l l A r e a . ;
Type of Sample/ . Total Depth Drilled 3.Q feet Hole Diameter __o___Jnches Coring Device a/Jfifc ^poon Length and Diameter ,/ „ . of Coring Device 2«/ * 2 . , : Sampling Interval £Q*+MI/OI/< _feet
_ _ Page____L_ of 2 , Drilling Drilling Starter) ig/f/s-g S HI Completed )Qfc/s-q ibio
Land-Surface Elev_ Jeet • Surveyed • Estimated Datura.
Drilling Ruid Used . tJone. .Drilling Method //.St ft. Drilling Contra Prepared nnntrarrnf VPMAOL.. Qtll/lKej Co. .Drilled! Hftlpar &Oij
By 7T lCa<t\AAjs\ctj Hammer — Hammer
.Weight I H O * Drop 3 0 inches
Sample/Core Depth Time/Hydraulic fleet below land surface) Core Pressure or
Recovery Blows per 6 From lb (feet) inches Sample/Core Description
<7.3L to
2.Q
40
H,0 1.1 Si 1X0. H'-Uo
A/-3-3 14: tooo*
fnfa4-
I — — 7
(//>scf ptsiK-f-j f r / d a i L / i j •fi/fru^ dafl<: hr/yeotoj L4*/iS<4-
^ f ^lo^SisfJL n~ au^eS faring t. pff*-l
/.3 fifoo
SGOHJL -A*-r ~^eA. (ejotb')} JL (ttffC\
10.0 - . IXO
gs.- O-IO •.-7(000 rrjy^leA j G-rase,l ft'** Cltf*) ^^7<4- uy)-tU le**^
1L
G&M Form 03 6-86

^•^GERAGHTY Sf&MILLER, INC •VGround- Water Consultants
SAMPLE/CORE LOG (Cont.d) Boring/Well4£^«J± P a g e _ _ ^ _ _ of ^
Prepared By.
Sample/Core Depth Time/Hydraulic (feet below tend surface) Core Pressure or
Recovery Blows per 6 From lb (feet) inches Sample/Core Description
I2.Q LMiO_ L3L
<DCLkA/Q^CntA-co. (efts') t<^nx^i} -f,*j-t*rJ^ rhr**4.i r/Ui-cla*
fe?JL~U/'0Ut">y f q M ' j HACAHJZA pl4-3
£.*u.1»«,J>~ faffs") t^Jbuj.^roLA^s «sHk f^ra,^ n*/f- rtA-
*hM*
lf-,0 QJD-
mcL 1Q.O SrA**£. pU' f-le —
*/:>,<*><?
GSM Form 04 &*6 100145 Soufllprirt. 87-1719

^GERAGHTY MILLER, INC.
Ground-Water Consultants SAMPLE/CORE LOG Ground- Water Consultants S A M P L E / C O l
Bor ing /WdLTV i / Project/Na L C p I P A C H l K w l Q l
Site . . Dri
. Page / Of L
Drilling Drilling <=!tartpH,oio./i»,-7/i/5w Completed w o o * » \ 7/i/fr<V
Type of Sample/ - . . _ Total Depth Drilled feet Hole Diameter _££2 inches Coring Device 5 pi it ->paan
Length and Diameter // « of Coring Device 2. Q IDJL—3Tt<y» ig
Land-Surface Elev :
Drilling Ruid Used time*.
Jeet • Surveyed • Estimated
.Sampling Interval
Datum
Jeet
Drilling . . _
Prepared 9 » 1 / / By ftQ-fctfag/cy /Lr.uJiS
.Drilling M g t h n r l ^ V e ^
nrill^rg.7/ AfcA .Helper. Hammer Hammer
.Weight //1 Drop 3Q. inches
Sample/Core Depth Time/HyAauHc (feet beta* land turface) Core Preasureor
Recovery Btowsper6 From lb (feet) Inches Sample/Core Description OVA
QJZ. in. L5_
W ^ -~eA r*n*f*\ < / / t f c / A j f a v . ' i *f r*^f (h,s+Jii»»*t) O.6
10,0 ULS-
lf.0 Qi2L 5*«rl^ £**~rn. (*ol*)t -Pi^eo. *y*sd f*4r*/c\ t>>h*«ylAS}
t.htU-€/tffte.€ t./tf Cr/*y j la/a*,* s^fy hLdcctmh^r
ZixSL
tin/cl**], hfwit*&jT
13. C/u*cl Art.-*!.-. (VP''*'); <^>«<£ -A^-r^.£Co'f<0—iiti+Ga^ Oft*)t
Wo. a JiSL 7-9-J3
OJOffhvx
frO IS. Set****
He.*
CtXM Form m fvflfi im 87-1718
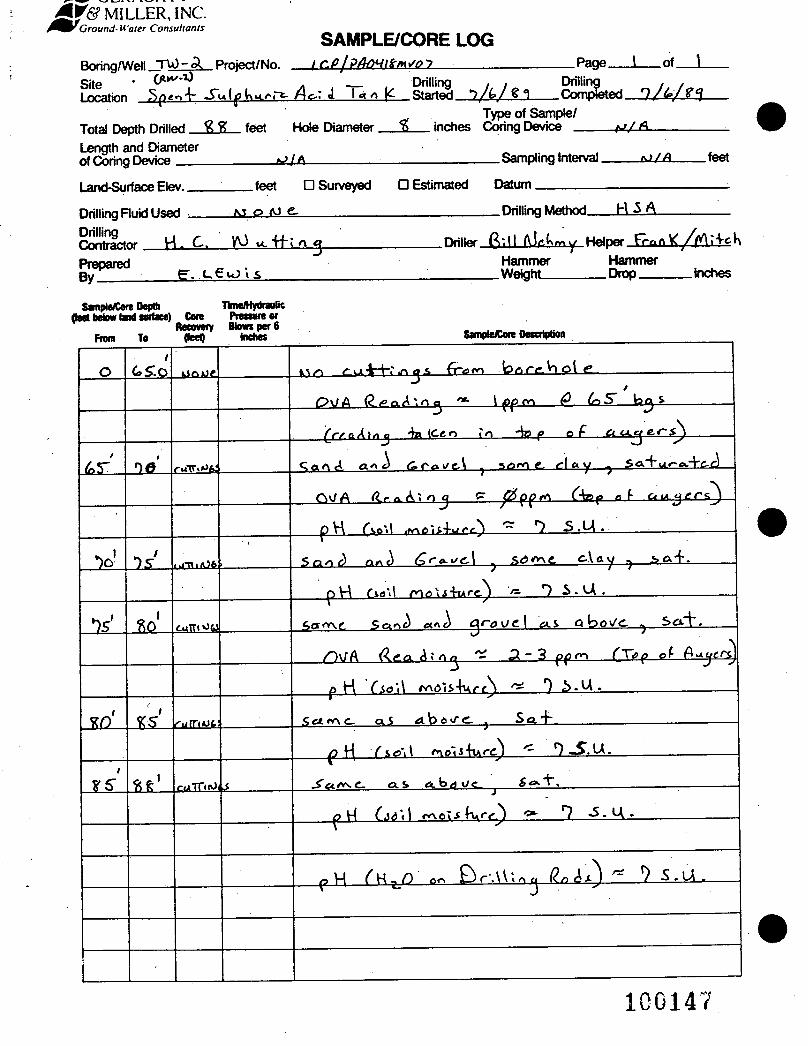
MILLER, INC A^mV Ground-Water Consultants
SAMPLE/CORE LOG Boring/Well TVO-A Project/No. / r.Pf PAomtmso-? .Page 1 of L Site ' A , Drilling , , Drilling . , Location Sp««» 4- S<*ip /U: 1 K Started *>/U £ 1 Completed l/t>/Zej
Type of Sample/ Total Depth Drilled ft ft feet Hole Diameter *6 inches Coring Device uJ-A Length and Diameter of Coring Device
.feet •Surveyed • Estimated Datum
.Sampling Interval. * J / A feftt
Land-Surface Etev
Drilling Ruid Used i_ Drilling • . . Contractor VI- yv> n. TT* * «j Prepared Ry g . . U € l O t &
. Drilling M thnri H 3 A
fVillpr ft-.|l l \ I a L y Helper r>Qft K / V l l l c K
Hammer .Weight.
Hammer Drop inches
Sample/Core Depth Time/Hydraulic fleet below land surface) Core Pressure or
Recovery Blows per 6 From To (feet) inches Sample/Core Description
C5T.O a.-y-t-.'- 6-g.fy, A?nCC^ Ole-
1 ^
( V / a / l i * . 'ta IC&o Lo -fo p c j £ ft < i g e * - ^
451 raTT.»>fc SAT ULr-aAcel
50-
rv /A ft^Aioj g ^ffpprt—(4??p a f ftujgrs^
£ q r v \ g . Sct«-»^ «^<y <3r~oi>el o b o v / C - -
151
c j A j I i e J i i i Sc4.cr^c <a S» Ab<jue_ £o>.4".
100147

^GERAGHTY MILLER, INC.
v~\wr Ground-Water Consultants SAMPLE/CORE LOG
RnringAAfell rVtZ-fT Project/Na LOP PAOHlXtoVQ-T
Site _ . , Drilling
Page I rrf ~o\
L I iy , , Drilling . . Started J2/3/£5 Completed i/^jS^i one . - . /
Type of Sample/ . Total Depth Drilled *7Q feet Hole Diameter __fi__inches Coring Device >p!iLZ>pn0i Length and Diameter • . / • , . of Coring Device I*/ 2. „ . P _ Sampling Interval Ma^ftb/fi feet
Land-Surface Elev
Drilling Fluid Used A/(?ne,—
Contractor
Jeet • Surveyed • Estimated Datum.
.Drilling Method lijllpiJ<~>h« At*]
. nriiiftr U /J fJ tM^ Helper.
Prepared - /~> / / By A /tefonjkj
Hammer Hammer .Weight H O Drop 3o inches
Sample/Cere Depth Ttae/Hyorautic fleet beta* tend surface) Core Pressure or
Recovery Btowsper6 From lb (feet) Inches Sample/Core fescrtption
XL.
13
2 . 0 Q\/A zn.o If.
i^&llpujisL -lort>u/t\ M+*,~r-/- w.l.^ 4/> prf-1 0t/iii4 aAhrtft
/ 7
2-"2- /^i?-fg-/y
2 ? 1 Z
22^ 0,€
ujcii^ lefpp*
GAM Form 03 6-86 10G148 87-1718

Jm£f& MILLER, INC. •ifierGround- Water Consultants
Boring/Well JW-S
Prepared By (I^TI/LAI'
SAMPLE/CORE LOG (Cont.d)
Page. of "31
Sample/Core Oepth rune/Hydraulic (feet below land surface) Core Pressure or
Recovery Blows per 6 From To (feet) Inches Sample/Core Description
to 1,3 Sand -fine-ce>. (6C/U") £saril
ItVl—htocC u7£{ct+y. bU/ik^tj-, />fV»7.?V Qy4*l(i*~ft\m <*mf(r.
Slack 32A- i"U rfuJnlrn
1QG149

V Ground-Water Consultants _ . _ _ _ _ _ _ _ . _ _
SAMPLE/CORE LOG Rnring/WPii W - b Proiect/No. f f t O O S O ? Site , Drilling .
. Page 1 of 3
Drilling . . c Drilling _ . . h l 3 l 8 e i nompifitfid 8 / 3
Type of Sample/ Total Depth Drilled feet Hole Diameter Q. Lenath and Diameter _ > "
S l t e l -.1 . . w Location M o n n d s v ' l l r
Length and Diameter » of Coring Device ^=—A ^
Type of Sample/ .inches Coring Device , f?P»'T s p o o "
Sampling Interval & ;
• Estimated Datum. v« w n i i i y ——=
Land-SurfaceElev. C C o . 25feet • Surveyed
Drilling Fluid Used . Drilling Method
Contractor Pt*r\sv Dr:n;n 5 Co. Driller Be™ie
feet
Sample/Core Depth rme/Hydradtc fleet below bod surface) Core Pressure of
Recovery Stowsper6 From To fleet) laches
O . O
10 .0
'6.0
2Q
1 2 . 0
2 0 . 0
ZS-o
zz.o
/ . 6
2.o
hi. Hi) His
1.7
1.3 V/g/s/»
Hammer ,, , „ < Hammer _ Weight / V P Drop 3 Q Inches
Sample/Core Oescriptioa <wA
.1 ~ "fcp so i l ( Sonet c c U y ^ 'truce ^tvCll
r*-ȣ J b r o w n
lQO?c V. frne/ f tnf 5<=>ne( w e *» Sdf-rCt* /oosc
r»->6 <j browQry c^ ry
• V - <t « < • « > / b U . c f c ' ' ^ r » « f e r i a l
S . * . . c > r « i » ^ ' . rvy ! J *><~QwO, p o o r l y &Q<"
OPf"~
'Off'
loose
I « ZO -^5"/.
* v _ L
- <?J. d Q ^ P <tf b o f r o r ^ o4- 5 f °oo A p o o / l y
Sor" fec i . ^ a d cJCnsf
P o e r l / S o r t e d . ™ec/ k>r*ovQh /»>o <J d ( n s r ^»o«*st
d r y p o o r l y S"artCof
8? ,% -o ,
l p p ~
5 s**"*
/0 f P M
100150

^GERAGHTY Sf&MILLER, INC.
f-XW Ground- Water Consultants
SAMPLE/CORE LOG (Cont.d)
p^ringAA/pll TU / ' f c
Prepared Ry S R. >^ser
Page__2__ of 3
Sample/Core Depth Tfane/HydrauQc (feet below land surtace) Core Pressure or
Recovery Blows per 6 From To fleet) Inches S*mpWCore Description 6Uft ,
3o.o 3 Z - Q /•Co 7* f - rnf d y Sgncf • SO-<i>6 ft. frnP - * W . z.;>pr
8 * * Ofi w. g, c,rgN/el • prtnriy Sorted m o d dense. drf
\ fPtc . 2 - rr%td zrcoy . r u k i ? - mfd b « - o ^ , cf<y.
roq-fcriqi in fiPoon s e i n e d
3S.Q Hihshslis 5"S?» W.F>, g r a ^ l - Sqod ; macf
d f r t s f ; p o o r l y S o r t e d g f r y ™<»d b r o v ^ n //('•c.roy,
VO.O HZ.C l-O
fr<tcf bKck Carbon\(t<e\xS l«Kf mgf •
r>\oa dCosc rnCd bro^g . /^n ru^y Krdwrv
«/7.o
<o" ft*
5o.o 52.0 l .O
oc or rCtv 1 .Sf^vtl, wt-II Sorted
-V 7 ~ feO-?!^., »>t.d-course s.t. 3«-a>tJ; zo-ie>70
A'n<-m€d / s.ft j-««\a JI r ect fir^, brown.
>»d s o r t e d , we)-
G&M FormW 6-66 Southprirt 87-1719
100151

^GERAGHTY A t e MILLER, INC. ^cZund-Water Consultants
SAMPLE/CORE LOG (Cont.d)
Boring/WelL-
Prepared By.
„ Time/Hydraulic SampteTCoreOep* Pressure or
(feet below land surface) ( W ^ y Bo perB
From To <"U.
Samp»eK reOesc*tioo_
7* Aoi^-I^i .dci.
Page.

S f & MILLER, INC. t^mr Ground- Water Consultants
Boring/Well flu) - I Project/No.
Site
SAMPLE/CORE LOG Page I of SL.
bite v V _ Drilling . . Drilling Location V J p k u ^ - c flc.'d Ta/» < Started l / i / R H Completed—
Type of Sample/ Total Depth Drilled H S" feet Hole Diameter I 3- inches Coring Device .
Length and Diameter of Coring Device : — f ° _
.Sampling Interval. .feet
Land-Surface Elev.
Drilling Ruid Used Drilling Contractor
.feet •Surveyed •Estimated Datum
.Drilling Method. U S A
Prepared By ET. L e T u J U S
.Driller fe'.U fcleKmy Hfllper F r ^ W ^ / r O T - V ^
Hammer Hammer Weight Drop inches
Sample/Cora Depth Time/Hydraulic fleet below land surface) Core Pressure or
Recovery Blows per 6 From To fleet) Inches Sample/Core Description
b r o u r i ^ \ f l L y / » y i l H " u jT-rK r a e k U g r ^ m o i s t "
10 U r a ^ f t c U y * y Sr t - t - f t f t C g r p . y d ^ f A . o r f 1 ~
OVft rg<x.<itrt^ Off>™ (Top of-
p H frail *Aorj+tAre) U 5>U.
Ov/A- reading - n pprr, Cfrp pf ^v-J^-i)
p hi (.so? I r»\<? ns4u.rc^ ^ S . u
i> /A r ^o^TV io ~ .5~p^oiv\ rji»p o*~ j < ^
C>4fT*M
| g s » r U ^ *Hvo,>\ febo^e^
H CfoC\ w C ? V - Ct> S .
O V f t rg«»-d>*\j - <3-° - 3 o pp ^ (tap of- ft«.jtr)
CXne. - C o « r ; e c-o.i/e-1 T ; SO< \ g, c l a y ^ .So.-K
f H -.1 ^>rWe.) ~- 0 S.U. .
100153

^•^GERAGHTY MILLER, INC.
'Ground- Water Consultants
Rnrinn/Wsll R u J - /_
Prepared Ry /T. Cts~oO IS
SAMPLE/CORE LOG (Cont.d) Page__<2 of
Sample/Core Depth Time/Hydraulic fleet beta land surface) Core Pressure or
Recovery Blows per 6 From lb (feet) Inches Sample/Core Description
3s? HO S a m e . <^r-A\ff.\ & s n k f w r ^ —
•W.r- l e v e l <o ^ 3.q ?•(-• b ^ * Lo fijA^.
G&M Form 04 &86
lerjrs?

Page I of
. ' G b R A C i H 1 Y M I L L E R , I N C
Ground- Water Consultants
SAMPLE/CORE LOG Boring/Well ft Uj - 1. Project/No. f°A OM^ t* V O 1
Site C K ^ O Drilling . , Drilling Location &p«- * * I p h ^ r r c A-cC A T a ^ K Started 7 / 7 / 8 1 Completed r ) / l / ' B 1
Type of Sample/ Total Depth Drilled ^s-* feet Hole Diameter inches Coring Device tJ/A. Length and Diameter of Coring Device t^ih Sampling Interval * iZA feet
Land-Surface Elev.. .feet •Surveyed •Estimated Datum
Drilling Fluid Used Drilling Contractor Prepared B y -
. Drilling M e t h o d _ t L £ A
nrillPT Helper P r e ^ K / r V \ ; 4 c K
Hammer Hammer Weight Drop inches
Sample/Core Deptti Time/Hydraufic fleet below tend surface) Core Pressure or
Recovery Blows per 6 From To (feet) Inches Sample/Core Description
5" <:UTT:A.
J O
•<V.-jk4- k r o ^ J f t 6.4 r? R-. bg.S
<;A<W<. L ' ^K4 V>r«^»n c \ & y « » y t i (4/ ^—<v\o i ^ t~
p H ( i t>\\ ^ r f U ^ A <= 0 S - H . :
(••hip oF a ^ ^ t ^ j )
•tan
O V A c e ^ o * ' ^ d t o p o f c ^ j e r ; ^
3 5 v . r*\oi s T
fly* A r - e a j ' - N j
2o_
^ 0 . c«*rrtA<
3 * c*Trrft«
100155
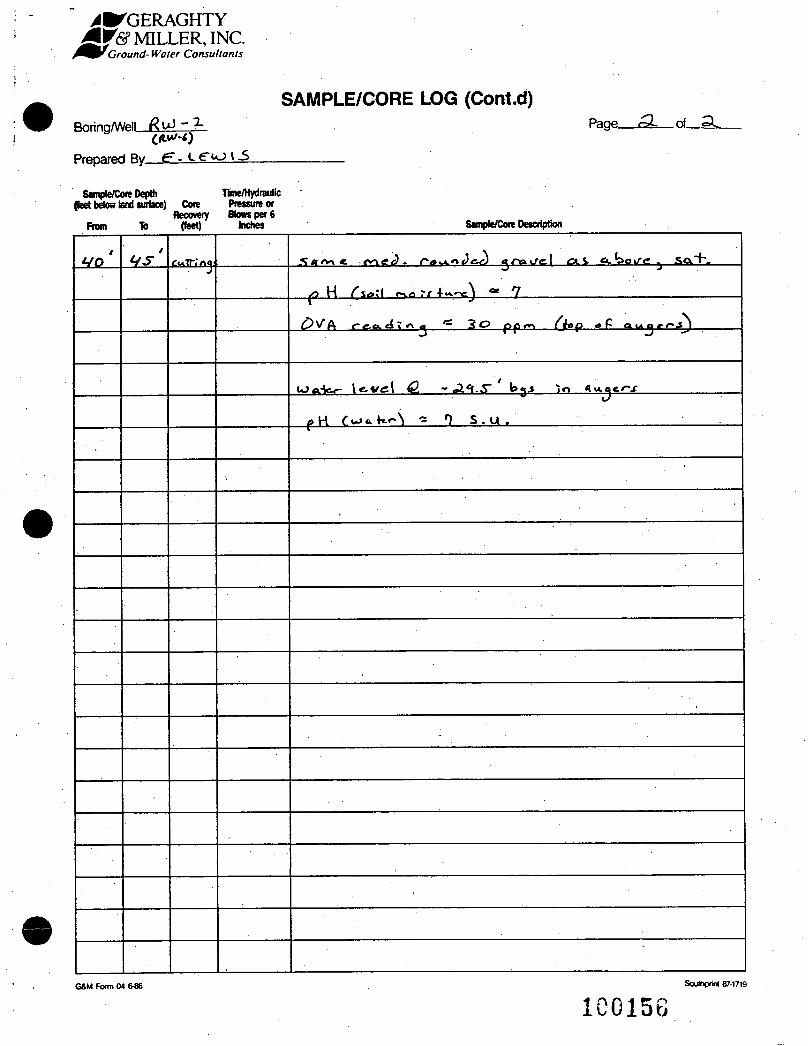
^ kfcfGERAGHTY f& MILLER, INC.
Ground- Water Consultants
SAMPLE/CORE LOG (Cont.d) RnringAA/PlI # U > - 3 -
Prepared By f -1 * -S
Sample/Core Depth Time/Hydraulic ((set below tend surface) Core Pressure or
Recovery Blows per 6 From lb (feet) Inches
Page Q~ of 3 ^
Sample/Core Description
WO US. S a r v ^ *_ « v \ e i j . gna. t /g( «a.boi/g ^ so .~K
G&M Form 04 6-86
100156 Southprtnt 871719

APPENDIX C-2
WELL CONSTRUCTION LOGS FOR TANK FARM MONITORING AND RECOVERY WELLS
GERAGHTY & MILLER, INC. 10G15T

^GERAGHTY f& MILLER, INC.
Environmental Services WELL CONSTRUCTION LOG (UNCONSOLIDATED)
inch diameter
• slurry B pellets
Well Screen. inch diameter
rVc , z o slot
Gravel Pack Sand Pack Formation Collapse
ft*
Measuring Point is Top of Well Casing Unless Otherwise Noted.
'Depth Below Land Surface
Project LCP- i*»k f*f~\ Well TW-I Czw-O
Tnwn/P.ity fr\oujv4ii/tlle.
County Marshall Sta te M / V
Permit No.
Land-Surface Elevation
and Datum fesa.^ feet
fe^.qi -no.r .
Installation Date(s) 7-/-y>
JH Surveyed
• Estimated
Drilling Method rhthus S f e ^ A ^ g A -
Drilling Contractor U.C, rJo-ktmj
Drilling Fluid fJone.
Development Technique(s) and Date{s)
Fluid Loss During Drilling fJorir
Water Removed During Devetopmeni Static Depth to Water — 33 -n f-vtfr-ra)
Pumping Depth to Water
Pumping Duration —s
Yield — gpm
Specific Capacity r r
gallons
gallons
.feet below M.P.
.feet below M.P.
hours Date.
gpm/ft
Well Purpose rY\r>^;ir>r,nrj Wf\\
R e m a r k s / C f e . l o i t e r <rr* ieA (fit/r ') < * > + a ± ( J l . t - i - C t . h . c . L
FormacLr**, col lnp^-to 1841. gravelpaeJc-La 2 V . ^ .
Prepared by /, /?a
G&M Form 05 12-88 Southprint 89-0978

^ • ^ G E R A G H T Y & M I X E R , INC.
Environmental Services CONSTRUCTION LOG (UNCONSOLIDATED)
T 23/ft
. 1 LANO SURFACE
P r ^ —
drilled hole .inch diameter
Well casing, inch diameter,
Pv c
Backfill GrOUt /kn^Onl lg
.ft*
Bentonite IS slurry . f g ft* • pellets
; H..£_n* Well Screen.
X inch diameter _ f v c _ , . O l O slot
Gravel Pack Sand Pack Formation Collapse
8 z . g ft*
Sfr ft'
Measuring Point is Top of Well Casing Unless Otherwise Noted.
'Depth Below Land Surface
Project /cP-T^kEy/-*. .Well -ruJ - a <W-2)
rVuinty W \ » ^.i k » V\ Staff) W v/
Permit No. _ Land-Surface Elevation
and Datum 65 . '3, feet TTQ. c.
InstallationDate(s) 7 ,A» / f fq
Drilling Method H S A
B Surveyed
• Estimated
Drilling Contractor _
Drilling Fluid KJO K) g
Development Technique(s) and Date(s)
C y l i n d e r Pi/m*p ( 8 a . l l . * j .—_
Fluid Loss During Drilling ISQ-
Water Ftemoved During Development—222*.
Static Depth to Water 33.*/fe CHii/ri)
Pumping Depth to Water r=—
Pumping Duration . — hours
Yield • — • gpm
Specific Capacity = gpm/ft
WellPutpn— W > r ; n a — u J ^ U
gallons
gallons
.feet below M.P.
.feet below M.P.
Date.
Romany* DtV P4. . A 7^> .jCfiggVO frpey
*5
A)errg: u i f o « ^ O O « f- H-^O—:£&_
3 b g i
Prepared by
G&M Form 05 12-88 100158 Southprint 89-0978

-^GERAGHTY '& MILLER, INC.
Environmental Services WELL CONSTRUCTION LOG (UNCONSOLIDATED)
V / / / / / / / / / / /
T w z f t
I LAND SURFACE
7 /
8 inch diameter / drilled hole /
/ J ^ W e l l casing, / 3. inch diameter, / P/C Zck no
' O Backfill / S Grout / W / . . ^ «
/
^ ae ft*
Bentonite • slurry ? i ft* *K pellets
Well Screen. ^ inch diameter
rVC , / P slnt
Gravel Pack Sand Pack Formation Collapse
_ i ( 2 j _ft*
_i#.<?_ft*
Measuring Point is Top of Well Casing Unless Otherwise Noted.
'Depth Below Land Surface
Project LCP- Fnr*\
Tnmn/rJty NioU*tl<\/\[\r.
won f l u / - 3 )
County MszrsUixll State H A /
Permit No
Land-Surface Elevation
and Datum 653,(TO feet
TTO. C.
Installation Date(s) "7-fr-E<3
B Surveyed
• Estimated
Drilling Method LL/biJ S/e** Aucsvr
Drilling Contractor M.
Drilling Fluid None.
Development Technique(s) and Date(s)
Fluid Loss During Drilling A/^ng.
Water Removed During Development P>Q
Static Depth to Water 32.ftf (7-j«-*<t)
Pumping Depth to Water
Pumping Duration -~
Yield ~ gpm
Specific Capacity —
gallons
gallons
.feet below M.P.
.feet below M.P.
. hours
Date.
.gpm/fl
Well Purpose G-M>u^A*.\A/ti±i* r!*tj
Remarks T^t+U^&doZ io-tM 9*c HI. I -fcdf d^h?
fiftr.k.'ifo 2 ( £ * . _
Prepared by T T ^ a ^ x n ^ / y
G&M Form 05 12-88 100159 ******

^•^GERAGHTY S ¥ & MILLER, INC.
Environmental Services WELL CONSTRUCTION LOG (UNCONSOLIDATED)
7 A /
/
/
/
/
/
/
/
/
/
T l.lfcft
l LAND SURFACE
/
/
/ /
/
A /
drilled hole .inch diameter
-Well casing, a. inch diameter,
P/C : ' a Backfill
/ Q Grout S&ihmi-k*
/
/ 13 .ft*
Bentonite • slurry 15 ft* B peliets
* / 7 ft*
Well Screen. •2. inch diameter TVC , T O Slot
Gravel Pack Sand Pack Formation Collapse
f t '
_3£_ft«
Measuring Point is Top of Well Casing Unless Otherwise Noted.
* Depth Below Land Surface
Project Lt? 1Z«kf*s~ Partition Well TW-H CRw-ij)
To»A/n/rjty MatfnAwflU '•
Cminty M a K U c j ! , S t a t e J a Z ^
Permit No.
Land-Surface Elevation
and Datum 1iU52H feet T.r>.c.
Installation Date(s)
B Surveyed
• Estimated
Drilling Method UAIIOM
Drilling Contractor t-f-C- Mu-ti-iitcj
Drilling Fluid A/p*e ; .
Development Technique(s) and Date(s)
Fluid Loss During Drilling N/QUO
Water Removed During Development _15£L
Static Depth to Water C-rlHrltl)
Pumping Depth to Water —
Pumping Duration ~~ hours
Yield = gpm
, gallons
gallons
.feet below M.P.
.feet below M.P.
Date.
Specific Capacity =: Well PiirpogA Mn«]-rnr:«rj
gpm/ft
Remarks f^f-tre*J+rh*-f <tj\,,~ t ^ a t
Prepared by X/Zar^Lo^fc^.
G&M Form 05 12-88
100160 Soulhpnnt 890978

^•^GERAGHTY & MILLER, INC.
Environmental Services WELL CONSTRUCTION LOG (UNCONSOLIDATED)
7
^ / / / 7 / 7 / / 7
T LWft
1 L A N D SURFACE
— 7
V / / A 7
drilled hole .inch diameter
-Well casing, i inch diameter,
Oi/r <vx Un
II
Q Backfill / S Grout Ao*h>«U^
/
^ a o ft*
Bentonite • slurry 2JL ft* S pellets
TFl-l ft*
Well Screen. ^ inch diameter
eVC , tO slot
Gravel Pack Sand Pack Formation Collapse
L 43-f ft*
_£f2_ft*
Measuring Point is Top of Well Casing Unless Otherwise Noted.
* Depth Below Land Surface
Project LC-P]-~fc»le-G*rm Wall TU/S
State WV
Permit No.
Land-Surface Elevation
and Datum feet
-rn-c.
Installation Date(s) "7-9-g*?
E Surveyed
• Estimated
Drilling Method Mnll*u> g/eWflgj/^
Drilling Contractor l4.C^l0u.ii.'^ C*>.
Drilling Fluid fJanr.
Development Technique(s) and Date(s)
Fluid Loss During Drilling tfffne*
Water Removed During Development—Lfe£L
Static Depth to Water _ l i £ g -("h'ttt-n 1
Pumping Depth to Water n
Pumping Duration — hours
Yield = gpm
Specific Capacity = — _ gpm/ft Well Purpoco M*mUor[«2 G-rou*oL u/nfi^ qitnlrby
gallons
gallons
.feet below M.P.
.feet below M.P.
Date.
Prepared by
GSM Form OS 12-88 100161 SoUhprirt 89-0978

GERAGHTY '& MILLER, INC.
Environmental Services WELL CONSTRUCTION LOG (UNCONSOLIDATED)
7 A 7 / 7 / / / / /
T 2 ^ f t
1 LAND SURFACE PT"^— /
_ Inch diameter / drilled hole / / p - W e l l casing, / 2- Inch diameter, /
' • B a c k f i l l . . . / 0 Grout .bcnlonite slurry
/
^ 3 3 - Q ft*
Bentonite • slurry S S . O ft* SI pellets
S 8 - S S ft'
Well Screen. 2- inch diameter
>oio slot
Gravel Pack Sand Pack Formation Collapse
Measuring Point is Top of Well Casing Unless Otherwise Noted.
'Depth Below Land Surface
Project ULP PhOQHQT-
TnM/n/Pi ty N A ft u r A f . \ j i \ \r ,
.Wel l . TW-b
County _ M a £ « h a J L State \M . \h.
Permit No —
Land-Surface Elevation
and Datum *-g feet
TTO.C
EL Surveyed
• Estimated
InstallationDate(s) 8 /
Drilling Method H ^ A
Drilling Contractor P c A n s y f v W c i p r a t . ' 0 3
Drilling Fluid A / Q * & _
Development Technique(s) and Date(s)
Ruid Loss During Drilling 2 0 0
Water Removed During Development 20>Q
Static Depth to Water 1l 3(o
Pumping Depth to Water
Pumping Duration —
Yield - gpm
Specific Capacity _r.
hours
gpm/ft
Well PurpfVM ^on.'Vormc, . ~t-tW
Remarks.
Prepared by ^ . B • l s ^ < ^ & e r
_ gallons^
gallons %
.feet below M.Ps*|
.feet below M.P?'
Date ~
GSM Form 05 12-88 Souf/Tprirt 89-0978
1C0162

^ • ^ G E R A G H T Y '& M I L L E R , INC.
Environmental Services CONSTRUCTION LOG (UNCONSOLIDATED)
/ 17. / [/] drilled hole
ft i LAND SURFACE
A
I .inch diameter
-Well casing, M inch diameter,
O Backfill / / 63 Grout _
II -ft*
Bentonite B slurry * ' ft* H pellets -w a y '
ays ft*
_ Well Screen. M inch diameter
j+tskii-dtil, ryfr* slot
Gravel Pack Sand Pack Formation Collapse
HM-r ft*
ft*
Measuring Point is Top of Well Casing Unless Otherwise Noted.
'Depth Below Land Surface
P^M OA n*\8 MVO 1
flinty M ^ / K A I I .State.
Permit No.
Land-Surface Elevation
and Datum _6£L2i/
TKC.
Installation Date(s) W ? 1
Drilling Method hLL6
Drilling Contractor _
Drilling Fluid \ J o /o <?
B Surveyed
• Estimated
Development Technique(s) and Date(s)
Fluid Loss During Drilling V / A
Water Removed During Development.
Static Depth to Water _1A£2
Pumping Depth to Water 33 ft/
Pumping Duration io**l«.
Yield _ _ 2 £ . gpm
Specific Capacity MM
Well Purple (ZetLoxter-y
gallons
gallons
.feet below M.P.
.feet below M.P.
J ^ I U U I w
natft 7//fr/fr5
. gpm/ft
L l f l l
s-t-gg.1 t^jfctl j fi>matron—rcUaprfc /Sft^d
Afial - k#» - W , V-C f \ ^f-ry fc> ~ 3 * feg j
Prepared by £ . L e c o i s
G&M Form OS 12-68
1C0163 SoutfTpnrt 89-0978

^•'GERAGHTY £$f& MILLER, INC.
Environmental Services C 0 N S T R U C T | 0 N L Q G
(UNCONSOLIDATED)
/ / / / /
, / / / /
7\ / / / /
/ A /
j . Flask flW* ft
X LAND SURFACE
inch diameter drilled hole
-Well casing, M Inch diameter,
II
' Q Backfill / S Grout ce.me.nt
/ /
ft'
Bentonite _i24» ft*
J4J5_ff
OB slurry * < a * s * B pellets *» 25 4
_ Well Screen. ^ inch diameter
9±*«UXS 6»«vfa,W..H slot
Gravel Pack Sand Pack Formation Collapse
WIS ft*
Measuring Point is Top of Well Casing Unless Otherwise Noted.
* Depth Below Land Surface
Well fcco -"2- Cpw-ti) Town/Tity W » UL^ a S i/I \ 1 <•
County ^ g r a W ^ l l .State__W_vL
Permit No.
Land-Surface Elevation
and Datum &to. feet
T.Q.c.
Installation Date(s) 7 / O / s 1
Drilling Method H .SA
8 Surveyed
• Estimated
Drilling Contractor H.c. tOu.-H-; r\ q
DrillingRuid ^
Development Technique(s) and Date(s)
Ruid Loss During Drilling
Water Removed During Devek>pment_^_
Static Depth to Water 30MS (Hitjvb
.gallons ^
.gallons
. hours
Pumping Depth to Water
Pumping Duration _
Yield gpm
Specific Capacity gpm/ft Well Piirposfl f v ^ c o ^ e ^ y U J e . l l
.feet below M.P.
.feet below M.P.
Date.
RAtnarks /o /Y. if"ff u ot*s y / > / J-f*t*(crs
S4*t / rer-rcn A/ST 3 <T • J t.k- -A>
£ j c j -* / A t . A , ~ l t * r * < L ^ e a / •
Acn-£.*7/tL A - Jl.S- Ayr. WrJl ry>*pUh>A
n< f-lufk -*V>L>»-£^ mj74l\ L * i/a/wfc \oox <r.4-T*+A ^**/Lsntr a p / p * . —
Prepared by
G&M Form OS 12-68
100164 Soutfiprrt 890978

^GERAGHTY MILLER, INC.
Environmental Services WELL CONSTRUCTION LOG (UNCONSOLIDATED)
I
.inch diameter
ft H»skMoo*+-1 LAND SURFACE
/ / drilled hole
< < • / / S-Well casing, / / V inch diameter. / / WiS.t . _ / J O Backfill
h xl Grout ap«-to-?te
rt.S ft*
Bentonite • slurry i n ft* B pellets
3V.« ft*
Well Screen. 4 inch diameter
, slot
Gravel Pack Sand Pack
x) Formation Collapse
44.fi ft-
45.5 ft*
Measuring Point is Top of Well Casing Unless Otherwise Noted.
'Depth Below Land Surface
Project inP-T^kr*'* ?nnm**i\ion Well TW~3 (tot-l)
Town/City M o d e l s J,lie- . ,
County __£lfi£4iwrJl fitate WV
Permit No —
Land-Surface Elevation
and Datum c ^ n D ^ feet
T.O.C : —
Installation Date(s) 7/ft/OT
B Surveyed
• Estimated
Drilling Method ^l»«> Autjrs*
Drilling Contractor H-CNiSttmt}
Drilling Ruid rJn^f
Development Technique(s) and Date(s)
Ruid Loss During Drilling tJone. .gallons
Water Removed During Development.
Static Depth to Water _ 2 U 2 Cr/Hr/W)
Pumping Depth to Water 32.58
Pumping Duration »^
A n m c Art
gallons
.feet below M.P.
.feet betow M.P.
.hours
Yield. 10
Specific Capacity. _ g p m "7.-75"
nate 7-3.2 -f t
gprn/ft
Well PiirpocA Vmrvrtuy U/(B.U
*efee* <:e4-*-t W.f3^- fbmiATe,*, em/cf ^rase.t pack
Prepared by
GSM Form OS 12-68 100163 Souttrpnnt 890978

APPENDIX C-3
SOIL BORING LOGS FOR HAND-AUGER BORINGS
GERAGHTY & MILLER, INC.

^•^GERAGHTY M f & MILLER, INC. c/rnRF I nc
0mfGround-Water Consultants S A M P L E / C O R E L U l a pwing/wpii g-R-l Project/Na linuAf, Tank &e'f*\ . Page I of—L
Nation ^oiAk <>fd.*. a^-kulf. Drilling . . „ Drilling . , natteS 7/l/fr<? Completed l / l / f f
Type of Sample/ Total Depth Drilled __Zi£__Jeet Hole Diameter 3 ^ inches Coring Device BtffikrA. flfejftr"
Land-Surface Elev_ Jeet • Surveyed • Estimated Datum —
Drilling Fluid Used Drilling Contractor ~
.Drifling Method =1
.Driller Z L _Helper_r=_
SamWCore Depth Tkne/HyrJnuSc (betbetasMMtee) _Cow Pmtureor
Atcovcry Bows per 6 From % (feet)
Hammer Hammer .Weight Drop H—inches
Sa^e/CowDMCripBon
2 i £ ^,1 ^'.ll ^ **rji\+'l hot
100167 SooOxxrt 87-1718

^GERAGHTY Mf&MILLER,INC. 0 A M « . r .^nr- . ^
0^Ground-Water Consultants o A M P L t / C O R C L U G
Rnring/Wsll A B - 3 Prpject/Na Z C ? - t~<7J+ 7 Z ~ k . B e r » ,
Site Location
.Page_ .of_J_ Drilling „y A. Drilling ,
.Completed iftJtt Type of Sample/
Total Depth Drilled 4 feet Hole Diameter 5 " l . inches Coring Device _
Length and Diameter of Coring Device . Sampling Interval Jeet
Land-Surface Etev_
Drilling Fluid Used : Drilling Contractor Prepared . , By l<iTtLa<Ly
— foot • Surveyed • Estimated Datum —
.Drilling Method
. Driller — Helper
Hammer Hammer Weight — Dmp inches
Ssnpie/Cora Depth HmMydnuSc fbjtt bekw land wftee) Cora Prawn or
Recovery Bows per 6 From w (Ie6t) Sojnptt/Oora Doocriptton
«••»—- nit, / rj
100168 RAM tom m turn Southonrt 87-1718

^•TGERAGHTY
J S ^ S ^ ^ SAMPLE/CORE LOG pnring/VUpll AU-1 Pfoject/NQ (.Cp- faitJf,'Ta«kfcr>H
Site Location SntAU nf frank
Page / of L Drilling
Type of Sample/ . , . Total Depth Drilled _i i£__Jeet Hole Diameter Yll—inches Coring Device fli/fifevL H s ^ f —
fr&yftSST1" u p Sarong W»val L _ _ J e «
Land-Surface Elev feet • Surveyed • Estimated Datum = :
Drilling Fluid Used Drilling Contractor 1 Prepared
.Drilling Method =_
.Driller. Helper
Semfcftora Depth Ttae/Hydreufic feet beta tad surface) ,Cow Pneeumor
Recovery Blows per 6 From 1) fleet) Inches
Hammer Hammer _i Weight — Drop — inches
SeB*MConDercription
/
SCA*V\ <.f UU'It ra-r. urdi. nA. pfV f(tl*n) , hot
26.
tor&ce. i hot
\ 001 BR
O t M Form ftl (vSfi Soulhrjritt 87-1718

^•TGERAGHTY Sf&MILLER, INC. o * ««. e .rsrmr , rsr*
0mGround-Water Consultants S A M P L k ^ C U F l C L O G
RnrirvjAA^i Project/No. z_rP - Tr,<,U* 7Z»k Rrr~> .Page L of L Site „ . , . , - , Drilling Drilling Location T»*~eJL <iatAL o-P-tr^k Started Completed Iffrffft
Total Depth Drilled_£__Jeet Hole Diameter 3*6. inches Coring rvvioft6 Rocket au^^r Length and Diameter • of Coring Device — Sampling Interval Y<\ncs feet
Land-Surface Eiev. Jeet • Surveyed • Estimated Datum.
Doling Ruid Used Driing Contractor Prepared
.Drilling Method —
Driller ~ .Helper. Hammer
.Weight _ Hammer
.Drop — inches
IswplwCon Depth Tlme/Hydnulc fNfbeiovlsndsurtsce) Con Pnstunor
Rocowy Blow per 6 Ffotn lb (feet) Stvnplt/Core Description
26.
ML
Same-. pU<4 CW-T^ ^^4.
£3 f i / ^ ifcMh* os^l, ///rfo , Y n ' 1 5 *~''><4"i blue.
eAH>*fj p/*JL*jL*-^ In /ft
$.3
5a p U - i , Moist ; A/ T:
10017C
GSM Form 03 6-66 Southern 87-1718
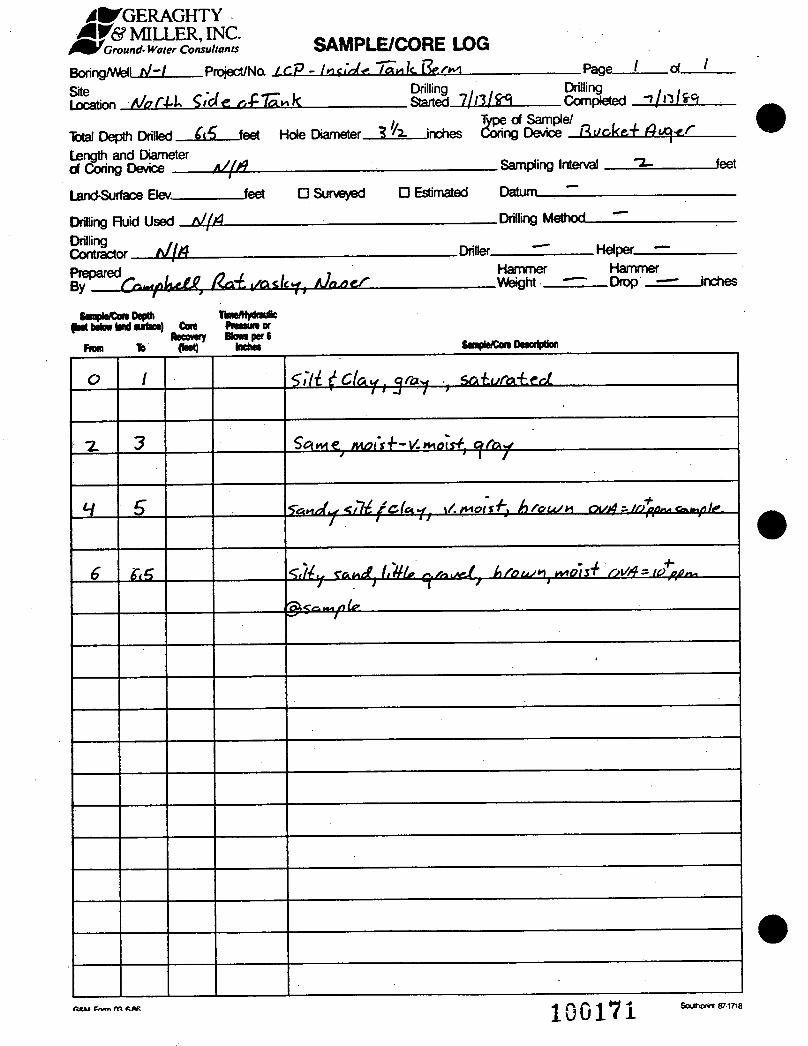
JfcTGERAGHTY^ 'Ground-Water Consultants SAMPLE/CORE LOG
RnrirvjAAtell A / - / Project/No. fC.P - ImtMr. 7 t tnk Be.'*")
Site
Page / of I -MTP . . Drilling • . Drilling . . Locati™ tJ»rLL C/ci* r .±-fe*k Started Completed i /n/frq
// Type of Sample/ Total Depth Drilled __£i£L_feet Hole Diameter_iA inches Coring Device Mi/oKaf f?<^</" Length and Diameter of Coring Device ^( f i Sampling Interval 3= feet
Land-Surface Elev feet • Surveyed • Estimated Datum——
Drilling Ruid Used tJ(A Drilling Contractor __A£/fi_ Prepared
.Drilling Method.
.Driller. Helper •— Hammer Hammer
.Weight Drop —- inches
SwyhVCon Depth Ttae/Hy*sute Mbeiovbnd surface) Core Pressure or
Recovery BKWS per o Fran * (bet) inches Ceaple/Con) DeecripMon
/
<?*«*tj<tl£ fCfoL^j x/.*Piots-f-} hrous* oi/rt-iffppn^^le.
IiS- <>//y Cflu^g.A..A>7^ moist r,x/A= icf*a,
'aXcj^.^pLe
100171 Southorinl 87-1718

U t - K A v j n 1 i S f & MILLER, INC
Ground-Water Consultants SAMPLE/CORE LOG R/W,/WPII A/-2_ Project/Na ^P- l^rri^ la^k .Page. .of.
Site Location ftJor-L^ 7ay\k-
Drilling . . Drilling . , ^ . StartedJZ/L1/£5_Completed 7(n((r<i
Total Depth Drilled *7.B feet Hole Diameter inches (Coring Device fti/okc^ dv*\<<f~ Length and Diameter of Coring Device rJffi
Land-Surface Elev_
Drilling Fluid Used *J(A Drilling Contractor
Jeet
Sampling Interval
• Surveyed • Estimated Datum ~I
Jeet
.Drilling Method.
.Driller. .Helper. Hammer
.Weight _ Hammer
.Drop inches
Snpte/Con Depth Ttae/HydnuBc •est below tend suttee) Core Pressure of
Recovery Blows per 6 From % fteet) Cernpte/Core Description
3.
*au*j)k- — , ;
<-J,8
100172 Sojoionrt871718

^PJfGERAGHTY
0& fG^und-Water Consultants S A M P L E / C O R E L O G
Boring/VVelLAZr3__Project/No. LC,?- I w A r Tn^L B C ^ M Site Location AJorhU a-f /^ulc
Page ! of L Drilling . , Drilling - / , , / < -« Started _7/a/fc5_ Completed 7fn(*1
Total Depth Drilled_7j51_feet Hole Diameter 3,5 -inches Coring Device6'fil/Gtch fti/CjrS
Length and Diameter of Coring Device CZIR.
Land-Surface Elev
Sampling Interval.
Jeet • Surveyed • Estimated Datum =_
Jeet
Drilling Ruid Used rJfft .Drilling Method m
Drilling Contractor —
nrilter — Helper
•Me/Con Depth Tlne/HydnuBe •set beta* ewdsurtee) Con Pressure or
Recovery B»owper6 Prom To (feet) *****
Hammer .Weight _
Hammer .Drop — inches
Saovfe/Con Description
0 I <>l±u r.lotyf Urn,.j*> fkUr k } i / . macs*
<OMA /jM/c. ^ *A*T*+; • • ' ' ^ tcA-la'QUr*i
100173 R U Form m t U «
Southprinl 87-1718

^•TGERAGHTY M¥& MILLER, INC.
Ground-Water Consultants BorU /WeUErL
SAMPLE/CORE LOG Project/Na LcP- 7a»k Rp/-^ Page / ci L
Location Fr»<-r^uir n£Tk*k. f . lype of Sample/
Total Depth Drilled _Si£__feet Hole Diameter 1 '3- inches Length and Diameter of Coring Device N I H : —
Land-Surface Elev
Drilling Fluid Used Nlfi DriBing Contractor N\f i — —
Jeet • Surveyed
Drilling . Drilling StartedJZ/iif/Lia Completed 7/lH/tn
Sampling Interval 3v feet
• Estimated Datum ;
.Drilling Mathnrt \4a^rL f),j^
.Driller. Hammer
.Weight —
.Helper. Hammer
.Drop — inches
taafcrCnt Depth llme/rrydnuHc •a* betrw art surface) Core Pressuraor
Recovery Bkws per 6 Rom 16 fjeet) inches Ci"'ll'ffrij(e DsauluUon
Ox/A a o--> f{>~ *g> <r^~plr
8
100174 nMJU C A N * HI *v*fi So^horint 87-1718

J^GERAGHTY^ 'Ground-Water Consultants SAMPLEVCORE LOG
Boring/WelLtIriZ__Project/No. / C P - T f t i ^ $ c - ^
Site
. Page I ci L
Location ^,d*> cC-T?** k
Total Depth Drilled. Length and Diameter . of Coring Device
S feet Hole Diameter inches
Drilling , Drilling starts 7 f m f t t Completed -7/,-w/frc.
of Sample/ „ ing Device Boe.ke.-h Huc^ *S
. Sampfing Interval Jeet
Land-Surface Elev
Drilling Fluid Used N/fi Drilling Contractc Prepared
Jeet • Surveyed • Estimated Datum —
.Drilling Mathnri
UJA Ry r ^ ^ l i ' fJaser
. Driller — —Helper—ZZ Hammer Hammer Weight Drop .— inches
Swnple/Core Depth Ttae/Hydrauflc Meet below bnd curtece) Cere Pretture or
Recovery Btowsper6 From 16 fleet) Inehet Senile/Core rieecripoon
<V*.u» fwT-Ak LLs.lc m*~-t-.rrtc..l-Afij>i*<-*s:j t+ra^fy ar.ict.
100175 — 1
SouThnnnt A7-171R

Page L of L L/niiiiiy . , Drilling ,
. Started Completed 7(m(*<\
^•TGERAGHTY ^fcS? MILLER, INC. _ A B - P l l ______ , „
/•WGround-Water Consultants S A M P L c / C U H c L O G
Bc<ing/Well£l3___Project/No. l^',el-e. 7a«/c ile.r^
Site ±. <r j £ -r- , P"11'^
Total Depth Drilled__£__feet Hole Diameter 3^Z- inrfres Coring Device h u c l ^ j- A u ^ r Length and Diameter
of Coring Device A///? Sampling Interval _
Land-Surface Elev feet • Surveyed • Estimated Datum A//#
Drilling Ruid Used rJlA Drilling Contractor Prepared
Jeet
.Drilling Method /JjA Drilling Cnrtrartnr IV jH .Driller. .Helper.
By r^^pln^ tJ<x<&r Hammer Hammer .Weight Drop — inches
Sample/One Depth TtaeVrr/drsiiBc (feet brio* lend surface) Core Pressure of
Recovery Blows per 6 From Jo (feet) Inches SonpkVCoit Description
AL. r > \ / ( l - #Ofp*v\ <mp(e
<>Gv\eL ^ ^/ft^-V^^ OVti-- ,000+ @ <r>~pL,
«A e> n\/A - fooefpp* r<-- L>; V\rA-
1Q017G Souftiorir* 87-171ft

APPENDIX C-4
WATER SAMPLING LOGS FOR THE AUGUST 21, 1989 NORTHERN TANK FARM MONITORING WELL SAMPLING EVENT
GERAGHTY & MILLER, INC. 10017V

GERAGHTY r& MILLER. INC.
Ground-H ater Consultants _
WATER SAMPLING LOG
Project/No. «-ce ; ; Page ! o f _ L
Site I S . i \ - v \ c A c; i *!>••-,< SiteAVeflNo. T ^ > " » RepttaiteNo. _ T I Date fl-ll-fr^
, o A ' # Tkrr» Sampling J K t S r f * " 9 I 7 o o Weather p^-« s n ^ y - Began » I Completed 1 —
EVACUATION DATA
Description of Measuring Point (MP) * V C
Height of MP Above/Below Land Surface , MPBevation
Total Sounded Depth of Well Below MP ^ 3 - M ft- Water-Level Elevation i _
Heid_ Depth to Water Below MP _&2-t-££L£-« Diarr^erof Casrrrc Galkxts Purnped / j ^^J
Wat Water Column in Well Prior to Sampling
Gallons per Foot _Q^_L ic Sampling Pump intake Setting
Gallons in Well ' • (feet betow lard surface)
Evacuation Method £ . £ . V . •, • >-
SAMPLING DATA/FIELD PARAMETERS
Color. Odor Appearar*e_£iL±^_ Ternpersture_L2—*&©
Other (specific ion; OVA; HNU; etc).
Specific Conductance, , * ..mhra/rm U O O pH L ^ A .
Sampling Method and S . S . V>«acr-
Contalner Description Constituents Sampled From Lab or GAM Preservative
\rn C s u 0 r*.\ oi o- ;>-< -i''cA r\ o<\ f
Remarks -
Sampling Personnel x LtwU
WELL CASING VOLUMES GAUFT - 0.077 V - 0.16 3* - 0.37 4 ' - OSS
1-V»* - 0.10 S-t»* - 0*4 3-Vk* - 0.50 «* - 1.46
100*73

^GERAGHTY &MIIXER.INC.
Ground- Water Consultants
Project/No. L-L?
WATER SAMPLING LOG
Site Loca l i on_^P i r i i ^ ^ r ~ ' C — B L S I A — T q f i ^ Coded/
Site/Well No. T u \ -~L Replicate No.
Page. J o f _ l
. Time Sampling Weather ^ e c m y V - s Began L 2 l £ -
Date -Time Sampling Cornpleted _ _ _ J _ 3 3 0 _
Description of Measuring Point (MP)
EVACUATION DATA
MP Elevation. Height of MP Above/Below Land Surface.
Total Sounded Depth of Well Below MP p+- Water-Level Elevation
I (old •
Wat
Gallons per Foot o-><p
Gallons in Well ^ Q i
Evacuation Method , i - i l ^ — V ? » ; \ « . r
Depth to Water Below MP ^ ft * 1 l *t- Diameter of Casing Gallons Pumped/1^
Water Column in WAII ^ O ' O I f j Prior to Sampling
_2L_L
Sampling Pump Intake Setting (feet bek>w land surface)
Color. . Odor_
SAMPLING DATA/FIELD PARAMETERS
. Appearance fn * . Ternparature 1 8 #F/££>
Other (specific ton; OVA; HNU; etc.).
Specific Conductance, umhos/cm _ _ _ £ - L G J C L
Sampling Method and Material.
Constituents Sampled Container Description
From Lab or GAM _
M f t m l gjts ss V i a \
. Preservative
^ 6 ^ * -
SarnpKngPersonnel t_^u> \ 4
WELL CASING VOLUMES GAUFT . 0.077 2" - 0.16 S" - 0.S7 4' - 0.65 10 Ql
1-V»- - 0.10 - 024 3-V*' - 0.50 V - 1.46 X
1/86

^•^GERAGHTY r& MILLER. INC.
Ground-Water Consultants
WATER SAMPLING LOG Project/No. i c f / »*/> r>o -Hn *) ; Page. 1 _of—L
~r- - Coded/ ~ ' _ „ Site/Well No. I ^ - Replicate No. ZZL. Date ft ' ^ *
_ ^ . » Time Sampling Time Sampling ^ Weather g > v t r c * s t - g o » Began Completed_11L^_
EVACUATION DATA
Description of Measuring Point (MP) — p*<-
Height of MP Above/Below Land Surface MPBevatton , .
Total Sounded Depth of Well Below MP H1-I ff. Water-Level Elevation
Held Depth to Water Below MP • H5~Yt- Diameter of Casing__ Gallons Pumped/Bjjjpa ^
Wet wtorfiftiitmn in Wall i a , u S ft. Prior to Sampling £
Gallons per Foot _o_^JJs Sampling Purnp Intake Setting
Gallons in Well Z> • c a. (feet below land surface)
Evacuation Method 5>C. ft<r\ig.r
SAMPLING DATA/FIELD PARAMETERS
Color Odor Appwarwnno ^ - S i I +y Tmpufahge \1
Other (specific ton; OVA; HNU; etc.).
Specific Conductance, umhos/cm 3 3 0 pH U • fa
Sampling Method and Material • fl « 1& r
Container Description Constituents Sampled From Lab orG&M Preservative
V O C ' * M rO ~ l j l * v-Yal o r * ; C
Remarks ____ ;
SamplingPersonnel t-eu>is / P . P a o 1 o
WELL CASING VOLUMES GAUFT 1-V4- - 0.077 2" - 0.16 3* - 0.37 4' - 0.65
1-V»*«0.10 2- -0.16 8" -0.37 4- - 0.65 1 f\Ci 1 Q Ci 2-H--024 S»Vk--aS0 6* - 1.46 J. V U J. O (J
1/86
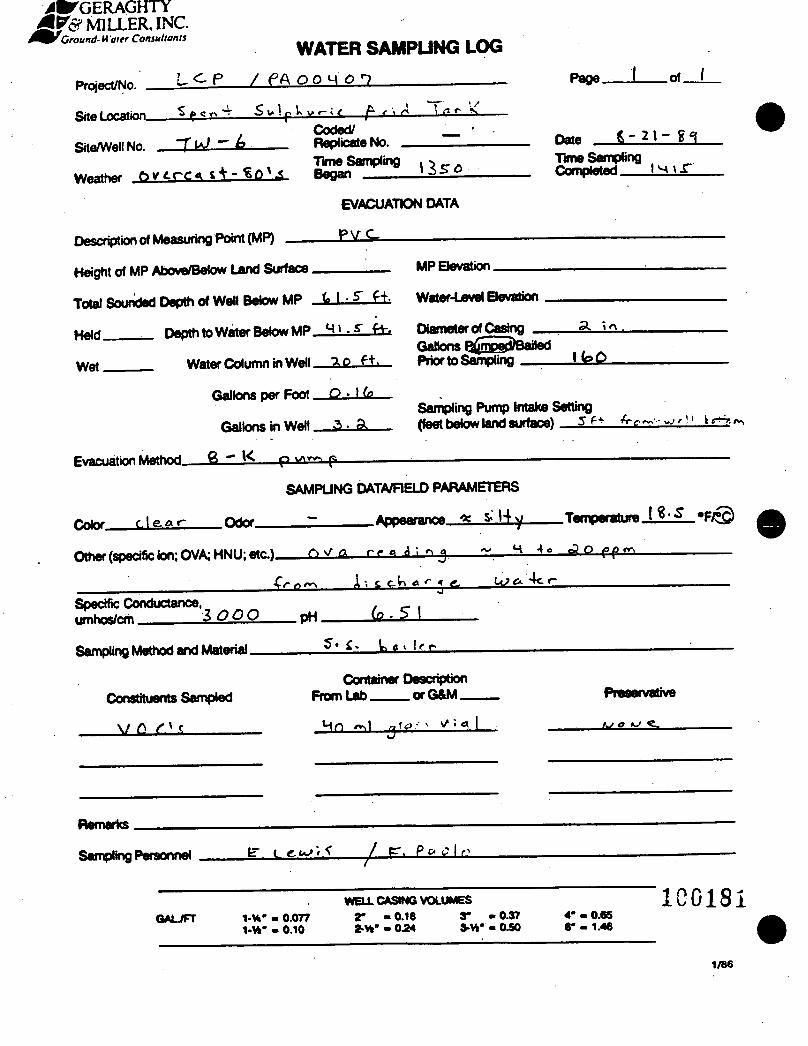
^GERAGHTY MILLER, INC.
c r o M , , r c o ^ n WATER SAMPLING LOG
Project/No. L ^ P / f A O C - j O ' ?
Site Location 5 f <= ^ :
Srte/WellNo. " *?
Weather ft*t-rr* i * - % Q * s Began
Coded/ Replicate No. . Time Sampling
Page _ _ _ ! _ _ of L
Date S i Time Sampling
Description of Measuring Point (MP)
Height of MP Above/Below Land Surface
Total Sounded Depth of Weil Below MP 1 • 5~ ft-
Held Depth to Water Betow MP M*.*" f h
Wet Water Column in Well —7,Q ft»
Gallons per Foot O • I Cc—
Gallons in Well a - a.
Evacuation Method__£Lr_K p v\™ p
EVACUATION DATA
p y c
MP Elevation.
Water-Level Elevation
3. U Diameter of Casing Gallons r^rroepTBailed Prior to Sampling I <PC>
Sampling Pump Intake Setting (feet below land surface) Sf» A - f .
SAMPLING DATA/FIELD PARAMETERS
Odor T Appearance_^_5iJ±^ Temperature I ^ '- S ' ' F / ©
Other (specific Ion; OVA; HNU; etc.) Ct-£ia—rr « d • n j ~ H 4 ° P P ^
r n l r v f l e a r
^ • • t ^ « r < f c Ly><>
Specific Conductance, umhos/cm ; pH.
Sampling Method and Material.
Constituents Sampled
w <
Container Description From Lab or GAM _
Hn ~ l j f o . ^ v - a l
Preservative
Remarks —
Sanding Personnel tr t <L<*J>.< J F . P C 1/ I f ?
WELL CASING VOLUMES 1 C 0 1 8 1 G A U F T 1 - * ' - 0.077 2* - 0.16 3* - 0.37 4* - 0.65
1-H* - 0.10 2 - H " - 0 *4 S-V»* - 0.50 6* - 1.46
1/86

APPENDIX D
PROCEDURES TO BE EMPLOYED DURING THE SULFURIC
ACID SPILL SITE REMEDIATION
APPENDIX D-l
APPENDIX D-2
APPENDIX D-3
APPENDIX D-4
APPENDIX D-5
SOIL SAMPLING PROCEDURES
GROUND-WATER SAMPLING PROCEDURES
SAMPLE CUSTODY
QUALITY CONTROL PROCEDURES
DATA AND RECORDS MANAGEMENT
GERAGHTY & MILLER, INC.
100182

APPENDIX D-l
SOIL SAMPLING PROCEDURES
Samples of containment area soils will be collected at a number of horizontal locations from
a variety of depths during implementation of remedial activities, as described in the Work Plan.
At each of the nine predetermined sampling locations, the uppermost sample (i.e., at the soil
surface) will be collected using a hand-augering device equipped with a three-inch diameter stainless
steel collection barrel. Samples collected from deeper sampling intervals will be collected utilizing
a discrete-depth soil sampling device, a hand-augering device, or similar manually-operated sampling
tool, or a split-barrel sampler used in conjunction with hollow stem augers. The method of sample
collection to be employed will be dependent upon the relative ability of the sampling devices to
achieve target sampling depths.
Following collection of each sample, a 20 g portion of each soil sample will be placed into
a plastic container, mixed with 20 ml of distilled water, and allowed to stabilize for 1 to H hour.
A field pH measurement will then be taken of the soil/water slurry using a calibrated field-grade
pH meter. The balance of each sample will be placed in individual, clean plastic sample containers
fitted with water tight lids and will be kept on ice until all samples have been collected from the
sampling location. Upon completion of soil pH measurements, the soil samples will be placed into
a common stainless steel container and will be blended slowly to form a composite sample. The
appropriate sample container (to be supplied by the laboratory) will then be filled from the
composite.
Each composite sample will be subjected to analyses for pH and sulfuric acid concentration.
Soil samples will be prepared and submitted for analyses at a rate of 10 percent. Due to the sample
matrix, no field blank for trip blank will be prepared.
GERAGHTY & MILLER, INC. 100184
APPENDIX D-l -2-
The sample jars will be labelled to indicate the sampling location number the number of
individual samples comprising the composite, and the names of the sampling personnel. All samples
will be held in a cooler chest and cooled to about 4°C following collection. Following completion
of sampling, the samples shall be forwarded to the selected laboratory using the chain-of-custody
procedures described in Appendix D-3. All unused soil shall be returned to the borehole from
which they were collected.
Following collection of individual soil samples from a given depth at each sampling location,
the sample collection devices(s) shall be washed with a laboratory detergent solution and rinsed with
distilled water before being used to gather samples from the next sampling depth. The cleaning of
the sampling devices(s) will be performed at a designated washdown area.
Following completion of sampling activities, the sample location will be marked with a
wooden stake driven into the soil surface. The stake will be labeled to indicate the borehole
designation and the date.
The Geraghty & Miller project manager or his designee will be present during all soil
sampling activities. A daily log documenting all on-site activities (Figure D-l) will be maintained
by the Geraghty & Miller representative on-site. The log shall be kept in sufficient detail so that
any unusual circumstance that may arise can be reconstructed at a later time.
GERAGHTY & MILLER, INC.
ICOISJ

FIGURE D-l
A •^GERAGHTY ~*& MILLER, INC. Environmental Services DAILY LOG
Well(sL .Project/No.. .Page. .of_
Site Location
Prepared By
DatefTime Description of Activities
100186 G&M Form 02 6-86 Soulhprint 89-1256

APPENDIX D-2
GROUND-WATER SAMPLING PROCEDURES
GERAGHTY & MILLER, INC. 10G1S?
APPENDIX D-2
GROUND-WATER SAMPLING PROCEDURES
During ground-water sampling activities, a monitoring well sampling checklist (Figure D-
2) shall be filled out on a daily basis. This form documents various aspects of the sampling
procedures which can influence data quality and validity.
Measuring Water Levels
Prior to bailing, purging, and sampling, the static water level in the well will be measured
and the volume of standing water in the well shall be calculated. Where a number of monitoring
wells are to be sampled, a full round of water levels shall be taken prior to starting the water
sampling.
The advantages of doing this are: 1) it provides potentially more accurate data for water
table maps, relative to measurements collected over a period of days; 2) it allows the sampling team
to become oriented to a new site; and 3) it provides the sampling team with immediate information
about unusual circumstances such as wells that might be lost, damaged, dry, or inaccessible. If it
becomes apparent that a well cannot be sampled, the sampling plan shall be modified accordingly
and the G&M Project Manager notified. Any such changes shall be noted in the field log book.
When taking a full round of water-level measurements, care must be taken to avoid cross
contamination of wells. When necessary, separate tapes shall be used.
At the LCP facility, an electric measuring tape (calibrated to 0.05 foot) shall be used for
water-level measurements. These measurements shall be recorded in the Water Sampling Log (see
Figure D-3). The probe of the electric tape shall be rinsed with distilled water prior to measuring
each well. In making each measurement, the probe shall be lowered into the well until the indicator
; 1CC1S3
GERAGHTY & MILLER, INC.
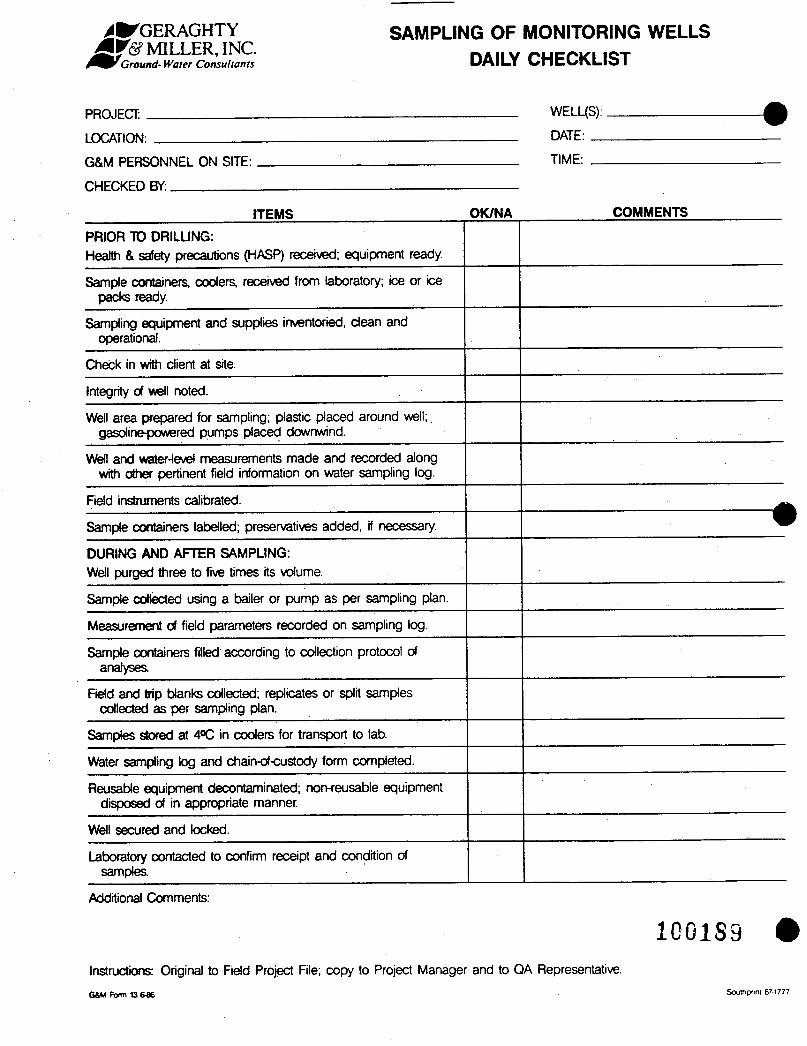
• GERAGHTY & MILLER, INC.
Ground- Water Consultants
SAMPLING OF MONITORING WELLS DAILY CHECKLIST
PROJECT: .
LOCATION:
G&M PERSONNEL ON SITE:
CHECKED BY:
WELL(S):
DATE: _
TIME: _
ITEMS OK/NA COMMENTS
PRIOR TO DRILLING: Health & safety precautions (HASP) received; equipment ready.
Sample containers, coders, received from laboratory; ice or ice packs ready.
Sampling equipment and supplies inventoried, clean and operational.
Check in with client at site.
Integrity of well noted.
Well area prepared for sampling; plastic placed around well;. gasoline-powered pumps placed downwind.
Well and water-level measurements made and recorded along with other pertinent field information on water sampling log.
Field instruments calibrated.
Sample containers labelled; preservatives added, if necessary.
DURING AND AFTER SAMPLING: Well purged three to five times its volume.
Sample collected using a bailer or pump as per sampling plan.
Measurement of field parameters recorded on sampling log.
Sample containers filled according to collection protocol of analyses.
Field and trip blanks collected; replicates or split samples collected as per sampling plan.
Samples stored at 4°C in coolers for transport to lab.
Water sampling log and chain-of-custody form completed.
Reusable equipment decontaminated; non-reusable equipment disposed of in appropriate manner.
Well secured and locked.
Laboratory contacted to confirm receipt and condition of samples
Additional Comments:
10G1S9 Instructions: Original to Field Project File; copy to Project Manager and to QA Representative.
G&M Form 13 & » Southpiint 87 1777

4^GERAGHTY r& MILLER, INC.
Environmental Services
Project/No..
WATER SAMPLING LOG
Page_ .of_
Site Location
Site/Well Na_
Weather
Description of Measuring Point (MP).
Coded/ Replicate No. _ Time Sampling Began
Date Time Sampling Completed _ _
EVACUATION DATA
Height of MP Above/Below Land Surface .
Total Sounded Depth of Well Below MP
H e l d _ _ _ _ Depth to Water Below MP.
Wet Water Column in Well.
Gallons per Foot.
Gallons in Well.
Evacuation Method
MP Elevation
Water-Level Elevation.
Diameter of Casing. Gallons Pumped/Bailed Prior to Sampling
Sampling Pump Intake Setting (feet below land surface)
Color. .Odor_
SAMPUNG DATA/FIELD PARAMETERS
Appearance
Other (specific ion; OVA; HNU; etc.).
.Temperature. .°F/°C
Specific Conductance, umhos/cm
Sampling Method and Material
Constituents Sampled
.pH_
Container Description From Lab or G&M _ Preservative
Remarks
Sampling Personnel
WELL CASING VOLUMES GAL /FT. 1-%* - 0.06 2* « 0.16 3" = 0.37
1-V4* - 0.09 2-Vi* » 0.26 3-1A" = 0.50 4" 6"
0.65 1.47
100190
G&M Form 12 £86 Southpnnt 89-1473

APPENDIX D-2 -2-
light and/or buzzer signals that water has been reached. The depth to water is then read directly off
the calibrated tape at the top of the well casing. Water-level elevation relative to mean sea level is
found by subtracting the depth to water from the casing top elevation.
Set-up for Sample Collection
The top of the well casing will be cleaned with a clean rag. Sampling in the rain is not
encouraged, but may be done if the vehicle can be located near enough and shelter (plastic sheeting)
can be constructed over the sample- handling area to minimize sample exposure. The preliminary
information requested in the G&M Water Sampling Log (i.e., project, location, time, date, weather,
etc.), shown in Figure D-3 will be recorded at this time.
Purging the Well
Standing water shall be removed form the well casing prior to collecting ground-water
samples. Three (3) times the calculated volume of water in the well will be removed to ensure that
a representative water sample is obtained from the aquifer. Wells that go dry during evacuation are
sampled after recovery. The evacuation rate shall be noted.
The volume of standing water in a well will be calculated by subtracting the depth to water
from the total depth of the well and then multiplying this value by a coefficient which relates the
diameter of the well to gallons per linear foot. Coefficients for commonly encountered well
GERAGHTY & MILLER, INC.
10G19±

APPENDIX D-2 -3-
diameters are listed on the bottom of the G&M Water Sampling Log. The volume of standing water
in a well for which a coefficient is not listed can be determined by formula:
V= 7.47JTr2h
Where, V « Volume of standing water (gallons)
r «= Radius of well casing (ft)
h « Height of standing water (ft)
The volume of water purged from the well will be calculated directly by using a container
of known volume. The rate of flow, in gallons per minute, will be measured by recording the time
(via stopwatch) required to fill the container. The rate and volume of water evacuated from the well
will be noted on the Water Sampling Log. Well evacuations shall be accomplished using a stainless
steel or Teflon bailer.
Well Sampling Procedures
Well-water samples will be collected using Teflon or stainless steel bottom-filling bailers
which will be cleaned immediately prior to use. Cleaning will include washing with Sparkleen
solution, a tap water rinse and a distilled water rinse.
For purpose of quality control, we regard the field cleaning of bailers to be preferable to
precleaning in a laboratory for three reason:
• Contaminants present in the laboratory or wrapping materials may enter the bailer.
• Residues may be introduced during transit to the site.
GERAGHTY & MILLER, INC.
100192

APPENDIX D-2 -4-
• It is generally not possible for all interested parties to observe laboratory cleaning,
wrapping, and transport protocols.
The efficiency of the field cleaning protocols will be monitored by the use of random field
blanks, where laboratory pure water will be run through newly cleaned bailers just prior to sampling.
Replicate samples comprising about 10 percent of the total sample set shall be collected throughout
the sampling program. Trip blanks will be prepared at a rate of one per shipment and field blanks
will be prepared at a rate of one per sample set.
If a well will not yield the volume of water necessary to immediately fill the required number
of sample containers, the partially filled container will be tightly capped, kept out of sunlight and
cooled to approximately 40C, until the necessary volume of samples can be obtained.
Sample Preparation
Once samples have been collected they shall be prepared and held in accordance with the
outlined requirements specified in Table D-l. Only those water samples designated for metals
analyses requiring acid preservation shall be filtered. This is to remove the suspended material in
the sample (e.g., silt and clay), which could be digested by the acid, resulting in elevated levels of
those metals that are naturally-occurring constituents of the silt and clay.
It should be noted that only those samples to be submitted for metals analyses will be filtered.
All samples shall be preserved in accordance with the Manual of Ground-Water Sampling Procedures
(Scalf and Others, 1981) or as otherwise specified by the laboratory selected to perform the water-
quality analyses. Preservatives to be used in fixing ground-water samples for the various chemical
analyses to be conducted are included in Table D-l.
GERAGHTY & MILLER, INC.
1CG193

TABLE 0-1
PARAMETERS TO BE ANALYZED FOR AND LABORATORY METHODS TO BE USED IN GROUND-WATER ANALYSES
LCP CHEMICALS-WEST VIRGINIA, INC. MOUNDSVILLE. WEST VIRGINIA
ANALYTICAL PARAMETER CONTAINER TYPE PRESERVATIVE (1,2,3)
HOLDING TIME MAXIMUM (4) VOL. ML. METHOD
Field Temperature Plastic or Glass Field pH Plastic or Glass Field Conductivity Plastic or Glass pH (Lab) Plastic or Glass Conductance (Specific) Plastic or 61ass Solids (Dissolved) Plastic or Glass Alkalinity Plastic or 61ass Chloride Plastic or Glass Fluoride Plastic or Glass Manganese Plastic or Glass Sulfate Plastic or Glass Sodium Plastic or Glass Potassium Plastic or Glass Calcium (by atomic absorption) Plastic or Glass Magnesium (by atomic absorption) Plastic or Glass Iron Plastic or Glass Aluminum Plastic or Glass TOC (Total Organic Carbon) Plastic or Glass Volatile Organic Compounds VOA
NONE NONE NONE Cool 4T Cool Cool Cool
4'C 4-C 4-C
Cool 4-C HNO, HNO3 Cool HNO, HNO3 HNO, HNO3 HNO, HNO, HNO, Cool 4*C
(pH<2) (pH<2) 4*C (pH<2) (pH<2) (pH<2) (pH<2) (pH<2) (pH<2) (pH<2)
NONE NONE NONE 6 hrs. 28 days 7 days 14 days 28 days 6 mos. 6 mos. 28 days 6 mos. mos. mos. mos. mos. mos.
28 days 14 days
50 100 100 100 100 100 100 50 100 100 100 100 100 100 10 40
EPA 150.1 EPA 120.1 EPA 160.1 EPA 310.1 EPA 325.3 EPA 340.2 EPA 243.1 EPA 375.3 EPA 273.1 EPA 258.1 EPA 215.1 EPA 242.1 EPA 236.1 EPA 202.1 EPA 415.1 EPA 8240
Notes for Table:
1) Unless otherwise specified, all ground-water samples shall be kept cool at about 4* Centigrade (i.e.. Cool 4'C), from the time of collection until delivery to the laboratory.
2) Sample preservation should be performed immediately upon sample collection. For composite chemical samples each aliquot should be preserved at the time of collection.
3) When any sample is to be shipped by common carrier or sent through the United States Mails, it must comply with the Department of Transportation Hazardous Material Regulations (40 CFR Part 172). The person offering such material for transportation is responsible for ensuring such compliance. For the preservation requirements of Table 3, the Office of Hazardous Materials, Materials Transportation Bureau, Department of Transportation has determined that the Hazardous Materials Regulations do not apply to the following materials: Hydrochloric acid (HCL) in water solutions at concentrations of 0.04X by weight or less (pH about 1.96 or greater); Nitric acid (HN03) in water solutions at concentrations of 0.15% by weight or less (pH about 1.62 or greater); Sulfuric acid (H SO ) in water solutions at concentrations of 0.35X by weight or less (pH about 1.15 or greater); and Sodium hydroxide (NaOH) in water solutions at concentrations of 0.080% by weight or less (pH about 12.30 or less).
4) Samples should be analyzed as soon as possible after collection. In the case of inorganic parameters and VOCs, the times listed are the maximum times that samples may be held before analysis and s t i l l be considered valid. In the case of organic parameters, the times are the maximum allowable until extraction. After extraction, the sample may be held for an additional 40 days.
100194
GERAGHTY & MILLER, INC.

APPENDIX D-2 -5-
Following sample preparation all ground-water samples shall be kept in cooler chests at a
temperature of approximately 4°C until they are delivered to the water-testing laboratory. Chain-
of-custody procedures and other shipping protocols are further discussed in Appendix D-3.
Procedures for Conducting Field Analyses
Measurements for pH, temperature, and specific conductance shall be made in the field at
the time of sampling because these chemical properties are difficult to preserve during storage. No
holding time is permissible. Approximately one pint of sample will be placed in a clean, unpreserved
glass container when field measurement are conducted. Field measurements will be recorded in the
G&M Water Sampling Log (see Figure D-3).
Temperature:
Temperature will be measured with a rapidly equilibrating, mercury-filled Celsius
thermometer, immediately following collection of the sample.
pH:
The pH shall be determined with a glass hydrogen ion electrode compared against a reference
electrode of known potential by means of a pH meter or other potential measuring device with a high
input impedance. Because pH is exponentially related to concentration, care must be exercised in
making a measurement.
Measurement of pH is temperature-sensitive, so the standard buffers should be at a
temperature near that of the sample for precise determinations. This can be accomplished by
immersing a ttle or test tube containing buffer in the sample discharge.
10019J
GERAGHTY & MILLER, INC.

APPENDIX D-2 -6-
The pH meter shall be calibrated at the beginning of every sampling day. Calibration is
standard two-buffer calibration, following manufacturers' instructions. Commonly available buffers
have nominal pH values of 4, 7 (sometimes 6.86), and 10. The two buffers that are most likely to
bracket that sample pH value shall be used. A one-point calibration (pH 7) will be make each time
the unit is moved. Buffer solution shall be decanted from the storage bottle to a small beaker or tube
for calibration and then discarded.
Before a measurement is made, the probe is completely rinsed with a stream of deionized or
distilled water. Then, to measure pH, the probe is lowered into a container of sample water and
allowed to equilibrate. To facilitate equilibration, the probe is used to gently stir the water. (Gentle
stirring helps minimize sample aeration). A pH reading is made as soon as the reading on the meter
steadies. Between measurements, the probe will be immersed in deionized water or buffer. At least
a one-point calibration shall be performed prior to measuring pH in each sample.
Specific Conductance:
The ability of a solution to conduct an electrical current if a function of the concentration
and charge of the ions in solution and the rate at which the ions can move under the influence of
an electrical potential. A battery-powered conductivity meter will be used to take the specific
conductance measurements. The probe shall be kept clean, and calibrated daily with a commercially-
prepared conductivity standard.
To measure the sample's specific conductance, the probe will be lowered into the sample and
stirred gently. A reading shall be taken within seconds after immersion. Before and after each use,
the probe shall be cleaned with a stream of deionized or distilled water.
10019?
GERAGHTY & MILLER, INC.

APPENDIX D-2 -7-
Recordine of Field Data and Labeling of Samples
Field Log Book:
A bound notebook will be used by the field team for recording all sampling events and field
observations. Entries in the log book shall be dated and signed by the person making the entry. The
log book will be kept in a secure dry place. Entries may not be made in water-soluble ink. The
type of information to be included in the log is:
Date
Client
Location
Weather
Sample crew
Work progress
• Control samples
Any information that is not normally recorded on the G&M logs and forms should also be included
in the Log Book, e.g.,
• Delays
• Unusual situations
Well damage
Departure from established QA/QC field procedures
• Instrument problems
Accidents
GERAGHTY & MILLER, INC.
100197

APPENDIX D-2 -8-
The sampling team shall also maintain the water sampling logs, kept in the ring binder, to
record information about each sample collected. The log will be completed at the time of sampling.
It will provide documentation to indicate that sampling requirements have been met. The standard
Water Sampling Log is shown in Figure D-3. It includes, in addition to project information and well
evacuation data, the following information on sampling:
• Physical appearance of samples
• Field observations
Results of field analysis
• Sampling methods and materials
Constituents sampled
• Sample container and preservation
• Sampling personnel
Sample Labels:
Sample labels are necessary to identify and prevent misidentification of the samples. The
labels shall be affixed to the sample containers (not the caps) prior to the time of sampling. The
labels shall be filled out in pencil at the time of collection. The labels should include the following
information.
• Sample number
Name of collector
Data and time of collection
Client and geographic location
• Geraghty & Miller
G&M project number
100198
GERAGHTY & MILLER, INC.

APPENDIX D-2 -9-
After marking, the labels will be covered with clear acetate tape for protection. An example label
to be used is provided in Figure D-4.
1001S3
GERAGHTY & MILLER, INC.
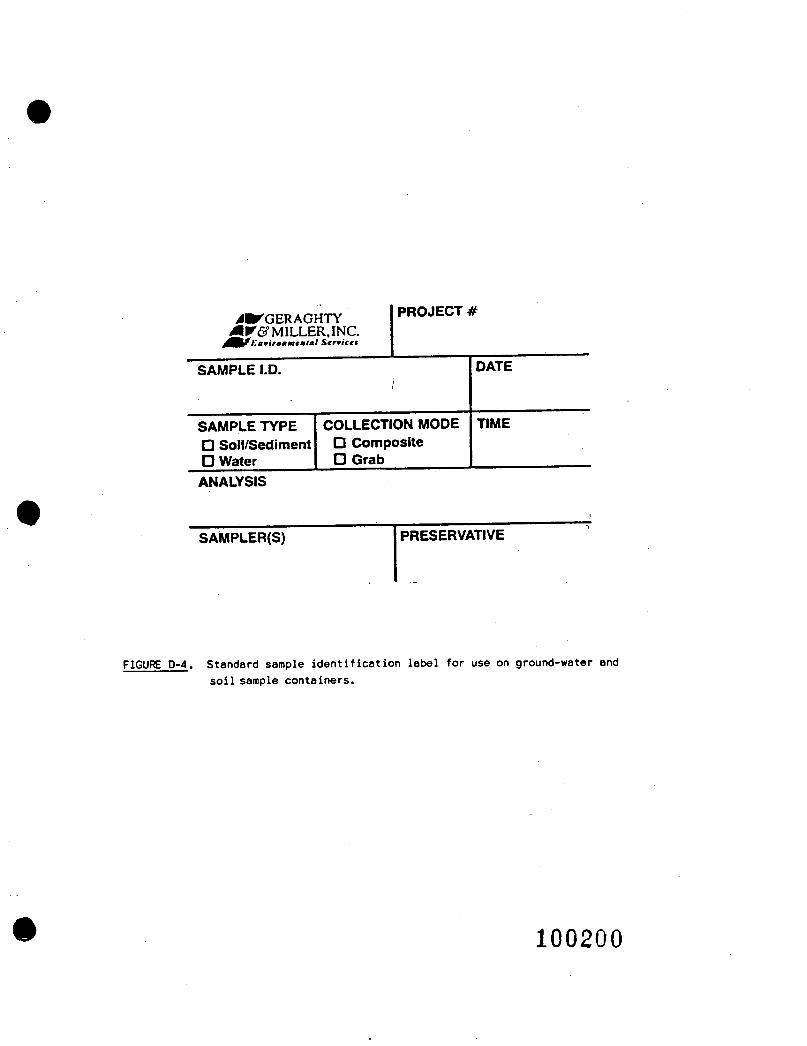
^•^GERAGHTY & MILLER, INC.
Eafirommtmlcl Stnictt
PROJECT #
SAMPLE I.D. DATE
SAMPLE TYPE • Soil/Sediment • Water
COLLECTION MODE • Composite • Grab
TIME
ANALYSIS
SAMPLER(S) PRESERVATIVE
FIGURE D-4. Standard sample identification label for use on ground-water and soil sample containers.
100200

APPENDIX D-3
SAMPLE CUSTODY
Sample custody procedures are designed to provide documentation of preparation, handling,
storage, and shipping of all samples collected during this project. Samples collected during the site
investigation will be the responsibility of identified persons from the time the empty sample
containers leave the laboratory, until the collected samples are analyzed.
Sample Container Inventory
Prior to each sampling event, a Sample Container Inventory Form (Figure D-5) along with
G&M chain-of-custody seals (Figure D-6) will be forwarded to the laboratory. Using the inventory
form, laboratory personnel will prepare a detailed inventory of all empty sample bottles being
supplied to the site, including the number of bottles, bottle size, and the preservative (if any),
included in each bottle. Each empty sample bottle will be sealed with a G&M seal, showing the
signature of the laboratory personnel preparing the bottles for shipment. The inventory form will
be signed and dated by the laboratory personnel preparing the shipment and also by the courier
transporting the bottles to the site.
Once the shipment is received at the site, a member of the sampling team will sign and date
the inventory form acknowledging receipt of the shipment. The shipment will then be unpacked and
the Sample Container Inventory Form checked against the contents of the shipment. All seals will
be inspected to confirm their integrity. Any comments regarding the shipment will be noted and the
inventory form signed and dated by the field personnel performing the inspection. The laboratory
selected to perform the soil/ground-water quality analyses may have in effect a sample container
inventory control program. This program may be adopted in lieu of the above, provided sample
container integrity can be insured.
TOcTOOI
GERAGHTY & MILLER, INC.

APPENDIX D-3
SAMPLE CUSTODY
100.?0f
GERAGHTY & MILLER, INC.

& MILLER, INC. Ground- Water Consultants
SAMPLE CONTAINER INVENTORY
Project
Shipped from (laboratory)
Phone
Shipped to
Attn.
SHIPMENT CONTENTS
Shipped Received
Bottle Size and Composition Preservative Quantity Quantity Condition / Comments
Packed by Date
Shipped by Date
Sealing Method
Received by Date
Inspected by Date
Seal Intact?
Remarks:
100203

Example of chain-of-custody seal to be utlized during sample transport to the laboratory.
CHAIN-OF-CUSTODY SFAI GERAGHTY & MILLER, INC.
1V3S AaQiSnO-dO-NlVHO

APPENDIX D-3 -2-
Field Custody
The sampling personnel are personally responsible for the care and custody of the samples
collected until they are personally delivered to the analyzing laboratory or entrusted to a courier.
Chain-of-custody sample forms (Figure D-7) will be completed prior to sample shipment.
They will include the following information: sample number, time collected, data collected, source
of sample, preservative, and name of sampler. These forms will be completed using waterproof ink
and signed by the sampler. Similar information will be provided on the sample label, which is
securely attached to the sample bottle. One chain-of-custody form will be completed for each
shipping container being sent to the laboratory.
Transfer of Custody and Shipment
Each sample shipping container will be accompanied by a chain-of-custody record (Figure
D-7). The original record will accompany the shipment; and a copy will be retained by the sampling
personnel. When transferring samples, the individuals relinquishing and receiving them will sign,
date, and note the time on the record. This record documents sample custody transfer from the
sampler of the laboratory. After being signed by the courier, the field chain-of-custody record will
be placed inside the shipping container in a sealed plastic envelope.
After collection, samples requiring refrigeration will be promptly cooled to approximately
4°C and packaged in an insulated cooler for transport to the laboratory. Only shipping containers
which meet applicable State and Federal Standards for safe shipment will be used. The shipping
container will be sealed with at least two G&M custody seals, so that any tampering may be detected.
GERAGHTY & MILLER, INC.

Groum
ERAGHTY MILLER, INC
''Ground-Water Consultants
Project Number ^
Project Location
Laboratory :
Samplers) _
F I ^ E _ D - 7
CHAIN-OF-CUSTODY RECORD Page. of_
SAMPLE BOTTLE / CONTAINER DESCRIPTION
Total No. of Bottles/ Containers
Relinquished byte*. Received by: C 3
Organization: Organization:
Date_ Date.
J L J L
.Time.
.Time.
Relinquished by£o_ Received by: C^i
Organization: Organization:
Date. Date.
1 L 1 L
.Time.
.Time.
Seal Intact? Yes No N/A
Seal Intact? Yes No N/A
Special Instructions/Remarks:
Method: • In Person • Common Carrier -SPECIFY
• Lab-Courier • Other SPECIFY

APPENDIX D-4
QUALITY CONTROL PROCEDURES
GERAGHTY & MILLER, INC.

APPENDIX D-4
QUALITY CONTROL PROCEDURES
Quality control samples generated by G&M will include the collection of field replicates, the
preparation of field blanks, and the use of trip blanks. To assess laboratory performance, replicate
samples will be collected in the field and sent to the analytical laboratory at a frequency of about 10
percent of the sample set. The anticipated number of quality control samples to be generated during
remedial action monitoring is summarized in Table D-2.
Trip blanks will be shipped along with water samples and will be analyzed at the same time
as all other samples. Trip blanks will be utilized at a rate of one sample per shipment.
Field blanks will be prepared using rinse water from the ground-water sampling equipment,
and will analyzed to determine if the sampling procedures may be biasing the data. Field blanks will
be prepared and submitted at a rate of one per day. Procedures for collecting these samples are
discussed in Appendix D-2.
100207
GERAGHTY & MILLER, INC.

TABLE D-2
SUMMARY OF FIELD-GENERATED QUALITY CONTROL SAMPLES
LCP CHEMICALS-WEST VIRGINIA, INC. MOUNDSVILLE, WEST VIRGINIA
SAMPLING EVENT SAMPLE TYPE
ACTUAL SAMPLES REPLICATES
FIELD BLANKS
TRIP BLANKS
TOTAL SAMPLES
GENERATED
Ground-water Sampling
Treated Soil Sampling
Interface Sampling
Water
Soil
Soil
42
27
30 (est.) 3 (est.)
57
30
33 (est.)
O O fo o CO
GERAGHTY & MILLEifl

APPENDIX D-5
DATA AND RECORDS MANAGEMENT
GERAGHTY & MILLER, INC.

APPENDIX D-5
DATA AND RECORDS MANAGEMENT
Introduction
The data management procedures outlined in this Appendix are intended to provide for
proper inventory, control, storage, and retrieval of data and information collected during remedial
activities.
Organization
Project files containing Order-related data, transmittals, and reports generated during field
activities will be maintained at the LCP facility and the Geraghty & Miller office in Washington,
Pennsylvania according to the procedures outlined in this Appendix.
Receipt of Data and Reports
All incoming Order-related documents will be sampled with the date received and filed. If
distribution is required, the appropriate copies will be made and distributed to project personnel.
A listing of personnel intended to receive copies will be attached to the original.
All information generated from Order-related activities will be documented on the
appropriate forms. These include:
Water Sampling Log Form
Daily Log Form
Sampling Daily Checklist
Copies of Field and Instrument Log Books
GERAGHTY & MILLER, INC.

APPENDIX D-5 -2-
The G&M Project Manager, or his designee, will be responsible for recording these
documents as they are received. A log will be kept showing the date received, author/office of
origin, and a brief description of the content of the document. Each document will be assigned a
document control number according to the following format; PA00408 - XXXX-YYYY where:
PA00408 - is the Geraghty & Miller project number
"XXXX" - refers to the office of origin (e.g., EPA3, or LCPC)
"YYYY" - refers to a sequential number assigned to the document.
Each originating office will be allotted a separate sequence (e.g., there may
be a PA00408-LCPC-0001 and a PA00408-EPA3-0001)
Outgoing Data Reports
All outgoing Order-related project data and reports will be distributed through LCP and will
be assigned a document control number. The G&M Project Manager will maintain a log of all
project documents forwarded by G&M to LCP.
Telephone and Meeting Notes
1 Notes from project meetings and telephone conversations will be maintained. These notes
will be retained by the author until the conclusion of the project, at which point they will be filed
along with other project documents. An example of the telephone conversation log is shown in
Figure D-8.
100210
GERAGHTY & MILLER, INC.

•'GERAGHTY f& MILLER, INC.
Ground-Water Consultants
TELEPHONE CONVERSATION RECORD
DATE: . TIME: PROJECT:.
FROM: TO:
COMPANY: \ , COMPANY:.
TELE NO: . TELE NO: .
RE: :
FIGURE D-8. Telephone Conversation log form
G&M Form 16 6-86
1Q02U
Southprirt 87-1733

APPENDIX D-5 -3-
Document Filing and Access
Project files will be maintained at the LCP facility and at Geraghty & Miller's Washington,
PA office. Files will be organized according to document control number.
Access to the project files will be monitored and limited to project personnel. When a file
is removed for review, a sign-out card will be used to track its location.
Computer Data Storage
Laboratory analytical data, water-level data, and other numerical data will be stored and
managed using a data management system. Data entry will be performed by designated Geraghty
& Miller personnel, and any access to this data base shall be monitored. Computerized data bases
will be checked against the original data (maintained in the project file) to ensure that is was entered
correctly.
GERAGHTY & MILLER, INC.

APPENDIX E
LABORATORY REPORTS AND ASSOCIATED DATA
APPENDIX E - l RESULTS OF ANALYSES FOR VOLATILE ORGANIC CHEMICALS IN CONTAINMENT AREA SOILS, AUGUST 15, 1989
APPENDIX E-2 RESULTS OF ANALYSES PERFORMED ON SOIL SAMPLES COLLECTED FROM BORING AS-AH-1, NOVEMBER 28, 1989
APPENDIX E-3 RESULTS OF ANALYSES FOR VOLATILE ORGANIC CHEMICALS IN TANK FARM MONITORING WELL-WATER SAMPLES, SEPTEMBER 11, 1989
APPENDIX E-4 RESULTS OF ANALYSES PERFORMED ON SOIL VAPOR SAMPLES COLLECTED WITHIN SPILL CONTAINMENT AREA
GERAGHTY & MILLER, INC.
IMS 13

APPENDIX E- l
RESULTS OF ANALYSES FOR VOLATILE ORGANIC CHEMICALS IN CONTAINMENT AREA SOILS, AUGUST 15, 1989
Note: Units for concentrations of volatile organic compounds are mg/kg, and not ppm, as indicated on the laboratory reporting forms
GERAGHTY & MILLER, INC.
100214

MARTEL Certificate of Laboratory Analysis
Martel Laboratory Services, Inc. 1025 Cromwell Bridge Road Baltimofe, Maryland 21204 (301)825-7790
'invoice Number 02417
Sample W-4075
Samples received by Martel. Project PA0418MV07; LCP-Moundsville
Geraghty & Miller, Inc. Washington Trust Building Room 429 Washington, Pennsylvania 15301 Attention: Tim Ratvasky
August 15, 1989
Client Identification: GERAWASH
Log Identification: W-4075 Date Received: 07/21/89
Sample Id: N-l-0-1
Volatile Organic Compounds EPA 601 see attached
Sample Id: N-2-4-4.8
Volatile Organic Compounds EPA 601 see attached
Sample Id: N-3-6-7
V o l a t i l e Organic Compounds EPA 601 see attached
Sample Id: E-l-4-5
V o l a t i l e Organic Compounds EPA 601 see attached
Sample Id: E-l-9-10
V o l a t i l e Organic Compounds EPA 601 see attached
100215

Certificate of Laboratory Analysis
Martel U±KXatory Services, Inc. 1025 Cromwell Bridge Road Baltimore, Maryland 21204 (301) 825-7790
Client Identification: GERAWASH Log Identification: W-4075 August 15, 1989 Page 2
Sample Id: E-2-4-5
Volatile Organic Compounds EPA 601 see
A l l procedures followed were in accordance with EPA-600/4-79-020, "Methods for Chemical Analysis of Water and Wastes", or SW-846, "Test Methods for Evaluating Solid Waste", 1986.
j^feephcT Wddfkill II Vice President
100216 •
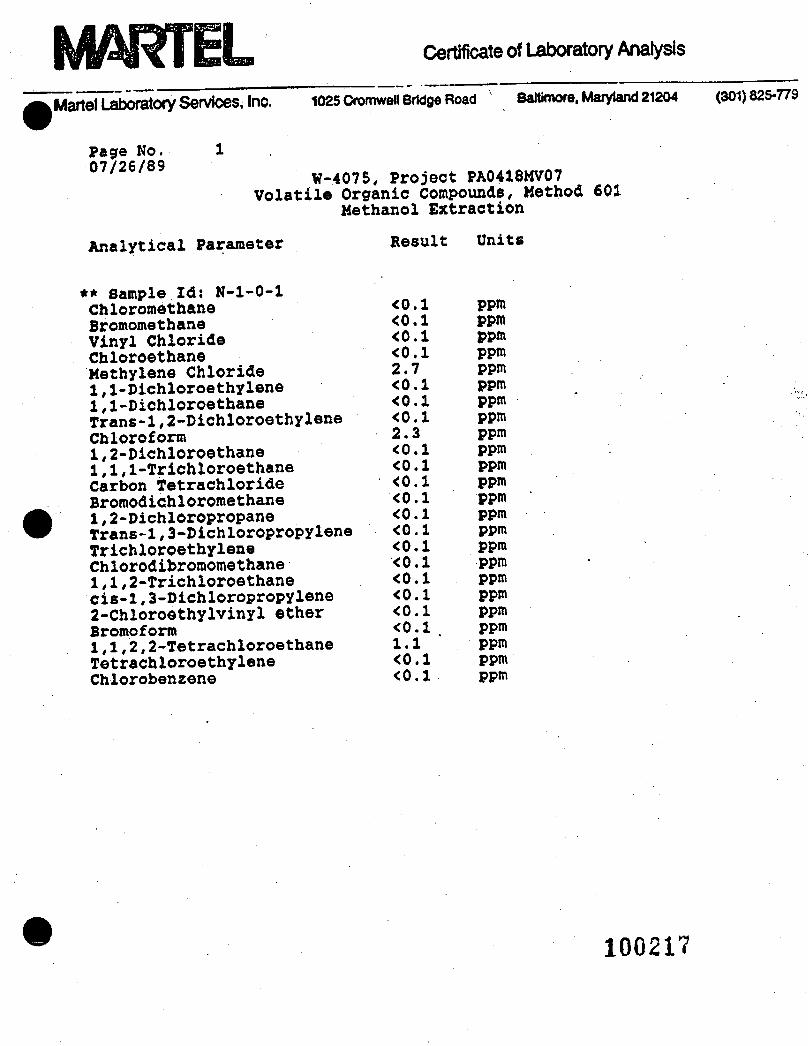
Certificate of Laboratory Analysis
Martel laboratory Services,Inc. 1025 OromweH Bridge Road v Baltimore, Maryland 21204 (301)825-779
Page No. 1 0 7 / 2 6 / 8 9 W-4075, Project PA0418MV07
Volatile Organic compounds, Method 601 Methanol Extraction
Analytical Parameter Result Units
** Sample Id: N-l-0-1 Chlororoethane <0.1 PPra
Bromomethane <0-l PPro
Vinyl Chloride <0.1 PPm Chloroethane <0.l PPm Methylene Chloride 2.7 ppm 1,1-Dichloroethylene <0.1 ppm 1.1- Dichloroetbane <0.1 ppm Trans-l,2-Dichloroethylene <0.1 ppm Chloroform 2.3 ppm 1.2- Dichloroethane <0.1 ppm 1.1.1- Trichloroethane <0.1 ppm Carbon Tetrachloride <0.1 ppm Bromodichloromethane <0.1 ppm 1,2-Dichloropropane <0.1 ppm Trans-l,3-Dichloropropylene <0.1 ppm Trichloroethylene <0.1 ppm Chlorodibroraomethane <0.1 ppm 1.1.2- Trichloroethane <0.1 ppm cis-l,3-Dichloropropylene <0.1 ppm 2-Chloroethylvinyl ether <0.1 ppm Bromoform <0.1 . ppm 1,1,2,2-Tetrachloroethane 1.1 Ppm Tetrachloroethylene <0.1 ppm Chlorobenzene <0.1 ppm
100217

Certificate of Laboratory Analysis
Martel Laboratory Services, Inc. 1025 Cromwell Bridge Road Baltimore, Maryland 21204 (301)825-775
Page No. 2 0 7 / 2 6 / 8 9 W-4075, Project PA0418MV07
Volatile Organic Compounds, Method 601 Methanol Extraction
Analytical Parameter Result Onits
** Sample Id: N-2-4-4.8 Chloromethane <J.l PP* Bromomethane <0.1 PJ™ Vinyl Chloride <0.1 PP« Chloroethane <0.l PP«» Methylene Chloride 3.9 ppm 1,1-Dichloroethylene <0.1 ppm 1.1- Dichloroethane <0.1 PPm Trans-l,2-Dichloroethylene <0.1 ppm Chloroform 2.8 ppm 1.2- Dichloroethane <0.1 PPm 1.1.1- Trichloroethane <0.1 PPm
Carbon Tetrachloride <0.1 ppm Bromodichloromethane <0.1 ppm 1,2-Dichloropropane <$.l PPm Trans-l,3-Dichloropropylene <0.1 ppm Trichloroethylene <0.1 PPm Chlorodibromomethane <0.1 Ppm 1.1.2- Trichloroethane <0.1 ppm cis-l,3-Dichloropropylene <0.1 ppm 2-Chloroethylvinyl ether <0.1 ppm Bromoform <0.1 PPn» 1,1,2,2-Tetrachloroethane 0.8 ppm Tetrachloroethylene <0.1 ppm Chlorobenzene <0.1 PPm
100218

Certificate of Laboratory Analysis
Martel Lavatory Services, Inc. 1025 Cromwell Bridge Road Baltimore, Maryland 21204 (301) 825-77S
Page No. 3 07/26/89
W-4075, Project PA0418MV07 Volatile Organic Compounds, Method 601
Methanol Extraction
Analytical Parameter Result Units
** Sample Id: N-3-6-7 Chloromethane <0.1 ppm Bromoraethane <0.1 ppm Vinyl Chloride <0.1 ppm Chloroethane <0.1 ppm Methylene Chloride 0.1 ppm 1,1-Dichloroethylene <0.1 ppm 1.1- Dichloroethane <0.1 ppm Trans-l,2-Dichloroethylene <0.1 ppm Chloroform <0.1 ppm 1.2- Dichloroethane <0.1 ppm 1.1.1- Trichloroethane <0.1 ppm Carbon Tetrachloride <0.1 ppm Bromodichlororaethane <0.1 ppm 1,2-Dichloropropane <0.1 ppm Trans-1,3-Dichloropropylene <0.1 ppm Trichloroethylene <0.1 ppm Chlorodibromomethane <0.1 ppm 1.1.2- Trichloroethane <0.1 ppm cis-l,3-Dichloropropylene <0.1 ppm 2-Chloroethylvinyl ether <0.1 ppm Bromoform <0.1 ppm 1,1,2,2-Tetrachloroethane 0.2 ppm Tetrachloroethylene <0.1 ppm Chloroben2ene <0.1 ppm
100219
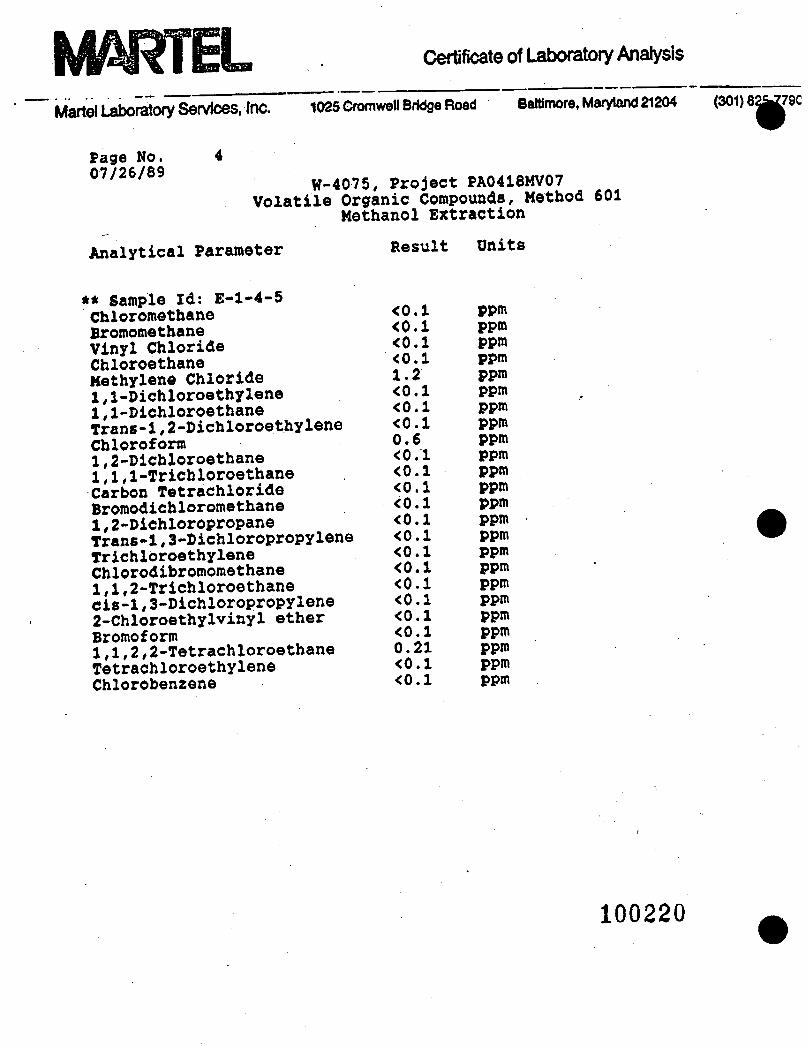
Certificate of Laboratory Analysis
Mattel l^r^ory Services, Inc. 1025 Cromwell Bridge Road Baltimore, Maryland 21204
Page No. 4 0 7 / 2 6 / 8 9 W-4075, Project PA0418MV07
Volatile Organic Compounds, Method 601 Methanol Extraction
Analytical Parameter Result Units
** Sample Id: E-l-4-5 Chloromethane <°-} fP» Bromomethane <0.1 PP» Vinyl Chloride <0.1 PPm Chloroethane <0;1 PP" Methylene Chloride 1-2 ppm 1,1-Dichloroethylene <0.1 ppm 1.1- Dichloroethane <0-J PPm
Trans-1,2-Dichloroethylene <0.1 ppm Chloroform 0.6 PPm 1.2- Dichloroethane <0.1 PPm 1.1.1- Trichloroethane <0.1 ppm Carbon Tetrachloride <0.1 ppm Bromodichloromethane <0.1 ppm 1,2-Dichloropropane <0.1 ppm Trans-1,3-Dichloropropylene <0.1 ppm Trichioroethylene <0.1 Ppm Chlorodibromomethane <0.1 ppm 1.1.2- Trichloroethane <0.1 ppm cis-1,3-Dichloropropylene <0.1 ppm 2-Chloroethylvinyl ether <0.1 ppm Bromoform <°;J PPm
1,1,2,2-Tetrachloroethane 0.21 ppm Tetrachloroethylene <0.1 PPm Chloroben2ene <0.1 PPm
100220

Certificate of Laboratory Analysis
M ^ U t ^ A o r y Services. Inc. 1025 CromweU Bridge Road Baltimore, Maryland 21204 (301) 825-779C
Page No. 07/26/89 W-4075, Project PA0418MV07
Vol a t i l e Organic Compounds, Method 601 Methanol Extraction
Analytical Parameter Result Units
** Sample Id: E-2-4-5 Chloromethane Bromomethane Vinyl Chloride Chloroethane Methylene Chloride 1,1-Dichloroethylene 1.1- Dichloroethane Trans-l,2-Dichloroethylene Chloroform 1.2- Dichloroethane 1.1.1- Trichloroethane Carbon Tetrachloride Bromodichlororaethane 1,2-Dichloropropane Trans-1,3-Dichloropropylene Trichloroethylene Chlorodibromomethane 1.1.2- Trichloroethane cis-1,3-Dichloropropylene 2-Chloroethylvinyl ether Bromoform 1,1,2,2-Tetrachloroethane Tetrachloroethylene Chlorobenzene
<0.5 <0.5 <0.5 <0.5 <0.5 <0.5 <0.5 <0.5 6.0 <0.5 <0.5 <0.5 <0.5 <0.5 <0.5 <0.5 <0.5 <0.5 <0.5 <0.5 <0.5 0.8 <0.5 <0.5
ppm PPm PPm PPm PPm Ppm ppm PPm ppm ppm PPm ppm ppm ppm ppm ppm ppm ppm PPm PPm PPm PPm ppm ppm
100221

Certificate of Laboratory Analysis
Martel Laboratory Services, Inc. 1025 Cromwell Bridge Road Baltimore, Maryland 21204 (301)
Page No. 5 0 7 / 2 6 / 8 9 W-4075, Project PA0418MV07
Vol a t i l e Organic Compounds, Method 601 Methanol Extraction
Analytical Parameter Result Units
** Sample Id: E-l-9-10 Chloromethane <0.1 PPm Bromomethane <0.1 PPm Vinyl Chloride <0.1 PPm Chloroethane <0.1 PP» Methylene Chloride <0.1 Ppm 1,1-Dichloroethylene <0.1 ppm 1.1- Dichloroethane <0.1 ppm Trans-l,2-Dichloroethylene <0.1 ppm Chloroform <0.1 PP»* 1.2- Dichloroethane <0.1 ppm 1.1.1- Trichloroethane <0.1 ppm Carbon Tetrachloride <0.1 ppm Bromodichloromethane <0.1 ppm 1,2-Dichloropropane <0.1 ppm Trans-1,3-Dichloropropylene <0.1 ppm Trichloroethylene <0.1 ppm Chlorodibromomethane <0.1 ppm 1.1.2- Trichloroethane <0.1 ppm cis-l,3-Dichloropropylene <0.1 ppm 2-chloroethylvinyl ether <0.1 ppm Bromoform <0.1 Ppm 1,1,2,2-Tetrachloroethane <0.1 ppm Tetrachloroethylene <0.1 ppm Chlorobenzene <0.1 ppm
ICO.222

APPENDIX E-2
RESULTS OF ANALYSES PERFORMED ON SOIL SAMPLES COLLECTED FROM BORING AS-AH-1, NOVEMBER 28, 1989
100223
GERAGHTY & MILLER. INC.

MARTEL Certificate of Laboratory Analysis
M A R T E L L A B O R A T O R Y S E R V I C E S . INC. 1025Cromwell Bridge Road Baltimore. Maryland 21204 (301)825-7790 5920 North Belt, Suite 111 Houston. Texas 77396 (713)441-4965 Capital Airport Springfield. Illinois 62707 (217)522-0009
Invoice Number~ 3509
Sample W-5447
Samples received by Martel. Project identification: PAV0408-2 LCP-Acid Spill
Geraghty & Miller, Inc. Washington Trust Building Boom 429 Washington, Pennsylvania 15301 Attention: Tim Ratvasky
November 28, 1989
Client Identification: 6ERAWASH
Log Identification: W-5447 Date Received: 10/06/89
Sample Id: AS-AH, 0-2
PH Free Sulfuric Acid
EPA 150.1 0.6 23.8 %
Sample Id: AS-AH, 2-4
PH Free Sulfuric Acid Dimethyl Sulfate Volatile Organic Compounds
EPA 150.1
EPA 8010
0.3 22.2 *
see attached
Sample Id: AS-AH, 4-6
PH Free Sulfuric Acid Dimethyl Sulfate Volatile Organic Compounds Volatile Organic Compounds Volatile Organic Compounds Arsenic Barium Cadmium Chromium Lead (total) Mercury Selenium
EPA 150.1
EPA 8010 EPA 8020 EPA 8240 EPA 206.2 EPA 200.7 EPA 213.1 EPA 218.1 EPA 239.1 EPA 245.1 EPA 270.2
0.7 24.0
see see see 7.4 95 <1 38
&p022f <5
%
attached attached attached PPm ppm PPm PPm pm pm ppm
FACS 301-821-1054
A GEONEX Company

MARTEL Certificate of Laboratory Analysis
M A R T E L L A B O R A T O R Y S E R V I C E S . INC. 1025 Cromwell Bridge Road Baltimore. Maryland 21204 (301) 825-7790 5920 North Belt, Suite 111 Houston. Texas 77396 (713) 441-4965 Capital Airport Springfield, Illinois 62707 (217)522-0009
Client Identification: GERAWASH Log Identification: W-5447 November 28, 1989 Page 2
Sample Id: AS-AH, 4-6
Silver EPA 272.1 <1 ppm
Sample Id: AS-AH, 6-8, upper
PH Free Sulfuric Acid
EPA 150.1 0.9 13.8
Sample Id: AS-AH, 6-8, lower
PH Free Sulfuric Acid
EPA 150.1 1.5 18.0 %
Sample Id: AS-AH, 8-10
pH Free Sulfuric Acid Dimethyl Sulfate Volatile Organic Compounds
EPA 150.1
EPA 8010
1.3 14.7 *
see attached
Sample Id: AS-AH, 10-12
pH Free Sulfuric Acid
EPA 150.1 .0.6 22.4 %
Sample Id: AS-AH, 12-14
PH Free Sulfuric Acid Dimethyl Sulfate Volatile Organic Compounds
FACS 301-821-1054
A GEOr<£X Company
EPA 150.1
EPA 8010
2.4 7.8 *
see attached
100225

MARTEL Certificate of Laboratory Analysis
M A R T E L L A B O R A T O R Y S E R V I C E S , INC. 1025Cromwell Bridge Road Baltimore. Maryland 21204 (301)825-7790 5920 North Belt. Suite 111 Houston. Texas 77396 (713)441-4965 Capital Airport Springfield. Illinois 62707 (217)522-0009
Client Identification: GERAWASH Log Identification: W-5447 November 28, 1989 Page 3
Sample Id: AS-AH, 14-16
PH EPA 150.1 1.8 Free Sulfuric Acid 8.5 %
Sample Id: AS-AH, 16-18
pH Free Sulfuric Acid Dimethyl Sulfate Volatile Organic Compounds
EPA 150.1
EPA 8010
6.1 <200
see
mg/kg
attached
Sample Id: AS-AH, 18-20
PH Free Sulfuric Acid Dimethyl Sulfate Volatile Organic Compounds Volatile Organic Compounds
EPA 150.1
EPA 8010 EPA 8020
4.7 <200 * see see
mg/kg
attached attached
A l l procedures followed were i n accordance with EPA-600/4-79-020, "Methods for Chemical Analysis of Water and Wastes", or SW-846, "Test Methods for Evaluating Solid Waste", 1986. *Dimethyl sulfate method not available.
'Joseph C. W o l f k i l l II President
100226 FACS 301-821-1054
A GEONEX Company

MARTEL Certificate of Laboratory Analysis
M A R T E L L A B O R A T O R Y S E R V I C E S . INC. ' 1025Cromwell Bridge Road Baltimore, Maryland 21204 (301)825-7790 5920 North Belt, Suite 111 Houston, Texas 77396 (713)441-4965 Capital Airport Springfield, Illinois 62707 (217) 522-0009
Page No. 1 11/29/89
EPA Priority Pollutant Analysis
Analytical Parameter Result Detection Units Limit
** AS-AH, 2-4 Chloromethane Bromomethane Vinyl Chloride Chloroethane Methylene Chloride 1,1-Dichloroethylene 1.1- Dichloroethane Trans-1,2-Dichloroethylene Chloroform 1.2- Dichloroethane 1.1.1- Trichloroethane Carbon Tetrachloride Bromodichloromethane 1,2-Dichloropropane Trans-1,3-Dichloropropylene Trichloroethylene Chlorodibromomethane 1.1.2- Trichloroethane cis-1,3-Dichloropropylene 2-Chloroethylvinyl ether Bromoform 1,1,2,2-Tetrachloroethane Tetrachloroethylene Chlorobenzene *1,1,2-Trichlorotrifluoroethane
ND ND ND ND 2500 ND ND ND 510 ND ND . ND 71 ND ND ND ND ND ND ND ND ND 340 ND 29%
50 50 50 50 50 50 50 50 50 50 50 50 50 50 50 50 50 50 50 50 50 50 50 50 Recovery
ug/kg ug/kg ug/kg ug/kg ug/kg ug/kg ug/kg ug/kg ug/kg ug/kg ug/kg ug/kg ug/kg ug/kg ug/kg ug/kg ug/kg ug/kg ug/kg ug/kg ug/kg ug/kg ug/kg ug/kg
FACS 301-821-1054
A GEONEX Company
100227

MARTEL Certificate of Laboratory Analysis
M A R T E L L A B O R A T O R Y S E R V I C E S , INC.
Page No. 11/29/89
Analytical Parameter
1025Cromwell Bridge Road Baltimore, Maryland 21204 (301)825-7790 5920 North Belt, Suite 111 Houston, Texas 77396 (713)441-4965 Capital Airport Springfield, Illinois 62707 (217) 522-0009
EPA Priority Pollutant Analysis
Result Detection Units Limit
** AS-AH, 4-6 Chloromethane Bromomethane Vinyl Chloride Chloroethane Methylene Chloride 1,1-Dichloroethylene 1.1- Dichloroethane Trans-1,2-Dichloroethylene Chloroform 1.2- Dichloroethane 1.1.1- Trichloroethane Carbon Tetrachloride Bromodichloromethane 1,2-Dichloropropane Trans-1,3-Dichloropropylene Trichloroethylene Chlorodibromomethane 1.1.2- Trichloroethane cis-1,3-Dichloropropylene 2-Chloroethylvinyl ether Bromoform 1,1,2,2-Tetrachloroethane Tetrachloroethylene Chlorobenzene *1,1,2-Trichlorotrifluoroethane Benzene Toluene Ethylbenzene •-Xylene (o- + p-) Xylenes *a,a,a-Trifluorotoluene
ND ND ND ND ND ND ND ND 5900 ND 1800 ND 870 ND ND 1400 ND ND ND ND ND ND 1700 ND 128% 1200 1300 1100 1800 2100 107%
500 500 500 500 500 500 500 500 500 500 500 500 500 500 500 500 500 500 500 500 500 500 500 500 Recovery 500 500 500 500 500 Recovery
ug/kg ug/kg ug/kg ug/kg ug/kg ug/kg ug/kg ug/kg ug/kg ug/kg ug/kg ug/kg ug/kg ug/kg ug/kg ug/kg ug/kg ug/kg ug/kg ug/kg ug/kg ug/kg ug/kg ug/kg
ug/kg ug/kg ug/kg ug/kg ug/kg
FACS 301-821-1054
A GEONEX Company

MARTEL Certificate of Laboratory Analysis
M A R T E L L A B O R A T O R Y S E R V I C E S . INC. 1025 Cromwell Bridge Road Baltimore. Maryland 21204 (301) 825-7790 5920 North Belt. Suite 111 Houston. Texas 77396 (713)441-4965 Capital Airport Springfield, Illinois 62707 (217)522-0009
Page No. 3 11/29/89 ,
EPA Priority Pollutant Analysis Analytical Parameter Result Detection Units
Limit
** AS-AH, 8-10 Chloromethane Bromomethane Vinyl Chloride Chloroethane Methylene Chloride 1,1-Dichloroethylene 1.1- Dichloroethane Trans-1,2-Dichloroethylene Chloroform 1.2- Dichloroethane 1.1.1- Trichloroethane Carbon Tetrachloride Bromodichloromethane 1,2-Dichloropropane Trans-1,3-Dichloropropylene Trichloroethylene Chlorodibromomethane 1.1.2- Trichloroethane cis-1,3-Dichloropropylene 2-Chloroethylvinyl ether Bromoform 1,1,2,2-Tetrachloroethane Tetrachloroethylene Chlorobenzene *1,1,2-Trichlorotrifluoroethane
ND ND ND ND 550 ND ND ND 410 ND ND ND 64 ND ND ND ND ND ND ND ND ND ND ND 17%
50 50 50 50 50 50 50 50 50 50 50 50 50 50 50 50 50 50 50 50 50 50 50 50 Recovery
ug/kg ug/kg ug/kg ug/kg ug/kg ug/kg ug/kg ug/kg ug/kg ug/kg ug/kg ug/kg ug/kg ug/kg ug/kg ug/kg ug/kg ug/kg ug/kg ug/kg ug/kg ug/kg ug/kg ug/kg
100229
FACS 301-821-1054
A GEONEX Company

j ^ X ^ R T E L Certificate of Laboratory Analysis
M A R T E L L A B O R A T O R Y S E R V I C E S . INC. 1025 Cromwell Bridge Road Baltimore. Maryland 21204 (301)825-7790 5920 North Belt, Suite 111 Houston, Texas 77396 (713)441-4965 Capital Airport Springfield, Illinois 62707 (217)522-0009
Page No. 4 3.1/29 /89
EPA Priority Pollutant Analysis
Analytical Parameter Result Detection Units Limit
** AS-AH, 12-14 Chloromethane Bromomethane Vinyl Chloride Chloroethane Methylene Chloride 1,1-Dichloroethylene 1.1- Dichloroethane Trahs-1,2-Dichloroethylene Chloroform 1.2- Dichloroethane 1.1.1- Trichloroethane Carbon Tetrachloride Bromodichloromethane 1,2-Dichloropropane Trans-1,3-Dichloropropylene Trichloroethylene Chlorodibromomethane 1.1.2- Trichloroethane cis-1,3-Dichloropropylene 2-Chloroethylvinyl ether Bromoform 1,1,2,2-Tetrachloroethane Tetrachloroethylene Chlorobenzene *1,1,2-Trichlorotrifluoroethane
ND ND ND ND ND ND ND ND ND ND ND ND ND ND ND ND ND ND ND ND ND ND 36 ND 68%
25 25 25 25 25 25 25 25 25 25 25 25 25 25 25 25 25 25 25 25 25 25 25 25 Recovery
ug/kg ug/kg ug/kg ug/kg ug/kg ug/kg ug/kg ug/kg ug/kg ug/kg ug/kg ug/kg ug/kg ug/kg ug/kg ug/kg ug/kg ug/kg ug/kg ug/kg ug/kg ug/kg ug/kg ug/kg
FACS 301-821-1054
AGEONEX Company
100230

MARTEL Certificate of Laboratory Analysis
M A R T E L L A B O R A T O R Y S E R V I C E S , INC. 1025Cromwell Bridge Road Baltimore. Maryland 21204 (301)825-7790 5920 North Belt, Suite 111 Houston. Texas 77396 (713) 441-4965 Capital Airport Springfield, Illinois 62707 (217) 522-0009
Page No. 5 11/29/89
EPA Priority Pollutant Analysis
Analytical Parameter Result Detection Units Limit
** AS-AH, 16-18 Chloromethane Bromomethane Vinyl Chloride Chloroethane Methylene Chloride 1,1-Dichloroethylene 1.1- Dichloroethane Trans-1,2-Dichloroethylene Chloroform 1.2- Dichloroethane 1.1.1- Trichloroethane Carbon Tetrachloride Bromodichloromethane 1,2-Dichloropropane Trans-1,3-Dichloropropylene Trichloroethylene Chlorodibromomethane 1.1.2- Trichloroethane cis-1,3-Dichloropropylene 2-Chloroethylvinyl ether Bromoform' 1,1,2,2-Tetrachloroethane Tetrachloroethylene Chlorobenzene *1,1,2-Trichlorotrifluoroethane
ND ND ND ND ND ND ND ND ND ND ND ND ND ND ND ND ND ND ND ND ND ND ND ND 13%
50 50 50 50 50 50 50 50 50 50 50 50 50 50 50 50 50 50 50 50 50 50 50 50 Recovery
ug/kg ug/kg ug/kg ug/kg ug/kg ug/kg ug/kg ug/kg ug/kg ug/kg ug/kg ug/kg ug/kg ug/kg ug/kg ug/kg ug/kg ug/kg ug/kg ug/kg ug/kg ug/kg ug/kg ug/kg
FACS 301-821-1054
A GEONEX Company
100231

MARTEL Certificate of Laboratory Analysis
M A R T E L L A B O R A T O R Y S E R V I C E S , INC.
Page No. 11/29/89
Analytical Parameter
1025 Cromwell Bridge Road Baltimore. Maryland 21204 (301)825-7790 5920 North Belt. Suite 111 Houston, Texas 77396 (713) 441-4965 Capital Airport Springfield. Illinois 62707 (217) 522-0009
EPA Priority Pollutant Analysis
Result Detection Units Limit
** AS-AH, 18-20 Chloromethane Bromomethane Vinyl Chloride Chloroethane Methylene Chloride 1,1-Dichloroethylene 1.1- Dichloroethane Trans-1,2-Dichloroethylene Chloroform 1.2- Dichloroethane 1.1.1- Trichloroethane Carbon Tetrachloride Bromodichloromethane 1,2-Dichloropropane Trans-1,3-Dichloropropylene Trichloroethylene Chlorodibromomethane 1.1.2- Trichloroethane cis-1,3-Dichloropropylene 2-Chloroethylvinyl ether Bromoform 1,1,2,2-Tetrachloroethane Tetrachloroethylene Chlorobenzene *1,1,2-Trichlorotrifluoroethane Benzene Toluene Ethylbenzene m-Xylene (o- + p-) Xylenes *a,a,a-Trifluorotoluene
ND ND ND ND ND ND ND ND ND ND ND ND 59 ND ND ND ND ND ND ND ND ND ND ND Matrix ND 29 ND ND ND 91%
50 50 50 50 50 50 50 50 50 50 50 50 50 50 50 50 50 50 50 50 50 50 50 50 Effects 25 25 25 25 25 Recovery
ug/kg ug/kg ug/kg ug/kg ug/kg ug/kg ug/kg ug/kg ug/kg ug/kg ug/kg ug/kg ug/kg ug/kg ug/kg ug/kg ug/kg ug/kg ug/kg ug/kg ug/kg ug/kg ug/kg ug/kg
ug/kg ug/kg ug/kg ug/kg ug/kg
100232 0
FACS 301-821-1054
A GEOMEX Company

MARTEL Certificate of Laboratory Analysis
M A R T E L L A B O R A T O R Y S E R V I C E S , INC. 1025Cromwell Bridge Road Baltimore. Maryland 21204 (301)825-7790 5920 North Belt, Suite 111 Houston. Texas 77396 (713) 441 -4965 Capital Airport Springfield, Illinois 62707 (217)522-0009
Page No. 7 11/29/89
EPA Priority Pollutant Analysis
Analytical Parameter Result Detection Units Limit
** AS-AH, 4-6 *a,a,a-Trifluorotoluene Acetone Acrolein Acrylonitrile Bromomethane Carbon Disulfide Chloroethane Chloroform Chloromethane Dichlorodifluoromethane 1.1- Dichloroethane 1.2- Dichloroethylene (total) 1.1- Dichloroethylene 1.2- Dichloroethane Methylene chloride Trichlorofluoromethane Vinyl chloride •Trichlorotrif luoroethane Benzene Bromodichloromethane Bromoform 2-Butanone Carbon tetrachloride Chlorodibromomethane 2-Chloroethyl vinyl ether Dibromomethane 1,4-Dichloro-2-butene 1,2-Dichloropropane cis-1,3-Dichloropropylene trans-1,3-Dichloropropylene 1.1.1- Trichloroethane 1.1.2- Trichloroethane Trichloroethylene Vinyl acetate Bromofluorobenzene Chlorobenzene Ethylbenzene Ethyl methacrylate 2-Hexanone 4-Methyl-2-pentanone Styrene 1,1,2,2-Tetrachloroethane Tetrachloroethylene Toluene
FAt$?^MT0% C h l O r O P r° P a n e
xylenes A GEONEX Company
74% Recovery ND 100 ug/kg ND 7 ug/kg ND 5 ug/kg ND 10 ug/kg ND 5 ug/kg ND 10 ug/kg 14000 5 ug/kg ND 10 ug/kg ND 100 ug/kg ND 5 ug/kg ND 5 ug/kg ND 5 ug/kg 8 5 ug/kg 890 5 ug/kg ND 5 ug/kg ND 10 ug/kg Matrix Effects ND 5 , ug/kg ND 5 ug/kg ND 5 ug/kg ND 100 ug/kg 20 5 ug/kg ND 5 ug/kg ND 10 ug/kg ND 100 ug/kg ND 100 ug/kg ND 5 ug/kg ND 5 ug/kg ND 5 ug/kg ND 5 ug/kg ND 5 ug/kg 8 5 ug/kg ND 50 ug/kg ND 5 ug/kg ND 5 ug/kg ND 5 ug/kg ND 100 ug/kg ND 50 ug/kg
5° ioo2$g ND 5 ug/kg ND 5 ug/kg 57 5 ug/kg ND 10 ug/kg ND 5 ug/kg

'GERAGHTY f& MILLER, INC.
'Ground- Water Services
Project Number Project Location
Laboratory
Sampler® {ficMfi d\cyfa/flof
V)r£<;irVU)OQM o M d h t e SAMPLE IDENTITY Sampled
CHAIN-OF45USTODY RECORD Fege_JL__ of_/L
7(000 L 2 - * / _L2QL
_2L
\uvQ JUlDSL.
Relirxjuish9i^:^6fe^ Organization: jLt\/C-Received bg» / k.~£JfC/M /C \ / Organization: QPj
Total No. of Bottles/ Containers
•me Kl£> ;Timfl / f y i " "
Intact? 'es\)No N/A
Relinquishi Received
Organization: Organization:
Date. _L_J_ D a t e _ J L _ L .
.Time.
.Time. Seal Intact?
Yes No N/A
Special Instructions/Remarks: <Zi'tTF n* fP. i+no , J * fl- ^ > " > » ^ » Q |
r • 1 T r i ^ j i f f .^fi j ^ r Delivery^thod: • In Person ^[Cornmon Carrier ISP>^~__
it
5J[Cornmon Carrier

APPENDIX E-3
RESULTS OF ANALYSES FOR VOLATILE ORGANIC CHEMICALS IN TANK FARM MONITORING WELL-WATER SAMPLES, SEPTEMBER 11, 1989
1002
GERAGHTY & MILLER, INC.

MARTEL Certificate of Laboratory Analysis
M A R T E L L A B O R A T O R Y S E R V I C E S , INC. 1025 Cromwell Bridge Road Baltimore. Maryland 21204 (301)825-7790 5920 North Belt. Suite 111 Houston. Texas 77396 (713)441-4965 Capital Airport Springfield, Illinois 62707 (217)522-0009
Invoice Number 02685
Sample W-4613 Four samples received by Martel Laboratory Services, Inc. Purchase Order Number PA00407,LCP-WV.
Geraghty & Miller, Inc. Washington Trust Building Room 429 Washington, Pennsylvania 15301 Attention: Mr. Tim Ratvasky
September 11, 1989
Client Identification: GERAWASH
Log Identification: W-4613 Date Received: OB/22/89
Sample Id: TW-1
Volatile Organic Compounds EPA 624 see attached
Sample Id: TW-2
Volatile Organic Compounds EPA 624 see attached
Sample Id: TW- 5"
Volatile Organic Compounds EPA 624 see attached
Sample Id: TW-6
Volatile Organic Compounds EPA 624 see attached
FACS 301-821-1054
A GEONEX Company
100236

MARTEL Certificate of Laboratory Analysis
M A R T E L L A B O R A T O R Y S E R V I C E S . INC. 1025 Cromwell Bridge Road Baltimore. Maryland 21204 (301)825-7790 5920 North Belt, Suite 111 Houston, Texas 77396 (713)441-4965 Capital Airport Springfield. Illinois 62707 (217)522-0009
Client Identification: GERAWASH September 11, 1989 Page 2
All procedures followed were in accordance with EPA-600/4-79-020, "Methods for Chemical Analysis of Water and Wastes" or "Standard Methods for the Examination of Water and Wastewater", 16th Edition, APHA, 1985.
>seph C. Wolf k i l l II President
FACS 301-821-1054
A GEONEX Company
100237

MARTEL M A R T E L L A B O R A T O R Y S E R V I C E S . INC. 1025Cromwell Bridge Road Baltimore. Maryland 21204 (301)825-7790
5920 North Belt, Suite 111 Houston, Texas 77396 (713) 441 -4965 Capital Airport Springfield, Illinois 62707 (217)522-0009
Page No. 1 09/09/89
Priority Pollutant Analysis EPA Method 624 Volatile Organic Analysis
Analytical Parameter Result Detection Units Limit
** TW-1 Chloromethane Bromomethane Vinyl Chloride Chloroethane Acrolein Acrylonitrile Methylene Chloride Trichlorofluoromethane 1,1-Dichloroethylene 1.1- Dichloroethane Trans-1,2-Dichloroethane Chloroform 1.2- Dichloroethane 1.1.1- Trichloroethane Carbon Tetrachloride Bromodichloromethane 1,1,2,2-Tetrachloroethane 1,2-Dichloropropane Trans-1,3-Dichloropropylene Trichloroethylene Chlorodibromomethane 1.1.2- Trichloroethane Benzene cis-1,3-Dichloropropylene 2-Chloroethylvinyl ether Bromoform Tetrachloroethylene Toluene Chlorobenzene Ethylbenzene Xylenes (o-,m-,p-)
ND <50 ug/1 ND <50 ug/1 ND <50 ug/1 ND <50 ug/1 ND <500 ug/1 ND <500 ug/1 ND <25 ug/1 ND <25 ug/1 ND <25 ug/1 ND <25 ug/1 ND <25 ug/1 9600 <25 ug/1 ND <25 ug/1 ND <25 ug/1 ND <25 ug/1 ND <25 ug/1 ND <25 ug/1 ND <25 ug/1 ND <25 ug/1 ND <25 ug/1 ND <25 ug/1 ND <25 ug/1 56 <25 ug/1 ND <25 ug/1 ND <50 ug/1 ND <25 ug/1 ND <25 ug/1 ND <25 ug/1 40 <25 ug/1 ND <25 ug/1 ND <25 ug/1
100238
FACS 301-821-1054
A GEONEX Company

MARTEL M A R T E L L A B O R A T O R Y S E R V I C E S , INC. 1025 Cromwell Bridge Road Baltimore. Maryland 21204 (301)825-7790
5920 North Belt. Suite 111 Houston. Texas 77396 (713)441-4965 Capital Airport Springfield, Illinois 62707 (217)522-0009
Page No. 2 09/09/89
Priority Pollutant Analysis EPA Method 624 Volatile Organic Analysis
Analytical Parameter Result Detection Units Limit
** TW-2 Chloromethane Bromomethane Vinyl Chloride Chloroethane Acrolein Acrylonitrile Methylene Chloride Trichlorofluoromethane 1.1- Dichloroethylene 1, 1-Dichloroethane Trans-1,2-Dichloroethane Chloroform 1.2- Dichloroethane 1.1.1- Trichloroethane Carbon Tetrachloride Bromodichloromethane 1,1,2,2-Tetrachloroethane 1,2-Dichloropropane Trans-1,3-Dichloropropylene Trichloroethylene Chlorodibromomethane 1.1.2- Trichloroethane Benzene cis-1,3-Dichloropropylene 2-Chloroethylvinyl ether Bromoform Tetrachloroethylene Toluene Chlorobenzene Ethylbenzene Xylenes (o-,m-,p-)
ND <50 ug/1 ND <50 ug/1 ND <50 ug/1 ND <50 ug/1 ND <500 ug/1 ND <500 ug/1 ND <25 ug/1 ND <25 ug/1 ND <25 ug/1 ND <25 ug/1 ND <25 ug/1 ND <25 ug/1 ND <25 ug/1 ND <25 ug/1 ND <25 ug/1 ND <25 ug/1 ND <25 ug/1 ND <25 ug/1 ND <25 ug/1 ND <25 ug/1 ND <25 ug/1 ND <25 ug/1 470 <25 ug/1 ND <25 ug/1 ND <50 ug/1 ND <25 ug/1 ND <25 ug/1 ND <25 ug/1 170 <25 ug/1 ND <25 ug/1 ND <25 ug/1
FACS 301-821-1054
A GEONEX Company
100239

MARTEL M A R T E L L A B O R A T O R Y S E R V I C E S . INC. 1025Cromwell Bridge Road Baltimore, Maryland21204 (301)825-7790
5920 North Belt, Suite 111 Houston. Texas 77396 (713) 441-4965 Capital Airport Springfield. Illinois 62707 (217)522-0009
Page No. 3 09/09/89
Priority EPA Method 624
Analytical Parameter
** TW-6 Chloromethane Bromomethane Vinyl Chloride Chloroethane Acrolein Acrylonitrile Methylene Chloride Trichlorofluoromethane 1 ,1-Dichloroethylene 1.1- Dichloroethane Trans-1,2-Dichloroethane Chloroform 1.2- Dichloroethane 1.1.1- Trichloroethane Carbon Tetrachloride Bromodichloromethane 1,1,2,2-Tetrachloroethane 1,2-Dichloropropane Trans-1,3-Dichloropropylene Trichloroethylene Chlorodibromomethane 1.1.2- Trichloroethane Benzene
. cis-1,3-Dichloropropylene 2-Chloroethylvinyl ether Bromoform Tetrachloroethylene Toluene Chlorobenzene Ethylbenzene Xylenes (o-,m-,p-)
Pollutant Analysis Volatile Organic Analysis
Result Detection Units Limit
ND <50 ug/1 ND <50 ug/1 ND <50 ug/1 ND <50 ug/1 ND <500 ug/1 ND <500 ug/1 ND <25 ug/1 ND <25 ug/1 ND <25 ug/1 ND <25 ug/1 ND <25 ug/1 ND <25 ug/1 ND <25 ug/1 ND <25 ug/1 ND <25 ug/1 ND <25 ug/1 ND <25 ug/1 ND <25 ug/1 ND <25 ug/1 ND <25 ug/1 ND <25 ug/1 ND <25 ,ug/l 270 <25 ug/1 ND <25 ug/1 ND <50 ug/1 ND <25 ug/1 ND <25 ug/1 32 <25 ug/1 93 <25 ug/1 ND <25 ug/1 120 <25 ug/1
100240 FACS 301-821-1054
A GEONEX Company

MARTEL M A R T E L L A B O R A T O R Y S E R V I C E S . INC. 1025Cromwell Bridge Road Baltimore, Maryland 21204 (301)825-7790
5920 North Belt, Suite 111 Houston, Texas 77396 (713)441-4965 Capital Airport Springfield, Illinois 62707 (217)522-0009
Page No. 4 09/09/89
Priority Pollutant Analysis EPA Method 624 Volatile Organic Analysis
Analytical Parameter Result Detection Units Limit
** TW-8. 6* Chloromethane ND <50 ug/1 Bromomethane ND <50 ug/1 Vinyl Chloride ND <50 ug/1 Chloroethane ND <50 ug/1 Acrolein ND <500 ug/1 Acrylonitrile ND <500 ug/1 Methylene Chloride ND <25 ug/1 Trichlorofluoromethane ND <25 ug/1 1,1-Dichloroethylene ND <25 ug/1 1.1- Dichloroethane ND <25 ug/1 Trans-1,2-Dichloroethane ND <25 ug/1 Chloroform 49000 <25 ug/1 1.2- Dichloroethane ND <25 ug/1 1.1.1- Trichloroethane ND <25 ug/1 Carbon Tetrachloride ND <25 ug/1 Bromodichloromethane ND <25 ug/1 1,1,2,2-Tetrachloroethane ND <25 ug/1 1,2-Dichloropropane ND <25 ug/1 Trans-1,3-Dichloropropylene ND <25 ug/1 Trichloroethylene ND <25 ug/1 Chlorodibromomethane ND <25 ug/1 1.1.2- Trichloroethane ND <25 ug/1 Benzene 29 <25 ug/1 cis-1,3-Dichloropropylene ND <25 ug/1 2-Chloroethylvinyl ether ND <50 ug/1 Bromoform ND <25 ug/1 Tetrachloroethylene ND <25 ug/1 Toluene 48 <25 ug/1 Chlorobenzene ND <25 ug/1 Ethylbenzene ND <25 ug/1 Xylenes (o-,m-,p-) ND <25 ug/1
100241
FACS 301-821-1054
A GEONEX Company

^GEkAGHTY f& MILLER, INC.
Ground-Water Services
Project Number pA O Q H O 7 Project Location " u i v
Inhnrfltnry (V\ a r 4 c l
Samplers)
CHAIN-OF-CUSTODY RECORD Page—j. of_/_
Total Na of Bottles/ Containers 8
Relinqi Rece'r
q iehed by:, live* by: _
Organization: Organization:
Data ft I 2 J l * f t i m e n«ta / / Time.
Seal Intact? Yes No N/A
RelinqugQed by:. Receiv
Organization: Organization:
Date. Date.
1 L J L
.Time.
.Time. Seal Intact?
\es No N/A
Special Instructions/Remarks:
Delive ir>4Bi
.tf*f*s l y C,-f ^ et^LSqfc y^irstrt triune) , Let^ijJV
A / a V / D i V iT t T / O / t y - f
:hod: • In Person rVcommon Carrier-JjSm. • Lab Courier • Other

APPENDIX E-4
RESULTS OF ANALYSES PERFORMED ON SOIL VAPOR SAMPLES COLLECTED WITHIN SPILL CONTAINMENT AREA
100243
GERAGHTY 8 MILLER, INC.
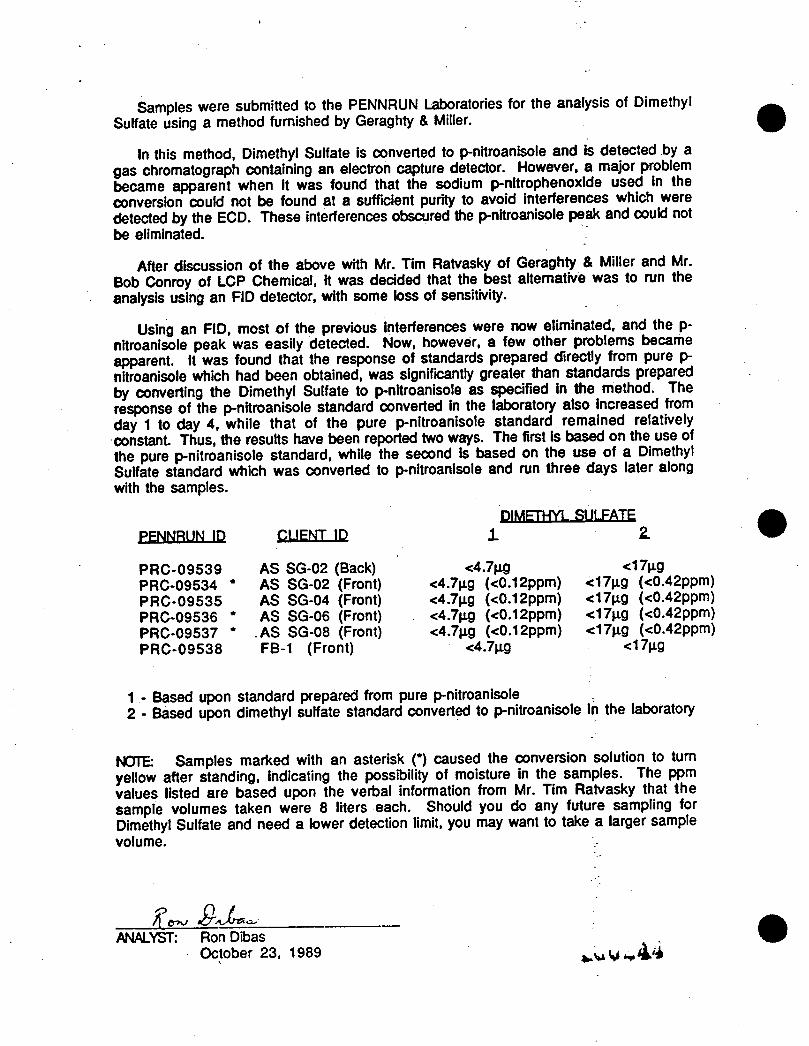
Samples were submitted to the PENNRUN Laboratories for the analysis of Dimethyl Sulfate using a method furnished by Geraghty & Miller.
In this method, Dimethyl Sulfate is converted to p-nitroanisole and is detected by a gas chromatograph containing an electron capture detector. However, a major problem became apparent when it was found that the sodium p-nitrophenoxide used in the conversion could not be found at a sufficient purity to avoid interferences which were detected by the ECD. These interferences obscured the p-nitroanisole peak and could not be eliminated.
After discussion of the above with Mr. Tim Ratvasky of Geraghty & Miller and Mr. Bob Conroy of LCP Chemical, it was decided that the best alternative was to run the analysis using an FID detector, with some loss of sensitivity.
Using an FID, most of the previous interferences were now eliminated, and the p-nttroanisole peak was easily detected. Now, however, a few other problems became apparent. It was found that the response of standards prepared directly from pure p-nitroanisole which had been obtained, was significantly greater than standards prepared by converting the Dimethyl Sulfate to p-nitroanisole as specified in the method. The response of the p-nitroanisole standard converted in the laboratory also increased from day 1 to day 4, while that of the pure p-nitroanisole standard remained relatively constant Thus, the results have been reported two ways. The first is based on the use of the pure p-nitroanisole standard, while the second is based on the use of a Dimethyl Sulfate standard which was converted to p-nitroanisole and run three days later along with the samples.
PENNRUN ID
PRC-09539 PRC-09534 PRC-09535 PRC-09536 PRC-09537 PRC-09538
CLIENT ID
AS SG-02 (Back) AS SG-02 (Front) AS SG-04 (Front) AS SG-06 (Front) AS SG-08 (Front) FB-1 (Front)
DIMFTHYL SULFATE 1 2.
<4.7jig <4.7u.g (<0.12ppm) <4.7u.g (<0.12ppm) <4.7u.g (<0.12ppm) <4.7u.g (<0.12ppm)
<4.7u,g
<17u.g <17jig (<0.42ppm) <17p.g (<0.42ppm) <17u.g (<0.42ppm) <17u.g (<0.42ppm)
<17u.g
1 - Based upon standard prepared from pure p-nitroanisole 2 - Based upon dimethyl sulfate standard converted to p-nitroanisole in the laboratory
NOTE Samples marked with an asterisk O caused the conversion solution to turn yellow after standing, indicating the possibility of moisture in the samples. The ppm values listed are based upon the verbal information from Mr. Tim Ratvasky that the sample volumes taken were 8 liters each. Should you do any future sampling for Dimethyl Sulfate and need a lower detection limit, you may want to take a larger sample volume.
ANALYST: Ron Dibas October 23, 1989

28-Sep-B? HICROSEEPS
GERAGHTY & MILLER, INC. ACID TANK AREA — PROJECT! PA00408 SOIL GAS CONCENTRATIONS (VOL/VOL)
SAMPLE METHANE ETHANE PROPANE I-BUTANE N-BUTANE ETHYLENE PROPYLENE SAMPLE I PPB PPB PPB . PPB PPB PPB PPB t
SG 1 6387 400 207 S3 59 2hh 328 SG 1 SG 2 9149 965 574 62 243 2B3 338 S6 2 S6 3 8756 782 456 104 213 252 316 SG 3 SG 4 24313 2088 1092 115 431 636 636 SG 4 SG 5 53625 6363 2649 144 775 1417 1225 SG 5 SG 6 12353 1510 775 35 273 374 501 SG 6 SG 7 6029 367 197 48 78 162 158 SG 7 SG 8 20868 2063 885 124 310 617 763 SG 8
BLANK 1 3963 26 13 22 ND ND ND BLANK 1 BLANK 2 1810 26 7 11 ND ND ND BLANK 2
NOTE: *ND' denotes not detected. Minima detection level is 5 ppb

28-Sep-B9 HI
GERAGHTY & MILLER, INC. ACID TANK AREA — PROJECT! PA00408
SOIL 6AS CONCENTRATIONS in PPM (VOL/VOL)
SAMPLE HETHONAL METHYLENE CHLOROFORM CARBON TETRA- TRICHLORO- TETRACHLORO- UNKNOWN SAMPLE • CHLORIDE CHLORIDE ETHYLENE ETHYLENE PK AREA *
SG 1 90 1780 447 ND ND ND 11869000 SG 1 SG 2 42 643 134 ND ND ND 6364500 SG 2 SG 3 30 896 207 ND ND ND 8841400 SG 3 SG 4 ND 2498 726 18 ND ND 4657600 SG 4 SG 5 131 806 145 ND ND ND 10392000 SG 5 SG 6 65 2043 459 ND ND ND 7277200 SG 6 SG 7 425 6342 1740 26 ND ND 23239000 SG 7 SG 8 389 11091 3911 138 4 3 43519000 SG 8
BLANK 1 ND ND ND ND ND ND ND BLANK 1 BLANK 2 ND 13 12 ND ND ND 5035 BLANK 2
NOTE: *ND' denotes not detected. Hiniaui detection level is approximately 2 ppa. Retention tiaes for •ethonal and chlorofora are 6/100ths ain. after
expected R.T. Positive identification is uncertain. Unknown peak area accounts for approximately 902 of the total chroaatograa area
100246