
CommBank Business Insights.€¦ · Proactive or reactive forces: ... In our survey we tested 15...
35
CommBank Business Insights. Navigating a changing market through innovation. National Report: FY18
Transcript of CommBank Business Insights.€¦ · Proactive or reactive forces: ... In our survey we tested 15...

CommBank Business Insights.Navigating a changing market through innovation.
National Report: FY18
ContentsKey insights 3Measuring innovation 7
The OECD innovation framework 7The CommBank Innovation Index 7Measuring 15 core drivers of innovation 7
Innovation breakthrough 8Making the leap from improvement to innovation 9Nationwide uplift 10Innovative behaviours 11
Innovation in Action: Strive Health 12Innovative mindset 14
Creating and embracing change 15Profile of an innovator 16
Innovation in Action: Bernadi's 18Innovation benefits and barriers 20
Proactive or reactive forces: What's driving innovation? 21Innovation in Action: CountryNet Software 22Return on investment 24
Investing in innovation 25Return on investment 26Cost savings and intangible benefits 27Timeframe to achieve a return on investment 28Innovation drives revenue growth 29
Reaping the rewards of innovation 30Areas of investment for Disruptors 31
Learnings from succesful innovators 32Empowered employees drive innovation 33Areas of innovation 34
Talk to us 35
CommBank Business InsightsFY18
2

Key insightsContinuing the upward innovation trajectoryOver the last year, Australian businesses have continued their innovation journey, with many reaping sizeable returns from an emerging innovation culture.
CommBank Business InsightsFY18
3
CommBank Business InsightsFY18
In FY17, we launched the inaugural edition of the Business Insights Report: Unlocking everyday innovation. The landmark report was designed to provide businesses with a practical definition of innovation, assess Australia’s business innovation performance and quantify the value of innovation to firms and the broader economy.
Since then, we have seen a dramatic shift in the way businesses are utilising and implementing innovation in response to competitive, technological and market forces.
While the 2016 report clearly highlighted that Australian businesses were in the earlier stages of developing their innovation culture today, innovation is firmly embedded in the mindset of most Australian enterprises.
In last year's report we again looked at 15 management capabilities and entrepreneurial behaviours that drive innovation – together forming the CommBank Innovation Index – and found that innovation performance had surged across the country. More importantly, this rise saw Australian businesses surpass a crucial threshold – collectively moving from a focus on day-to-day improvement into the realm of genuine innovation.
As business innovation increased, so too did the number of home-grown innovation superstars, a trend that is expected to continue as businesses face new challenges and take unique approaches to meeting changing customer needs.
For businesses aspiring to improve their innovation performance in the face of emerging opportunities and challenges, it is worth noting the uniform characteristics shared by Australia’s most innovative organisations.
In this year’s edition we have also built on our research and again examined the value that innovation can deliver to individual businesses and its contribution to greater productivity and national economic growth. The report has found that investment into business innovation remains healthy and that the value of innovation accrued by businesses in revenue gains and cost savings has risen substantially in the previous 12 months.
It is also clear that investing in innovation is paying off for many businesses. When comparing the average investment and accompanying return, the report found that for every dollar invested in innovation businesses are receiving almost two in return, and in some cases it has materialised in months, not years.
As businesses continue to leverage innovation to drive productivity within their own organisations, it can deliver a profound impact on the Australian economy. We found that across all Innovation Active businesses, implemented innovations have delivered a boost of billions of dollars to the economy, which can play a pivotal role in supporting Australia’s global competitiveness and economic growth.
Australian businesses continue to advance significantly in their approach to innovation, an encouraging trend we expect to continue as innovation firms its place as integral to organisational culture and a standard operating practice.
We hope this report provides some useful and practical insights for your business and we look forward to the opportunity to discuss our findings with you further.
Adam Bennett Group Executive Business and Private Banking Commonwealth Bank of Australia
About CommBank Business Insights Report
The findings in this edition of the Business Insights Report are based on a wide-ranging quantitative survey of 2,473 business owners, decision makers and managers — as well as 16 in-depth qualitative interviews — conducted on behalf of the Commonwealth Bank by ACA Research and DBM Consultants between August and October 2017. Participants were drawn from businesses across Australia with an annual turnover of more than $500,000 and at least two employees.
The survey was designed to benchmark the innovation performance of each business, identifying the key motivations and drivers influencing that performance, and highlighting best practice.
Key Insights
4
CommBank Business InsightsFY18
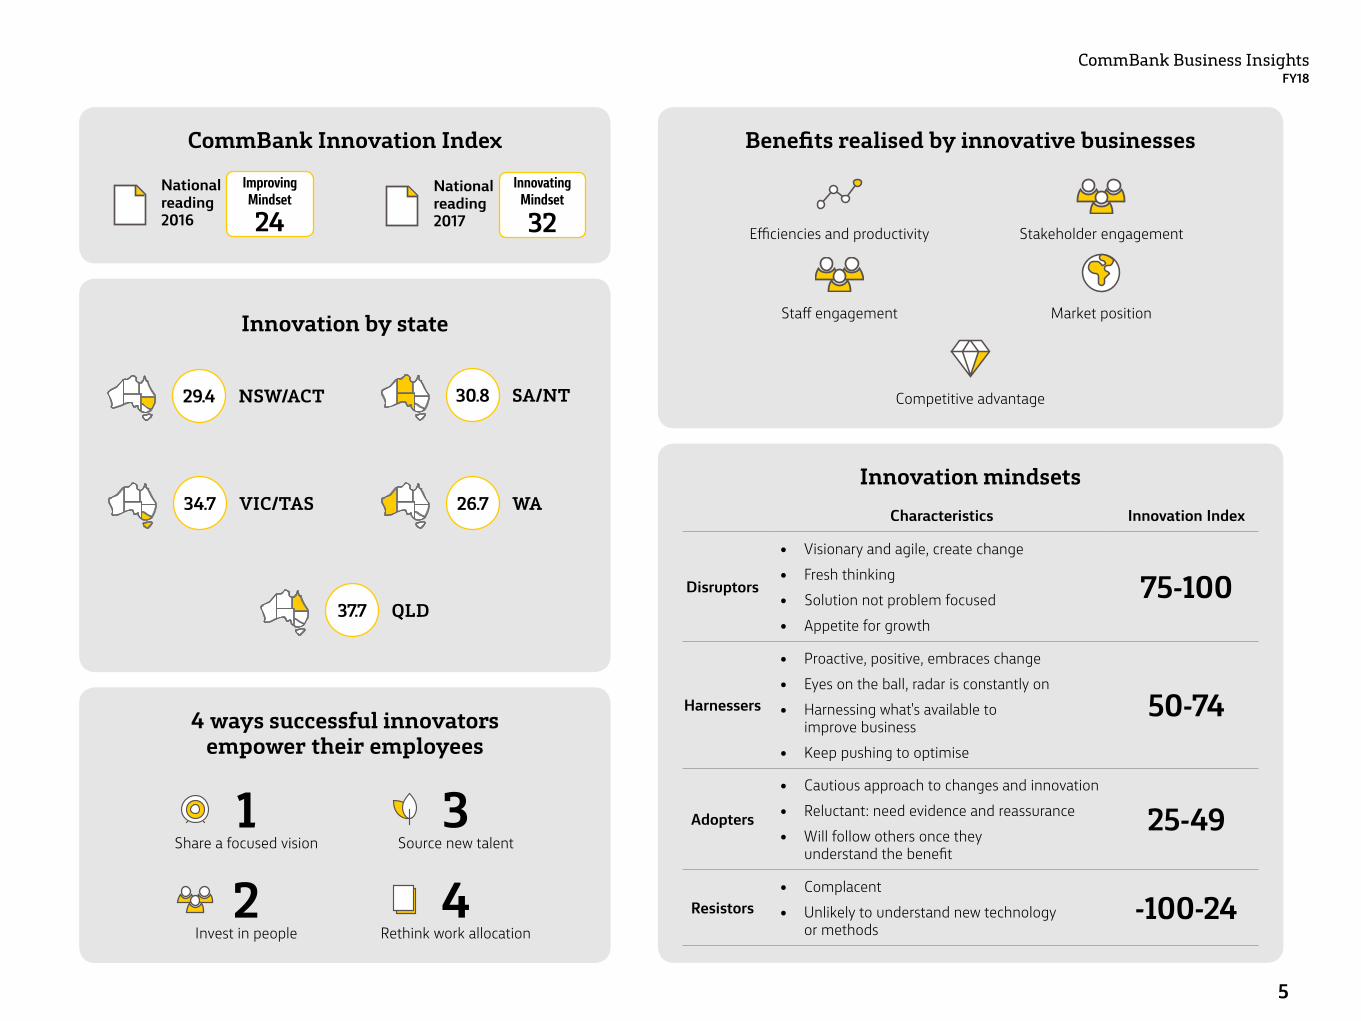
CommBank Innovation Index
4 ways successful innovators empower their employees
Benefits realised by innovative businesses
Innovation mindsets
Innovation by state
National reading 2016
Improving Mindset
24
34.7 VIC/TAS
30.8 SA/NT29.4 NSW/ACT
Share a focused vision
Efficiencies and productivity
Staff engagement
Competitive advantage
Stakeholder engagement
Market position
Invest in people
Source new talent
Rethink work allocation
1
2
3
4
Characteristics Innovation Index
Disruptors
• Visionary and agile, create change• Fresh thinking• Solution not problem focused• Appetite for growth
75-100
Harnessers
• Proactive, positive, embraces change• Eyes on the ball, radar is constantly on• Harnessing what's available to
improve business• Keep pushing to optimise
50-74
Adopters
• Cautious approach to changes and innovation• Reluctant: need evidence and reassurance• Will follow others once they
understand the benefit
25-49
Resistors• Complacent• Unlikely to understand new technology
or methods-100-24
26.7 WA
37.7 QLD
National reading 2017
Innovating Mindset
32
5
CommBank Business InsightsFY18
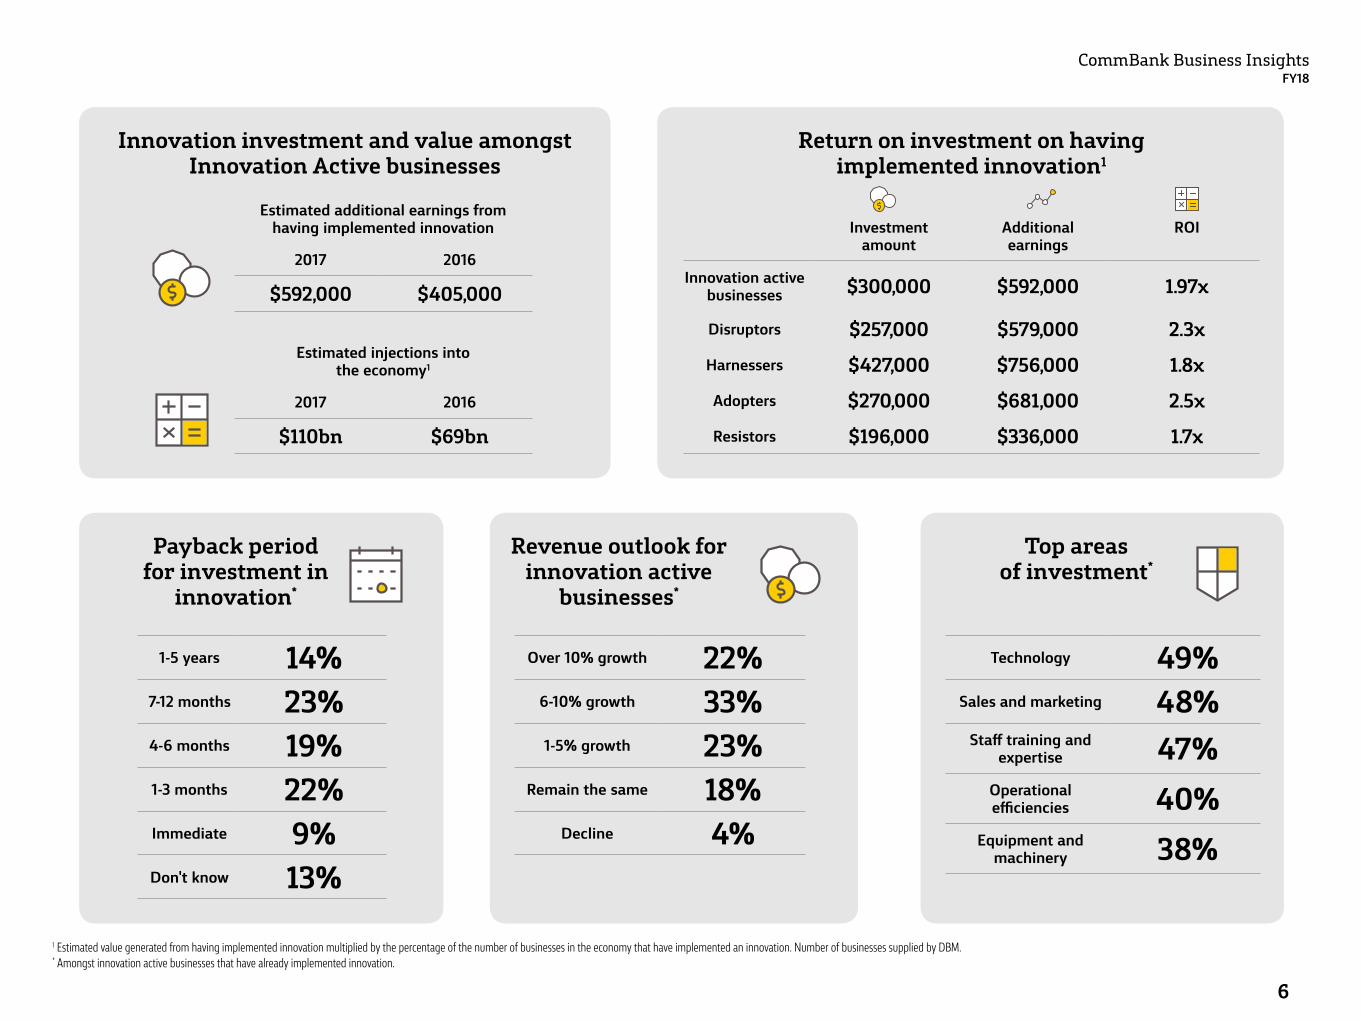
Innovation investment and value amongst Innovation Active businesses
Top areas of investment*
Estimated additional earnings from having implemented innovation
Estimated injections into the economy1
2017 2016
$592,000 $405,000
2017 2016
$110bn $69bn
Return on investment on having implemented innovation1
Investment amount
Additional earnings
ROI
Innovation active businesses $300,000 $592,000 1.97x
Disruptors $257,000 $579,000 2.3xHarnessers $427,000 $756,000 1.8xAdopters $270,000 $681,000 2.5xResistors $196,000 $336,000 1.7x
Payback period for investment in
innovation*
Revenue outlook for innovation active
businesses*
1-5 years 14%7-12 months 23%4-6 months 19%1-3 months 22%Immediate 9%Don't know 13%
Over 10% growth 22%6-10% growth 33%1-5% growth 23%
Remain the same 18%Decline 4%
Technology 49%Sales and marketing 48%
Staff training and expertise 47%
Operational efficiencies 40%
Equipment and machinery 38%
1 Estimated value generated from having implemented innovation multiplied by the percentage of the number of businesses in the economy that have implemented an innovation. Number of businesses supplied by DBM.* Amongst innovation active businesses that have already implemented innovation.
6
CommBank Business InsightsFY18
Measuring innovationTo measure Australia’s ongoing innovation performance we adopted a globally recognised methodology, then expanded on it, to form the CommBank Innovation Index.
The OECD innovation frameworkTo determine which business initiatives were truly innovative, we adopted the framework set out in the Organisation for Economic Co-operation and Development (OECD) Oslo Manual. Used by organisations around the world, including the Australian Federal Government and Bureau of Statistics, the manual is constructed around four key innovation areas: products, processes, marketing and organisational.
The CommBank Innovation IndexIn our survey we tested 15 core elements of innovation across management capability and entrepreneurial behaviour. Together they comprise the CommBank Innovation Index. The Index combines the results into a single numerical indicator, enabling us to rank businesses on a scale from –100 (innovation restrictive) to +100 (disruptive innovation), thus creating the concept of an innovation curve or spectrum.
We also spoke to a range of businesses to understand their experience in implementing innovation within their organisation. This qualitative analysis forms the basis for accompanying observations, case studies and quotes included in the report.
By mapping the dividing line between improvement and innovation, then overlaying the performance of businesses on the 15 core elements of innovation that make up the CommBank Innovation Index, we can determine where Australian businesses are positioned on an innovation curve.
1 Source: Dyer et al (2011) The Innovator’s DNA.2 McGrath et al (2000) The Entrepreneurial Mindset: Strategies for Continuously Creating Opportunity in an Age of Uncertainty.
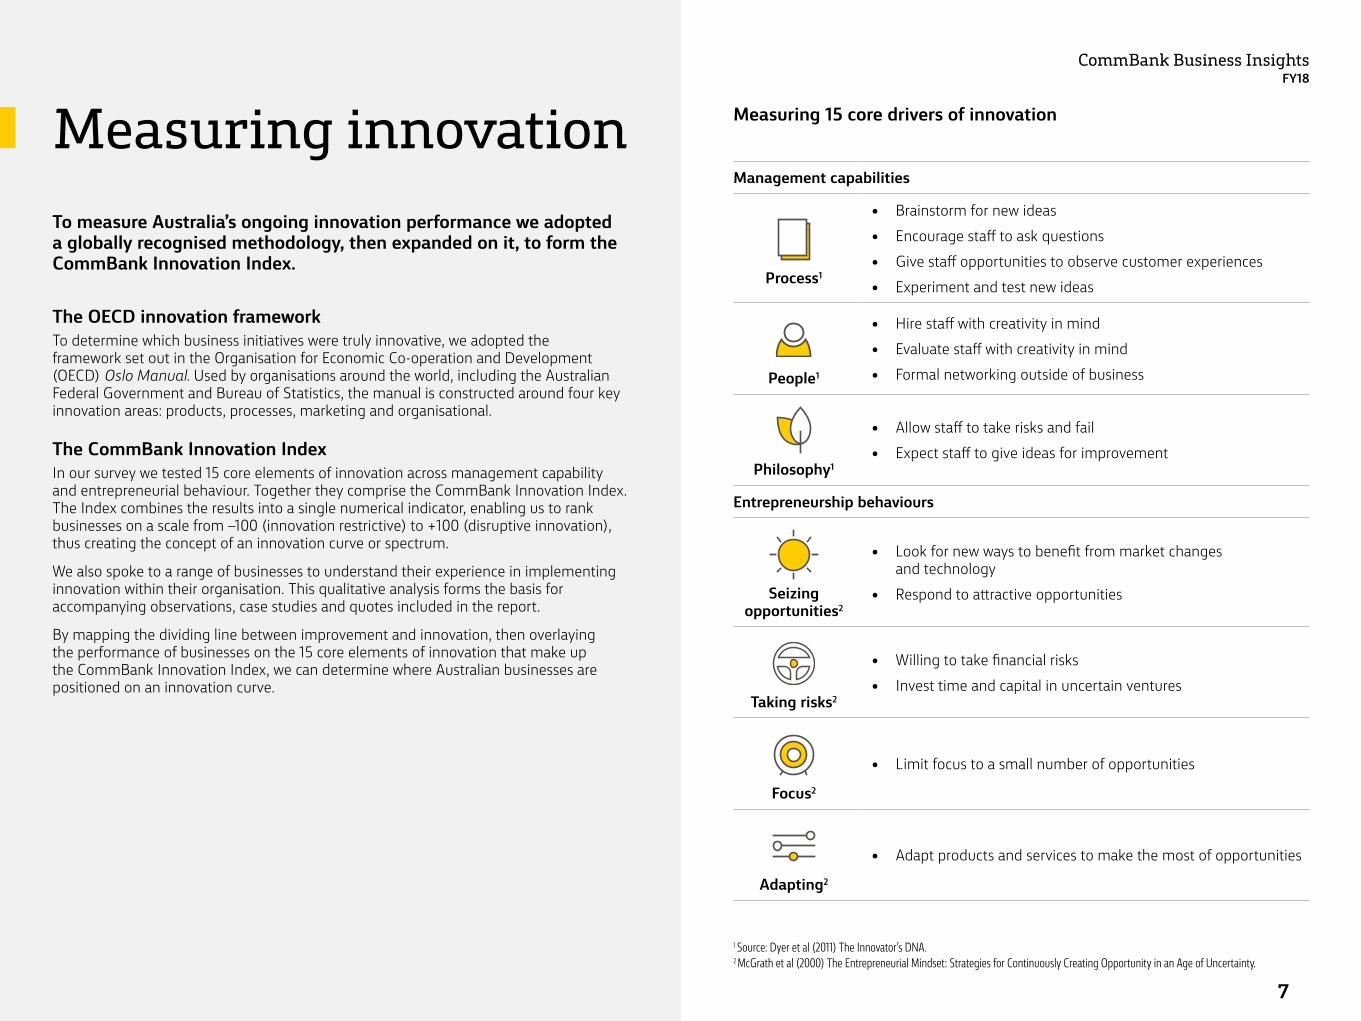
Measuring 15 core drivers of innovation
Management capabilities
Process1
• Brainstorm for new ideas• Encourage staff to ask questions• Give staff opportunities to observe customer experiences• Experiment and test new ideas
People1
• Hire staff with creativity in mind• Evaluate staff with creativity in mind• Formal networking outside of business
Philosophy1
• Allow staff to take risks and fail• Expect staff to give ideas for improvement
Entrepreneurship behaviours
Seizing
opportunities2
• Look for new ways to benefit from market changes and technology
• Respond to attractive opportunities
Taking risks2
• Willing to take financial risks• Invest time and capital in uncertain ventures
Focus2
• Limit focus to a small number of opportunities
Adapting2
• Adapt products and services to make the most of opportunities
7

Innovation breakthroughBehavioural drivers lift nationwide innovationAcross Australia, businesses of all sizes improved their innovation performance over the past year, crossing the threshold separating genuine innovation from business improvements.
CommBank Business InsightsFY18
8
CommBank Business InsightsFY18
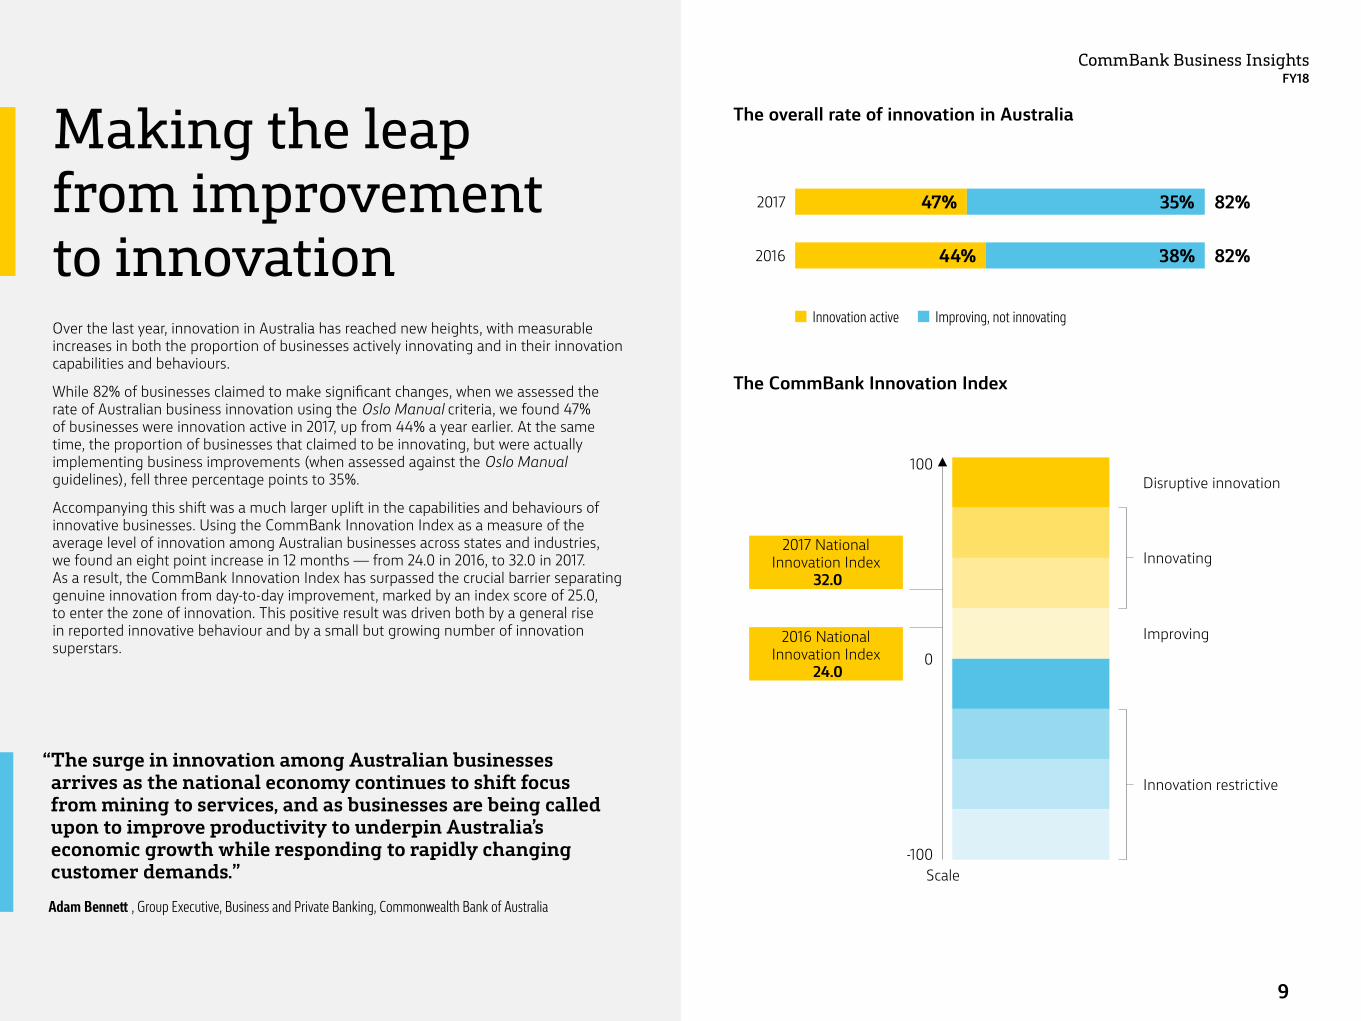
Making the leap from improvement to innovationOver the last year, innovation in Australia has reached new heights, with measurable increases in both the proportion of businesses actively innovating and in their innovation capabilities and behaviours.
While 82% of businesses claimed to make significant changes, when we assessed the rate of Australian business innovation using the Oslo Manual criteria, we found 47% of businesses were innovation active in 2017, up from 44% a year earlier. At the same time, the proportion of businesses that claimed to be innovating, but were actually implementing business improvements (when assessed against the Oslo Manual guidelines), fell three percentage points to 35%.
Accompanying this shift was a much larger uplift in the capabilities and behaviours of innovative businesses. Using the CommBank Innovation Index as a measure of the average level of innovation among Australian businesses across states and industries, we found an eight point increase in 12 months — from 24.0 in 2016, to 32.0 in 2017. As a result, the CommBank Innovation Index has surpassed the crucial barrier separating genuine innovation from day-to-day improvement, marked by an index score of 25.0, to enter the zone of innovation. This positive result was driven both by a general rise in reported innovative behaviour and by a small but growing number of innovation superstars.
“ The surge in innovation among Australian businesses arrives as the national economy continues to shift focus from mining to services, and as businesses are being called upon to improve productivity to underpin Australia’s economic growth while responding to rapidly changing customer demands.”
Adam Bennett , Group Executive, Business and Private Banking, Commonwealth Bank of Australia
The overall rate of innovation in Australia
The CommBank Innovation Index
82%44% 38%
82%47% 35%
Innovation active Improving, not innovating
2016
2017
Disruptive innovation
Innovating
Improving
Scale-100
0
100
Innovation restrictive
2017 National Innovation Index
32.0
2016 National Innovation Index
24.0
9
CommBank Business InsightsFY18
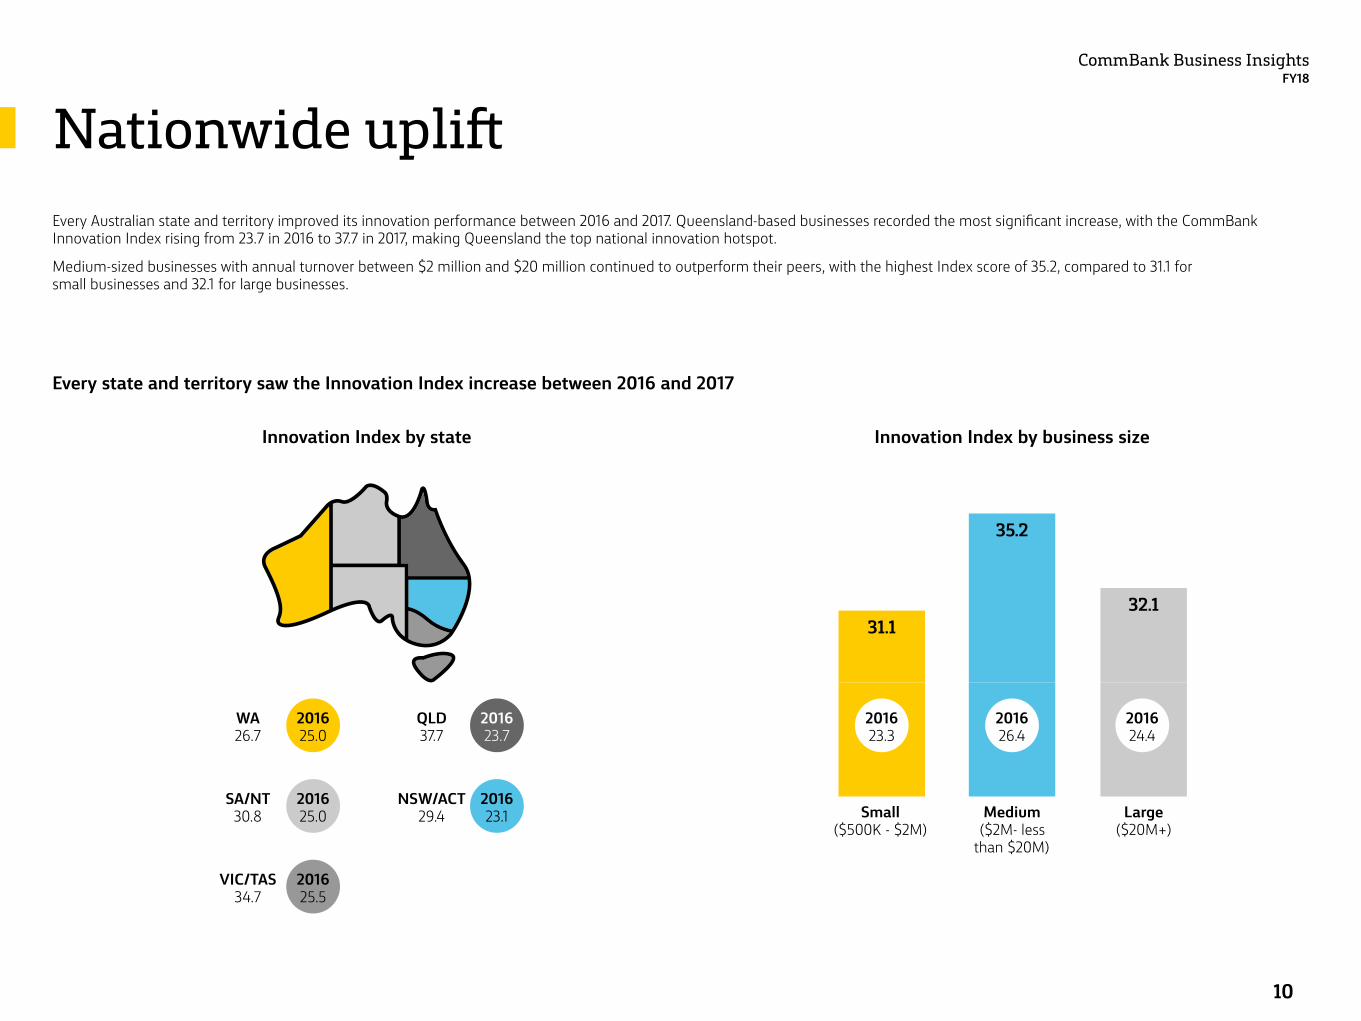
Nationwide upliftEvery Australian state and territory improved its innovation performance between 2016 and 2017. Queensland-based businesses recorded the most significant increase, with the CommBank Innovation Index rising from 23.7 in 2016 to 37.7 in 2017, making Queensland the top national innovation hotspot.
Medium-sized businesses with annual turnover between $2 million and $20 million continued to outperform their peers, with the highest Index score of 35.2, compared to 31.1 for small businesses and 32.1 for large businesses.
Every state and territory saw the Innovation Index increase between 2016 and 2017
Innovation Index by state Innovation Index by business size
WA 26.7
VIC/TAS 34.7
SA/NT 30.8
QLD 37.7
NSW/ACT 29.4
2016 25.0
2016 25.5
2016 25.0
2016 23.7
2016 23.1 Small
($500K - $2M)Large
($20M+)Medium
($2M- less than $20M)
31.1
35.2
32.1
2016 23.3
2016 26.4
2016 24.4
10
CommBank Business InsightsFY18
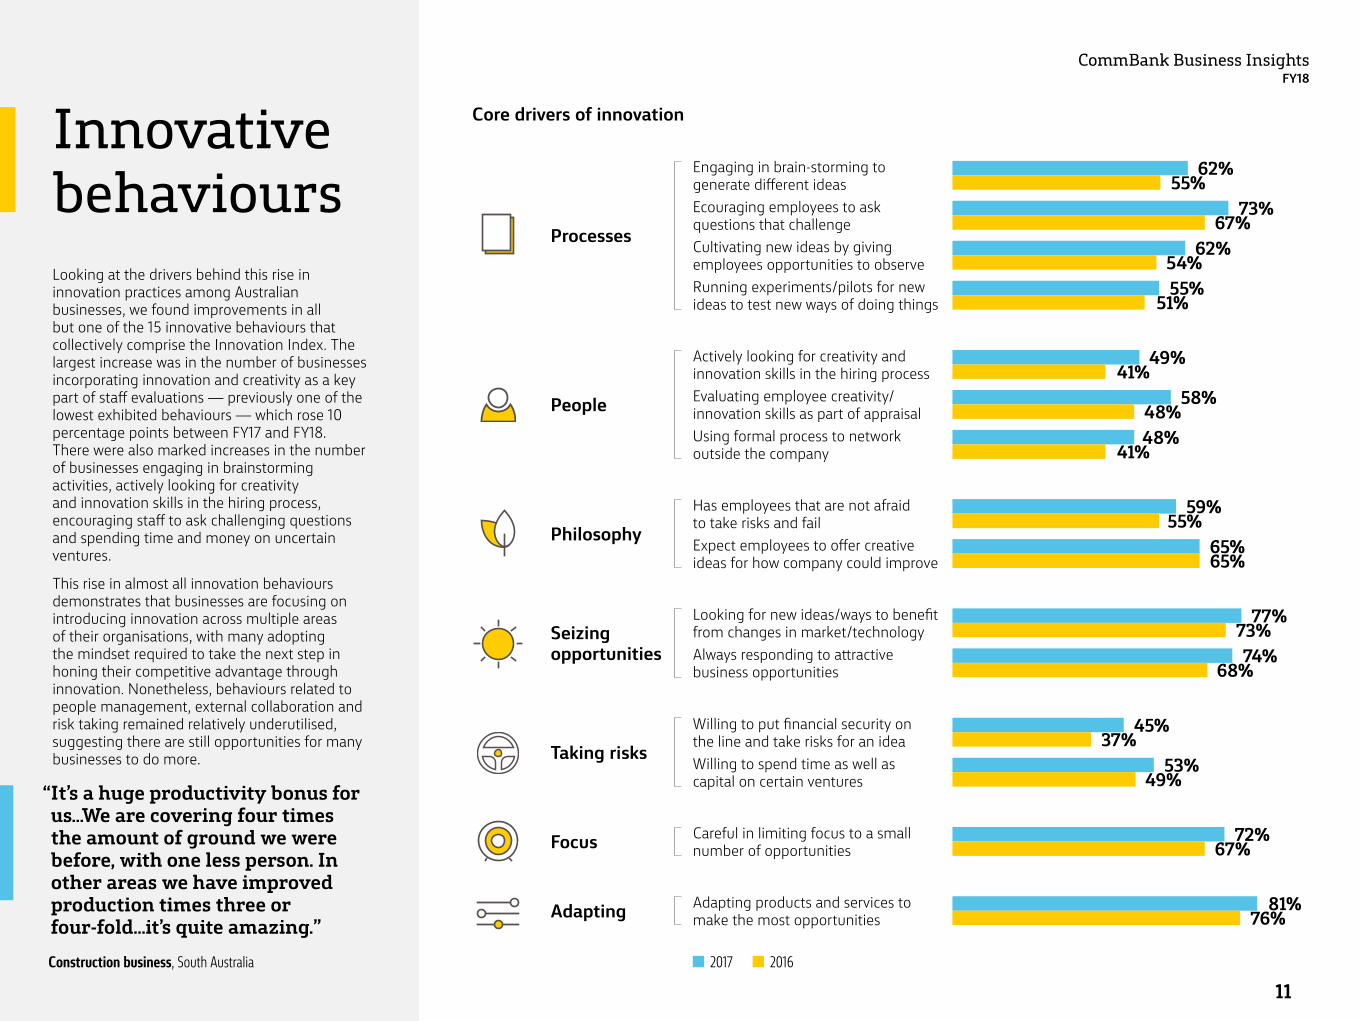
Innovative behavioursLooking at the drivers behind this rise in innovation practices among Australian businesses, we found improvements in all but one of the 15 innovative behaviours that collectively comprise the Innovation Index. The largest increase was in the number of businesses incorporating innovation and creativity as a key part of staff evaluations — previously one of the lowest exhibited behaviours — which rose 10 percentage points between FY17 and FY18. There were also marked increases in the number of businesses engaging in brainstorming activities, actively looking for creativity and innovation skills in the hiring process, encouraging staff to ask challenging questions and spending time and money on uncertain ventures.
This rise in almost all innovation behaviours demonstrates that businesses are focusing on introducing innovation across multiple areas of their organisations, with many adopting the mindset required to take the next step in honing their competitive advantage through innovation. Nonetheless, behaviours related to people management, external collaboration and risk taking remained relatively underutilised, suggesting there are still opportunities for many businesses to do more.
2016 2017
“ It’s a huge productivity bonus for us…We are covering four times the amount of ground we were before, with one less person. In other areas we have improved production times three or four-fold…it’s quite amazing.”
Construction business, South Australia
Core drivers of innovation
Processes
People
Philosophy
Seizing opportunities
Taking risks
Focus
Adapting
Careful in limiting focus to a small number of opportunities
72%67%
Actively looking for creativity and innovation skills in the hiring process
49%41%
Using formal process to network outside the company
48%41%
Evaluating employee creativity/innovation skills as part of appraisal
58%48%
Always responding to attractive business opportunities
74%68%
Looking for new ideas/ways to benefit from changes in market/technology
77%73%
Engaging in brain-storming to generate different ideas
62%55%
Cultivating new ideas by giving employees opportunities to observe
62%54%
Ecouraging employees to ask questions that challenge
73%67%
Running experiments/pilots for new ideas to test new ways of doing things
55%51%
Expect employees to offer creative ideas for how company could improve
65%65%
Has employees that are not afraid to take risks and fail
59%55%
Willing to spend time as well as capital on certain ventures
53%49%
Willing to put financial security on the line and take risks for an idea
45%37%
Adapting products and services to make the most opportunities
81%76%
11

Innovation in action: Strive HealthKey areas of innovation: Process, organisation
Mindset: Harnesser
Key drivers of innovation:
• Process: Experiment and test new ideas• Seizing opportunities: Look for new ways to benefit
from market changes and technology• Philosophy: Expect employees to offer creative
ideas for how the business can improve• Adapting: Adapting products and services to make
the most of opportunities
CommBank Business InsightsFY18
12
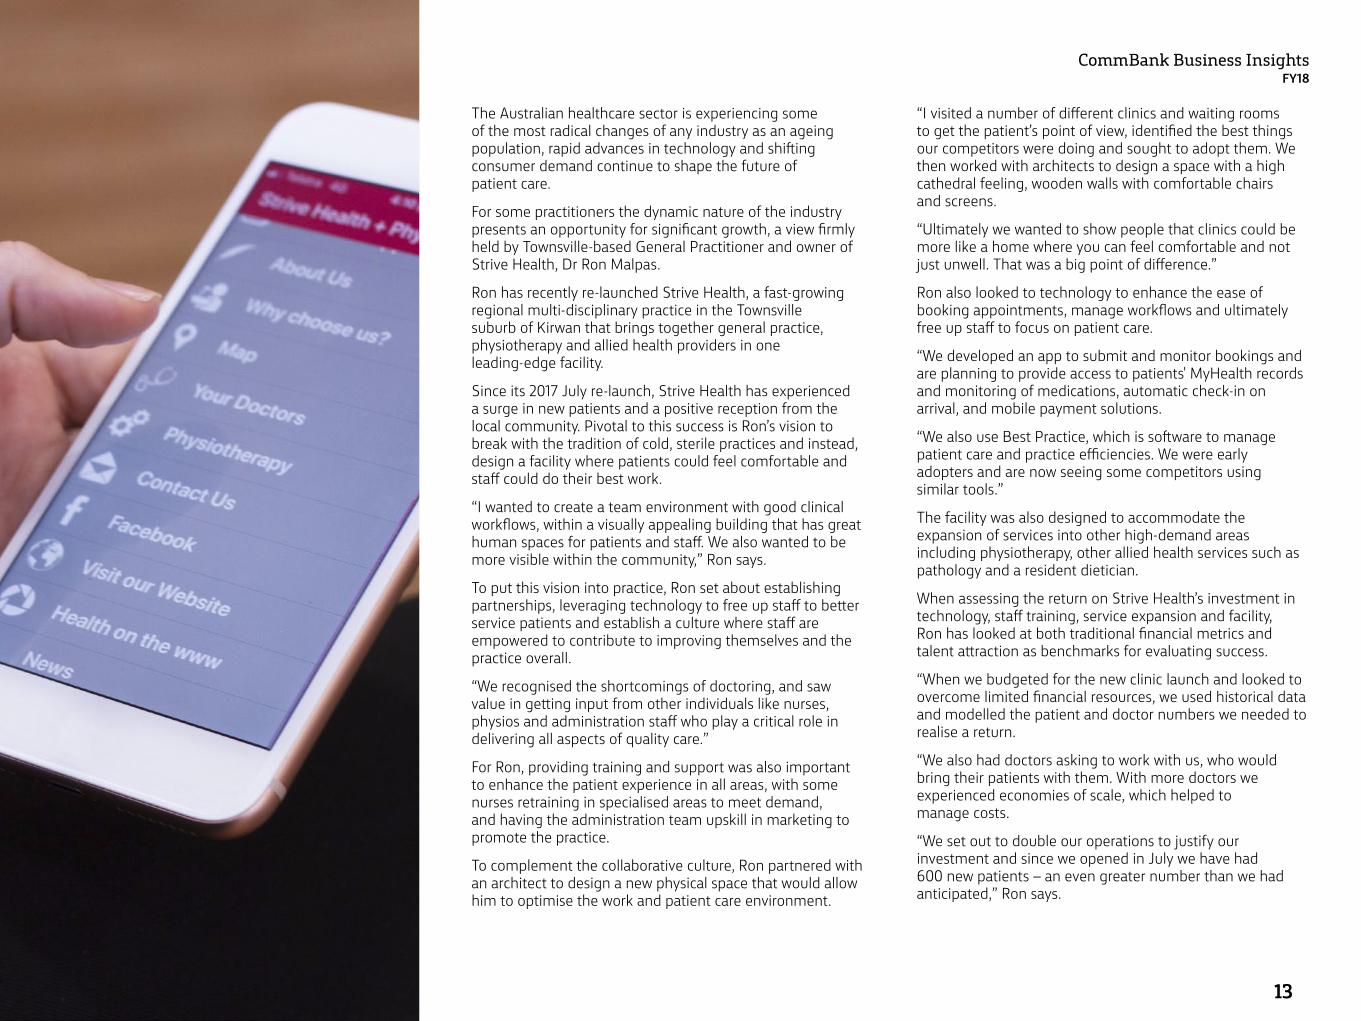
The Australian healthcare sector is experiencing some of the most radical changes of any industry as an ageing population, rapid advances in technology and shifting consumer demand continue to shape the future of patient care.
For some practitioners the dynamic nature of the industry presents an opportunity for significant growth, a view firmly held by Townsville-based General Practitioner and owner of Strive Health, Dr Ron Malpas.
Ron has recently re-launched Strive Health, a fast-growing regional multi-disciplinary practice in the Townsville suburb of Kirwan that brings together general practice, physiotherapy and allied health providers in one leading-edge facility.
Since its 2017 July re-launch, Strive Health has experienced a surge in new patients and a positive reception from the local community. Pivotal to this success is Ron’s vision to break with the tradition of cold, sterile practices and instead, design a facility where patients could feel comfortable and staff could do their best work.
“I wanted to create a team environment with good clinical workflows, within a visually appealing building that has great human spaces for patients and staff. We also wanted to be more visible within the community,” Ron says.
To put this vision into practice, Ron set about establishing partnerships, leveraging technology to free up staff to better service patients and establish a culture where staff are empowered to contribute to improving themselves and the practice overall.
“We recognised the shortcomings of doctoring, and saw value in getting input from other individuals like nurses, physios and administration staff who play a critical role in delivering all aspects of quality care.”
For Ron, providing training and support was also important to enhance the patient experience in all areas, with some nurses retraining in specialised areas to meet demand, and having the administration team upskill in marketing to promote the practice.
To complement the collaborative culture, Ron partnered with an architect to design a new physical space that would allow him to optimise the work and patient care environment.
“I visited a number of different clinics and waiting rooms to get the patient’s point of view, identified the best things our competitors were doing and sought to adopt them. We then worked with architects to design a space with a high cathedral feeling, wooden walls with comfortable chairs and screens.
“Ultimately we wanted to show people that clinics could be more like a home where you can feel comfortable and not just unwell. That was a big point of difference.”
Ron also looked to technology to enhance the ease of booking appointments, manage workflows and ultimately free up staff to focus on patient care.
“We developed an app to submit and monitor bookings and are planning to provide access to patients' MyHealth records and monitoring of medications, automatic check-in on arrival, and mobile payment solutions.
“We also use Best Practice, which is software to manage patient care and practice efficiencies. We were early adopters and are now seeing some competitors using similar tools.”
The facility was also designed to accommodate the expansion of services into other high-demand areas including physiotherapy, other allied health services such as pathology and a resident dietician.
When assessing the return on Strive Health’s investment in technology, staff training, service expansion and facility, Ron has looked at both traditional financial metrics and talent attraction as benchmarks for evaluating success.
“When we budgeted for the new clinic launch and looked to overcome limited financial resources, we used historical data and modelled the patient and doctor numbers we needed to realise a return.
“We also had doctors asking to work with us, who would bring their patients with them. With more doctors we experienced economies of scale, which helped to manage costs.
“We set out to double our operations to justify our investment and since we opened in July we have had 600 new patients – an even greater number than we had anticipated,” Ron says.
CommBank Business InsightsFY18
13
Innovation mindsetLeading from the topLeaders play a critical role in building a robust and creative innovation mindset.
CommBank Business InsightsFY18
14
CommBank Business InsightsFY18
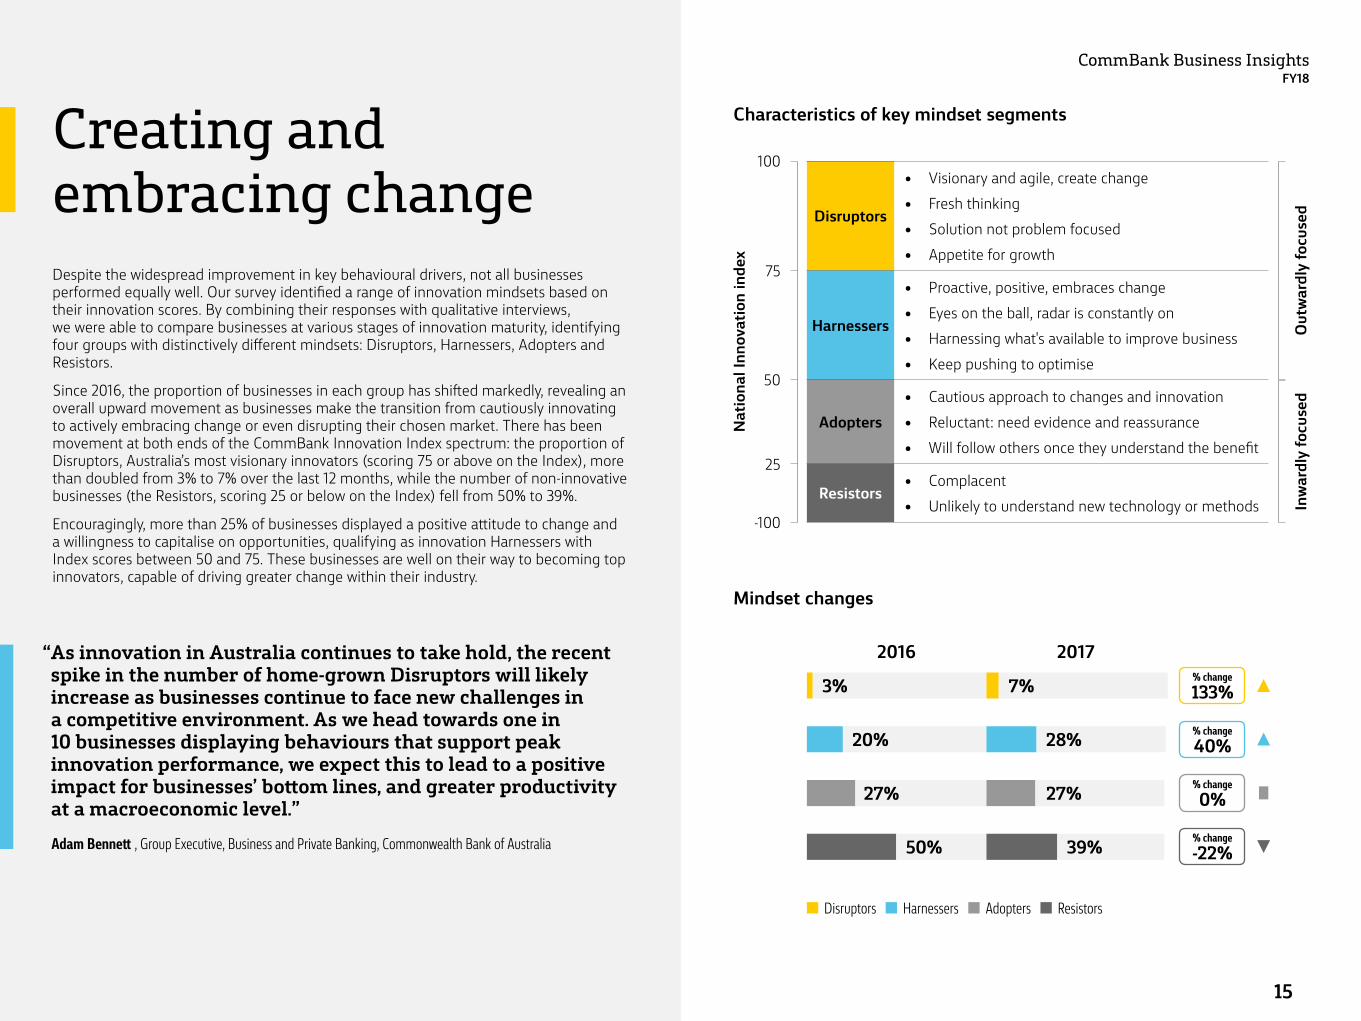
Creating and embracing changeDespite the widespread improvement in key behavioural drivers, not all businesses performed equally well. Our survey identified a range of innovation mindsets based on their innovation scores. By combining their responses with qualitative interviews, we were able to compare businesses at various stages of innovation maturity, identifying four groups with distinctively different mindsets: Disruptors, Harnessers, Adopters and Resistors.
Since 2016, the proportion of businesses in each group has shifted markedly, revealing an overall upward movement as businesses make the transition from cautiously innovating to actively embracing change or even disrupting their chosen market. There has been movement at both ends of the CommBank Innovation Index spectrum: the proportion of Disruptors, Australia’s most visionary innovators (scoring 75 or above on the Index), more than doubled from 3% to 7% over the last 12 months, while the number of non-innovative businesses (the Resistors, scoring 25 or below on the Index) fell from 50% to 39%.
Encouragingly, more than 25% of businesses displayed a positive attitude to change and a willingness to capitalise on opportunities, qualifying as innovation Harnessers with Index scores between 50 and 75. These businesses are well on their way to becoming top innovators, capable of driving greater change within their industry.
Characteristics of key mindset segments
Mindset changes
Disruptors
• Visionary and agile, create change• Fresh thinking• Solution not problem focused• Appetite for growth
Harnessers
• Proactive, positive, embraces change• Eyes on the ball, radar is constantly on• Harnessing what's available to improve business• Keep pushing to optimise
Adopters• Cautious approach to changes and innovation• Reluctant: need evidence and reassurance• Will follow others once they understand the benefit
Resistors• Complacent• Unlikely to understand new technology or methods
“ As innovation in Australia continues to take hold, the recent spike in the number of home-grown Disruptors will likely increase as businesses continue to face new challenges in a competitive environment. As we head towards one in 10 businesses displaying behaviours that support peak innovation performance, we expect this to lead to a positive impact for businesses’ bottom lines, and greater productivity at a macroeconomic level.”
Adam Bennett , Group Executive, Business and Private Banking, Commonwealth Bank of Australia
-100
25
50
75
Nat
iona
l Inn
ovat
ion
inde
x
Inw
ardl
y fo
cuse
dO
utw
ardl
y fo
cuse
d
100
Disruptors Harnessers Adopters Resistors
3%
20%
27%
50%
7%
28%
27%
39%
2016 2017% change
% change
% change
% change
133%
40%
0%
-22%
15
CommBank Business InsightsFY18
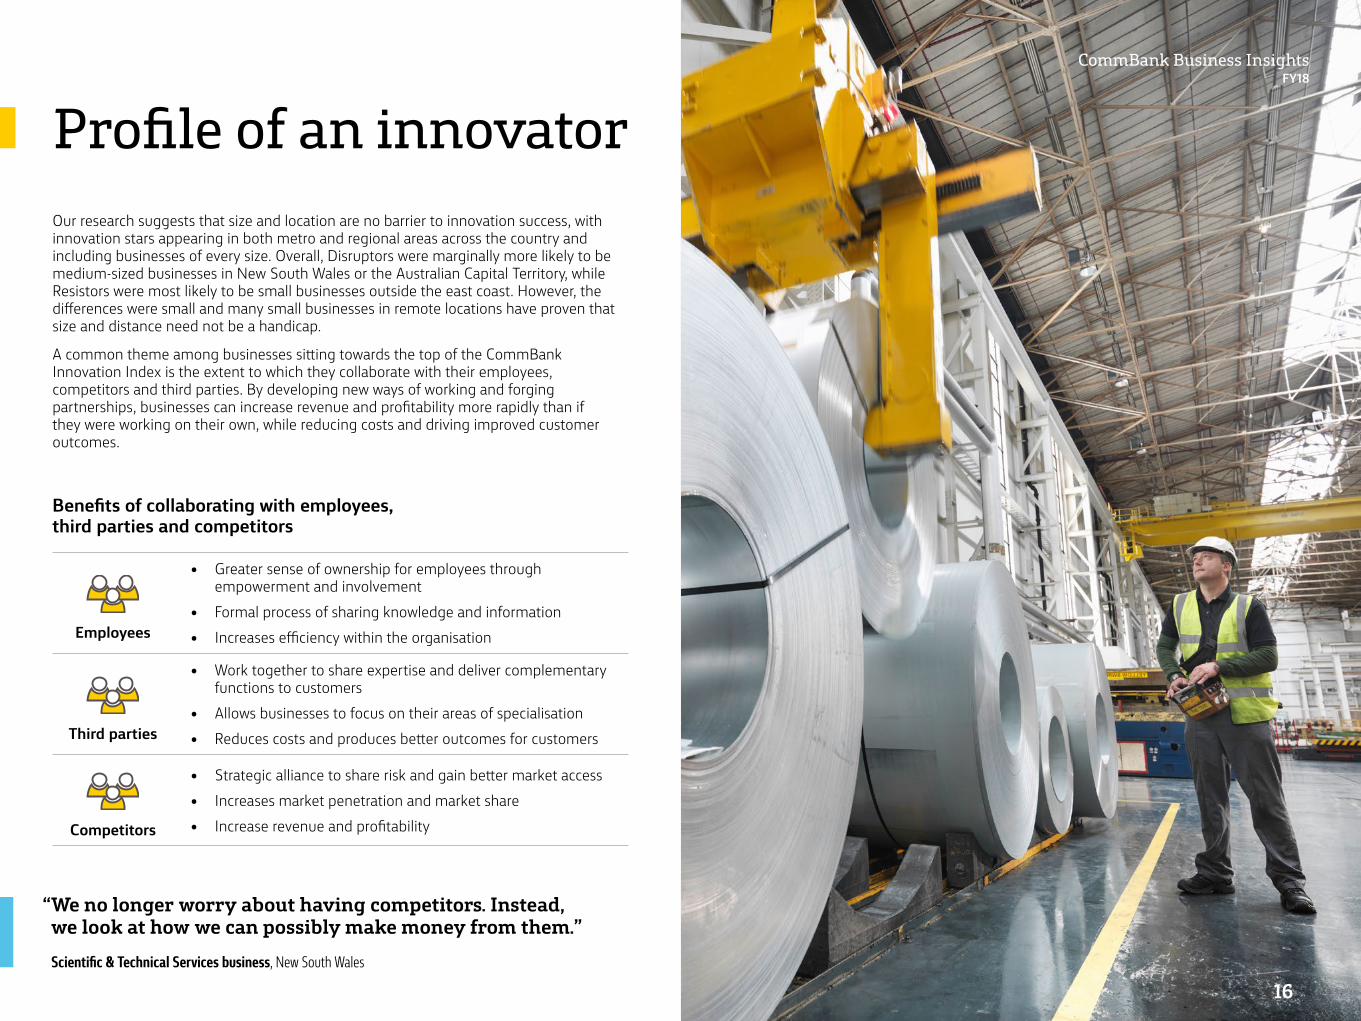
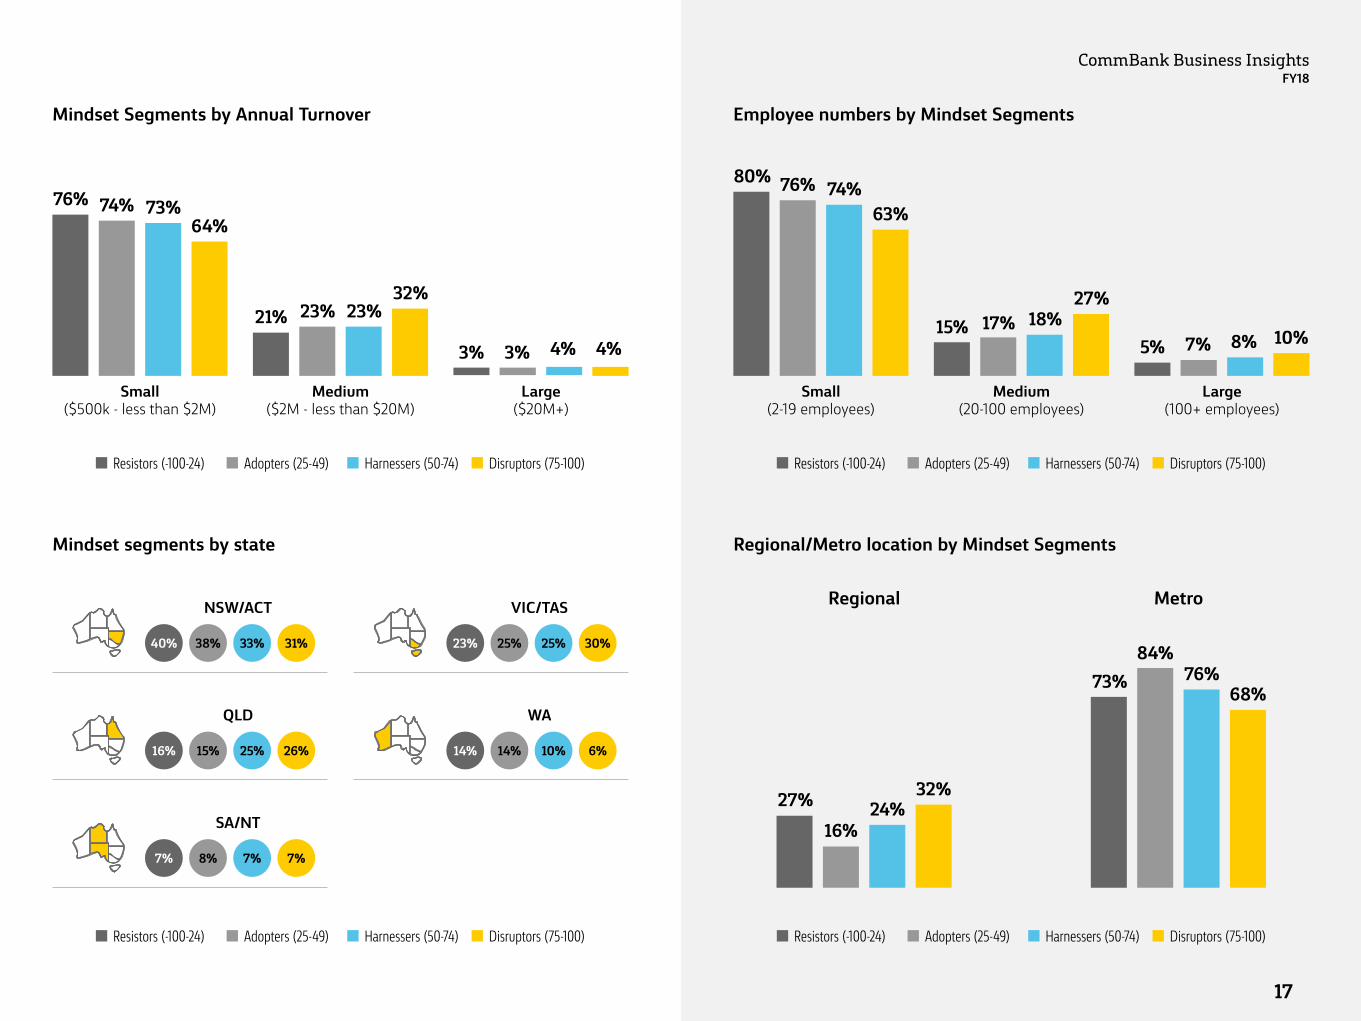
Profile of an innovatorOur research suggests that size and location are no barrier to innovation success, with innovation stars appearing in both metro and regional areas across the country and including businesses of every size. Overall, Disruptors were marginally more likely to be medium-sized businesses in New South Wales or the Australian Capital Territory, while Resistors were most likely to be small businesses outside the east coast. However, the differences were small and many small businesses in remote locations have proven that size and distance need not be a handicap.
A common theme among businesses sitting towards the top of the CommBank Innovation Index is the extent to which they collaborate with their employees, competitors and third parties. By developing new ways of working and forging partnerships, businesses can increase revenue and profitability more rapidly than if they were working on their own, while reducing costs and driving improved customer outcomes.
“ We no longer worry about having competitors. Instead, we look at how we can possibly make money from them.”
Scientific & Technical Services business, New South Wales
Benefits of collaborating with employees, third parties and competitors
Employees
• Greater sense of ownership for employees through empowerment and involvement
• Formal process of sharing knowledge and information• Increases efficiency within the organisation
Third parties
• Work together to share expertise and deliver complementary functions to customers
• Allows businesses to focus on their areas of specialisation • Reduces costs and produces better outcomes for customers
Competitors
• Strategic alliance to share risk and gain better market access• Increases market penetration and market share• Increase revenue and profitability
16
CommBank Business InsightsFY18
Mindset Segments by Annual Turnover Employee numbers by Mindset Segments
Regional Metro
Small ($500k - less than $2M)
Small (2-19 employees)
Medium ($2M - less than $20M)
Medium (20-100 employees)
Large ($20M+)
Large (100+ employees)
Resistors (-100-24) Adopters (25-49) Harnessers (50-74) Disruptors (75-100)
Resistors (-100-24) Adopters (25-49) Harnessers (50-74) Disruptors (75-100)
76%80%
74%76%
73%74%
64% 63%
27%16%
24%32%
73%84%
76%68%
21% 15%23% 17%23% 18%
32% 27%
3% 5%3% 7%4% 8%4% 10%
Mindset segments by state Regional/Metro location by Mindset Segments
NSW/ACT
QLD
SA/NT
VIC/TAS
WA
40%
16%
7%
23%
14%
31%
26%
7%
30%
6%
38%
15%
8%
25%
14%
33%
25%
7%
25%
10%
Resistors (-100-24) Adopters (25-49) Harnessers (50-74) Disruptors (75-100)
Resistors (-100-24) Adopters (25-49) Harnessers (50-74) Disruptors (75-100)
17
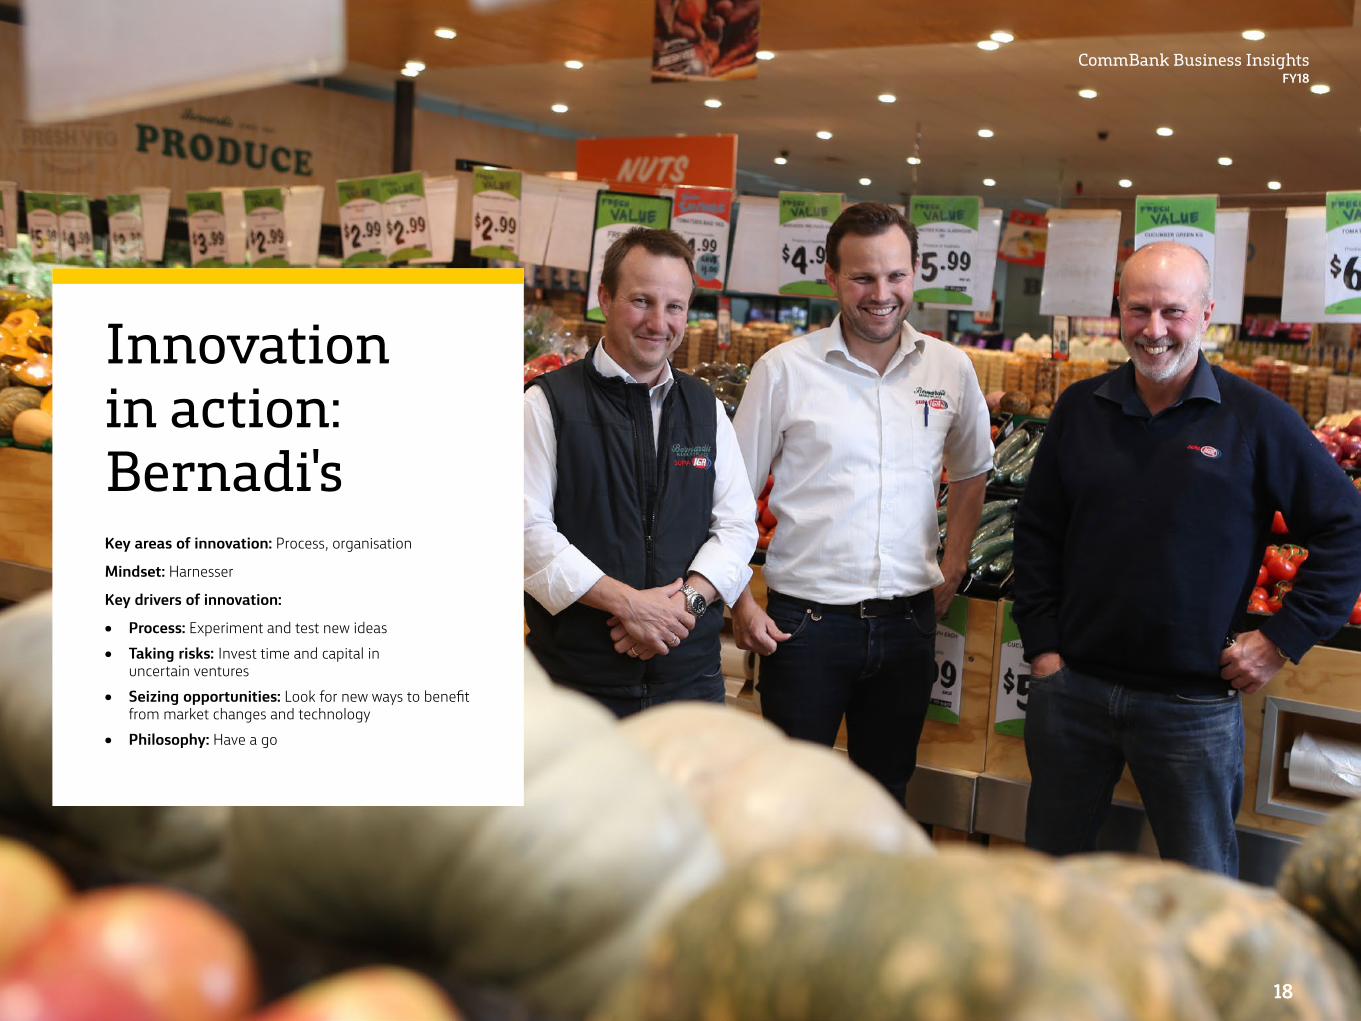
Innovation in action: Bernadi'sKey areas of innovation: Process, organisation
Mindset: Harnesser
Key drivers of innovation:
• Process: Experiment and test new ideas• Taking risks: Invest time and capital in
uncertain ventures• Seizing opportunities: Look for new ways to benefit
from market changes and technology• Philosophy: Have a go
CommBank Business InsightsFY18
18
“Fail fast” is something of an innovation mantra in business circles, but Joe Bernardi knows that taking risks that don’t pan out is no small thing – even if it does often deliver essential learnings and open the door to new opportunities.
Joe and his brothers, David and Peter, run Bernardi’s, a chain of independent supermarkets in central west NSW under the IGA umbrella, with their father Tony, who launched the business 60 years ago selling fruit and veg from the back of a truck.
While David focuses on buying and chasing down the best deals from suppliers, his brother Peter oversees operations and Joe is in charge of marketing. All three started on the shop floor and learnt the business from the bottom up.
“I was straight in at 16, carrying groceries for customers and sweeping the floor in the fruit and veg aisle,” Joe says, adding that despite their low-key entry to the operation, he and his brothers are intent on running a lean and process-driven business.
The supermarket business might seem like a daunting space for independent operators, but the Bernardis stay ahead of the curve through rigorous attention to product quality, keeping a close eye on their pricing and maintaining a large warehouse that allows them to make strategic bulk purchase decisions.
Today the family runs five independent supermarkets with over 400 staff. This includes a newly launched store in Wagga Wagga.
The Wagga Wagga store is the third to be opened in a major regional centre. The first was in Bathurst, which is the largest trading store in the network. The second, in Dubbo, was opened and closed in the space of a few years, bringing with it the painful lessons of the “fail fast” approach.
“It took us a couple of years to regroup. It was a very steep learning curve and led us to a major reflection on where we sit in the market,” Joe says.
Learning from their mistakes is nothing new to the Bernardis. As patriarch Tony puts it, “You don’t buy knowledge; you learn by making mistakes and you don’t make them twice.”
From their recent experience they learned that their stores do better in a standalone location and that it was time to step away from their existing operating model to an entirely independent model. These lessons have been implemented in the business and while it’s early days, the signs are positive for the new store and for the business.
All stores are now “running their own show” under the Bernardi’s banner and the family has adapted its customer offer through a new partnership model with a high-profile fruit and veg retailer, among other significant changes in their supply chain.
In addition to changing the organisational structure of the business, the Bernardis are innovating around their area of focus, too, shifting resources out of administration and into operational in-store execution.
“We’ve hired someone specifically to focus on team training to ensure we’re delivering the best experience in-store,” Joe says.
“We’re also getting really serious about IT, including upgrading our software with a powerful new system that will be a half million-dollar investment.”
The new system will improve efficiency by integrating a large range of functions including sales, purchasing, operations, accounting, payroll, customer relationship management, ecommerce and inventory.
With 60 years of challenges, successes and innovation behind them, Joe says the Bernardis are ready for the future.
“The past three years were a slog but in three years’ time it will be a different conversation. I’ll probably say Dubbo was the best thing to ever happen to us.”
CommBank Business InsightsFY18
19
CommBank Business InsightsFY18
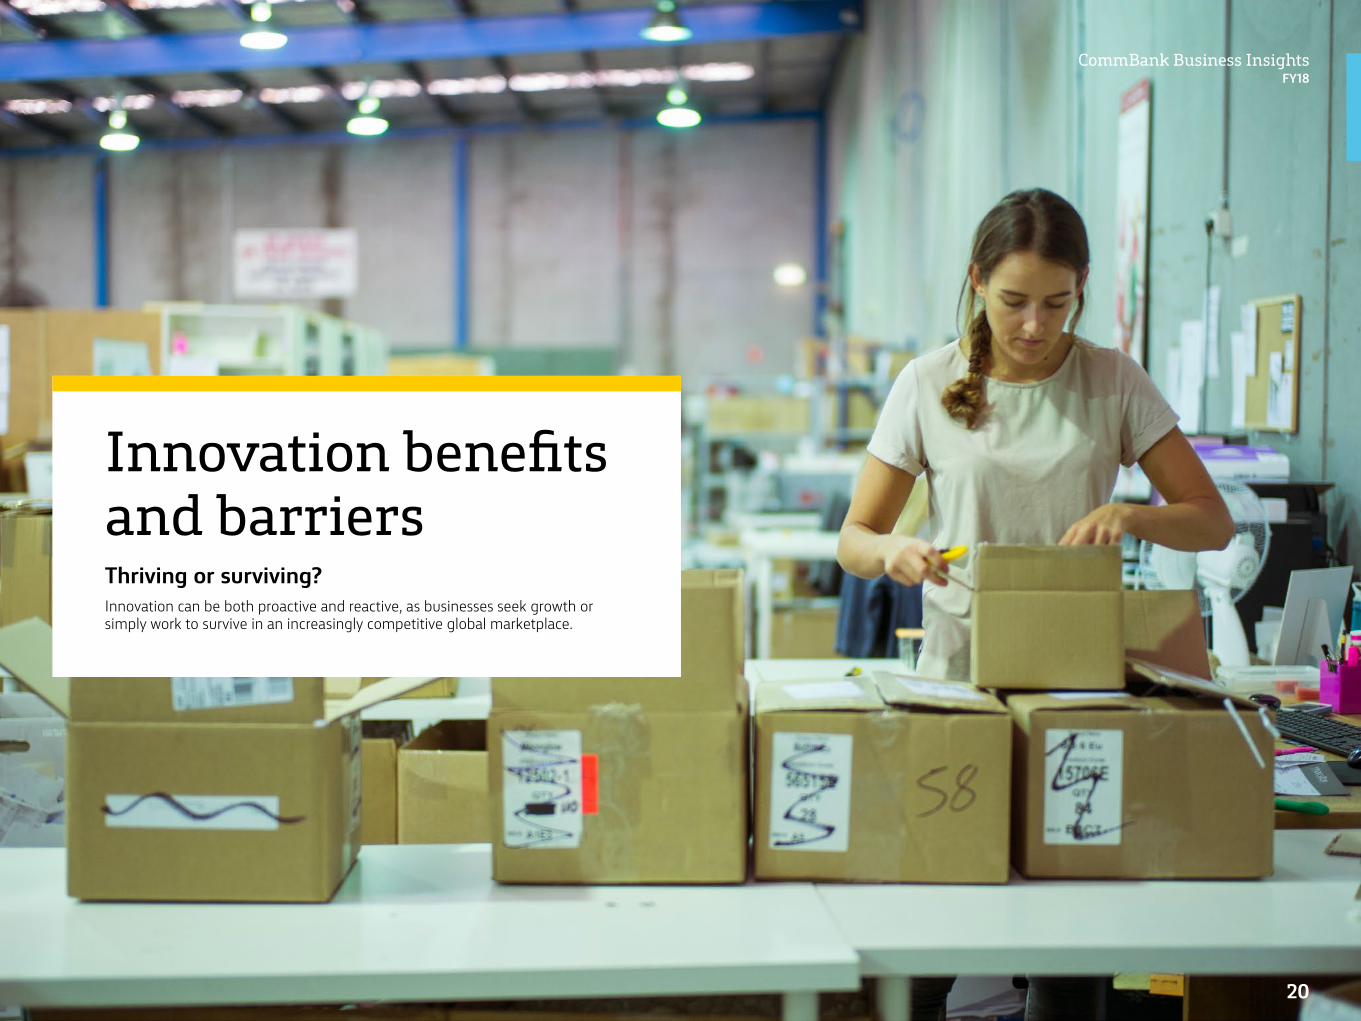
Innovation benefits and barriersThriving or surviving?Innovation can be both proactive and reactive, as businesses seek growth or simply work to survive in an increasingly competitive global marketplace.
20
CommBank Business InsightsFY18
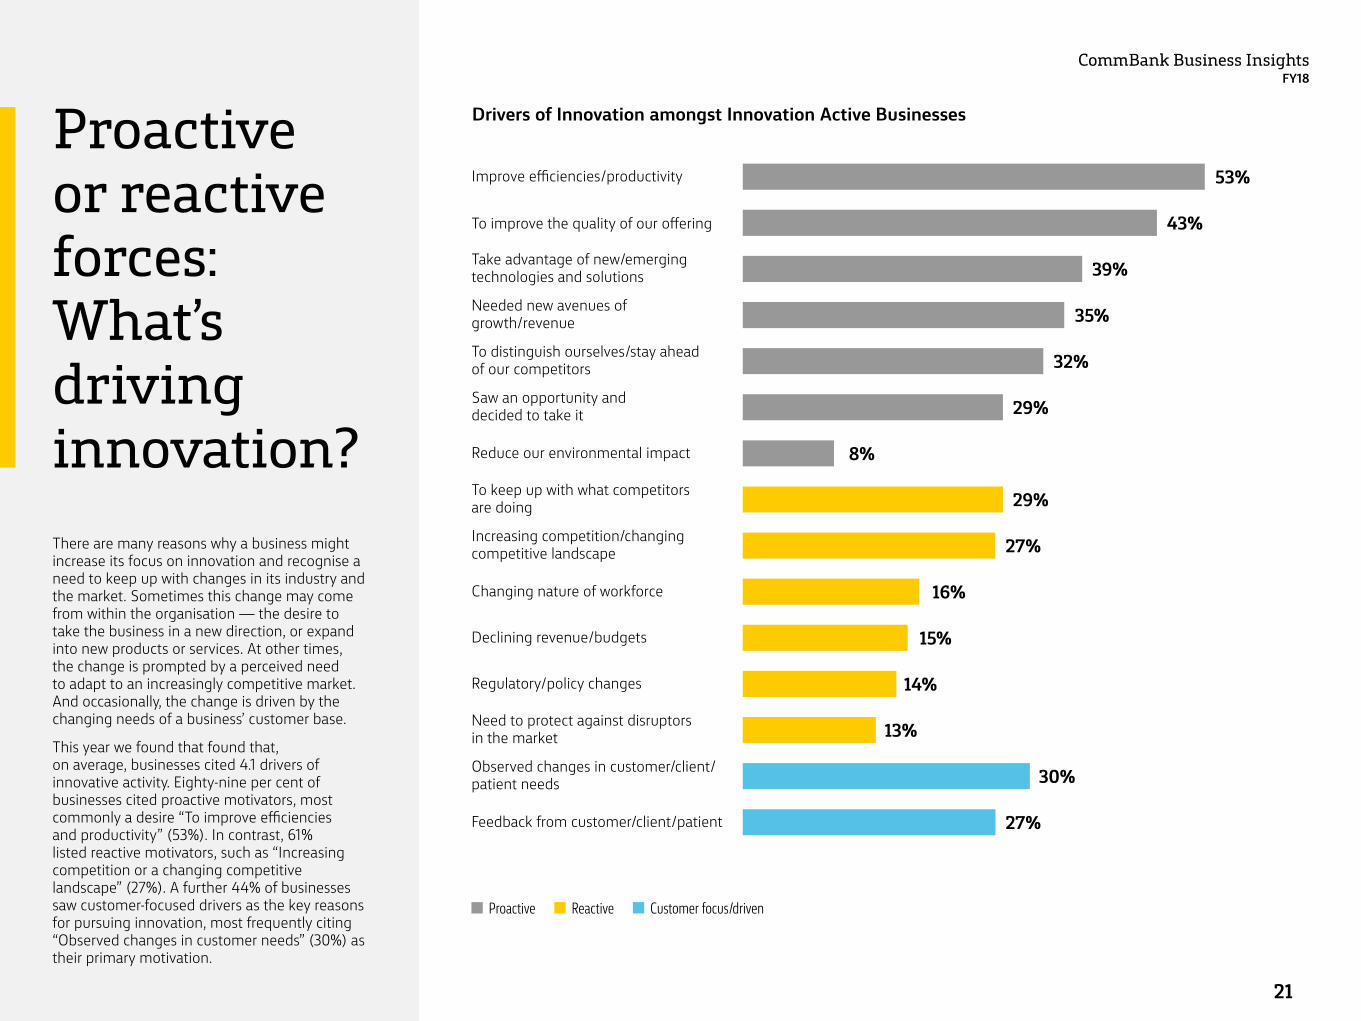
Proactive or reactive forces: What’s driving innovation?There are many reasons why a business might increase its focus on innovation and recognise a need to keep up with changes in its industry and the market. Sometimes this change may come from within the organisation — the desire to take the business in a new direction, or expand into new products or services. At other times, the change is prompted by a perceived need to adapt to an increasingly competitive market. And occasionally, the change is driven by the changing needs of a business’ customer base.
This year we found that found that, on average, businesses cited 4.1 drivers of innovative activity. Eighty-nine per cent of businesses cited proactive motivators, most commonly a desire “To improve efficiencies and productivity” (53%). In contrast, 61% listed reactive motivators, such as “Increasing competition or a changing competitive landscape” (27%). A further 44% of businesses saw customer-focused drivers as the key reasons for pursuing innovation, most frequently citing “Observed changes in customer needs” (30%) as their primary motivation.
Drivers of Innovation amongst Innovation Active Businesses
Improve efficiencies/productivity 53%
To improve the quality of our offering 43%
Take advantage of new/emerging technologies and solutions 39%
Needed new avenues of growth/revenue 35%
To distinguish ourselves/stay ahead of our competitors 32%
Saw an opportunity and decided to take it 29%
Reduce our environmental impact 8%
To keep up with what competitors are doing 29%
Increasing competition/changing competitive landscape 27%
Changing nature of workforce 16%
Declining revenue/budgets 15%
Regulatory/policy changes 14%
Need to protect against disruptors in the market 13%
Observed changes in customer/client/patient needs 30%
Feedback from customer/client/patient 27%
Proactive Reactive Customer focus/driven
21
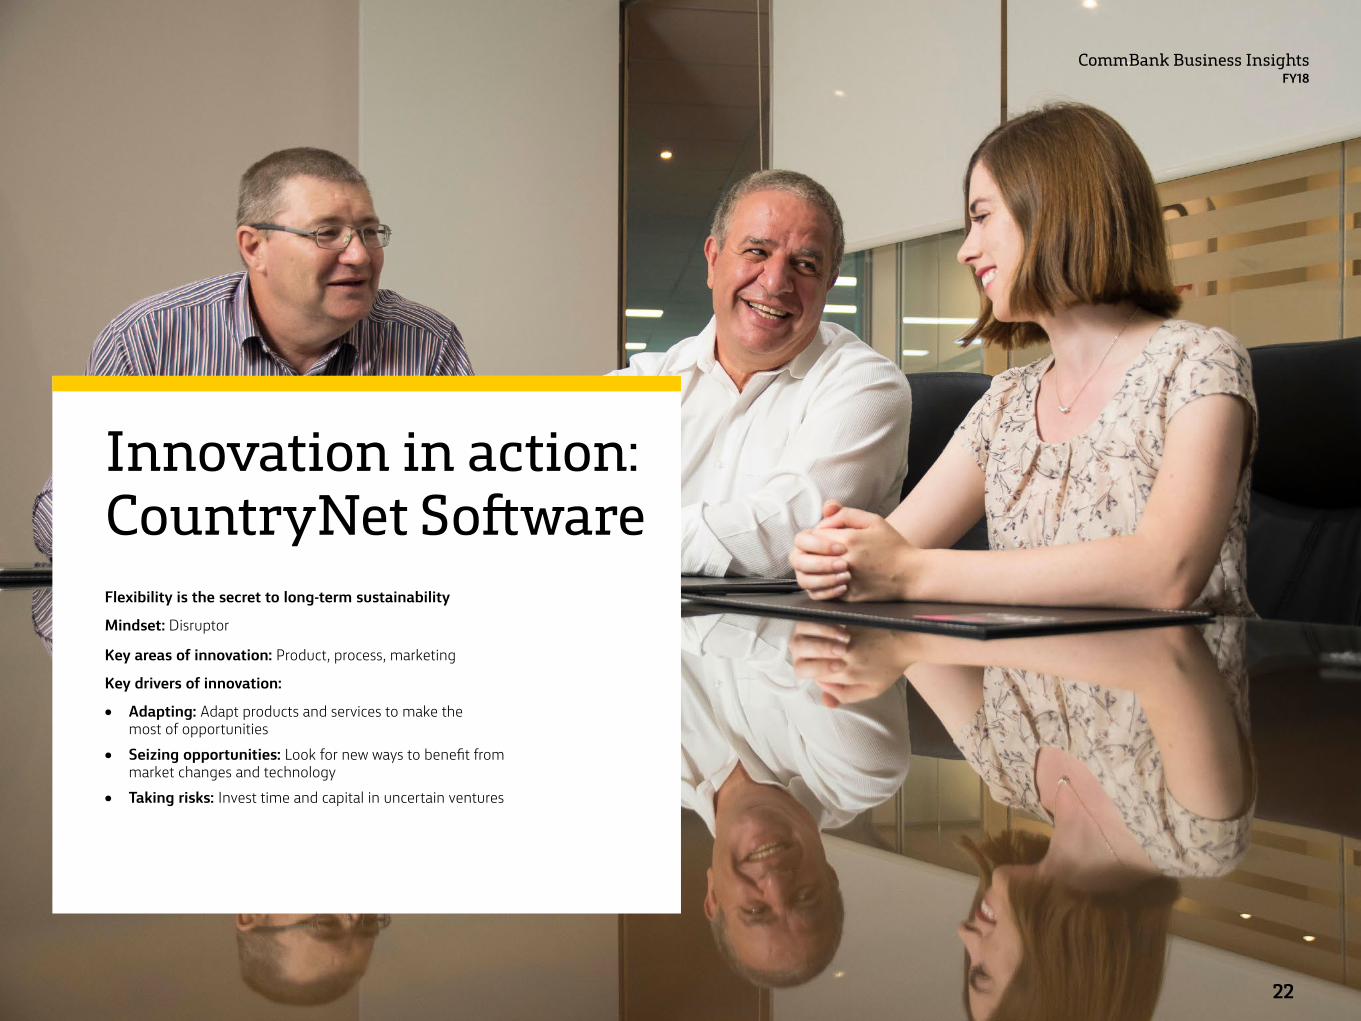
Innovation in action: CountryNet SoftwareFlexibility is the secret to long-term sustainability
Mindset: Disruptor
Key areas of innovation: Product, process, marketing
Key drivers of innovation:
• Adapting: Adapt products and services to make the most of opportunities
• Seizing opportunities: Look for new ways to benefit from market changes and technology
• Taking risks: Invest time and capital in uncertain ventures
CommBank Business InsightsFY18
22
The pace of technological change, and its potential to shape the future of education, has spurred a new generation of businesses looking at ways to both enhance the student learning experience, and address the changing needs of administrators, teachers and parents.
One such business is New South Wales based software developer, CountryNet Software, which provides a single integrated online system, helping to ease the administrative burden for over 1,000 schools and eight million users worldwide.
Their current platform offers a full suite of online education management tools, from timetabling, subject selection and viewing student grades to booking parent teacher interviews - all in one place.
CountryNet Software’s Chief Executive Officer, Simon Totonjian, explains that the business is focused on establishing Australia’s first shared community beyond the school fence, where students, parents, teachers and administrators operate in an interconnected digital community.
CountryNet Software is already setting the gold standard for user experience, for all parties involved in the education process, and is set to continue tackling the industry’s greatest management challenges with a pipeline of revolutionary solutions.
Simon attributes CountryNet Software’s sustained growth to the way the team approaches product development, remaining flexible and agile in the face of rapid change, as well as its collaborative marketing model.
“The secret is you have to be flexible, and in our industry that means if you're in the middle of doing something and there's a change in the environment, you have to be able to respond quickly.”
For CountryNet Software, minimising the time to market for a product, and ensuring the business can adapt to change, requires a different approach to hiring and forming partnerships to drive productivity across the organisation.
“For us, the pace of newly introduced technology means that if we spend two years developing a product, there’s a risk it will be obsolete or superseded by the time we take it to market,” Simon says.
Simon explains that it’s more efficient for the business to have third party developers write their initial software and then have his team build out the end-use product with a focus on delivering a differentiated solution.
CountryNet Software are working on a new product release that Simon says is set to solve one of its customer’s greatest challenges – creating “one point of truth” by providing centralised access to live student, teacher and parent information.
“Our new product is about delivering the capability for real time information transfer. As your child has an exam or a task, results can be published within the system, a teacher can post a comment, and a parent can read it and respond. Why should you wait three months to find out if your child is having a problem?”
In developing this new product, CountryNet Software is working closely with its customers to refine and enhance the software in preparation of a commercial launch.
“We're doing a lot of 'pilot testing' and it's going beautifully. We've got five schools in Australia that use it at the moment, but our primary testing ground is offshore.”
While Simon has invested heavily in creating a platform that provides a seamless and simple customer experience, he is also planning to maximise the commercial return on his investment in product innovation through a number of avenues.
“We will actively promote iterations of our software to other businesses as a white label solution, where we receive a licencing fee. That way we can share technology and monetise from other similar service providers rather than spend time worrying about protecting market share.”
As the global education sector progresses rapidly, and breakthrough technologies such as virtual reality stand to change the delivery of education services, CountryNet Software is working tirelessly to ensure that their technology remains relevant over the long term.
“The ‘end of life’ for a product is so important because it's very hard to sign up 1,000 schools when your product is relevant for only five years. You need a perpetual ‘end of life’ so you can keep the business growing without worrying,” Simon added.
CommBank Business InsightsFY18
23
CommBank Business InsightsFY18
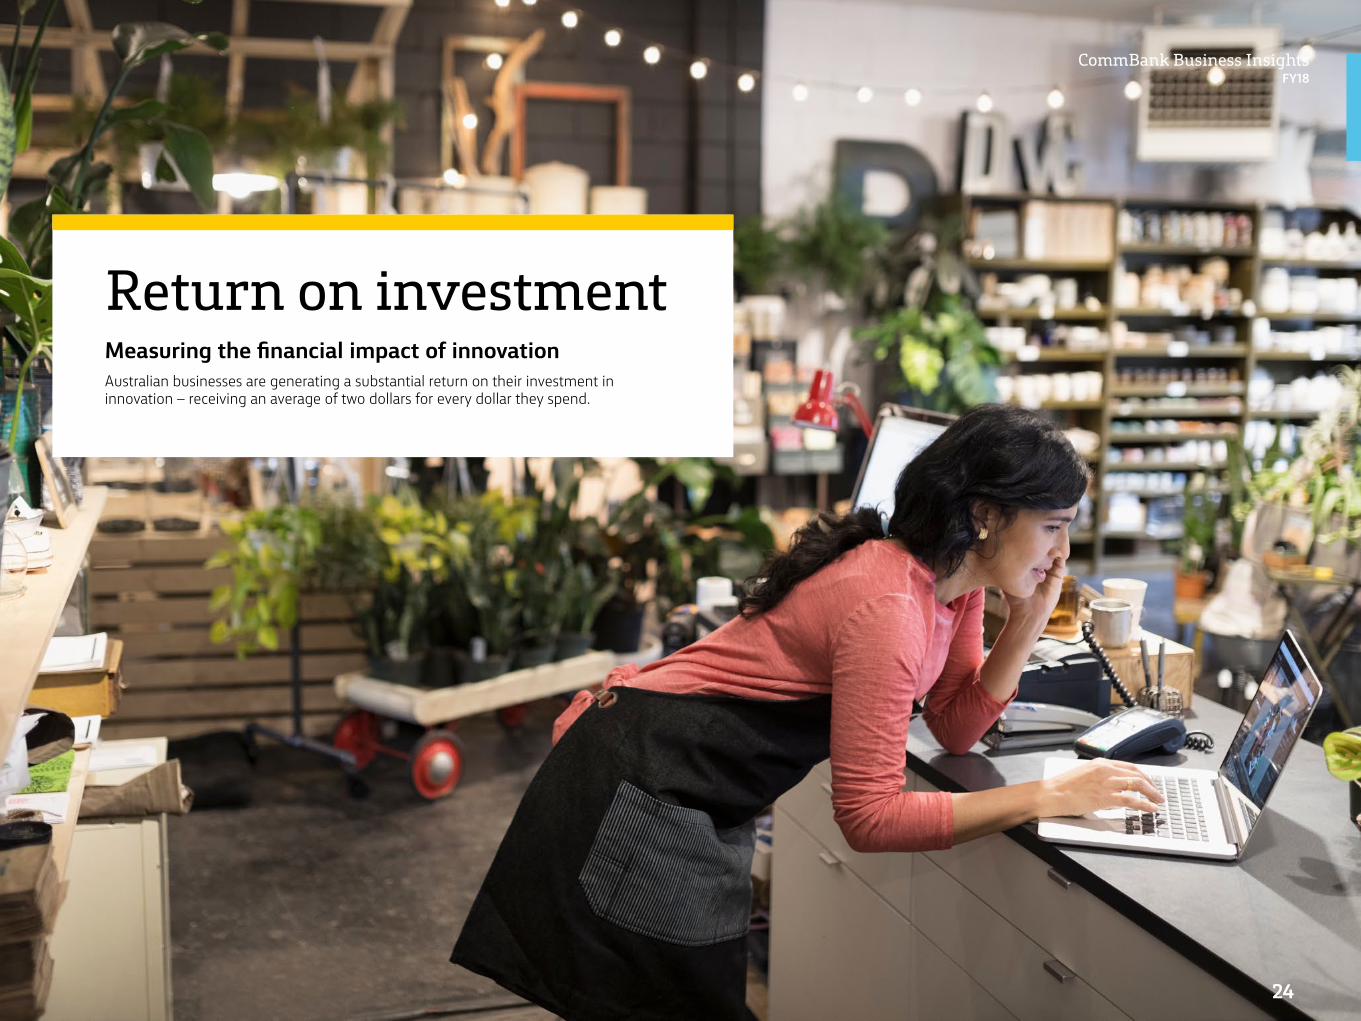
Return on investmentMeasuring the financial impact of innovationAustralian businesses are generating a substantial return on their investment in innovation – receiving an average of two dollars for every dollar they spend.
24
CommBank Business InsightsFY18
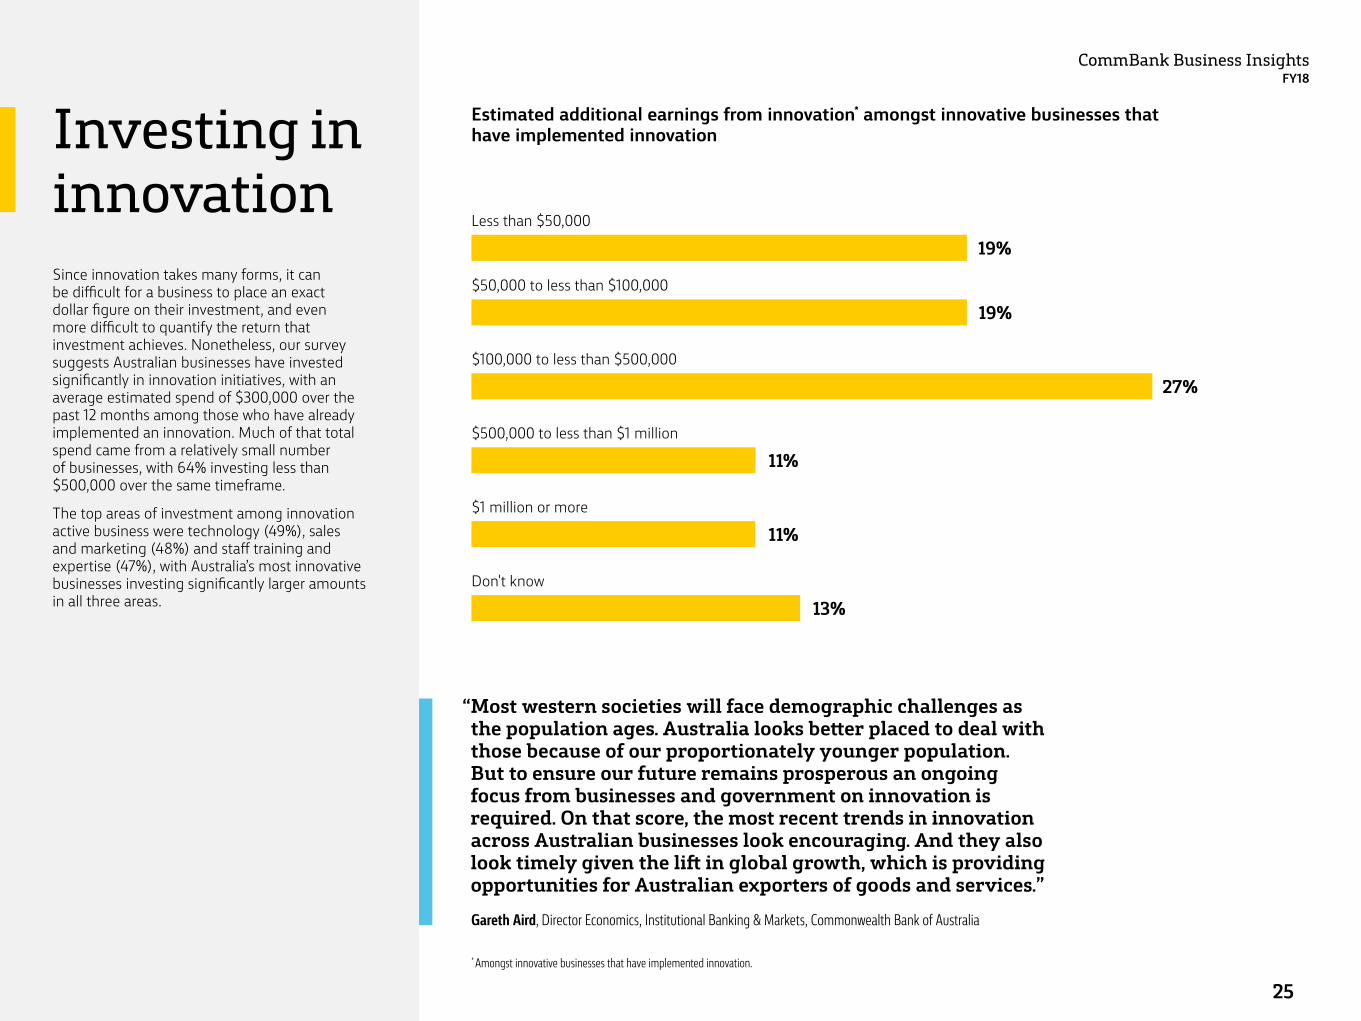
Investing in innovationSince innovation takes many forms, it can be difficult for a business to place an exact dollar figure on their investment, and even more difficult to quantify the return that investment achieves. Nonetheless, our survey suggests Australian businesses have invested significantly in innovation initiatives, with an average estimated spend of $300,000 over the past 12 months among those who have already implemented an innovation. Much of that total spend came from a relatively small number of businesses, with 64% investing less than $500,000 over the same timeframe.
The top areas of investment among innovation active business were technology (49%), sales and marketing (48%) and staff training and expertise (47%), with Australia’s most innovative businesses investing significantly larger amounts in all three areas.
Estimated additional earnings from innovation* amongst innovative businesses that have implemented innovation
Less than $50,000
$50,000 to less than $100,000
$100,000 to less than $500,000
$500,000 to less than $1 million
$1 million or more
Don't know
“ Most western societies will face demographic challenges as the population ages. Australia looks better placed to deal with those because of our proportionately younger population. But to ensure our future remains prosperous an ongoing focus from businesses and government on innovation is required. On that score, the most recent trends in innovation across Australian businesses look encouraging. And they also look timely given the lift in global growth, which is providing opportunities for Australian exporters of goods and services.”
Gareth Aird, Director Economics, Institutional Banking & Markets, Commonwealth Bank of Australia
19%
19%
27%
11%
11%
13%
* Amongst innovative businesses that have implemented innovation.
25
CommBank Business InsightsFY18
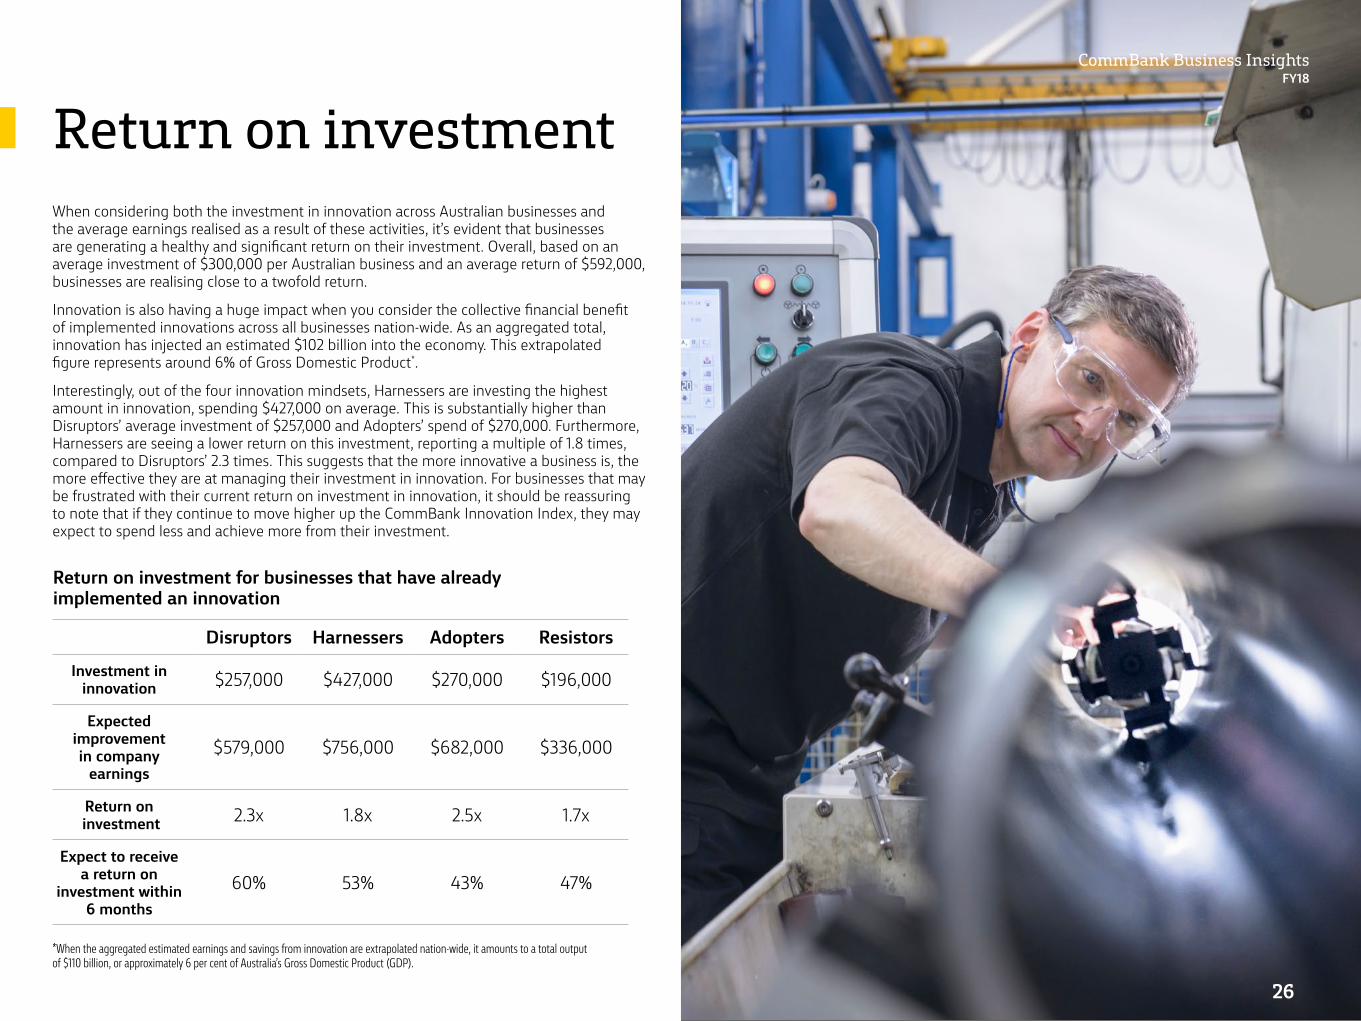
Return on investmentWhen considering both the investment in innovation across Australian businesses and the average earnings realised as a result of these activities, it’s evident that businesses are generating a healthy and significant return on their investment. Overall, based on an average investment of $300,000 per Australian business and an average return of $592,000, businesses are realising close to a twofold return.
Innovation is also having a huge impact when you consider the collective financial benefit of implemented innovations across all businesses nation-wide. As an aggregated total, innovation has injected an estimated $102 billion into the economy. This extrapolated figure represents around 6% of Gross Domestic Product*.
Interestingly, out of the four innovation mindsets, Harnessers are investing the highest amount in innovation, spending $427,000 on average. This is substantially higher than Disruptors’ average investment of $257,000 and Adopters’ spend of $270,000. Furthermore, Harnessers are seeing a lower return on this investment, reporting a multiple of 1.8 times, compared to Disruptors’ 2.3 times. This suggests that the more innovative a business is, the more effective they are at managing their investment in innovation. For businesses that may be frustrated with their current return on investment in innovation, it should be reassuring to note that if they continue to move higher up the CommBank Innovation Index, they may expect to spend less and achieve more from their investment.
Return on investment for businesses that have already implemented an innovation
Disruptors Harnessers Adopters Resistors
Investment in innovation $257,000 $427,000 $270,000 $196,000
Expected improvement in company
earnings$579,000 $756,000 $682,000 $336,000
Return on investment 2.3x 1.8x 2.5x 1.7x
Expect to receive a return on
investment within 6 months
60% 53% 43% 47%
*When the aggregated estimated earnings and savings from innovation are extrapolated nation-wide, it amounts to a total output of $110 billion, or approximately 6 per cent of Australia’s Gross Domestic Product (GDP).
26

CommBank Business InsightsFY18
Cost savings and intangible benefitsWhile revenue growth may be the primary goal of innovation for most businesses, it only accounted for 60% of the total earnings uplift associated with innovation. Thirty-nine per cent of businesses told us they were also able to achieve significantly lower costs, enhancing their overall productivity. This number was highest for Disruptors, with more than one in two businesses realising cost savings.
Businesses also cited benefits that were positive but harder to quantify, such as:
• increased efficiency• improved safety• increased profitability• better quality products and services• higher job satisfaction and increased skill sets for employees• a more competitive offering
For these reasons, it’s easy to underestimate the underlying value of innovation. New and significant improvements that are implemented successfully can bring long-term benefits to a business that extend well beyond their impact on the bottom line.
“ With consumers able to buy goods whenever they want and wherever they are, businesses need to gain an advantage by working out their ‘uncommon offering’ or unique selling proposition. This may involve coming up with new ways of meeting customer needs, changing the ways the goods are marketed or sold, or focusing on differentiating the product or service offering. Successful innovators have identified something that they do better or more efficiently than their competitors and thus gain an advantage.”
Craig James, Chief Economist, CommSec, Commonwealth Bank of Australia
27
CommBank Business InsightsFY18
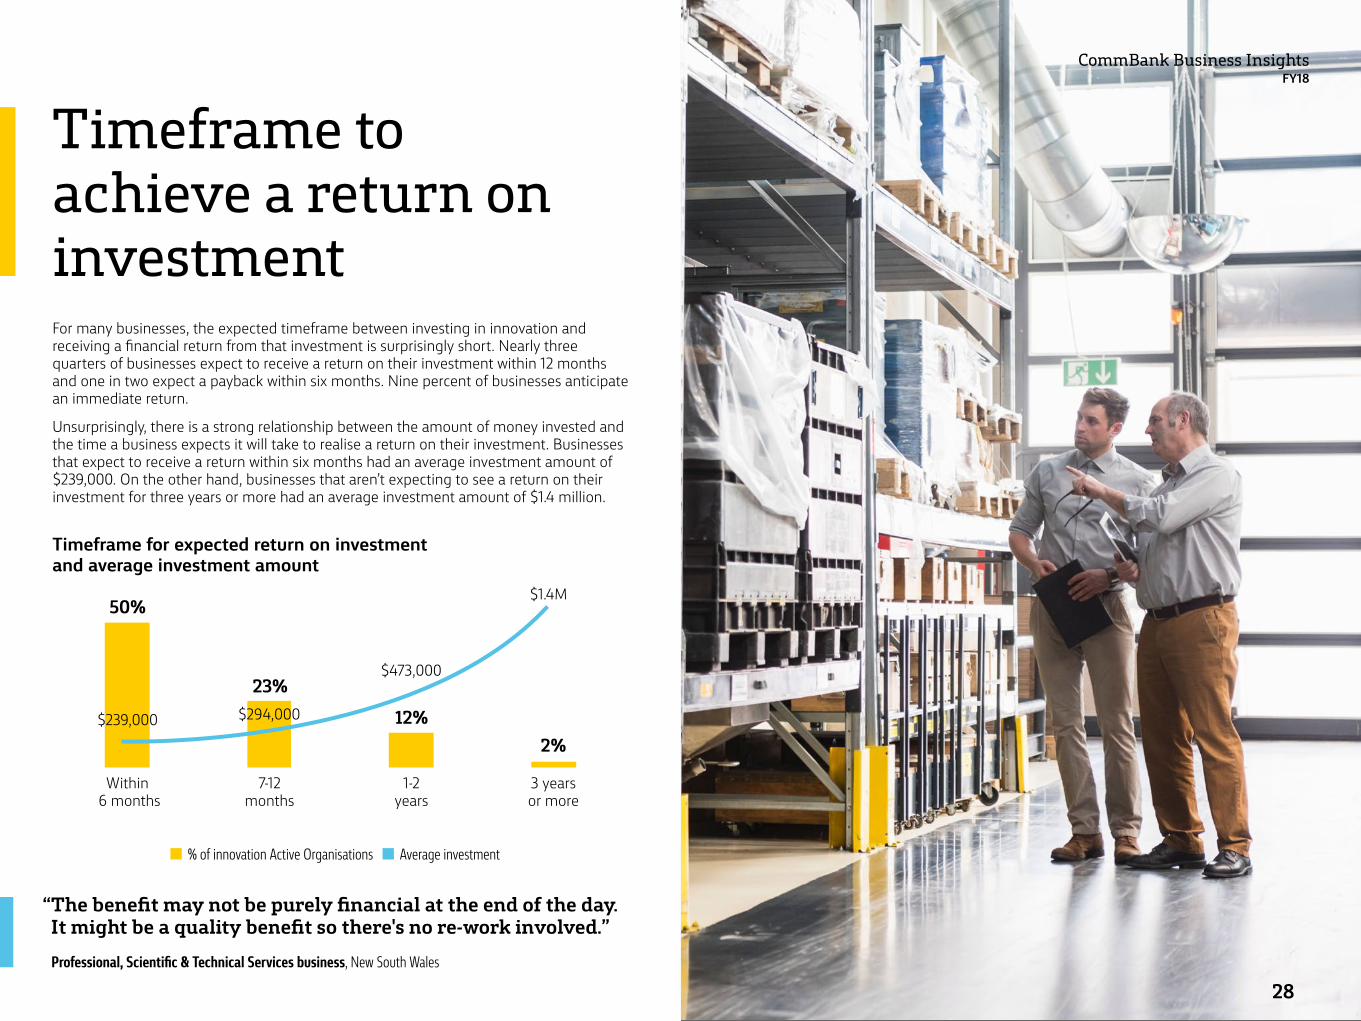
Timeframe to achieve a return on investmentFor many businesses, the expected timeframe between investing in innovation and receiving a financial return from that investment is surprisingly short. Nearly three quarters of businesses expect to receive a return on their investment within 12 months and one in two expect a payback within six months. Nine percent of businesses anticipate an immediate return.
Unsurprisingly, there is a strong relationship between the amount of money invested and the time a business expects it will take to realise a return on their investment. Businesses that expect to receive a return within six months had an average investment amount of $239,000. On the other hand, businesses that aren’t expecting to see a return on their investment for three years or more had an average investment amount of $1.4 million.
“ The benefit may not be purely financial at the end of the day. It might be a quality benefit so there's no re-work involved.”
Professional, Scientific & Technical Services business, New South Wales
50%
23%12%
2%
Within 6 months
$239,000 $294,000
$473,000
$1.4M
7-12 months
1-2 years
3 years or more
% of innovation Active Organisations Average investment
Timeframe for expected return on investment and average investment amount
28
CommBank Business InsightsFY18
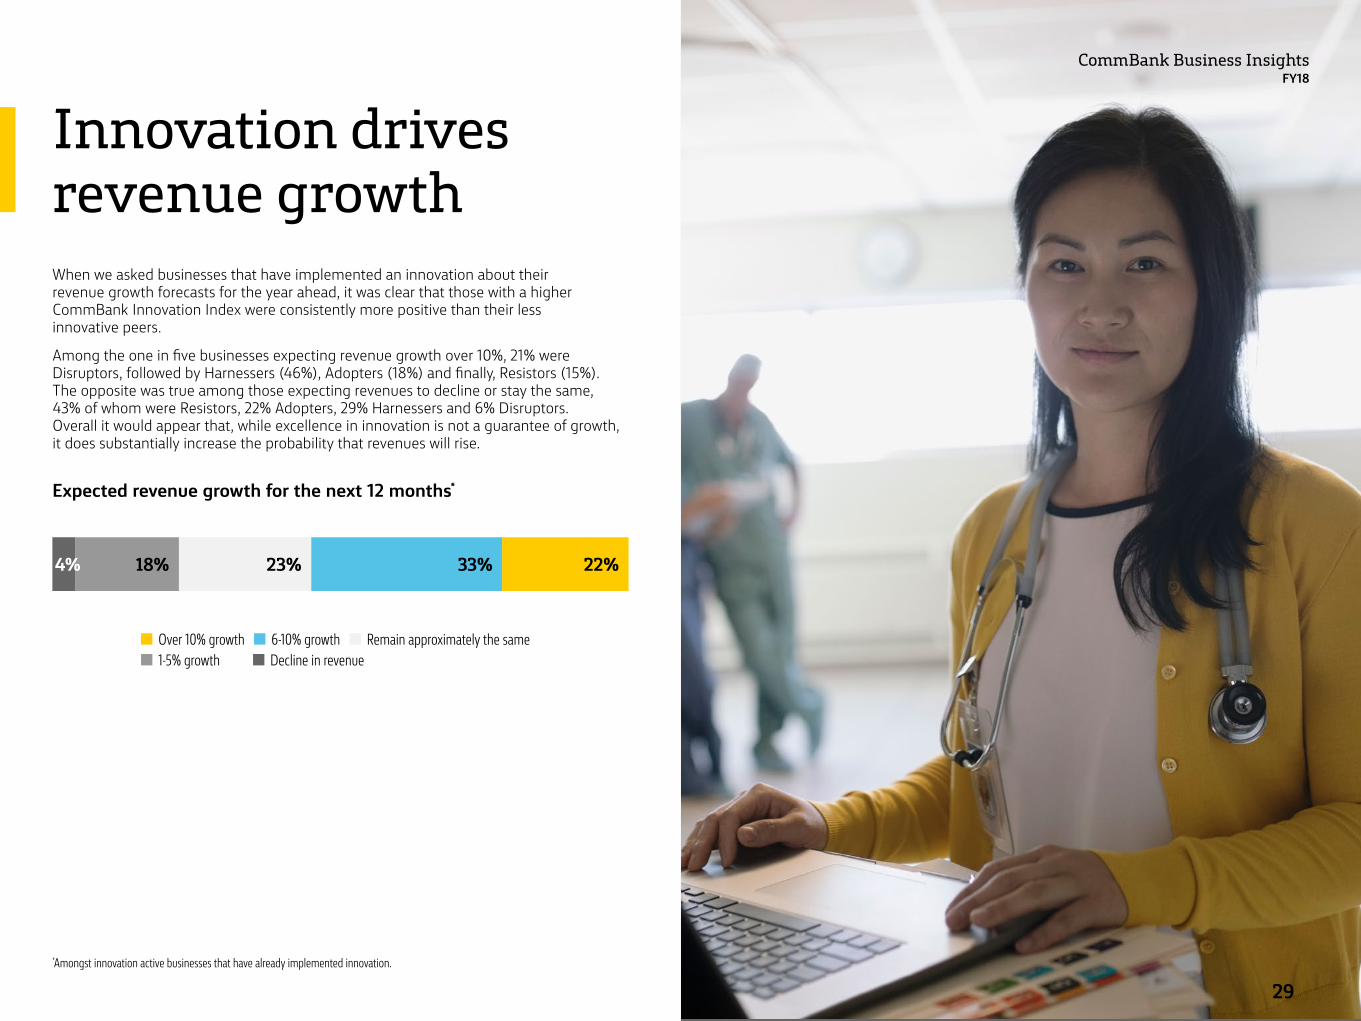
Innovation drives revenue growthWhen we asked businesses that have implemented an innovation about their revenue growth forecasts for the year ahead, it was clear that those with a higher CommBank Innovation Index were consistently more positive than their less innovative peers.
Among the one in five businesses expecting revenue growth over 10%, 21% were Disruptors, followed by Harnessers (46%), Adopters (18%) and finally, Resistors (15%). The opposite was true among those expecting revenues to decline or stay the same, 43% of whom were Resistors, 22% Adopters, 29% Harnessers and 6% Disruptors. Overall it would appear that, while excellence in innovation is not a guarantee of growth, it does substantially increase the probability that revenues will rise.
Expected revenue growth for the next 12 months*
4% 18% 23% 33% 22%
Over 10% growth Decline in revenue 6-10% growth
1-5% growth Remain approximately the same
*Amongst innovation active businesses that have already implemented innovation.
29

CommBank Business InsightsFY18
Reaping the rewards of innovationAreas of investment for innovative businessesBusinesses that are achieving the highest return on their investment are investing in multiple areas, with a particular emphasis on training staff and significantly improving marketing approaches.
30
CommBank Business InsightsFY18
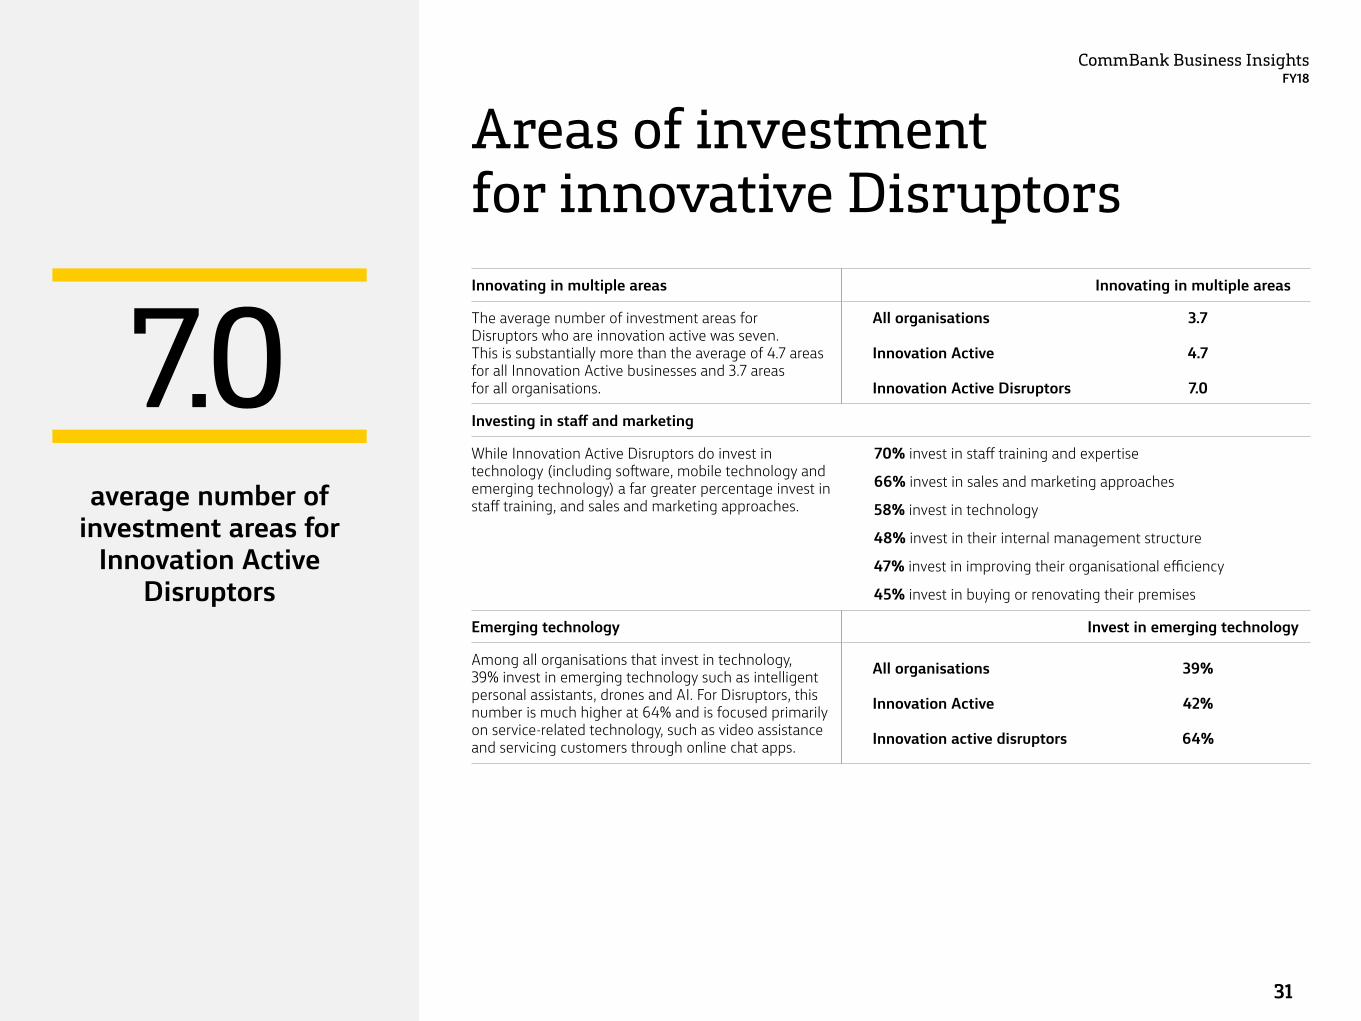
Areas of investment for innovative Disruptors
7.0average number of
investment areas for Innovation Active
Disruptors
Innovating in multiple areas Innovating in multiple areas
The average number of investment areas for Disruptors who are innovation active was seven. This is substantially more than the average of 4.7 areas for all Innovation Active businesses and 3.7 areas for all organisations.
All organisations Innovation Active Innovation Active Disruptors
3.7
4.7
7.0
Investing in staff and marketing
While Innovation Active Disruptors do invest in technology (including software, mobile technology and emerging technology) a far greater percentage invest in staff training, and sales and marketing approaches.
70% invest in staff training and expertise
66% invest in sales and marketing approaches
58% invest in technology
48% invest in their internal management structure
47% invest in improving their organisational efficiency
45% invest in buying or renovating their premises
Emerging technology Invest in emerging technology
Among all organisations that invest in technology, 39% invest in emerging technology such as intelligent personal assistants, drones and AI. For Disruptors, this number is much higher at 64% and is focused primarily on service-related technology, such as video assistance and servicing customers through online chat apps.
All organisations Innovation Active Innovation active disruptors
39%
42%
64%
31
CommBank Business InsightsFY18
Learnings from successful innovatorsHow to foster or increase innovation in your business
32
CommBank Business InsightsFY18
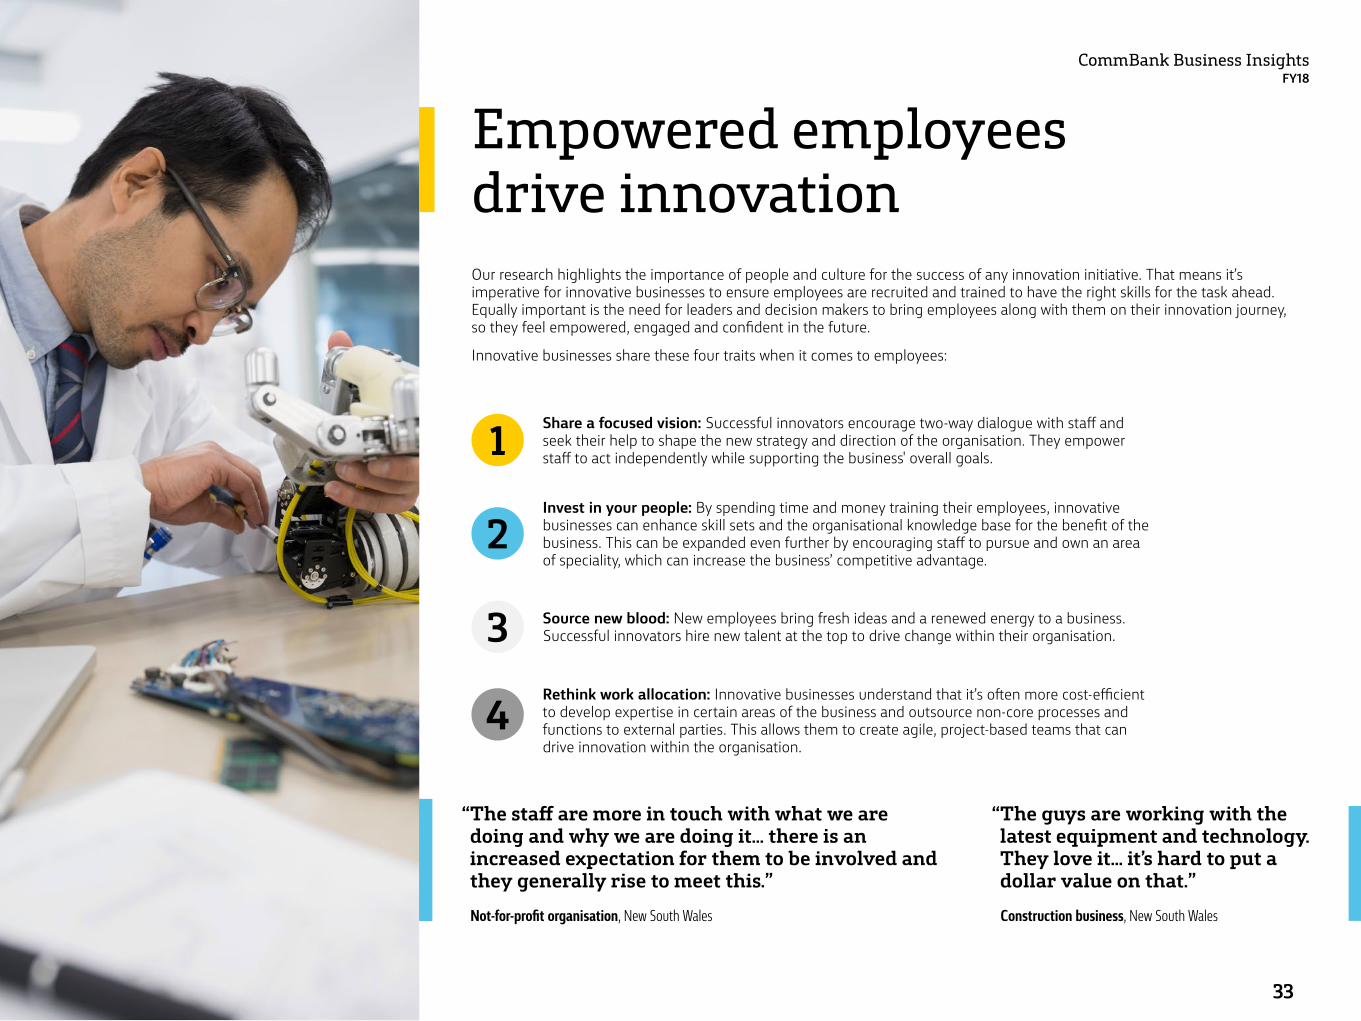
Empowered employees drive innovationOur research highlights the importance of people and culture for the success of any innovation initiative. That means it’s imperative for innovative businesses to ensure employees are recruited and trained to have the right skills for the task ahead. Equally important is the need for leaders and decision makers to bring employees along with them on their innovation journey, so they feel empowered, engaged and confident in the future.
Innovative businesses share these four traits when it comes to employees:
“ The staff are more in touch with what we are doing and why we are doing it… there is an increased expectation for them to be involved and they generally rise to meet this.”
Not-for-profit organisation, New South Wales
“ The guys are working with the latest equipment and technology. They love it… it’s hard to put a dollar value on that.”
Construction business, New South Wales
Share a focused vision: Successful innovators encourage two-way dialogue with staff and seek their help to shape the new strategy and direction of the organisation. They empower staff to act independently while supporting the business' overall goals.1Invest in your people: By spending time and money training their employees, innovative businesses can enhance skill sets and the organisational knowledge base for the benefit of the business. This can be expanded even further by encouraging staff to pursue and own an area of speciality, which can increase the business’ competitive advantage.
2
Source new blood: New employees bring fresh ideas and a renewed energy to a business. Successful innovators hire new talent at the top to drive change within their organisation. 3Rethink work allocation: Innovative businesses understand that it’s often more cost-efficient to develop expertise in certain areas of the business and outsource non-core processes and functions to external parties. This allows them to create agile, project-based teams that can drive innovation within the organisation.
4
33
CommBank Business InsightsFY18
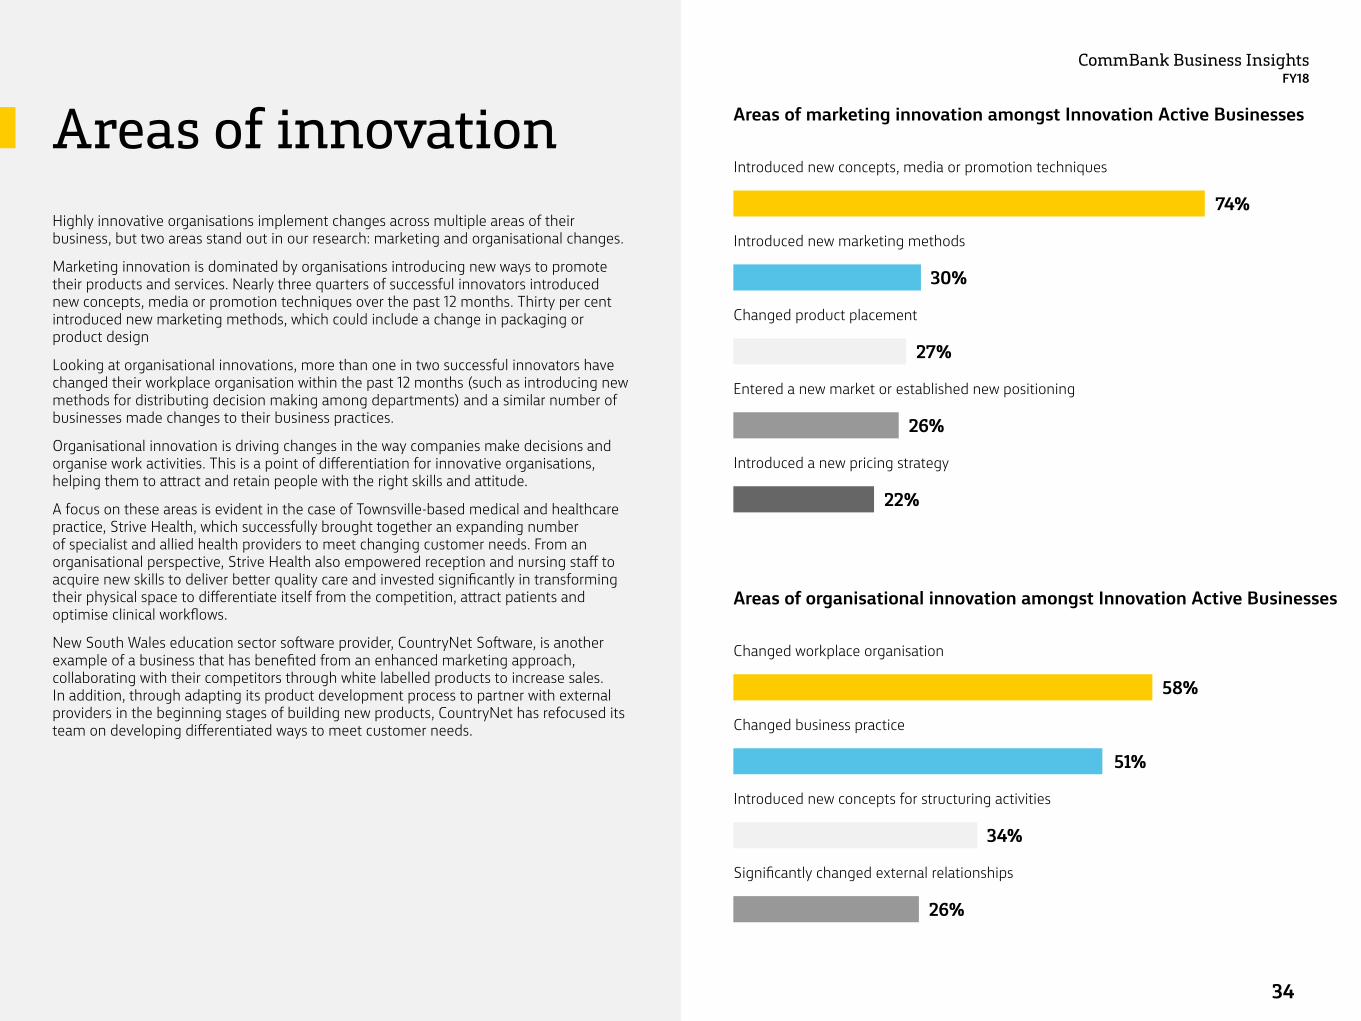
Areas of innovationHighly innovative organisations implement changes across multiple areas of their business, but two areas stand out in our research: marketing and organisational changes.
Marketing innovation is dominated by organisations introducing new ways to promote their products and services. Nearly three quarters of successful innovators introduced new concepts, media or promotion techniques over the past 12 months. Thirty per cent introduced new marketing methods, which could include a change in packaging or product design
Looking at organisational innovations, more than one in two successful innovators have changed their workplace organisation within the past 12 months (such as introducing new methods for distributing decision making among departments) and a similar number of businesses made changes to their business practices.
Organisational innovation is driving changes in the way companies make decisions and organise work activities. This is a point of differentiation for innovative organisations, helping them to attract and retain people with the right skills and attitude.
A focus on these areas is evident in the case of Townsville-based medical and healthcare practice, Strive Health, which successfully brought together an expanding number of specialist and allied health providers to meet changing customer needs. From an organisational perspective, Strive Health also empowered reception and nursing staff to acquire new skills to deliver better quality care and invested significantly in transforming their physical space to differentiate itself from the competition, attract patients and optimise clinical workflows.
New South Wales education sector software provider, CountryNet Software, is another example of a business that has benefited from an enhanced marketing approach, collaborating with their competitors through white labelled products to increase sales. In addition, through adapting its product development process to partner with external providers in the beginning stages of building new products, CountryNet has refocused its team on developing differentiated ways to meet customer needs.
Areas of marketing innovation amongst Innovation Active Businesses
Areas of organisational innovation amongst Innovation Active Businesses
Introduced new concepts, media or promotion techniques
Changed workplace organisation
Introduced new marketing methods
Changed business practice
Changed product placement
Introduced new concepts for structuring activities
Entered a new market or established new positioning
Significantly changed external relationships
Introduced a new pricing strategy
74%
58%
30%
51%
27%
34%
26%
26%
22%
34

Visit commbank.com.au/businessinsightsreportCall 13 19 98 or email [email protected] to access Australian based Business Banking Specialists around the clock.
See your businesses’ CommBank Innovation Index at commbank.com.au/innovationindex
Things you should know: The report is published solely for information purposes and is not to be construed as advice or recommendation. The report has been prepared without taking account of the objectives, financial situation and capacity to bear loss, knowledge or experience or needs of any specific person who may receive this report. All recipients, before acting on the information in this report, should consider the appropriateness and suitability of the information, having regard to their own objectives, financial situation and needs, and, if necessary seek the appropriate professional or financial advice regarding the content of this report. Any opinions, conclusions or recommendations set forth are subject to change without notice. Any projections and forecasts are based on a number of assumptions and estimates and are subject to contingences and uncertainties. Different assumptions and estimates could result in materially different results. The report makes reference to data sourced from an online survey of 2,473 businesses that occurred in August to October 2017. The fieldwork was conducted by DBM Consultants and analysis by ACA Research on behalf of the Commonwealth Bank. All analysis and views of future market conditions are solely those of the Commonwealth Bank. Commonwealth Bank of Australia ABN 48 123 123 124. AFSL and Australian Credit Licence 234945.
Talk to us