Deci Gagne 2005 Self determination theory and work motivation JrnlOrgBehvr
ComfRide: A Smartphone based System for Comfortable PublicTransport Recommendation
Rohit Verma, Surjya Ghosh, Mahankali Saketh, Niloy Ganguly, Bivas Mitra, Sandip ChakrabortyIndian Institute of Technology, Kharagpur, INDIA 721302
{rohit.verma,surjya.ghosh}@iitkgp.ac.in,[email protected],{niloy,bivas,sandipc}@cse.iitkgp.ernet.in
ABSTRACTPassenger comfort is a major factor influencing a commuter’s deci-sion to avail public transport. Existing studies suggest that factorslike overcrowding, jerkiness, traffic congestion etc. correlate wellto passenger’s (dis)comfort. An online survey conducted with morethan 300 participants from 12 different countries reveals that differ-ent personalized and context dependent factors influence passengercomfort during a travel by public transport. Leveraging on thesefindings, we identify correlations between comfort level and thesedynamic parameters, and implement a smartphone based applica-tion, ComfRide, which recommends the most comfortable routebased on user’s preference honoring her travel time constraint. Weuse a ‘Dynamic Input/Output Automata’ based composition modelto capture both the wide varieties of comfort choices from thecommuters and the impact of environment on the comfort param-eters. Evaluation of ComfRide, involving 50 participants over 28routes in a state capital of India, reveals that recommended routeshave on average 30% better comfort level than Google map recom-mended routes, when a commuter gives priority to specific comfortparameters of her choice.
CCS CONCEPTS• Information systems→ Recommender systems; •Human-centered computing → Smartphones;
KEYWORDSRoute recommendation; City transports; Dynamic Input/OutputAutomata
ACM Reference Format:Rohit Verma, Surjya Ghosh, Mahankali Saketh, Niloy Ganguly, Bivas Mitra,Sandip Chakraborty. 2018. ComfRide: A Smartphone based System for Com-fortable Public Transport Recommendation. In Twelfth ACM Conference onRecommender Systems (RecSys ’18), October 2–7, 2018, Vancouver, BC, Canada.ACM, New York, NY, USA, 9 pages. https://doi.org/10.1145/3240323.3240359
1 INTRODUCTIONExisting studies have shown that multiple factors, such as the na-ture of the road, bus condition, traffic congestion, driving pattern,
Permission to make digital or hard copies of all or part of this work for personal orclassroom use is granted without fee provided that copies are not made or distributedfor profit or commercial advantage and that copies bear this notice and the full citationon the first page. Copyrights for components of this work owned by others than ACMmust be honored. Abstracting with credit is permitted. To copy otherwise, or republish,to post on servers or to redistribute to lists, requires prior specific permission and/or afee. Request permissions from [email protected] ’18, October 2–7, 2018, Vancouver, BC, Canada© 2018 Association for Computing Machinery.ACM ISBN 978-1-4503-5901-6/18/10. . . $15.00https://doi.org/10.1145/3240323.3240359
overcrowding, waiting time at different bus stoppages etc. signifi-cantly influence individual commuter’s preference while travelingin a public city bus [14, 32]. Findings of a commuter pain surveyconducted by IBM (2011) show that deterioration of such factorsincreases stress and anger among commuters [1]; in a separatestudy on New Delhi, commuters desire that safety and individualpreferences be honored in public transport [21]. The poor condi-tions get exacerbated in developing countries where in additionto infrastructural limitations like poor road conditions, unplannedcreation of bus stoppages and absence of lanes, public buses dailywitness sights of overcrowding and chaotic behavior of the busdrivers [7, 16, 20, 27, 36].
This backgroundmotivates us to explore the possibility of design-ing a low-cost smartphone-based personalized route recommenderapplication, which takes into account individual commuter com-fort while recommending. Majority of the existing mobile basedtransit recommender systems, such as [2, 3, 11, 12, 18, 19] providerecommendation based on the fare and the travel time optimiza-tion; individual preferences which impact on-route comfort is stilla largely unexplored area. In this paper, we propose ComfRide – anend-to-end smartphone based personalized bus route recommendersystem, which recommends the most preferable bus route based oncommuters’ individual comfort preferences (§ 6.4). It captures di-verse features through smartphones, which impact the commuter’scomfort level while using public transport and develops a personal-ized route recommender employing the fuzzy set theory along withTOPSIS approach [29], which considers individual comfort levelbased on spatio-temporal road and route characteristics. Besidesthis diverse and wide suite of factors across various possible routes,single or multiple breakpoints in the journey is also considered, ifthat increases comfort.
In order to capture the spatio-temporal dynamics over a widechoice of features, we design the route recommendation algorithmusing a specialized compositionalmodel, calledDynamic Input/OutputAutomata (DIOA) [4]. The DIOA ensures that the system is notoverwhelmed with the huge amount of data to be processed thus re-ducing the load on the system. Effectively, ComfRide utilizes DIOAbased compositional model to identify the most preferable routeefficiently based on the historical information and the context ofthe query. Moreover, the DIOA also provides a mechanism to dy-namically modify the model to suit the personalized preferenceof a commuter on obtaining a feedback from her after a trip, thusimproving the quality of recommendation after every trip. An exten-sive deployment of ComfRide involving 50 volunteers for a periodof two years (at weekday, weekend; at 3 different time periods)over 28 routes in a state capital of India reveals that it can recom-mend routes with on average 30% better comfort level than theones proposed by Google Maps as well as other baselines.

RecSys ’18, October 2–7, 2018, Vancouver, BC, Canada Verma et. al.
2 RELATEDWORKIn this section, we present a brief survey of the existing literature,broadly focusing on two aspects related to our work – (a) comfortfeatures and their measurements and (b) personalized transit routerecommender systems.
Comfort features and measurement of comfort: The rela-tive importance of comfort features is a subjective issue as it de-pends on personal, regional and socio-economic attributes. Severalworks done to understand comfort features in public transportsuggest that the choice of a bus route is affected by comfort lev-els [20, 24, 35, 36], and comfort further depends on roughly twoaspects, viz, vehicle performance related features, such as vibrations,jerk etc. [9, 31], and bus-operating environment related features,like over-crowding, travel-time and so on [20, 22, 33, 36]. In most ofthe transport research literature, such as [13, 33, 35] and the refer-ences therein, comfort is measured via personal interviews, whichis time-consuming and labor-intensive, hence lacks scalability andtimeliness. Recently, participatory sensing (crowdsensing) usingsmartphone apps (like CMS [25], RESen [34], CommuniSense [30],UrbanEye [39]) use a new sensing paradigm, called war-driving,where volunteers contribute their phones’ sensor data that can beused to analyze comfort levels.
Personalized transit recommendation: Several public bustrip planner systems are available, like the Google Transit [17],TRipGo [3], GOTransit [2] etc., which give information on alter-native routes, fares, schedules, as well as map-based visualizationof the real time traffic information. Further, some of the person-alized bus route recommendation systems like MetroCognition[5], PATRASH [26] etc. rely on specialized cards [18], war driv-ing [39] or explicit user feedback [5] for route database generation.The existing personalized route recommender systems and tourplanners, like PaRE [23], FAVOUR [8], Routeme [19], Feeder [41],Treads [15],[28], [10], etc. are mostly developed for private cabsand taxis and the social, scenic or time aspects for route recommen-dation and do not consider the wide set of comfort parameters asexperienced during public bus travels in our daily life, along withthe dynamics of the environments as well as personalized choicesof the commuters.
3 MOTIVATIONAL STUDYIn this section, we discuss the findings that motivate us to developComfRide. Our findings are based on the analysis of Google Transitdata and a world-wide user survey conducted involving 300 publictransport commuters.
3.1 Google Transit Data AnalysisFirst, we explore the number of possible routes between a source-destination pair and their features. For this purpose, we select allthe country capitals of the world, where Google Transit informationis available. We randomly select 50 locations in these cities andfind number of bus routes between all the possible pairs. We useGoogle Directions API to get this information. Figure 1 shows thedistribution of the percentage of number of routes between a source-destination pair. We observe that more than 60% of the pairs haveat least 4 bus routes between them and close to 25% have more than8 bus routes. We also calculate the results separately for developed
and developing countries and it can be seen that the result is almostsimilar in both cases.
0 10 20 30 40 50 60 70 80 90
100
0 2 4 6 8 10 12 14
Pe
rce
nta
ge
Number of routes
Overall
0 10 20 30 40 50 60 70 80 90
100
0 2 4 6 8 10 12 14
Perc
en
tag
e
Number of routes
DevelopedDeveloping
Figure 1: Cumulative Distribution of number of bus routes betweenrandom (source, destination) pairs calculated for all the capitalcities of the world where Google Transit information is available.Inset: Same result shown for developed and developing countries.
0
5
10
15
20
25
30
0 2 4 6 8 10 12 14
Mea
n D
ista
nc
e (
km
s)
Number of Routes
(a) Mean and Standard Deviation for Distance
7 8 9
10 11 12 13 14 15 16
2 3 4 5 6 7 8 9 1011121314
Me
an
De
via
tio
n o
n T
rip
Tim
e (
min
s)
Number of Routes
(b) Mean Deviation on Trip Time for a (S,D) pair
Figure 2: a) Mean and standard deviation over distance calculatedover source, destination pairs having similar number of routes. (b)Mean standard deviation of time duration calculated over all theroutes between a given source, destination pair for a given numberof routes.
Although an alternate route may be beneficial in terms of pa-rameters like being less crowded, but it may not be feasible if thetravel time is too high compared to the shortest route. To explorewhether the alternate route choices are feasible, we randomly selectsource-destination pairs having different number of routes betweenthem. For each of these pairs, we measure the difference in distancetraveled and travel time in Figure 2. Figure 2(a) shows that for everytype of route, there is a considerable variation in the trip distance.It also demonstrates that the trend is similar for both long andshort trips. Selection of an alternate route is also driven by the factthat it does not consume high travel time. For this purpose, wefind the standard deviation of travel time over all the routes for agiven source-destination pair. We group these by the number ofroutes and calculate the mean as shown in Figure 2(b). We observethat for none of the routes the mean value of standard deviation intravel time exceeds 15 minutes, which we assume is acceptable bya commuter based on the survey discussed as follows.
3.2 Commuter SurveyWe have conducted a large scale online survey involving more than300 participants across the globe, who mostly access the publictransport system. Responses were obtained from different devel-oped and developing countries including Italy, UK, Netherlands,Norway, Germany, France, USA, India, Nepal, Iran, Pakistan, SriLanka and Vietnam. Around 25% participants are female and are

ComfRide... RecSys ’18, October 2–7, 2018, Vancouver, BC, Canada
Figure 3: Commuter Survey Results: (a) Delay due in reaching, (b)Type of Bus, (c) Travel without seat, (d) Compromise Travel Timeto get a seat, (e) Travel on bad roads, (f) Compromise Travel Timefor better road, (g) Stuck in Traffic, (h) Compromise Travel Time forless congested route (time units are in minutes)
aged between 20 to 65 years. In our survey, we design the question-naire to assess factors like total travel time, traffic congestion, sittingprobability, road condition, bus type (AC or non-AC buses), numberof stops, break journey, which reflect factors regulating commutercomfort and their interplay for a comfortable journey.
Table 1: Country-wise Responses to issues faced by commuters (Allvalues are in percentage; Re: Regularly, O: Occasionally, R: Rarely,VB: Very Bad, B: Bad, M: Moderate, N: None)
CountriesDelay in Reaching No seat Bad Road Traffic JamRe O R Re O R VB B M N Re O R
India 40.7 43.5 15.8 47.8 37.2 15 24.9 42.3 30 2.8 67.6 26.5 5.9Nepal 80 20 0 40 60 0 40 20 40 0 60 40 0Iran 12.5 62.5 25 62.5 25 12.5 0 12.5 75 12.5 62.5 37.5 0
Sri Lanka 66.7 16.7 16.6 83.3 16.7 0 16.7 33.3 50 0 83.3 16.7 0USA 0 42.9 57.1 14.2 42.9 42.9 14.3 42.9 28.6 14.3 28.6 14.3 57.1
France 0 25 75 75 25 0 0 75 25 0 25 25 50
In a nutshell, this survey reveals that there exist multiple param-eters (Figure 3), viz., speed of the bus, congestion, probability ofgetting a seat, etc, which impact commuters’ comfort during thetrip, and individuals differ widely in their perception of comfortprimarily depending on their age and gender. Moreover, the trendis quite similar all over the world (Table 1).
3.3 SummarySummarizing, we can state that (a) an alternate non-minimum dis-tance route could be the most comfortable one for a commuter butfinding this manually is not feasible always, (b) There are differ-ent factors influencing commuter comfort on a public bus, whichare more pronounced in developing countries. Different sensors ina smartphone, like accelerometer, compass, GPS could determinevarious road and route features and correlate them with commutercomfort [34, 37, 40]. By utilizing such crowdsourced features froma smartphone, we propose ComfRide to recommend the most com-fortable route based on the personalized preferences of a commuter.
4 CHALLENGES INVOLVEDDevelopment of a recommendation system considering various on-road diversities and personalized choices of commuters has multiplechallenges, as discussed in this section.
0
5
10
15
20
25
30
35
2 3 4 5 6 7 8 9 10 11 12 13 14
ln(S
tate
Sp
ac
e)
Number of Routes
(a) Memory Requirement
FAVOURPaRE
20
40
60
80
100
120
140
2 3 4 5 6 7 8 9 1011121314
Co
mp
uta
tio
n T
ime
(se
cs)
Number of Routes
(b) Computation Time
FAVOURPaRE
Figure 4: Impact of increase in the number of routes on the mem-ory requirement and computation time of the two approaches (a)Natural logarithm of the average state space varying with numberof routes for both the algorithms. (b) Variation of average computa-tion time when each of the two algorithms are executed.
4.1 Developing a Personalized SystemUsers may have personalized choices towards finding out the mostcomfortable route. While one user may prefer a route with min-imum travel time even if the bus is crowded; a second user mayprefer a route that is not crowded and thereforemaximizes the possi-bility of getting a seat. The system should adopt to the personalizedchoices of the users while making a recommendation.
4.2 Optimizing Memory & Computation TimeThe general approach of addressing a route recommendation prob-lem would be to convert it into a graph-based problem and runqueries on the graph. A graph-based approach for route recommen-dation has following challenges.
4.2.1 Generation of Complete Network Graph. The directapproach would be to store the complete route data as a graph, andthen any query is processed on this graph. FAVOUR [8] is a routerecommender system for private vehicles based on this approach.Considering the factors like (a) possibility of multiple feasible routesbetween a source-destination pair, (b) possibility of opting for one ormore breakpoints during the journey for improving comfort choice,and (c) users’ personalized choices on route parameters (like traveltime, road condition, crowdedness), the state space of the graphcan increase exponentially. To observe this, we have executed theFAVOUR algorithm [8] on the public bus transit routes obtainedthroughGoogle Directions API. Considering the plot given in Figure4(a), it is evident that an increase in the number of routes increasesthe average state space exponentially. In addition to increasing thememory requirement, this also increases the computation time asseen in Figure 4(b). The average computation time increases tomore than a minute (over a system with Intel(R) Xeon(R) E5-2620v3 @ 2.40GHz CPU, 32GB memory, Debian 9.3) when 6 routes arepossible, and becomes double when the number of possible routes is14. A high response time is not suitable for a mobile based system.
4.2.2 Generating a Query-based Sub-graph. Another ap-proach would be to not generate the complete graph at one go;instead whenever a query comes, a graph is generated based on thequery information. PaRE utilizes such approach for query executionfor route recommendation based on historical trajectory data [23].Employing such an approach reduces the state space as shown inFigure 4(a) (from similar experiments over the routes from GoogleDirections API as mentioned earlier). However, the computation

RecSys ’18, October 2–7, 2018, Vancouver, BC, Canada Verma et. al.
time is not decreased considerably pertaining to the overhead ofgeneration of the query graph for each query. Here we observe thatthe average computation time reaches close to 2 minutes for 14possible routes.
5 COMFRIDE SYSTEMDeveloping an end-to-end system requires tackling the previouslymentioned technical challenges efficiently. In this section we firstdiscuss how we plan to overcome the challenges and then give anoverview of the ComfRide system.
5.1 Mitigating the ChallengesBased on previous discussion, we need an approachwhich optimizesboth memory and graph generation time. A natural choice for thisis to remember the relevant information based on the context of aquery (like the time of the day when a query is fired) and prune thenodes which are irrelevant to the context. For example, a route mayremain very crowded during the evening, and therefore, if a userasks for a less crowded route with a budget on travel time duringthe evening, the crowded routes may be pruned a priori based onthe memory and the context.
To utilize such historical patterns and the context of a query,we use DIOA [4] as a specialized data structure. A DIOA is a statemachine where any transition is linked to some named actions orsignatures. The signatures are programs or algorithms that canbe executed dynamically on the fly to change the structure of theautomata. These signatures can be both to interact with the envi-ronment (external entities like some other automata) for extractingthe historical patterns and the context information (called input oroutput signatures), or to perform local tasks (internal signatures).As an example, the input signature of an automata can providehistorical patterns (like the statistics of a route) and the context(like time of the day), whereas the internal signatures can prune outunnecessary nodes from the graph and find out the best possibleroute according to commuter’s choice. As shown in Figure 5, theinput is received from the user as well as from the database thatcontains historical information, and the system triggers variousinternal signatures. These internal signatures apply filters based onthe context of the query as defined above. Routes passing all thesefilters are only considered and hence the final graph generation isfast. The dynamic nature ensures that the automata can be updatedanytime during the execution based on the signatures. Moreover,this ensures that a copy of the automata can be generated in parallel,when the automata is already being used by some other signature,and a separate query can be run on this copy.
The dynamic nature of DIOA also helps in designing a personal-ized system based on user feedback as an input signature, as shownin Figure 5. Once a commuter experiences a travel based on therecommendation of the system, she has the option to provide afeedback to the system. This feedback can be processed by theautomata signatures for embedding the personalized choice of thecommuter inside the internal signatures.
5.2 System OverviewThe overall system can be divided into two broad modules (Figure 5)– (a) the client module (the smartphone app) which runs the client
Figure 5: System Architecture
automaton and (b) the server module (runs over a remote server)that runs the server automaton with various filters as internalsignatures. Additionally, ComfRide uses a database to store thehistorical information that are used by the server module to applyvarious filters using the internal signatures.
5.3 Database GenerationThe rich database is the core component of ComfRide. The databasecontains various road and route related features that influence thecomfort level of a commuter. This database is stored at the ComfRideserver and queried during the route recommendation. In ComfRide,a bus route is divided into multiple segments, and the comfort fea-tures are computed for individual segments at different times of theday to capture the spatio-temporal diversity of feature values overthe route. The data collection module of the ComfRide app runsas a background process that collects various sensor data periodi-cally from the smartphone sensors, like accelerometer, gyroscope,compass, periodic GPS, sound sensors etc. leveraging on the exist-ing crowdsensing techniques [5, 34, 38]. From these sensor data,we extract various Point of Concerns (PoC) that can impact travelchoice, like sharp turn, speed breakers, bad road patches, congestedroads and crowded route segments. Existing methodologies fromthe literature [30, 34, 37, 39] have been utilized for this purpose.Based on the survey conducted on general commuters (§ 3), weprimarily focus on following features that can impact users’ choicein selecting a bus route. These features are classified into two cate-gories. (a) Segment specific features: Features like (i) average speedof a bus from one stoppage to the next stoppage, (ii) crowding, (ii)probability of skipping a bus stop, (iii) average stopping time at a busstop, (iv) jerkiness and (v) speed before a PoC would vary betweenroute segments; hence are calculated separately for every segment.These features also vary widely at different times of the day; so, wecapture temporal distribution of the feature values by dividing theday into multiple time zones. (b) Route specific features: Featureslike the distribution of PoCs over a bus route are evaluated overthe complete route.

ComfRide... RecSys ’18, October 2–7, 2018, Vancouver, BC, Canada
6 ROUTE RECOMMENDATION USING DIOAWe construct the signatures of the DIOA forComfRide, that executesa query based on the information available at the database, contextof the query and personalized choices of the user. During the queryexecution, the user provides the source-destination pair and herpersonalized choices on the query features through the ComfRideapp, which is executed at the server based on the DIOA signatures.
6.1 ComfRide DIOATheComfRideDIOA consists of two components - the client automa-ton (runs at the Smartphone app) and the server automaton (runsat the processing server), as shown in Figure 5. Figure 6 gives thestates, signatures and transition details for the client and the serverautomata. The broad features of ComfRide DIOA are as follows. Atthe beginning of a travel, the client sends a query to the server.Based on the source (s)-destination (d) pair in the query, the serverextracts a set of candidate routes (R) based on the filters discussedin the previous section. It then shortlists the predominant routefeatures (F) from the database for the given s-d pair and requeststhe clients to provide a feature ordering and weights based on thepersonalized choice. This is the first filter that removes unfeasibleroutes based on the query context (like time of the day, spatialcharacteristics of the route etc.). According to the feature orderingF and the feature weightsW along with the context of the queryand historical statistics about the route, the server DIOA appliesseveral internal signatures to find out the most suitable route R forrecommendation. Finally, the commuter provides a feedback (F ) tothe client automaton at the end of the trip, which helps the DIOAto integrate personalization within the feature weights. The detailsof the client and the server automata are discussed next.Client Automaton: The client has a four-state automaton, withan initial idle state and three other states – (i) query for featureselection (querying), (ii) waiting for the recommended route af-ter a query (waiting) and (iii) when the commuter is en-route(riding). The client automaton is initialized at the idle state, andthe initial input to the automaton is from the commuter with thes-d pair (request(s,d)). On receiving the input, the query is for-warded to the server, and the client state is changed to querying.At this state, the client can receive an input signature from theserver for providing the personalized choice of feature ordering(response(F)), and based on the user input for feature orderingand weights, it generates an output signature ftr_order(F,W)to response the same. Here,W are the feature weights calculatedfrom the feedback value F . It is to be noted that for the first trip,the weights are non-personalized. These weights are updated aftereach trip based on the feedback received from the user. At thisstage, the client moves to the waiting state. Finally, once the rec-ommended route from the server is received as an input signatureinform(R), the client moves to the riding state. At the end of thetrip, the client automaton is reset to the idle state after providingthe feedback through the signature feedback(R,F ). Once here,the client executes the internal signature correct(F ,W), to setthe personalized weights based on the user feedback.Server Automaton: The server automaton has three states – (i)feature selection (ftrsel), (ii) route selection (routesel) and (iii)
Figure 6: The complete state diagram of the DIOA based model inComfRide. Numbers below the transition arrow represent the exe-cution steps in the working of ComfRide. "POST: <sig>" transitionsare the effect of the signature sig.
idle (idle). Moreover, ftrsel and routesel each have two inter-mediate boolean state variables (fweight and rfind) indicatingthe status of the information available from the clients. Initially theserver is in the idle state, while the intermediate state variablesare set to false. It receives inputs as the route query (query(s,d))and feature order (ftr_order(F,W)) from the client automaton.The outputs are the responses that it sends to the client corre-sponding to selected predominant features for a given s-d pairin the query (response(F)) and the final recommended route(inform(R)). The server automaton has three internal signaturesto prune out irrelevant information (the filters) – (i) selecting pre-dominant features based on the historical statistics and the querycontext (select_ftrs(s,d)), (ii) assigning weights to the featuresfor user personalization (assign_wt(F, W)), and (iii) findingthe route for recommendation from the set of candidate routes(findroute(R) where R is the set of candidate routes). We nowdescribe the methodology used by the internal signatures.
6.2 Feature Shortlisting (select_ftrs(s,d))Among the set of available features, a subset of them becomespredominant for a given route based on the context of the query.For example, certain routes never remain congested at the nighttime; so, it may not be a prominent feature for a query over thatroute during night time. ComfRide aims to identify and flash onlythe prominent features to the commuters. To find the predominantfeatures F, the server automaton computes the occurrence density(number of occurrences per km of the route) of all the features ofa route. select_ftrs(s,d) signature selects the features that arehaving the top |F| highest occurrence density among all possibleroutes between the given s-d pair.
6.3 Adjust Feature Weight (correct(F , W))In the ComfRide app, a commuter gives a score on a 5-point scaleto each of the predominant features between the s-d pair of thequery. Consequently, the weights (ω) of the features are assignedfollowing the Likert Scale (1, 3, 5, 7 and 9 for five features) for thefirst trip by a commuter. For every subsequent trips, the feedbackprovided by the commuter during the previous trips is used to

RecSys ’18, October 2–7, 2018, Vancouver, BC, Canada Verma et. al.
tune the weights of the features. Assume that for a feature f1, thecommuter gives a feedback ϵ f1i ∈ F , and the previously assignedweight was ωf1
i−1 after the (i − 1)th trip. Then, we assign the weightfor the ith trip as ωf1
i = ωf1i−1 + ω
f1i−1 ∗ ϵ
f1i . It is to be noted that the
relative weights of two features should follow their rankings basedon the Likert scale. So, if f1 and f2 are two features with Likertscale valuesWLf1 andWLf2 (WLf1 ≤ WLf2 ), then ω
f1i ≤ d × ω
f2i ,
whered = WLf2WLf1
. After every ith trip, if the commuter is dissatisfied
with respect to a feature fk by ϵfki , then after a fixed number of
trips, ϵ fki → 0. Eventually, the weight assigned to the feature fkconverges to the same as desired by the commuter. This is becauseϵfki is non-increasing as an increase in the weight for a featurewould give a better or same route. Hence, the new recommendationwouldn’t dissatisfy the commuter more than the previous case.
6.4 Route RecommenderBased on the user provided feature ranking and personalized featureweight adjustment by the server automaton, the internal signaturefindroute(R) extracts the recommended route from the set ofcandidate routes R. The set of candidate routes includes all thefeasible routes between the given s-d pair in the query, which con-form to the user’s travel time budget. The allowable deviation intravel time is taken as an input during the ftr_order(F,W) sig-nature execution. We consider the routes between the given s-dpair, where the median travel time as obtained from the historicaldata is not more than the historical median travel time for the leastcost route (the route with minimum travel time) for the s-d pairplus the allowed deviation specified by the commuter. In ComfRidewe employ the fuzzy set theory based recommendation techniquealong with TOPSIS to develop our recommender [6, 29]. TOPSISconstructs a feature matrix for various available alternatives andranks the alternatives based on the distance similarity with theworst alternative in comparison to the best alternative. The majorchallenges here are (a) to obtain the feature set and a matrix ofpossible alternatives and (b) to optimize this matrix over differ-ent factors to get the best route based on a ranking strategy. Thedata collection application and database generation take care ofidentifying and defining the feature set. The pruning techniquesemployed using the DIOA further simplify the resulting matrix offeature sets for various alternate routes. Consequently, the scor-ing as discussed in [29] gives the value of the metric called RouteComfort Index (χ ), defined as follows. Let ρ be the feature value ascomputed for a route, andω is the feature weight obtained from theinternal signature assign_wt(F,W). The feature values are cal-culated from the crowdsourced data collected from the commutersusing the techniques discussed in [37], and are normalized overdifferent routes based on TOPSIS feature normalization [6]. Then,χ =
∑n∈F ρn ∗ ωn . Now, for every route in R, χ is calculated from
the feature matrix, and the route having the highest rank based onTOPSIS distance similarity over χ is recommended.Opting for a break journey: Based on the commuter’s choice ofcomfort parameters, there may be instances when taking a break-point during the journey and availing a different bus from thebreakpoint to the destination are more fruitful than taking a direct
Figure 7: Considering breakpoints during a travel
route. If the commuter opts for a break journey, then we have toconsider both break and non-break scenarios.
We solve this problem through a dynamic programming ap-proach. The basic intuition is as follows. A breakpoint can be takenat a stoppage where two different bus routes intersect. From theset of candidate routes R between the given s-d pair, we first findout such intersecting stoppages. Let C be the set of such intersect-ing stoppages. Then we construct a weighted direct acyclic graph(DAG) G(V,E) as follows. The vertex set V contains the elementsC ∪ {s,d}. We construct an edge e(v1 ∈ V,v2 ∈ V) ∈ E if there isat-least one direct bus route fromv1 tov2 without having any otherintersecting stoppages in between. Note that there can be morethan one bus routes fromv1 tov2. The edge weight for e(v1,v2) ∈ Eis the χ value for the best bus route between the two intersectingstoppages v1 and v2, calculated using TOPSIS as discussed earlier.Figure 7 shows an example with 4 different routes between the s-dpair and the corresponding DAG structure. We apply the dynamicprogramming over this DAG structure. Consider the route from s tod via C1 and C3, as shown in Figure 7. There are two substructuresif the commuter wants to take a single break – either break at C1or take a break atC3, and choose a different bus route. We considerthat χ of an end-to-end travel is the average of all the χ values ofthe route segments that the commuter follows. Let χns ,d denote theRCI between s and d with n number of breaks. Then the optimalsubstructure of this problem is represented as follows.
χns ,d = maxc ∈C,1≤m≤n
1n
((n −m) × χn−ms ,c +m × χmc ,d
)(1)
Let a commuter prefers at most β number of breaks. Then basedon the dynamic programming approach, we compute the recom-mended travel as the sequence of bus routes with zero or morebreakpoints, which provide the maximum RCI as follows.
χmaxs ,d = max
0≤n≤βχns ,d (2)
7 IMPLEMENTATION AND RESULTSWe have developed ComfRide as an Android app. The deploymentand testing of the system spanned for around two years – fromMarch 2016 to April 2018, when we conducted rigorous data col-lection and analysis in a state capital city (area 1887 sq.km) inIndia. The experiment has been conducted on 7 source-destinationpairs, with 28 different bus routes. The details of the routes forthese 7 source-destination pairs are given in Table 2. The Com-fRide server is implemented on Debian 9.3 server, with a Intel(R)Xeon(R) E5-2620 v3 @ 2.40GHz CPU and 32GB memory. Diverseset of smartphones have been used during experiments with costranging from 90US$ to 300US$ and the Android version 4.4 to 6.0.

ComfRide... RecSys ’18, October 2–7, 2018, Vancouver, BC, Canada
Table 2: Source-destination (S-D) Pair Details; Distance and traveltime are given for all possible routes between the S-D pairs
(S, D) Pair Source DestinationDistance(km)
Avg. TravelTime (min)
1 2 3 4 5 1 2 3 4 5P1 KM RH 10 10 15 15 9 55 55 65 65 50P2 SC RH 6 6 6 6 - 30 30 30 30 -P3 SC GH 8 8 8 8 - 45 45 50 50 -P4 KM JP 15 15 20 20 14 70 65 95 90 65P5 TG CC 4 4 5 6 - 25 27 35 40 -P6 NT MS 14 13 - - - 55 50 - - -P7 SS RG 14 14 15 15 - 42 58 46 46 -
0
0.2
0.4
0.6
0.8
1
1.2
1.4
P1 P2 P3 P4 P5 P6 P7No
rma
lize
d T
ime
to
get
se
at
(Source, Destination) Pair
(a) Time to get a seat
ComfRide RecommededG-Maps Recommended
0
0.2
0.4
0.6
0.8
1
1.2
1.4
P1 P2 P3 P4 P5 P6 P7
Tri
ps w
he
re u
ser
go
t s
eat
(Source, Destination) Pair
(b) Fraction of trips where user got seat
ComfRide RecommededG-Maps Recommended
Figure 8: Comparison of ComfRide recommended and G-Maps rec-ommended routes with respect to probability of sitting
7.1 Experiment Planning and SetupsFor data collection through controlled crowdsourcing, we recruited50 volunteers, who were primarily undergraduate college students.These students were provided with suitable incentives (approx.$50 as honorarium and a volunteer certificate). 20 volunteers weregiven specific travel routes (source, destination and the road to befollowed) where they traveled in their leisure time (semi-controlledexperiments), while the remaining volunteers collected data dur-ing their regular travels from home to college and back (generaldeployments). Volunteers were asked to perform experiments fortwo sets of routes – with and without a break journey, based onComfRide recommendation. Every trip was taken by a group ofvolunteers on different days at various times of the day. Duringthe semi-controlled experiments, a group of volunteers traveledthrough the ComfRide recommended route based on their choiceof comfort, whereas another group of volunteers traveled usingGoogle Maps (G-Maps) recommended route (the baseline mecha-nism) on the same day during the same time. It can be noted that theG-Maps navigation system recommends a series of routes, whichare ordered according to the total expected travel time. For baselinecomparison, the volunteers have taken the route with the leastexpected travel time as recommended by the Google navigation.
7.2 ComfRide vs. Google NavigationFirst, we compare the performance between ComfRide recommen-dation and G-Maps recommendation in terms of various comfortfeatures. However, due to space constraints, here we discuss andcompare the performance in terms of crowding of a bus, whichis measured in terms of the possibility of getting a seat after acommuter boards a bus. In this case, the commuters give highestpreference to the less crowded bus routes followed by less traveltime, jerkiness and congestion. Figure 8(a) compares recommendedand non-recommended routes w.r.t. average time after which thecommuter secures a seat. We normalize this time by the total travel
0
0.2
0.4
0.6
0.8
1
1.2
1.4
P1 P2 P3 P4 P5 P6 P7
No
rma
lize
d T
ime
in
co
ng
esti
on
(Source, Destination) Pair
(a) Congestion
ComfRide RecommededG-Maps Recommended
0
0.2
0.4
0.6
0.8
1
1.2
P1 P2 P3 P4 P5 P6 P7
Ro
ute
Co
mfo
rt I
nd
ex
(Source, Destination) Pair
(b) Route Comfort Index
RecommendedNext Best
Figure 9: (a) Trade-off w.r.t. congestion when giving preference toprobability of sitting, (b) Variation of RCI for different S-D pairs
time. We observe that for all the trips, this time is very low forthe recommended route, except for P6 where there are only twopossible routes and hence less possible variations. We see zero valuefor P1 and P4; this is mainly because of the fact that the source isa terminal bus stop for the ComfRide recommended route. Figure8(b) shows the fraction of trips when the commuter was able to geta seat. The commuter gets a seat for all the trips except in case ofone trip for P3 and P5, when the recommended route is preferred.However, giving a higher preference to the sitting probability canresult in a trade-off w.r.t. other parameters. We show this trade-offfor congestion in Figure 9(a). In most of the cases, time in conges-tion is higher when on a ComfRide recommended route based onsitting probability. However, this is not always true as for P2 andP6.
We check the average RCI for the ComfRide recommended routesand G-Maps recommended routes, as shown in Figure 9(b). Ourexperiments show that the route recommended by ComfRide has abetter average RCI than the other routes in between the same source-destination pair. We observe that on an average, the recommendedroutes have a 30% better comfort level. It can be noted that therecommendation is based on the commuter’s choice and priorityassigned for different features during the trip.
7.3 Impact of PersonalizationNext, we analyze how different features impact route recommen-dation over different bus routes. There are certain cases when theroute recommended by ComfRide and G-Maps are similar, primarilyfor the cases where there are less alternate routes, or the commutergives priority to the travel time. During the semi-controlled ex-periments, we have considered multiple orderings of features atdifferent times of the day, and checked for how many instances, theComfRide recommended route and G-Maps recommended routesare same. In Figure 10(a) we show the percentage of trips whenboth the systems have recommended the same route. P6 has higherpercentage because it has only two different bus routes. Interest-ingly, we observe that the ComfRide recommended routes differfrom G-Maps recommended routes for many instances, which is ashigh as 70% for P2 and P3, indicating that a route recommendationbased on commuters’ choice of comfort features is important andnot a trivial extension of G-Maps based navigation system.
7.4 ComfRide vs Competing SystemsWe compare ComfRide with two personalized route recommendersystems proposed recently – PaRE [23] and FAVOUR [8]. PaRE relieson historical data collected from previous trips of the commuter to
RecSys ’18, October 2–7, 2018, Vancouver, BC, Canada Verma et. al.
20
25
30
35
40
45
50
55
60
65
P1 P2 P3 P4 P5 P6 P7
Perc
en
tag
e
(Source, Destination) Pair
(a) Same ComfRide and G-Maps Recommendation
0
0.2
0.4
0.6
0.8
1
1.2
P1 P2 P3 P4 P5 P6 P7
RC
I
(Source, Destination) Pair
(b) Competing Systems
FAVOURPaRE
ComfRide
Figure 10: (a) Percentage of times G-Maps and ComfRide recom-mend the same route (b) Average RCI of different S-D pairs for thecompeting systems
Table 3: State space comparison for Graph & DIOA based approach
(S,D) Pair Stops Available Routes Graph DIOA
P1 85 5 599760 425P2 24 4 46368 120P3 60 4 297360 300P4 150 5 1877400 750P5 57 4 268128 285P6 64 2 338688 320P7 95 4 750120 475
identify important landmarks and frequently used routes. It thenrecommends the route to maximize the familiarity while minimiz-ing number of segments. FAVOUR asks a set of questions to thecommuter, and then uses mass preference prior to predict best routefor her. This prediction is improved using Bayesian learning tech-niques. We execute PaRE and FAVOUR over the collected datasetand compare the recommendation performance with ComfRide.
7.4.1 Performance in terms of RCI. None of these two per-sonalized route recommender consider the features used in Com-fRide, and several scenarios are seen when the competing systemsperform poorly. The average RCI for different source-destinationpairs is higher for ComfRide as compared to the other two, as seenin Fig 10(b). FAVOUR gives priority to the general choices of thecommuters over a route, and so, fails to capture the personal choicesof a commuter. On the other hand, PaRE gives priority to the per-sonal choices, and thus ignores environmental impacts. ComfRidebalances both the personal choice and the environmental impact,and therefore improves the RCI compared to others.
7.4.2 Advantage of DIOA in ComfRide. We also comparethe advantage of using DIOA over graph-based approaches, asutilized in several route recommender such as [5, 23]. It is evidentfrom Table 3, that the state space is significantly reduced whenusing DIOA compared to the graph-based approach. This providesfast recommendation with reduced computation complexity.
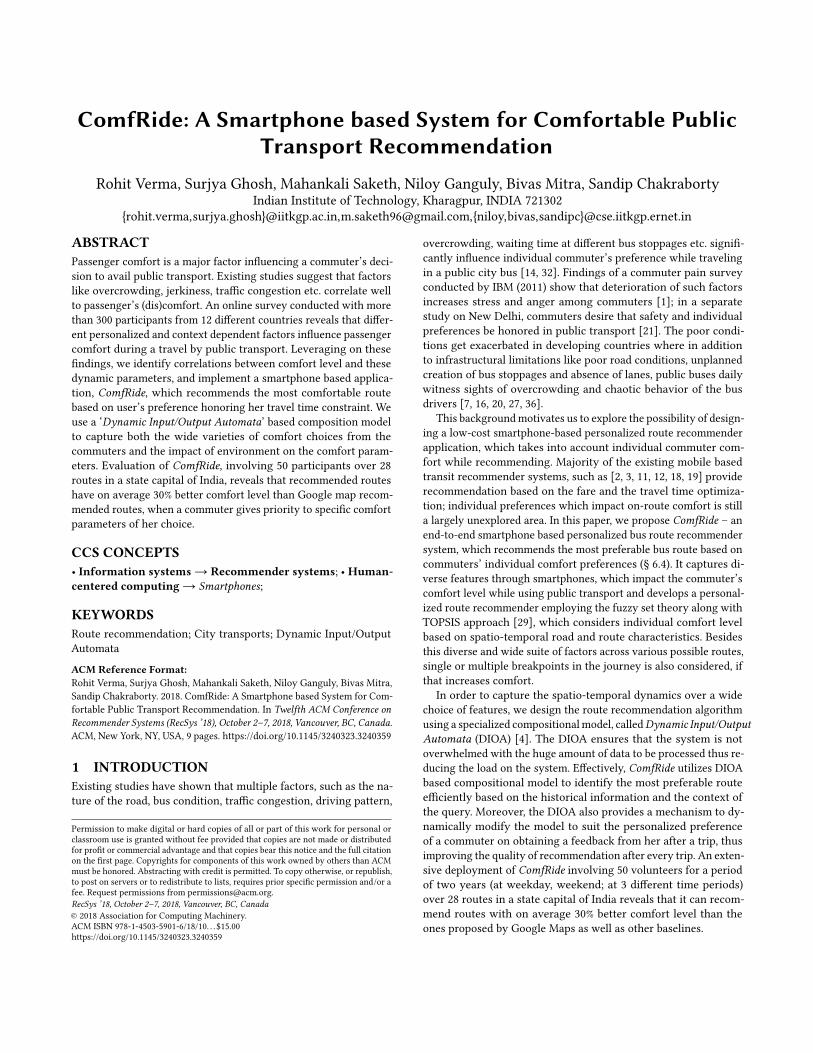
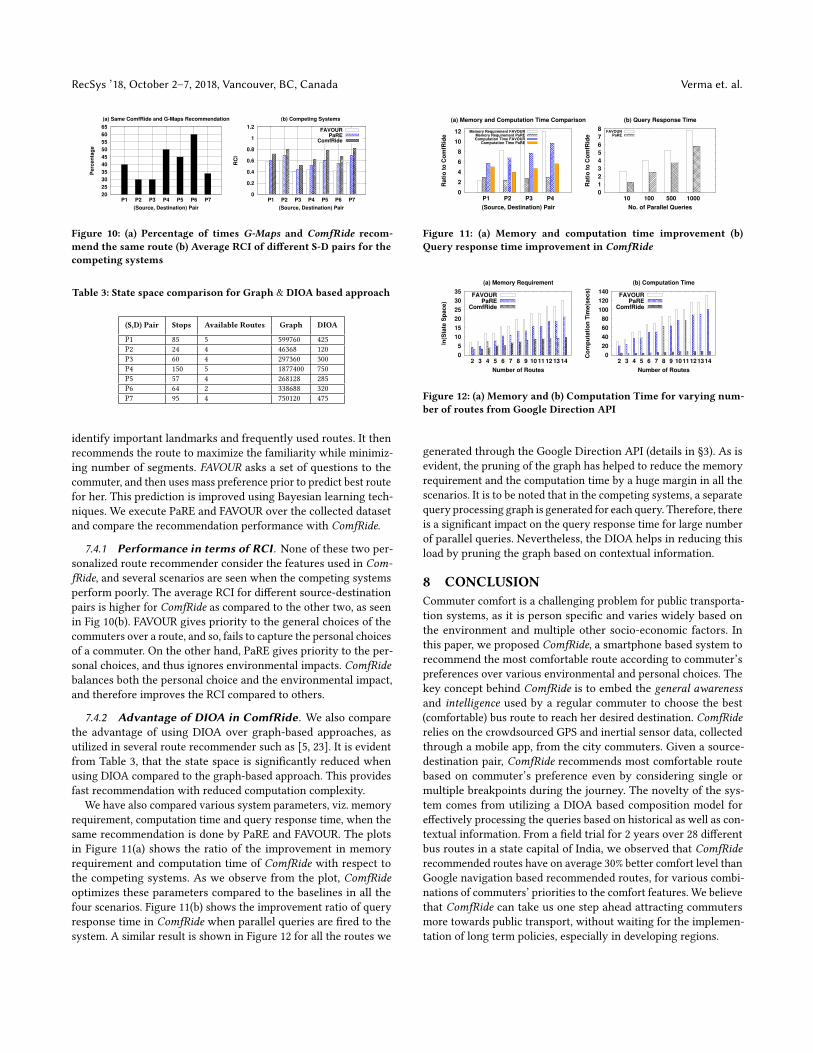
We have also compared various system parameters, viz. memoryrequirement, computation time and query response time, when thesame recommendation is done by PaRE and FAVOUR. The plotsin Figure 11(a) shows the ratio of the improvement in memoryrequirement and computation time of ComfRide with respect tothe competing systems. As we observe from the plot, ComfRideoptimizes these parameters compared to the baselines in all thefour scenarios. Figure 11(b) shows the improvement ratio of queryresponse time in ComfRide when parallel queries are fired to thesystem. A similar result is shown in Figure 12 for all the routes we
0
2
4
6
8
10
12
P1 P2 P3 P4
Ra
tio
to
Co
mfR
ide
(Source, Destination) Pair
(a) Memory and Computation Time Comparison
Memory Requirement FAVOURMemory Requirement PaREComputation Time FAVOUR
Computation Time PaRE
0
1
2
3
4
5
6
7
8
10 100 500 1000
Ra
tio
to
Co
mfR
ide
No. of Parallel Queries
(b) Query Response Time
FAVOURPaRE
Figure 11: (a) Memory and computation time improvement (b)Query response time improvement in ComfRide
0
5
10
15
20
25
30
35
2 3 4 5 6 7 8 9 10 11 12 13 14
ln(S
tate
Sp
ac
e)
Number of Routes
(a) Memory Requirement
FAVOURPaRE
ComfRide
0
20
40
60
80
100
120
140
2 3 4 5 6 7 8 9 1011121314
Co
mp
uta
tio
n T
ime
(se
cs)
Number of Routes
(b) Computation Time
FAVOURPaRE
ComfRide
Figure 12: (a) Memory and (b) Computation Time for varying num-ber of routes from Google Direction API
generated through the Google Direction API (details in §3). As isevident, the pruning of the graph has helped to reduce the memoryrequirement and the computation time by a huge margin in all thescenarios. It is to be noted that in the competing systems, a separatequery processing graph is generated for each query. Therefore, thereis a significant impact on the query response time for large numberof parallel queries. Nevertheless, the DIOA helps in reducing thisload by pruning the graph based on contextual information.
8 CONCLUSIONCommuter comfort is a challenging problem for public transporta-tion systems, as it is person specific and varies widely based onthe environment and multiple other socio-economic factors. Inthis paper, we proposed ComfRide, a smartphone based system torecommend the most comfortable route according to commuter’spreferences over various environmental and personal choices. Thekey concept behind ComfRide is to embed the general awarenessand intelligence used by a regular commuter to choose the best(comfortable) bus route to reach her desired destination. ComfRiderelies on the crowdsourced GPS and inertial sensor data, collectedthrough a mobile app, from the city commuters. Given a source-destination pair, ComfRide recommends most comfortable routebased on commuter’s preference even by considering single ormultiple breakpoints during the journey. The novelty of the sys-tem comes from utilizing a DIOA based composition model foreffectively processing the queries based on historical as well as con-textual information. From a field trial for 2 years over 28 differentbus routes in a state capital of India, we observed that ComfRiderecommended routes have on average 30% better comfort level thanGoogle navigation based recommended routes, for various combi-nations of commuters’ priorities to the comfort features. We believethat ComfRide can take us one step ahead attracting commutersmore towards public transport, without waiting for the implemen-tation of long term policies, especially in developing regions.

ComfRide... RecSys ’18, October 2–7, 2018, Vancouver, BC, Canada
REFERENCES[1] 2011. IBM Global Commuter Pain Survey: Traffic Congestion Down, Pain Way
Up (available online, last accessed: February, 2017). (2011). http://www-03.ibm.com/press/us/en/pressrelease/35359.wss.
[2] 2017. GOTransit, (available online, last accessed: May, 2017). (2017). https://gotransitnc.org.
[3] 2017. TRipGo, (available online, last accessed: May, 2017). (2017). https://tripgo.skedgo.com.
[4] Paul C Attie and Nancy A Lynch. 2016. Dynamic input/output automata: a formaland compositional model for dynamic systems. Information and Computation249 (2016), 28–75.
[5] Garvita Bajaj, Georgios Bouloukakis, Animesh Pathak, Pushpendra Singh, Niko-laos Georgantas, and Valérie Issarny. 2015. Toward enabling convenient urbantransit through mobile crowdsensing. In Intelligent Transportation Systems (ITSC),2015 IEEE 18th International Conference on. IEEE, 290–295.
[6] Majid Behzadian, S Khanmohammadi Otaghsara, Morteza Yazdani, and JoshuaIgnatius. 2012. A state-of the-art survey of TOPSIS applications. Expert Systemswith Applications 39, 17 (2012), 13051–13069.
[7] Maria Bordagaray, Luigi dell’Olio, Angel Ibeas, and Patricia Cecín. 2014. Mod-elling user perception of bus transit quality considering user and service hetero-geneity. Transportmetrica A: Transport Science 10, 8 (2014), 705–721.
[8] Paolo Campigotto, Christian Rudloff, Maximilian Leodolter, and Dietmar Bauer.2017. Personalized and situation-aware multimodal route recommendations: theFAVOUR algorithm. IEEE Transactions on Intelligent Transportation Systems 18, 1(2017), 92–102.
[9] Juan C Castellanos and Fabiano Fruett. 2014. Embedded system to evaluate thepassenger comfort in public transportation based on dynamical vehicle behaviorwith user’s feedback. Measurement 47 (2014), 442–451.
[10] Munmun De Choudhury, Moran Feldman, Sihem Amer-Yahia, Nadav Golbandi,Ronny Lempel, and Cong Yu. 2010. Constructing travel itineraries from taggedgeo-temporal breadcrumbs. In Proceedings of the 19th international conference onWorld wide web. ACM, 1083–1084.
[11] Giusy Di Lorenzo, Marco Sbodio, Francesco Calabrese, Michele Berlingerio, FabioPinelli, and Rahul Nair. 2016. Allaboard: visual exploration of cellphone mobilitydata to optimise public transport. IEEE transactions on visualization and computergraphics 22, 2 (2016), 1036–1050.
[12] Karoly Farkas, Gabor Feher, Andras Benczur, and Csaba Sidlo. 2015. Crowdsend-ing based public transport information service in smart cities. IEEE Communica-tions Magazine 53, 8 (2015), 158–165.
[13] Massimo Florio. 2013. Network industries and social welfare: The experiment thatreshuffled European utilities. OUP Oxford.
[14] André Luís Policani Freitas. 2013. Assessing the quality of intercity road trans-portation of passengers: An exploratory study in Brazil. Transportation ResearchPart A: Policy and Practice 49 (2013), 379–392.
[15] Kaiqun Fu, Yen-Cheng Lu, and Chang-Tien Lu. 2014. Treads: A safe route rec-ommender using social media mining and text summarization. In Proceedings ofthe 22nd ACM SIGSPATIAL International Conference on Advances in GeographicInformation Systems. ACM, 557–560.
[16] Edward Glaeser and J Vernon Henderson. 2017. Urban Economics for the Devel-oping World: An Introduction. Journal of Urban Economics (2017).
[17] Google. 2017. Google Transit, (available online, last accessed: May, 2017). (2017).https://www.google.com/transit.
[18] Danhuai Guo, Ziqi Zhao, Wei Xu, Jinsong Lan, Tao Zhang, Shuguang Liu, JianhuiLi, and Yuanchun Zhou. 2015. How to find a comfortable bus route – towardspersonalized information recommendation services. Data Science Journal 14(2015).
[19] Daniel Herzog, Hesham Massoud, and Wolfgang Wörndl. 2017. Routeme: Amobile recommender system for personalized, multi-modal route planning. InProceedings of the 25th Conference on User Modeling, Adaptation and Personaliza-tion. ACM, 67–75.
[20] Şükrü İmre and Dilay Çelebi. 2017. Measuring Comfort in Public Transport: Acase study for Istanbul. Transportation Research Procedia 25 (2017), 2441–2449.
[21] Suresh Jain, Preeti Aggarwal, Prashant Kumar, Shaleen Singhal, and PrateekSharma. 2014. Identifying public preferences using multi-criteria decision makingfor assessing the shift of urban commuters from private to public transport: A casestudy of Delhi. Transportation Research Part F: Traffic Psychology and Behaviour24 (2014), 60 – 70.
[22] Jue Ji and Xiaolu Gao. 2010. Analysis of people’s satisfaction with public trans-portation in Beijing. Habitat International 34 (2010), 464–470.
[23] Yaguang Li, Han Su, Ugur Demiryurek, Bolong Zheng, Tieke He, and CyrusShahabi. 2017. PaRE: A System for Personalized Route Guidance. In Proceedingsof the 26th International Conference on World Wide Web. 637–646.
[24] Zheng Li and David A Hensher. 2011. Crowding and public transport: a reviewof willingness to pay evidence and its relevance in project appraisal. TransportPolicy 18, 6 (2011), 880–887.
[25] Zheng Li and David A Hensher. 2013. Crowding in public transport: a review ofobjective and subjective measures. Journal of Public Transportation 16, 2 (2013),
6.[26] Hiroyuki Nakamura, Yuan Gao, He Gao, Hongliang Zhang, Akifumi Kiyohiro,
and Tsunenori Mine. 2014. Adaptive user interface agent for personalized publictransportation recommendation system: PATRASH. In International Conferenceon Principles and Practice of Multi-Agent Systems. Springer, 238–245.
[27] Dorina Pojani and Dominic Stead. 2017. The urban transport crisis in emergingeconomies: An introduction. In The Urban Transport Crisis in Emerging Economies.Springer, 1–10.
[28] Daniele Quercia, Rossano Schifanella, and Luca Maria Aiello. 2014. The shortestpath to happiness: Recommending beautiful, quiet, and happy routes in the city.In Proceedings of the 25th ACM conference on Hypertext and social media. ACM,116–125.
[29] Faisal Rehman, Osman Khalid, and Sajjad Ahmad Madani. 2017. A comparativestudy of location-based recommendation systems. The Knowledge EngineeringReview 32 (2017).
[30] Darshan Santani, Jidraph Njuguna, Tierra Bills, AishaW Bryant, Reginald Bryant,Jonathan Ledgard, and Daniel Gatica-Perez. 2015. Communisense: Crowdsourc-ing road hazards in nairobi. In Proceedings of the 17th International Conference onHuman-Computer Interaction with Mobile Devices and Services. ACM, 445–456.
[31] Dragan Sekulić, Vlastimir Dedović, Srdjan Rusov, Slaviša Šalinić, and AleksandarObradović. 2013. Analysis of vibration effects on the comfort of intercity bususers by oscillatory model with ten degrees of freedom. Applied MathematicalModelling 37, 18 (2013), 8629–8644.
[32] Khaled Shaaban and Rania F Khalil. 2013. Investigating the customer satisfactionof the bus service in Qatar. Procedia-Social and Behavioral Sciences 104 (2013),865–874.
[33] Xianghao Shen, Shumin Feng, Zhenning Li, and Baoyu Hu. 2016. Analysis ofbus passenger comfort perception based on passenger load factor and in-vehicletime. SpringerPlus 5, 1 (2016), 1–10.
[34] Chao Song, Jie Wu, Ming Liu, Haigang Gong, and Bojun Gou. 2012. Resen:Sensing and evaluating the riding experience based on crowdsourcing by smartphones. In Mobile Ad-hoc and Sensor Networks (MSN), 2012 Eighth InternationalConference on. IEEE, 147–152.
[35] Alejandro Tirachini, David A Hensher, and John M Rose. 2013. Crowding inpublic transport systems: Effects on users, operation and implications for theestimation of demand. Transportation research part A: policy and practice 53(2013), 36–52.
[36] Dea van Lierop and Ahmed El-Geneidy. 2018. Is having a positive image ofpublic transit associated with travel satisfaction and continued transit usage? Anexploratory study of bus transit. Public Transport (2018), 1–16.
[37] Rohit Verma, Surjya Ghosh, Niloy Ganguly, Bivas Mitra, and Sandip Chakraborty.2017. Smart-phone based Spatio-temporal Sensing for Annotated Transit MapGeneration. In Proceedings of the 25th ACM SIGSPATIAL International Conferenceon Advances in Geographic Information Systems. ACM, 16.
[38] Rohit Verma, Surjya Ghosh, Aviral Shrivastava, Niloy Ganguly, Bivas Mitra, andSandip Chakraborty. 2016. Unsupervised annotated city traffic map generation.In Proceedings of the 24th ACM SIGSPATIAL International Conference on Advancesin Geographic Information Systems. ACM, 59.
[39] Rohit Verma, Aviral Shrivastava, Bivas Mitra, Sujoy Saha, Niloy Ganguly, SubrataNandi, and Sandip Chakraborty. 2016. UrbanEye: An outdoor localization sys-tem for public transport. In INFOCOM 2016-The 35th Annual IEEE InternationalConference on Computer Communications, IEEE. IEEE, 1–9.
[40] Xiao Wang, Xinhu Zheng, Qingpeng Zhang, Tao Wang, and Dayong Shen. 2016.Crowdsourcing in ITS: The state of the work and the networking. IEEE Transac-tions on Intelligent Transportation Systems 17, 6 (2016), 1596–1605.
[41] Desheng Zhang, Juanjuan Zhao, Fan Zhang, Ruobing Jiang, Tian He, and NikosPapanikolopoulos. 2017. Last-mile transit service with urban infrastructure data.ACM Transactions on Cyber-Physical Systems 1, 2 (2017), 6.