
Combining the power of SAS® Tools (SAS® Data Integration...
10
1 Paper 11280-2016 Combining the power of SAS® Tools (SAS® Data Integration Studio, SAS/OR® Software, SAS® Visual Analytics, and Base SAS®) for Societal Impact Jo Coutuer, Partner, Deloitte Consulting Belgium Wouter Travers, Senior Consultant, Deloitte Consulting Belgium ABSTRACT Traditionally, policy makers have made policy choices based on experience, political consensus building and sporadic research. Today, when faced with policy choices, the use of automated decision-making systems is becoming less controversial. However, when computer systems are used to assist in making policy choices, it is essential to use objective data to support the decision-making process. By using a combination of SAS® products, we provide insights to our client on how they can optimize the location of fire stations, which is a very impactful policy choice. SAS® offers a very divers number of products covering the full ecosystem needed to provide insights to our clients in one integrated platform. We exploited specific catalyzing factors of SAS® products throughout the ecosystem. SAS® Data integration studio for data management, SAS® Visual Analytics as a visualization tool and SAS® Enterprise guide, SAS/STAT® and SAS/OR® as the Analytics component. We learnt that technology can provide counter- intuitive insights to policy makers, leading to better societal outcomes. INTRODUCTION As Human life can depend on it, speedy reaction time is essential for health and safety services. Historically, fire stations in Belgium were located in city centers. However, with many public infrastructure in desperate need of maintenance and an upcoming restructuring of fire services, the optimal location of these fire stations is under review. By using historical intervention data, we determine the optimal locations of future fire stations and provide adequate support to decision makers. The final result is not just a black box solution but a SAS® Visual Analytics application, allowing users to set parameters, add possible locations, rerun the model and deep dive in the result of the proposed solution. The solution provides ad-hoc research power to the local policy makers, allowing them to take changing conditions such as population density and traffic intensity into account. DATA The starting point is a data set of 2 years’ worth (2014-2015) of fire interventions. We assume that the data is representative. This historical data serves as input to determine the optimal locations for new fire stations. The below graph shows a heat map of the interventions for an undisclosed area of Belgium. Figure 1: Heatmap of the historical interventions of the last two years. (Made in ArcGIS® online and included in the SAS® Visual Analytics dashboard via the SAS/ArcGIS integration.)
Transcript of Combining the power of SAS® Tools (SAS® Data Integration...
1
Paper 11280-2016
Combining the power of SAS® Tools (SAS® Data Integration Studio, SAS/OR® Software, SAS® Visual Analytics, and Base SAS®) for Societal
Impact
Jo Coutuer, Partner, Deloitte Consulting Belgium
Wouter Travers, Senior Consultant, Deloitte Consulting Belgium
ABSTRACT
Traditionally, policy makers have made policy choices based on experience, political consensus building and sporadic research. Today, when faced with policy choices, the use of automated decision-making systems is becoming less controversial. However, when computer systems are used to assist in making policy choices, it is essential to use objective data to support the decision-making process. By using a combination of SAS® products, we provide insights to our client on how they can optimize the location of fire stations, which is a very impactful policy choice. SAS® offers a very divers number of products covering the full ecosystem needed to provide insights to our clients in one integrated platform. We exploited specific catalyzing factors of SAS® products throughout the ecosystem. SAS® Data integration studio for data management, SAS® Visual Analytics as a visualization tool and SAS® Enterprise guide, SAS/STAT® and SAS/OR® as the Analytics component. We learnt that technology can provide counter-intuitive insights to policy makers, leading to better societal outcomes.
INTRODUCTION
As Human life can depend on it, speedy reaction time is essential for health and safety services. Historically, fire stations in Belgium were located in city centers. However, with many public infrastructure in desperate need of maintenance and an upcoming restructuring of fire services, the optimal location of these fire stations is under review. By using historical intervention data, we determine the optimal locations of future fire stations and provide adequate support to decision makers. The final result is not just a black box solution but a SAS® Visual Analytics application, allowing users to set parameters, add possible locations, rerun the model and deep dive in the result of the proposed solution. The solution provides ad-hoc research power to the local policy makers, allowing them to take changing conditions such as population density and traffic intensity into account.
DATA
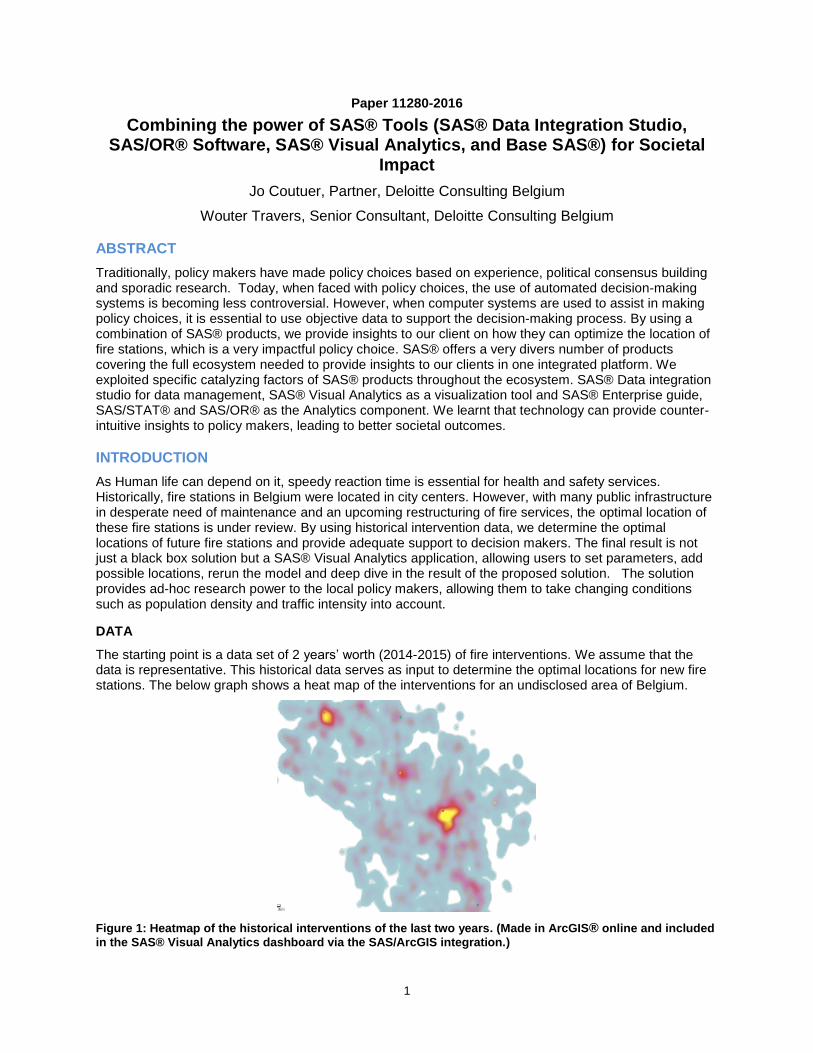
The starting point is a data set of 2 years’ worth (2014-2015) of fire interventions. We assume that the data is representative. This historical data serves as input to determine the optimal locations for new fire stations. The below graph shows a heat map of the interventions for an undisclosed area of Belgium.
Figure 1: Heatmap of the historical interventions of the last two years. (Made in ArcGIS® online and included
in the SAS® Visual Analytics dashboard via the SAS/ArcGIS integration.)
2
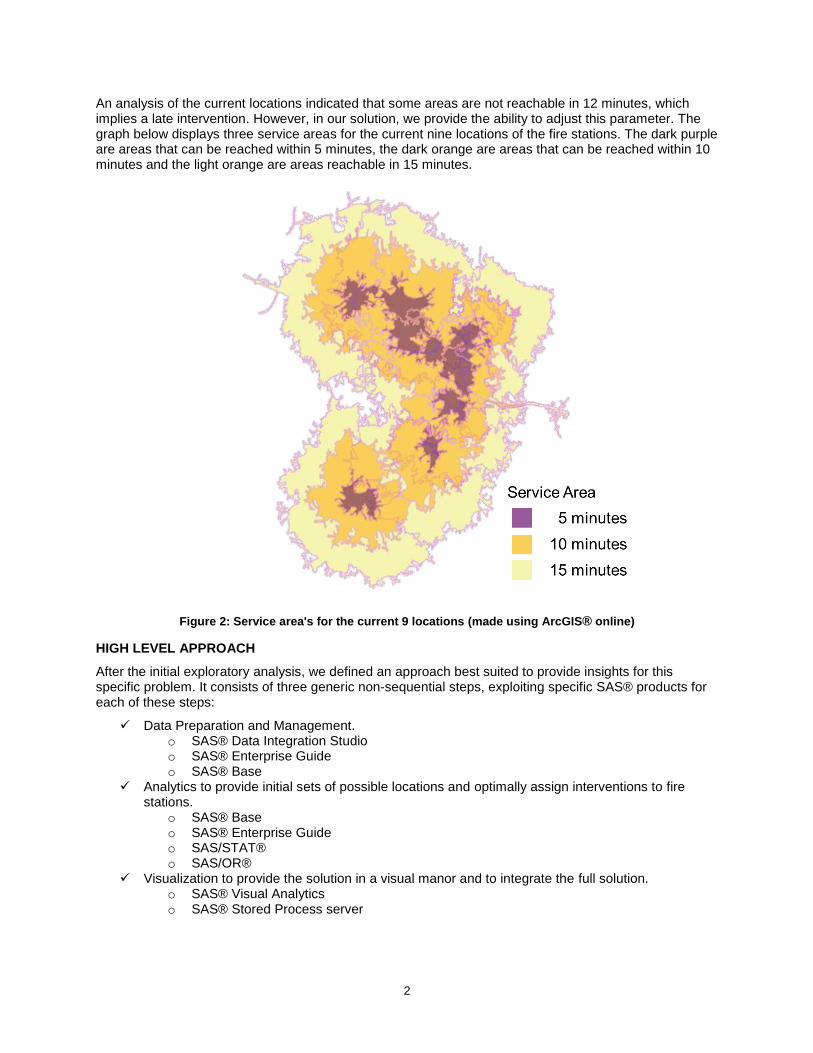
An analysis of the current locations indicated that some areas are not reachable in 12 minutes, which implies a late intervention. However, in our solution, we provide the ability to adjust this parameter. The graph below displays three service areas for the current nine locations of the fire stations. The dark purple are areas that can be reached within 5 minutes, the dark orange are areas that can be reached within 10 minutes and the light orange are areas reachable in 15 minutes.
Figure 2: Service area's for the current 9 locations (made using ArcGIS® online)
HIGH LEVEL APPROACH
After the initial exploratory analysis, we defined an approach best suited to provide insights for this specific problem. It consists of three generic non-sequential steps, exploiting specific SAS® products for each of these steps:
Data Preparation and Management. o SAS® Data Integration Studio o SAS® Enterprise Guide o SAS® Base
Analytics to provide initial sets of possible locations and optimally assign interventions to fire stations.
o SAS® Base o SAS® Enterprise Guide o SAS/STAT® o SAS/OR®
Visualization to provide the solution in a visual manor and to integrate the full solution. o SAS® Visual Analytics o SAS® Stored Process server
3
DATA PREPARATION AND MANAGEMENT
To determine the optimal location for fire stations, the main driver is to reduce the time it takes to get to an intervention. The intervention data provided the historic driving times. The assumption is made that this time can be biased due to characteristics outside the scope of the investigation, such as: occupancy of the station at a specific time, judgement of crucially, people on call, kind of vehicles, … Secondly, we need uniform measurement of driving time to all locations (both new and old). This forces us to redefine the driving time to all locations.
DEFINE POSSIBLE LOCATIONS
A prerequisite to calculate the driving time is defining a set of “eligible locations”. Eligible locations are predetermined geographical locations that comply to a set of requirements for hosting a fire station. This prerequisite imposes a substantial restriction in the methodology. The need to use eligible locations means that an optimal location is only optimal within the confines of the set of eligible locations. On the other hand, only including eligible locations avoids having to adjust the model each time unusable results are retrieved, for example in case there is no possibility to build a fire facility in a given location.
We enable the option to add new possibilities using the SAS® Visual Analytics interface. This allows further refinement of the solution. Current locations are included, since these locations are in fact the most straightforward options.
To get started we use k-means on the interventions with 2 to 20 clusters to come up with several hundred of possible locations. It is up to the users to augment the results by adding or removing locations. .
COMPUTE DRIVING TIME
Once we have a group of eligible locations we compute the driving time for each combination of fire station and intervention. As we are not interested in spatial distance but in actual driving time we made a SAS® macro based on a SAS® Paper from 2012 by Ash Roy and Yingbo Na. This macro uses an API to MAPQUEST to return the driving time. We could run the macro sequentially by looping it. However, with the current subset of 25000 interventions, the combination between the interventions and the possible locations runs into the millions. The API from Mapquest is a slow process; a single loop is therefore not an adequate solution.
%macro get_driving_time;
/*Loop all combinations*/
%do iter=1 %to &count_max;
proc sql;
select location_id, interventie_id into :loc_id ,
:inter_id from input where row=&iter;
quit;
/*get latitude and longitude of interventions and locations*/
data _null_;
set sasdata.Input
(where=( interventie_id =&inter_id and location_id
=&loc_id));
call symput
('ll1',compress(put(Latitude,9.6)||","||put(Longitude,9.6)));
call symput
('ll2',compress(put(LOC_LAT,9.6)||","||put(LOC_LONG,9.6)));
run;
/*include the geo coordinates in the request to MAPQUEST*/
/*A KEY NEED TO BE PROVIDED - SEE MAPQUEST SITE*/
filename t url "http://open.mapquestapi.com/directions/v2/route?key=KEY
&&outFormat=xml&from=&ll2&to=&ll1&callback=renderNarrative";
filename z temp;
/* Read in XML file 1 character at a time, calculate the file size */
DATA _NULL_;

4
infile t recfm=f lrecl=1 end=eof;
file z recfm=f lrecl=1;
input @1 char $char1.;
put @1 char $char1.;
if eof;
call symputx('filesize',_n_);
RUN;
/* Step 5: Parsing the XML */
DATA temp;
keep distance_val time_val interventie_id location_id;
infile z recfm=f lrecl=&filesize. eof=done dlm='<' scanover;
input @'<statusCode>' status_code
@'<time>' time_val;
interventie_id=&inter_id;
location_id =&loc_id.;
if status_code ^= 0 then do;
time_val=-2;
end;
output;
stop;
done:
output;
RUN;
proc append data=temp base=sasdata.Location_DT;
run;
filename t clear;
filename z clear;
%end;
%mend;
To remediate this issue, parallel sessions can be set up. Making this in Base SAS® code can be cumbersome. Therefore, we use SAS® Data Integration studio as a catalyzer. Its primary focus is on data management development in a full-scale business environment.
Initial benchmark reports showed that a single threated loop would have taken several weeks, which is too long given the limited scope of the intervention region. Therefor we tackle this by using the looping transformation within the SAS® Data Integration studio to set up several hundred of parallel sessions running through the API in a grid.
The transformations generates all the required Base SAS® code for setting up a multithreaded loop. The code for the loop shown above is modified to work in loops. Below we took some considerations for looping into account:
1) The tables used need to be independent. Each loop needs independent tables as input and output. This is not mandatory depending on your database source but greatly reduces the throughput of the ETL.
2) Set-up the code in such a way that it is easy to check the progress. When setting up parallel sessions in SAS, the transformation spawns a new session per loop with a separate log file. This means that debugging this process is difficult, as the log is not combined afterwards. A summary table is available after the run is finished but if the process is long you might consider other ways to trace the progress.
Within SAS® Data Integration Studio we also use the Data Quality Standardization transformation to perform a clean-up of the different kind of intervention causes.

5
This SAS® Data Integration job is essentially Base SAS® code and can be called as a stored process from within SAS® EG where the full program is compiled, using an include statement.
This parallel approach allows for a non-linear processing increase with additional possible locations. This is significant as this shows that this approach also works for a larger scope.
Figure 3: SAS® Data Integration job to calculated the driving time for each combination
ANALYTICS
Once the driving times are defined, we can build a model to optimize the locations. SAS/OR® mathematically optimizes a maximization or minimization problem. The optimization problem in this case aims at minimizing the intervention time and fixed costs for fire stations. Two cost factors are taken into account: the first is a fixed cost for opening and maintaining a fire stations and the second is the cost related to intervention time.
COST QUANTIFICATION
The cost related to an intervention time is difficult to quantify. The quantification is partially left up to the users of the final dashboard. They set parameters and can see multiple cost models with a different focus in decreasing the number of fire stations. The model balances two forces heading in opposite direction. One to minimize the number of locations and another to minimize the intervention time. The different cost models in the dashboard leaves the freedom to balance these two forces to the policy makers.
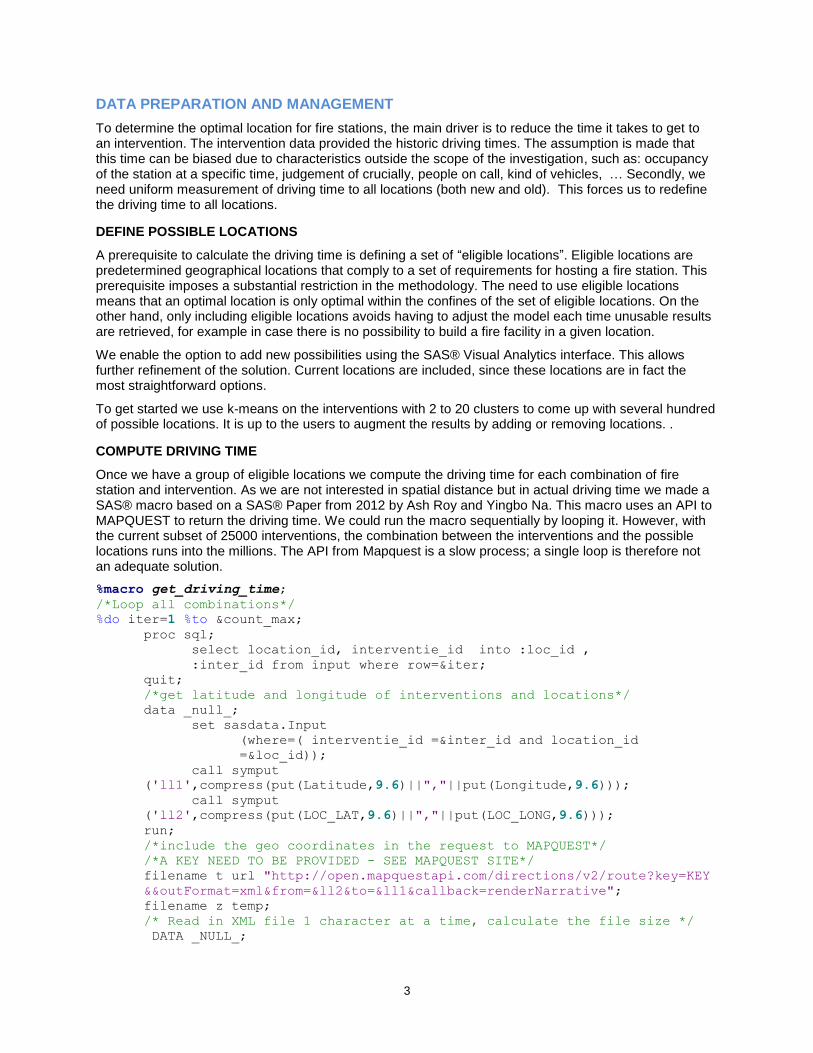
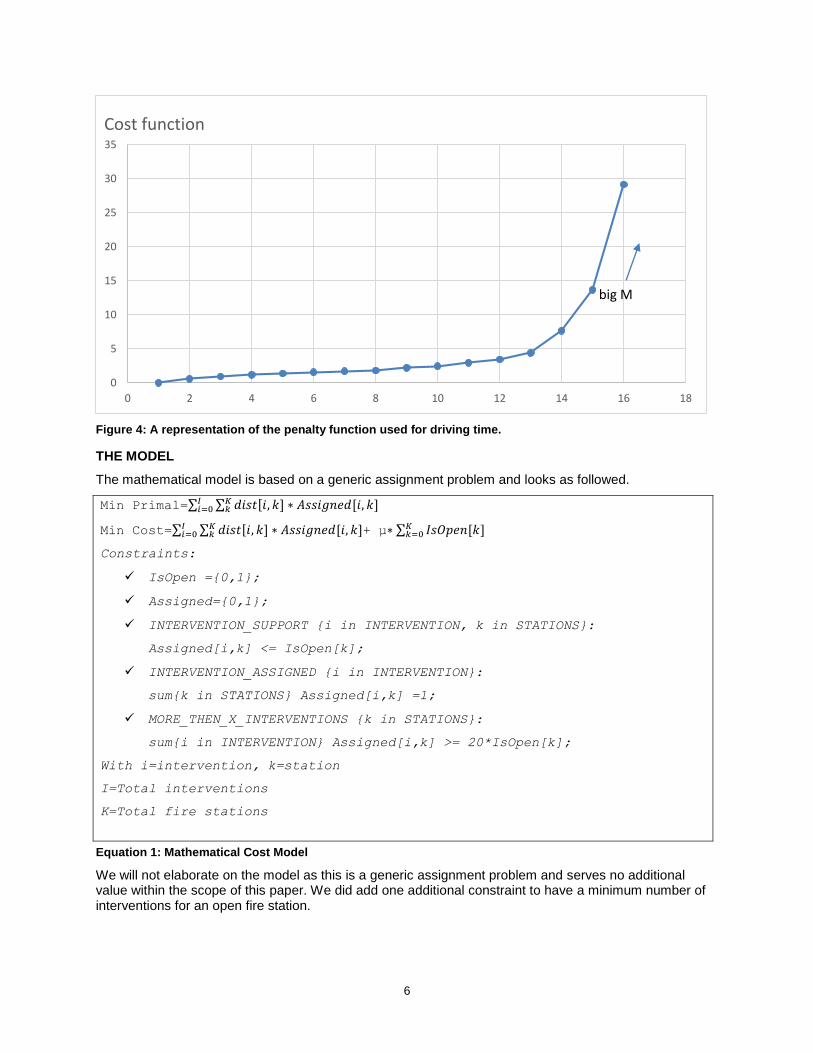
In this case, the driving time as such, is not considered an appropriate penalty function for the cost model, as the penalty for an intervention of 12 minutes needs to be exponentially higher than two interventions of 6 minutes. We therefore use a different penalty function based on the driving time. The actual function itself cannot be disclosed but the below graph gives an indication of what it looks like. As of 12 minutes, we exponentially increase the penalty and continue doing so for each additional minute. As of 15 minutes, the cost is so high that it becomes very unlikely that parameter would be part of the optimal solution. By law Belgian fire services should be able to respond within 15 minutes. The extremely high penalty associated with an intervention time of more than 15 minutes enables us to drop this strict constraint. (Big M method)
6
Figure 4: A representation of the penalty function used for driving time.
THE MODEL
The mathematical model is based on a generic assignment problem and looks as followed.
Min Primal=∑ ∑ 𝑑𝑖𝑠𝑡[𝑖, 𝑘] ∗ 𝐴𝑠𝑠𝑖𝑔𝑛𝑒𝑑[𝑖, 𝑘]𝐾𝑘
𝐼𝑖=0
Min Cost=∑ ∑ 𝑑𝑖𝑠𝑡[𝑖, 𝑘] ∗ 𝐴𝑠𝑠𝑖𝑔𝑛𝑒𝑑[𝑖, 𝑘]𝐾𝑘
𝐼𝑖=0 + µ∗ ∑ 𝐼𝑠𝑂𝑝𝑒𝑛[𝑘]𝐾
𝑘=0
Constraints:
IsOpen ={0,1};
Assigned={0,1};
INTERVENTION_SUPPORT {i in INTERVENTION, k in STATIONS}:
Assigned[i,k] <= IsOpen[k];
INTERVENTION_ASSIGNED {i in INTERVENTION}:
sum{k in STATIONS} Assigned[i,k] =1;
MORE_THEN_X_INTERVENTIONS {k in STATIONS}:
sum{i in INTERVENTION} Assigned[i,k] >= 20*IsOpen[k];
With i=intervention, k=station
I=Total interventions
K=Total fire stations
Equation 1: Mathematical Cost Model
We will not elaborate on the model as this is a generic assignment problem and serves no additional value within the scope of this paper. We did add one additional constraint to have a minimum number of interventions for an open fire station.
0
5
10
15
20
25
30
35
0 2 4 6 8 10 12 14 16 18
Cost function
big M
7
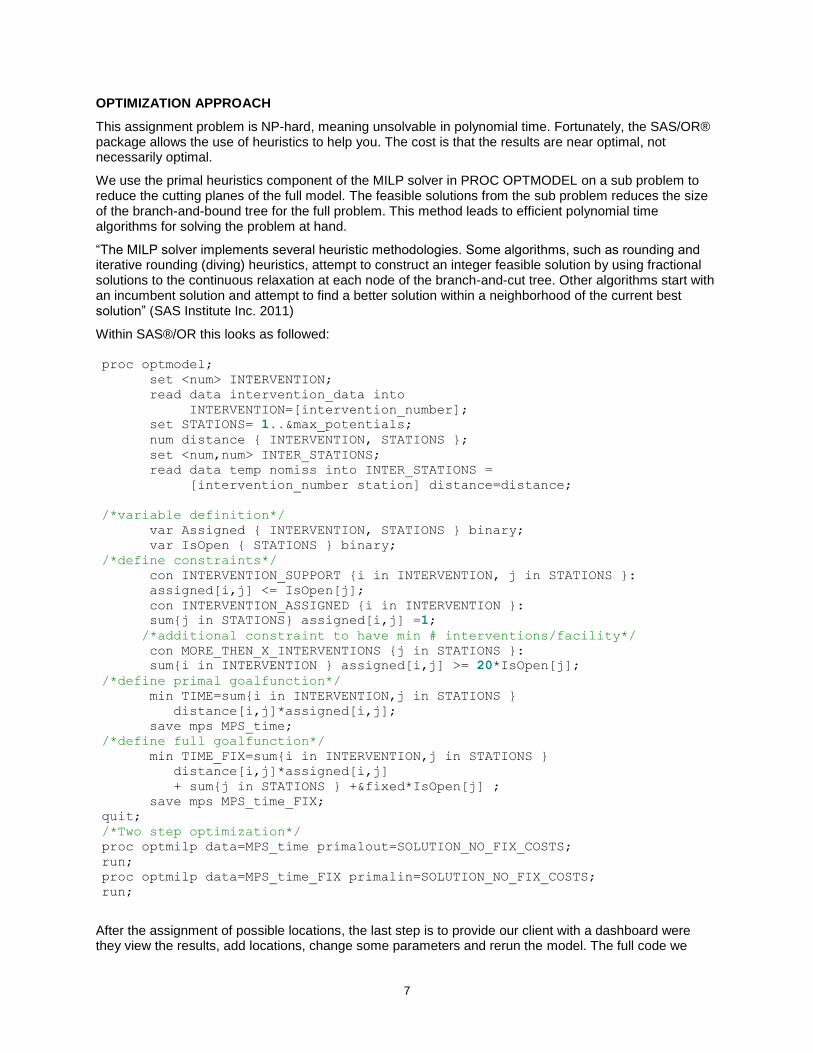
OPTIMIZATION APPROACH
This assignment problem is NP-hard, meaning unsolvable in polynomial time. Fortunately, the SAS/OR® package allows the use of heuristics to help you. The cost is that the results are near optimal, not necessarily optimal.
We use the primal heuristics component of the MILP solver in PROC OPTMODEL on a sub problem to reduce the cutting planes of the full model. The feasible solutions from the sub problem reduces the size of the branch-and-bound tree for the full problem. This method leads to efficient polynomial time algorithms for solving the problem at hand.
“The MILP solver implements several heuristic methodologies. Some algorithms, such as rounding and iterative rounding (diving) heuristics, attempt to construct an integer feasible solution by using fractional solutions to the continuous relaxation at each node of the branch-and-cut tree. Other algorithms start with an incumbent solution and attempt to find a better solution within a neighborhood of the current best solution” (SAS Institute Inc. 2011)
Within SAS®/OR this looks as followed: proc optmodel;
set <num> INTERVENTION;
read data intervention_data into
INTERVENTION=[intervention_number];
set STATIONS= 1..&max_potentials;
num distance { INTERVENTION, STATIONS };
set <num,num> INTER_STATIONS;
read data temp nomiss into INTER_STATIONS =
[intervention_number station] distance=distance;
/*variable definition*/
var Assigned { INTERVENTION, STATIONS } binary;
var IsOpen { STATIONS } binary;
/*define constraints*/
con INTERVENTION_SUPPORT {i in INTERVENTION, j in STATIONS }:
assigned[i,j] <= IsOpen[j];
con INTERVENTION_ASSIGNED {i in INTERVENTION }:
sum{j in STATIONS} assigned[i,j] =1;
/*additional constraint to have min # interventions/facility*/
con MORE_THEN_X_INTERVENTIONS {j in STATIONS }:
sum{i in INTERVENTION } assigned[i,j] >= 20*IsOpen[j];
/*define primal goalfunction*/
min TIME=sum{i in INTERVENTION,j in STATIONS }
distance[i,j]*assigned[i,j];
save mps MPS_time;
/*define full goalfunction*/
min TIME_FIX=sum{i in INTERVENTION,j in STATIONS }
distance[i,j]*assigned[i,j]
+ sum{j in STATIONS } +&fixed*IsOpen[j] ;
save mps MPS_time_FIX;
quit;
/*Two step optimization*/
proc optmilp data=MPS_time primalout=SOLUTION_NO_FIX_COSTS;
run;
proc optmilp data=MPS_time_FIX primalin=SOLUTION_NO_FIX_COSTS;
run;
After the assignment of possible locations, the last step is to provide our client with a dashboard were they view the results, add locations, change some parameters and rerun the model. The full code we
8
made in SAS® Enterprise Guide is saved as a stored process and can be called from SAS® Visual Analytics where we also visualize the results. The results are loaded via the LASR procedure and published to the metadata server via the metadata procedure. Users are alerted when the new results are available.
VISUALISATION
The next and final step in providing our client with a tool to make decisions is combining everything into a meaningful and flexible dashboard in SAS® Visual Analytics.
The SAS® Visual Analytics product offering is a more recent addition to the SAS® suite and a clear path from SAS® towards visualizing data mining. The platform allows the integration of SAS® products via means of stored processes. It is via this method that SAS® Visual Analytics calls and executes the model.
RESULTS
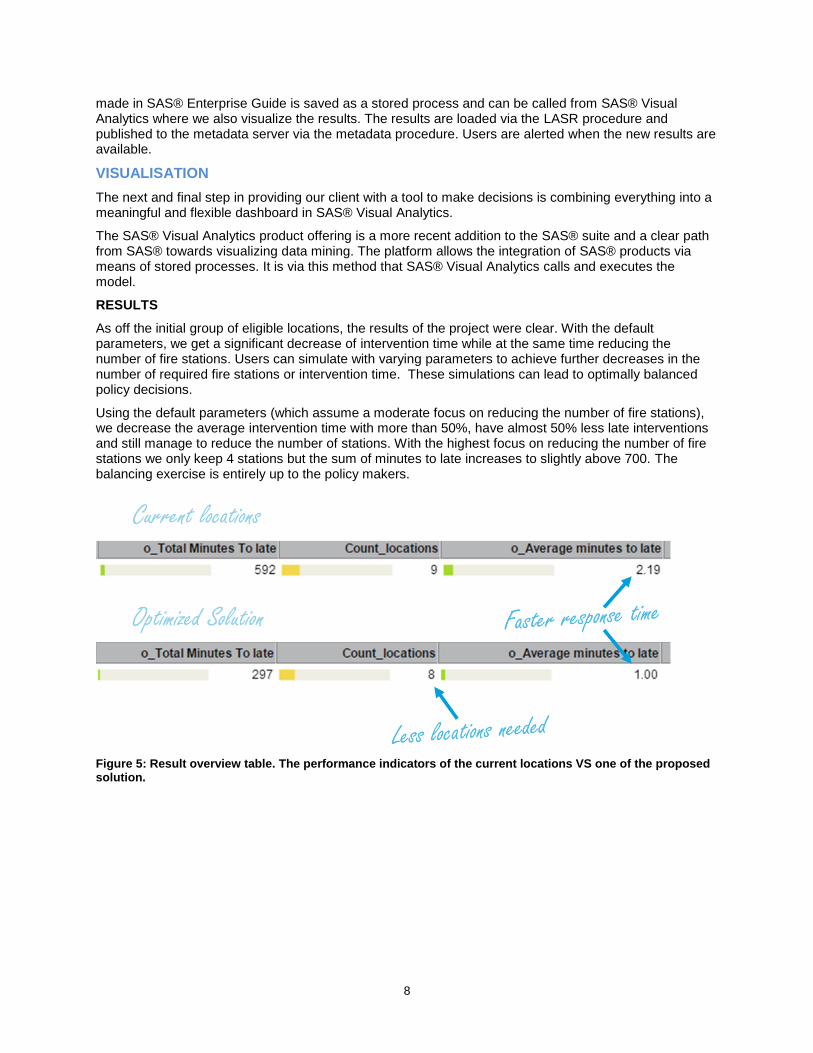
As off the initial group of eligible locations, the results of the project were clear. With the default parameters, we get a significant decrease of intervention time while at the same time reducing the number of fire stations. Users can simulate with varying parameters to achieve further decreases in the number of required fire stations or intervention time. These simulations can lead to optimally balanced policy decisions.
Using the default parameters (which assume a moderate focus on reducing the number of fire stations), we decrease the average intervention time with more than 50%, have almost 50% less late interventions and still manage to reduce the number of stations. With the highest focus on reducing the number of fire stations we only keep 4 stations but the sum of minutes to late increases to slightly above 700. The balancing exercise is entirely up to the policy makers.
Figure 5: Result overview table. The performance indicators of the current locations VS one of the proposed solution.
9
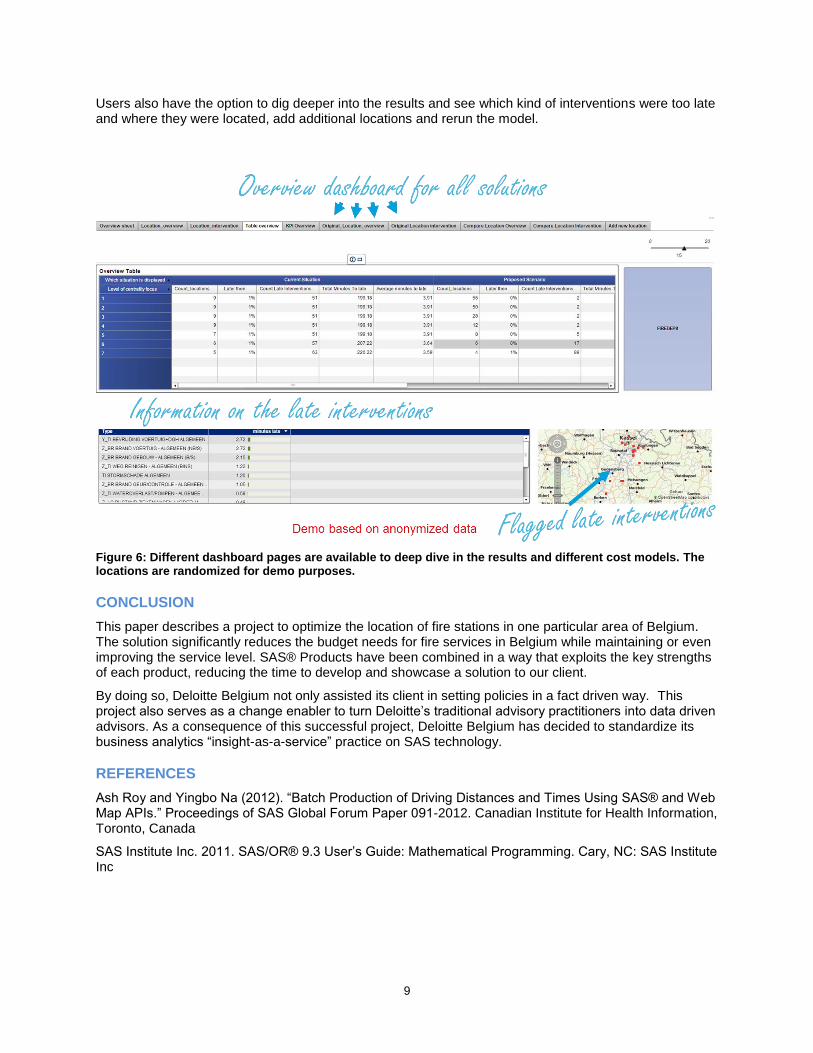
Users also have the option to dig deeper into the results and see which kind of interventions were too late and where they were located, add additional locations and rerun the model.
Figure 6: Different dashboard pages are available to deep dive in the results and different cost models. The locations are randomized for demo purposes.
CONCLUSION
This paper describes a project to optimize the location of fire stations in one particular area of Belgium. The solution significantly reduces the budget needs for fire services in Belgium while maintaining or even improving the service level. SAS® Products have been combined in a way that exploits the key strengths of each product, reducing the time to develop and showcase a solution to our client.
By doing so, Deloitte Belgium not only assisted its client in setting policies in a fact driven way. This project also serves as a change enabler to turn Deloitte’s traditional advisory practitioners into data driven advisors. As a consequence of this successful project, Deloitte Belgium has decided to standardize its business analytics “insight-as-a-service” practice on SAS technology.
REFERENCES
Ash Roy and Yingbo Na (2012). “Batch Production of Driving Distances and Times Using SAS® and Web Map APIs.” Proceedings of SAS Global Forum Paper 091-2012. Canadian Institute for Health Information, Toronto, Canada
SAS Institute Inc. 2011. SAS/OR® 9.3 User’s Guide: Mathematical Programming. Cary, NC: SAS Institute Inc

10
CONTACT INFORMATION
Your comments and questions are valued and encouraged. Contact the author at:
Deloitte Belgium Analytics Lab E-mail: [email protected]
Jo Coutuer Partner | Deloitte Belgium Mobile
E-Mail: Wouter Travers Senior Consultant | Analytics | Deloitte Belgium Mobile
E-Mail:
SAS® and all other SAS® Institute Inc. product or service names are registered trademarks or trademarks of SAS® Institute Inc. in the USA and other countries. ® indicates USA registration.
Other brand and product names are trademarks of their respective companies.