Combining the Global Value Chain and global I-O approaches ... · Combining the Global Value Chain...
55
1 Combining the Global Value Chain and global I-O approaches Discussion paper Stacey Frederick International Conference on the Measurement of International Trade and Economic Globalization Aguascalientes, Mexico, 29 Sep – 1 Oct 2014 United Nations Friends of the Chair Meeting on the Measurement of International Trade and Economic Globalization, Aguascalientes, Mexico, 2 Oct 2014
Transcript of Combining the Global Value Chain and global I-O approaches ... · Combining the Global Value Chain...

1
Combining the Global Value Chain and global I-O approaches Discussion paper
Stacey Frederick
International Conference on the
Measurement of International Trade and Economic Globalization
Aguascalientes, Mexico, 29 Sep – 1 Oct 2014
United Nations Friends of the Chair Meeting on the
Measurement of International Trade and Economic Globalization,
Aguascalientes, Mexico, 2 Oct 2014

2
Table of Contents
I. Summary ....................................................................................................................................... 4
II. Introduction .................................................................................................................................. 6
III. Global Value Chain Approach Review .................................................................................. 7 A. Background ...................................................................................................................... 7 B. Traditional Global Value Chain framework and theories ................................................ 9
i. GVC Governance ........................................................................................................................ 10 ii. Upgrading ................................................................................................................................... 13
C. Value chain research approach (mapping & analysis) ................................................... 14
IV. Classifications and Data Sources ........................................................................................... 16 A. Data sources used in GVC studies ................................................................................. 16 B. Existing data sources, classification systems and databases .......................................... 17 C. New classification and data source: business functions ................................................. 19
D. Limitations of the ISIC system and availability of data ................................................. 21 E. Limitations of the GVC research approach .................................................................... 23
V. Developing an industry-neutral Value Chain Reference Model .................................... 24 A. The Value Chain Reference Model (VCRM) ................................................................ 24
i. Value-Adding Activities (Business Functions) ............................................................................ 25 ii. Supply Chain............................................................................................................................... 26 iii. Distribution & Sales and End-Use Markets ............................................................................... 28 iv. Supporting Business Environment .............................................................................................. 29
B. The VCRM classification ............................................................................................... 30
VI. Linking Traditional & Emerging GVC Research Approaches ...................................... 31 A. Mapping: Industry-specific value chains using VCRM & I-O tables ............................ 31 B. Analysis: “Quantify” GVC perspective with industrial data ......................................... 33
i. Improvements to GVC analysis using I-O data .......................................................................... 33 ii. Improvements to GVC analysis using trade data ....................................................................... 33 iii. Using the VCRM to guide GVC analysis .................................................................................... 33
C. Steps to a combined approach ........................................................................................ 34
VII. Appendices .................................................................................................................................. 36 Appendix 1: Background, objectives & methods of stakeholders interested in GVCs ............ 36 Appendix 2: Basic data sources ................................................................................................ 38
Appendix 3: Applications of the VCRM .................................................................................. 40 Appendix 4: Methods used in three industries (apparel, auto, electronics) .............................. 42
VIII. Annexes ........................................................................................................................................ 44 Annex 1: GVC-GPN-GCC Researchers Centers (Academics-Social Sciences) ...................... 44
Annex 2: New GVC Economists .............................................................................................. 45 Annex 3: International Organizations Engaged in GVC Research ........................................... 46 Annex 4: Statistical Agencies Interested in GVCs ................................................................... 47
Annex 5: Potential Ways to “Measure” Upgrading .................................................................. 48 Annex 6: ISIC Rev.4 Sectors Correlation to Value and Supply Chain Stages ......................... 49
IX. References ................................................................................................................................... 50

3
List of Tables
Table 1: Firm-Level Governance Variable Combinations & Dynamics ...................................... 13 Table 2: Comparison of Business Function Categories & Definitions ......................................... 20 Table 3: Value-Adding Activities (Business Functions) .............................................................. 26
Table 4: Classification Focus Areas: Existing Systems & Relationship to Upgrading ................ 34 Table 5: International Statistics Databases by Classification Area and Organization .................. 38 Table 6: Comparison of I-O Related Datasets .............................................................................. 39
List of Figures
Figure 1: Economic and Industrial Organization Disciplines and Levels of Analysis ................... 7 Figure 2: Chain-based Industrial Organization Research Disciplines ............................................ 8 Figure 3: International Organizations: Focus Areas and Databases/Sets ..................................... 18 Figure 4: Four Parts of the Value Chain Reference Model .......................................................... 25
Figure 5: Parts of the Supply Chain .............................................................................................. 27 Figure 6: Textile Fabric (3132) Supply Chain (based on U.S. Benchmark I-O 2007) ................. 29
Figure 7: Electronics GVC Maps (Brazil & Costa Rica Country Report) .................................... 43
List of Acronyms Abbreviation Full Text
CGGC Center on Globalization, Governance & Competitiveness (CGGC)
CtG Capturing the Gains
EA Environmental Account
GDP Gross Domestic Product
GNI Gross National Income
GPN Global Production Network
GTAP Global Trade Analysis Project
GVC Global Value Chain
HS Harmonized System
I-O Input-Output
MiWi Made in the World Initiative
NAS National Accounting System/National Account Statistics
NSI National Statistical Institutes
NSO National Statistics Office
PIIE Peterson Institute for International Economics
SEA Socio-Economic Account
SUT Supply-Use Table
WB World Bank

4
I. Summary
This discussion paper describes the existing gap between the work of traditional global value
chain (GVC) academics and that of economists, international NGOs and statistical agencies
analyzing global production fragmentation. Whereas both groups are engaging in research that
seeks to explain why and how production of goods and services is dispersed around the world,
the two groups have different objectives for their work and use different types of data to conduct
analysis.
The purpose of the paper is to explore how these two approaches can be combined. GVC studies
compare or describe an industry- or product-specific value chain across countries and regions.
For goods producing industries, this type of research requires (at least) national-level data on
multiple socio-economic indicators along an industry’s entire supply chain (from raw materials
through end products) and value chain, which encompasses the intangible activities or “soft
skills” (or services) that add value, but do not physically alter the product (i.e., design, sourcing,
branding, customer service). GVC studies typically revert to primary data collection efforts to
acquire this information with minimal use of industrial, trade and employment statistics based on
standardized classification systems produced by national statistical offices (NSOs) and further
disseminated and analyzed by international NGOs.
Whereas primary data is used over statistical data in part due to the research methods
traditionally employed by social scientists, there are also several limitations of the standardized
data available to conduct studies at this level of specificity. The first limitation is the lack of
routine data collection on the actual activities that take place at the establishment level by
industry. The second is the lack of detail available across countries at a product by industry level
and the third is the lack of a classification system that links the production-related stages for an
industry along its supply chain. The paper proposes two possible solutions to overcome these
data limitations and introduces ways in which existing data sources can be readily used in GVC
studies
The first is to add questions related to “business functions” to existing national surveys. Data in
this regard has been collected on a trial basis in at least Europe and Canada, but has yet to be
widely adopted. If this method moves forward, an internationally agreed upon classification
system for business functions should be developed to enable data collection and comparison on a
global basis.
A second proposal is to review the ISIC classification system with respect to industry-specific
groups and classes (i.e., three and four-digit). A promising new avenue would be to use the value
chain reference model to establish alternative aggregations of basic ISIC activities like the
alternative ISIC aggregation for statistical measurement within the manufacturing sector, or the
information and communication sector.
These aggregations should be supplementary information based on offshoring of business
functions, use of intermediate inputs, basic classes of goods produced and end-markets. The
reason for doing so would be that the domestic or global operation of enterprises, especially
larger enterprises, cannot be well reflected in the current ISIC. Harmonization of enterprises into

5
groups of similar make-up would improve the GVC analysis and would improve the input for the
supply-use tables; harmonization could be achieved in terms of industry, of domestic sourcing or
internationally sourcing of value-adding activities (i.e., business functions), of supply chain
position and of end-market industry.
Rather than completely revising the ISIC system or developing an entirely new survey, the
process of creating a new breakdown of the existing classification system that more accurately
reflects the activities of businesses today could begin by adding questions related to the
aforementioned concepts to existing national surveys. A relatively simple example of what this
process might look like is described in the appendix and can be viewed on the North Carolina
Textile Connect website.
Current research of global production fragmentation by international organizations is using
global supply-use tables (SUTs) or a global input-output table (IOT) to derive the relative
contributions of countries to a specific global industry network, or more specifically, show the
foreign content in a country’s exports broken down by partner country. Those partner countries
could very well be indirectly involved in the foreign content of exports.
The measurement of global SUTs starts from data collected on an industry by product basis
using ISIC (or a related industry classification) and CPC (or related product classification). So,
the outcome of the breakdown of foreign content in a country’s exports is an outcome of the data
which have been put into the global SUTs.
GVC analysis and SUT analysis seem to be at two ends of the data spectrum. However, using the
same classifications and therefore the same input data, would open up possibilities to related the
results of the work in these two fields.
6
II. Introduction
Objectives
Provide better statistics on globalization
Identify limitations of existing research methods: GVCs and SUTs
Identify limitations of classification systems
Determine if policymakers and academics look at research using GVCs the same
Case for developing an international classification system for GVCs
Benefits
Ability to link data along a supply chain (using I-O data) and the ability to link to other
indicators of interest to economic development based on other classification systems and
qualitative knowledge.
Current Situation
Existing research labeled as GVC is conducted by a wide group of researchers including social
scientists, economists, political scientists, geographers, historians, operations management and
country specialists among others.
Traditional GVC academic researchers conduct value chain analysis, but they do not
make use of available statistics to provide a “quantitative” backing for their results and
the process of creating the GVC diagram is based on anecdotal evidence rather than I-O
data. Social scientists begin analysis by conducting secondary, qualitative research and
observing the situation via interviews with the most important actors in the industry.
Economists use I-O data to analyze industries, but existing classification systems are
limited in their ability to identify firms’ engaging in the industry-specific intangible
“value-adding” activities.
o Economists conduct analysis by identifying data available to them and
constructing equations to explain observed phenomenon.
o Much of the recent work by GVC economists focuses on quantifying and
measuring growth in trade of intermediate products. This is not a new concept,
but using the phrase “global value chain” to market new developments in this
field is recent.
o New “GVC” economists measuring GVCs are comparing competitiveness of
economies broadly rather than in specific industries. The new metrics developed
come a long way in improving the way countries are broadly compared, but not in
comparing countries in a specific industry.
Challenges to Collaboration
Interdisciplinary approach needed
o Difficult to talk and write across disciplines and literatures; need common
languages and frameworks.
Different motives of existing groups
o Economic development – poverty elimination, equitable gain
o Profit maximization
o International benchmarking and developing metrics to measure globalization
7
III. Global Value Chain Approach Review
A. Background
Global Value Chain (GVC) research can theoretically be viewed as a type of industrial
organization research. Industrial organization research is centered on the ways people (incl.
firms1), places, and processes are linked to each other in the global economy. A common
element in industrial organization research is the use of a chain-based organizational structure.
Chain-based research uses the concept of a chain as a construct to describe the organization and
geography of production in the global economy. Chain-based organizational structures are used
in different disciplines by different names to conduct industrial organization research, such as
Supply chain (Management)
Firm value chain and value system (Management/Economics)
Global value chain; value-added chain (Sociology)
Industrial cluster (All)
Production network; Global production network (GPN); filière (Geography)
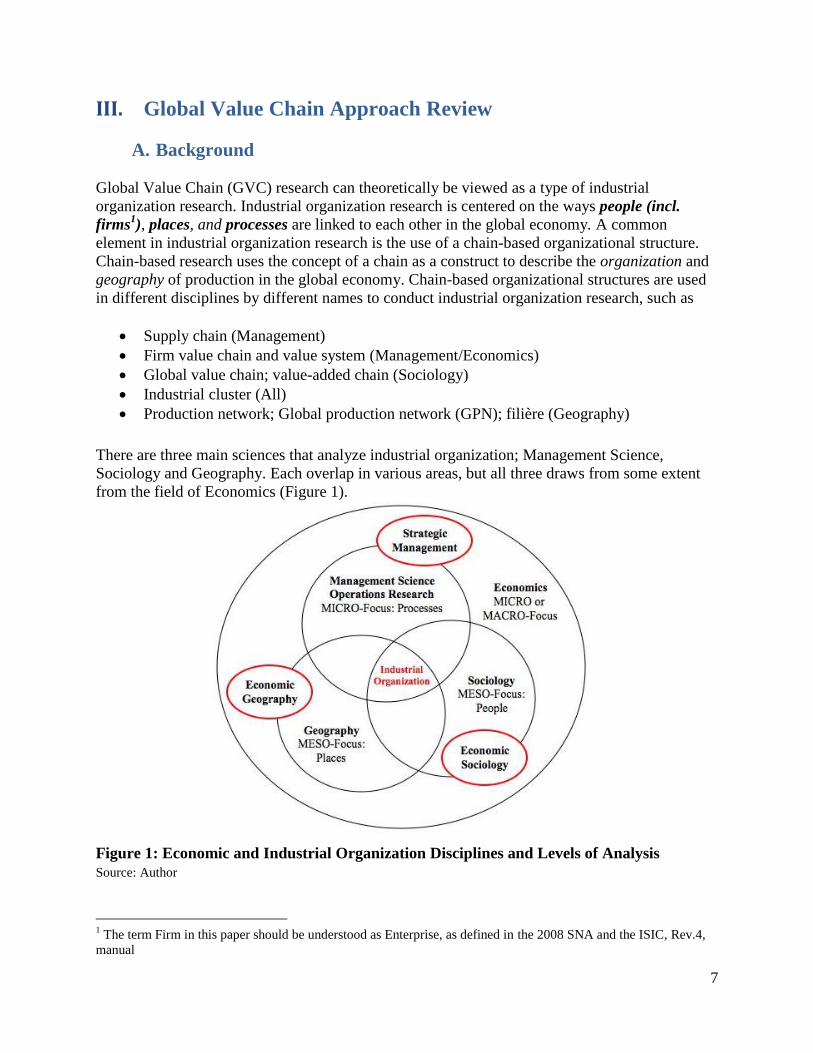
There are three main sciences that analyze industrial organization; Management Science,
Sociology and Geography. Each overlap in various areas, but all three draws from some extent
from the field of Economics (Figure 1).
Figure 1: Economic and Industrial Organization Disciplines and Levels of Analysis
Source: Author
1 The term Firm in this paper should be understood as Enterprise, as defined in the 2008 SNA and the ISIC, Rev.4,
manual

8
Each discipline also overlaps with the others in some fields of application (Figure 2). The
overlaps result in the fields of strategic management, economic sociology, and economic
geography.
Figure 2: Chain-based Industrial Organization Research Disciplines
Source: Author
A chain can be used to provide a structure to map the range of internal and external actors and
their actions that directly and indirectly affect the decision-making process. A value chain
conceptual framework can also be used to analyze the competitive position of a firm (or
geographic location) in a given industry vis-à-vis other firms or locations (Kogut, 1985). Each
discipline uses a chain-based organizational structure to explain industrial organization subject
matter. Strategic management focuses on economic competitiveness whereas economic
sociology and geography tend to focus more on economic development.2
Research that falls under the traditional label of “GVC” originated from the global commodity
chain (GCC) concept. In 1986, two World-Systems theorists, Terrence K. Hopkins and
Immanuel Wallerstein, defined GCC as a “network of labor production process whose end
results is a finished product” (Hopkins & Wallerstein, 1986). The GCC concept was initially
developed to understand the geographic expansion and contraction of early modern capitalism,
but by the mid-1990s, it was adopted by development scholars to capture the emerging patterns
of postwar industrialization, such as the fragmentation and geographic spread of production
activities, and development challenges in export-oriented industries (Lee, 2010). This
reformulation of the GCC concept was encapsulated in the collected volume Commodity Chains
and Global Capitalism (Gereffi & Korzeniewicz, 1994). The development-oriented GCC
approach was the first approach to analyze both firm and inter-firm networks on a local and
global scale, permitting researchers to forge the macro-micro links between firms previously
2 For a detailed comparison of these disciplines, see Chapter 1 of (Frederick, 2010) and (Frederick & Cassill, 2009)
comparing value chains and industry clusters.
9
assumed to be discreetly contained within global, national, and local units of analysis (Gereffi,
1994).
The GVC framework emerged in the early 2000s to combine aspects of several different
industrial organization backgrounds including commodity chains, networks, industrial districts
and clusters (CGGC, 2005; Gereffi, Humphrey, Kaplinsky, & Sturgeon, 2001; Gereffi,
Humphrey, & Sturgeon, 2005). In 2000, a group of researchers from these various scholarly
backgrounds came together to develop a common framework using a standard set of terms to
describe the complex network relationships between firms that often span wide geographic areas.
This marked the beginning of the Global Value Chains Initiative, and lead to the development of
a growing research approach called GVC analysis. The GVC Initiative is housed at the Center on
Globalization, Governance & Competitiveness (CGGC) at Duke University.
B. Traditional Global Value Chain framework and theories
A GVC refers to the full range of activities that firms and workers do to bring a good or service
from its conception to its end use and beyond. This includes the activities related to producing,
distributing and transporting the product (supply chain), as well as other value-added activities
that do not necessarily result in physical alterations. These “intangible” activities include
research and development, design, marketing and support services.
The activities that comprise a global value chain can be contained within a single firm or divided
among different firms. Similarly, GVC activities can be contained within a single geographical
location or spread around the world. The global value chain concept encompasses all stages in
the innovation to commercialization process and can be used to analyze any product or service
(CGGC, 2005).
Benefits of the Value Chain Approach
A value chain approach systematically forges the division between the macro (global/societal),
meso (inter-firm), and micro (firm) units of analysis used to analyze the global economy and
provides a way to see how each influences the others:
o On the macro level, it seeks to understand the roles and impacts of international
institutions, organizations and standards on how and where new and existing products
and technologies are developed and located;
o On the meso level, it seeks to understand the types and impacts of inter-firm
relationships and national institutions (i.e. industrial policy) on economic
development and a product’s innovation to commercialization lifecycle.
o On the micro level, it seeks to understand how individual firms and/or the attributes
of a particular product create opportunities or risks to the development of an industry
or technology, or the development of such within a particular geographic location.
The GVC framework is divided into four building blocks that can be used to describe the
structure, dynamics and relationships among stakeholders in global value chains: input-output
10
structure, geography, governance and institutions. These four building blocks can be translated
into steps used to carry out a value chain research approach and analysis (see below).
1. Input-output structure: includes all supply chain segments (inputs, components, final
products, distribution/sales) and value-adding activities (research, design, marketing and
support services).3
2. Geographic scope: the industry-specific mix of activities in the input-output structure is
often carried out in different parts of the world and countries participate in industries by
leveraging their competitive advantages in assets. Usually developing countries offer low
labor costs and raw materials, while wealthier nations with more advanced education
systems control research and development, design and marketing. As a result, firms in
widely separated locations affect one another more than they have in the past.
3. Governance: is about power and the ability of a firm (or organization or institution) to
exert control along the value chain by setting and/or enforcing parameters under which
others in the chain operate (see below).
4. Institutional context: identifies how local, national and international conditions and
policies shape the globalization of each stage of the value chain. GVCs are embedded
within economic, social and environmental institutional dynamics.
i. GVC Governance4
Governance in GVCs refers to the “authority and power relationships that determine how
financial, material, and human resources are allocated and flow within a chain” (Gereffi, 1994).
Chain governance exists when some firms work to the parameters set by other powerful firms in
the chain (Humphrey & Schmitz, 2008). The firm that sets the parameters to which other firms in
the chain must comply is referred to as the lead firm. The relationships lead firms have with their
suppliers can be supportive and designed to promote mutually beneficial growth for all parties,
or greedy and focused on realizing a quick profit in the short-term (Frederick & Gereffi, 2009b).
In the first GVC governance approach developed by (Gereffi, 1994), governance was described
in terms of “driving,” in which chains could be described as producer- or buyer-driven.
Producer-driven chains: large, transnational, integrated industrial enterprises play the key
part in governing the chain. This pattern of governance is found in capital- and
technology-intensive sectors such as automobiles, aircraft, and electrical machinery.
Buyer-driven chains: large retailers, brand-name merchandizers and trading firms play
the central role in organizing decentralized production networks through outsourcing.
This type is typical in labor-intensive, consumer-goods industries like apparel, footwear,
toys and consumer electronics.
Subsequent research realized the need to develop a dynamic typology that could also describe
more complicated patterns of power relations between firms in GVCs, with different governance
3 See the value chain overview video demo on the North Carolina in the Global Economy website for an overview.
4 Ponte and Sturgeon (2014) provide an updated perspective on the concept of GVC governance as “normalizing” in
terms of realigning a given practice to be compatible with standard or norm and add in the concept of “orders of
worth.” They combine this concept with governance as linkages to create a micro, meso and macro level framework.
11
forms often co-existing at the same time. This has led to the formulation of more elaborated
forms of GVC governance to accommodate this complexity, notably the five-fold GVC
governance typology that describes governance in terms of linkages (Gereffi et al., 2005). The
five connections between industry activities (outlined below) within a chain can be described
along a continuum extending from the market, characterized by "arm's-length" relationships, to
hierarchical value chains illustrated through direct ownership of production processes (vertical
integration). Between these two extremes are three network-style modes of governance:
modular, relational, and captive. Network-style governance represents a situation in which the
lead firm exercises power through coordination of production vis-à-vis suppliers (to varying
degrees), without any direct ownership of the firms.
i. Market: involves transactions that are relatively simple, information on product
specifications is easily transmitted, and producers can make products with minimal input
from buyers. In market-based governance, price is typically the driving factor.
ii. Modular: occurs when a product requires the firms in the chain to undertake complex
transactions that are relatively easy to codify.
iii. Relational: interactions between buyers and suppliers are characterized by the transfer of
information and knowledge based on mutual reliance regulated through reputation, social
and spatial proximity, family and ethnic ties, and the like. Tacit knowledge builds over
time in relational chains, which makes it difficult to easily switch suppliers.
iv. Captive: in these chains, small suppliers are dependent on a few buyers that often wield a
great deal of power and control. Such networks are frequently characterized by a high
degree of monitoring and control by the lead firm.
v. Hierarchy: describes chains characterized by vertical integration and managerial control
within a set of lead firms that develops and manufactures products in-house. This usually
occurs when product specifications cannot be codified, products are complex, or highly
competent suppliers cannot be found (Frederick & Gereffi, 2009b; Gereffi et al., 2005).
Governance Structure: Determinants and Dynamism
These five vertical linkage patterns can be associated with predictable combinations of the three
distinct variables: (1) the complexity of transactions, (2) the ability to codify transactions, and (3)
capabilities in the supply base (Error! Reference source not found.). If one of these three
variables changes, then firm governance patterns tend to change in predictable ways. For
example, if a new technology renders an established codification scheme obsolete, modular value
chains are likely to become more relational, and if competent suppliers cannot be found, captive
networks and even vertical integration become more prevalent. Conversely, rising supplier
competence might result in captive networks becoming more relational and better codification
schemes set the stage for modular networks (

12
Table 1).

13
Table 1: Firm-Level Governance Variable Combinations & Dynamics
Source: (Gereffi et al., 2005); *Coordination also relates to power asymmetry. Dynamics of changes in governance:
(1) Increasing complexity of transactions also reduces supplier competence in relation to new demands; (2)
Decreasing complexity of transactions and greater ease of codification; (3) Better codification of transactions; (4)
De-codification of transactions; (5) Increasing supplier competence; (6) Decreasing supplier competence.
It is important to note that firm-level governance is the theory in the GVC framework. It has a set
of variables and provides an explanation of how governance is likely to change when the three
factors shift over time. The theoretical framework does not, however, provide a way to measure
or quantify this, so interpretation of the theory is subjective.
ii. Upgrading
Upgrading refers to the strategies used by countries and other economic stakeholders to maintain
or improve their positions in the global economy. Upgrading is a multi-dimensional process that
seeks to increase the economic competitiveness (profits, employment, skills) and/or social
conditions (working conditions, low incomes, education system) of a firm, industry, or workers.
Upgrading involves a learning process through which firms acquire knowledge and skills—often
through their relationships with other enterprises in the value chain or through supporting
markets—that can be translated into innovations or improvements that increase the value of their
goods or services (Frederick & Gereffi, 2009a). Economic upgrading is defined as firms,
countries or regions moving to higher value activities in GVCs in order to increase the benefits
(e.g. security, profits, value-added, capabilities) from participating in global production.
Upgrading strategies are generally differentiated in the following (Frederick & Gereffi, 2011,
2013; Frederick & Staritz, 2012; Humphrey & Schmitz, 2002):
Process upgrading: reorganizing the production system or introducing new technologies
to gain efficiency.
Product upgrading: shifting to more sophisticated products with higher unit prices.
End market upgrading: diversifying to new buyers or new geographic or product
markets (particularly important in the context of stagnating demand in traditional export
markets such as the US and the EU-15 and increasing demand in fast-growing emerging
domestic or regional markets).
Linkages/supply chain upgrading: establishing backward manufacturing linkages within
the supply chain, in particular to the textile industry.
Governance Type Transaction
Complexity
Ability to
Codify Trans.
Capabilities in
the Supply Base
Low
High D
egre
e o
f E
xp
lici
t
Co
ord
inat
ion*
GCC GVC
(1)
Low
High
High
High
High
(2)
(3)
High
High
Low
High
Low
(4)
(5)
High
High
High
Low
Low
(6)
Assumed Market
Buyer-
Driven
Modular Network
Org.
Forms
Relational
Producer-
Driven
Captive
Hierarchy

14
Functional upgrading: increasing the range of functions or changing the mix of
activities to higher value tasks, e.g., moving beyond direct production-related activities to
input sourcing, logistics/distribution, product development, design and branding.
While most GVC research has been focused on economic upgrading, there is an increasing
interest in social upgrading. Social upgrading refers to “the process of improvement of the rights
and entitlements of workers as social actors, which enhances the quality of their employment”
(Barrientos, Gereffi, & Rossi, 2011). Social upgrading can be divided into two components:
measurable standards and enabling rights. Measurable standards include type of employment
(formal and informal), wage level, social protection and working hours. Enabling rights are less
easily quantified and include the freedom of association, the right to collective bargaining, non-
discrimination, voice and empowerment (Barrientos & Smith, 2007).
C. Value chain research approach (mapping & analysis)5
A value chain research approach is widely used by academics and practitioners to conduct
detailed research on the structure and dynamics of global industries to understand where, how,
and by whom economic, social and environmental value is created and distributed. In practice,
research questions center on development and competitiveness issues and analysis seeks to
identify potential leverage points and bottlenecks in the chain. Economic developers often use
the results of a value chain analysis to devise industrial policies and strategic plans for firms or
countries.
The four building blocks of the GVC framework can be translated into a two-part research
approach composed of value chain mapping and value chain analysis. The first two building
blocks, input-output and geography, describe the structure of the chain, and the second two, firm-
level governance and institutions, provide an analytical lens to evaluate how and why the current
people, places, and processes are organized. Value chain mapping is the process of identifying
the geography and activities of stakeholders involved from taking a good or service from raw
material to production and then to the consumer. Value chain analysis seeks to determine the role
dynamic factors (governance, institutions and inter-firm relationships) play in influencing the
location, development and competitiveness of a product or service. This also includes identifying
potential interventions and leverage points to initiate change.
Value Chain Mapping
Definition: “Determine what exists and where it is located (economic organization): includes a
process and methods to be used to identify and map the structural elements of the value chain,
including qualitative and quantitative secondary and primary data sources”
1. Input-output: who are the stakeholders (public and private) that currently or have the
potential to develop or commercialize materials, products and technologies?
Collect information on products, markets and firms.
5 SF Note: add in additional information here as needed from nanotechnology value chain research approach.

15
o Resources include market reports, journal articles and government labor market
and trade data sources
Conduct secondary and primary research on firms
2. Geography: where does each link in the value chain take place around the world?
Identify and compare where firms, products and markets are located (similar to above
on an international level)
Determine a nation’s footprint in the industry’s value chain
Value Chain Analysis
Definition: “Determine how and why the current economic organization exists and how it might
evolve in future by analyzing inter-firm relationships and institutions. The objective of value
chain analysis is to determine how and where power is exerted along the chain and by whom
(firms or institutions). This is analyzed to determine the relative impact firms and institutions
have on innovation, commercialization and risk and potential leverage points in the chain where
interventions could be made to effect systemic change and industry behavior.”
3. Firm Governance: who are the most powerful, innovative firms in the chain; why? Which
activities are most important to the product and market and who is doing them?
Literature review on governance topics in the industry being analyzed
Determine how and if relationships differ by product, market and/or geography
Develop metrics to describe and measure the impact different types of relationships
have on economic development and product commercialization.
4. Institutions & Industrial Policy: what are the roles and impacts of local, national and
international institutions and stakeholders?
Conduct background research on policy issues in the following key areas: trade,
industrial/economic development, labor/social and environmental.
Compare the effectiveness of different policies on innovation in different countries.
Examples of Outcomes of Analysis
The outcomes of value chain studies are based on the desired outcomes from clients, but
generally fall into the following areas:
1. Benchmarking: providing the client with the outcomes of parts 1 and 2 – in many cases
our clients (governments, NGOS, industry associations) do not have a good idea of what
the entire input-output process looks like or who the key countries (or states) are in each
segment of the chain.
2. Policy recommendations: we often provide policy recommendations at the country (or
state or regional) level based on best practices and strategies used by countries and
industries in comparable situations.

16
3. Upgrading recommendations: based on the outcomes we provide ways in which firms
and countries can improve or expand their position in the given industry. We provide
suggestions on how to do this by (1) improving the process, (2) improving their products,
(3) moving or expanding into new geographic markets or (4) expanding the range of
business functions provided.
4. Visual analytic applications to disseminate research results that present data in a holistic
and systematic way. Visual analytics creates a way to combine and format all the data
sources into the organizational structure of the value chain framework. NC in the Global
Economy, California in the Nano Economy and the Textile Connect websites are
examples of web-based applications that use the value chain as an organizational
structure to provide results to a larger audience.
IV. Classifications and Data Sources
A. Data sources used in GVC studies6
The following lists the types of data available to conduct GVC studies:
Survey data/interviews: the primary source of information in GVC studies is interviews
with key firm and supporting organization stakeholders. In most cases, data is collected
via open-ended interviews rather than through formal surveys.
Industry/market analysis: much of the background research in GVC studies comes from
the results of secondary literature from previous studies (i.e., scholarly literature such as
journal articles) and market reports published by contract research organizations and
industry associations. These organizations can be viewed as both data sources and to
some extent as competitors to academic research institutions engaging in GVC research.
Examples include: Marketline, Euromonitor and Standard & Poor’s, as well as industry-
specific research organizations.
Business environment: data on the business infrastructure of a country (i.e., policies,
educational institutions, incentives, etc.) is collected from government websites, reports
and official documents.
Trade statistics: Detailed international merchandise trade statistics are available from the
websites of UNSD7, OECD and Eurostat, among others. Statistics of international trade
in services (by services category and partner country) are available – in less detail than
merchandise trade – from the websites8 of these same organizations. Whereas the level of
detail in trade data is adequate to conduct industry-specific analysis, most GVC studies
do not take full advantage of it to analyze the footprint of country in a particular industry
or to evaluate changes over time. Trade data can only be used to describe the product,
6 Appendix 4: Methods used in three industries (apparel, auto, electronics) provides examples of GVC studies.
7 See http://comtrade.un.org/
8 See for instance http://unstats.un.org/unsd/servicetrade/default.aspx
17
geographic end market and to some extent the backward/forward linkage characteristics
of a country in a particular industry. Trade data cannot be used to track functional
upgrading, industry or buyer end market upgrading, domestic backward/forward linkages
or process upgrading.
Industrial statistics and I-O data: Industrial statistics are available to some extent from
the UN data portal9, from the OECD data portal
10 and from UNIDO, but are rarely used
in GVC studies. Conjecture on why this is the case are (1) lack of awareness of
availability and (2) difficulty in obtaining data. The level of detail available for some
countries is adequate to provide a high-level snapshot of a country’s position in an
industry, but four-digit (or beyond to product-level) is ideal. With the exception of pilot
studies conducted by the author to “map” industry value chains, national and
international I-O data are not used in GVC country and industry-specific studies.
The use of quantitative indicators or even trade and economic activity data is not widely used in
GVC studies. Sturgeon and Gereffi (2009) review three groups that have used data in GVC
analysis, but these are not widely used: Technological Classification of Exports (Lall, 2000),
Trade-data Archaeology, and Intermediate Goods Trade (Sturgeon & Memedovic, 2011). The
last paper seeks to improve the existing data gap in industry and supply-chain specific data, by
using novel classifications for final and intermediate goods trade, overall; for “customized” and
“generic” intermediate goods; and in three industries oft-cited as being at the forefront of global
economic integration: (1) electronics, (2) automobiles and motorcycles, and (3) apparel and
footwear.
There is a need to develop better tools for evaluating the impact of GVCs and the role that
specific categories of firms and even entire national industries play within them. For this, better
data are required. While linking trade statistics to enterprise-level statistics contained in business
registers, developing international I-O and trade in value added databases, and formulating and
collecting entirely new GVC-oriented economic statistics are important, there are also
considerable benefits from mining and re-working existing data sets (Sturgeon & Memedovic,
2011).
B. Existing data sources, classification systems and databases
Data used to study industrial organization falls into the following categories or focus areas and is
collected by enterprises or establishments, products and individuals (see Appendix 2: Basic data
sources for a review).
International trade by product/service (products)
Industrial statistics by economic activity (establishment)
Labor and occupation statistics (individuals or establishments)
Levels of data
9 See http://data.un.org
10 See http://stats.oecd.org/index.aspx?r=951255

18
National (establishment-level, by country) micro data
National (country-level) aggregate public data sets
International datasets (compilations of national-level data)
Primary data is available from administrative sources (such as Customs administration) or is
collected through business surveys from enterprises or establishments by national statistical
offices or other national agency (like the central bank). The compiling agency (usually the NSO)
harmonizes the incoming data into a database format applying some basic checks. The ability to
access this “micro data” varies by country, but in most cases it is only for special projects and
requires a security clearance. Micro data is thereafter further standardized and aggregated, and
published at the national and sub-national levels by NSOs. Access to the data may be free or fee-
based and is available via electronic databases or PDF format.
International organizations collect this information from national NSOs to populate international
databases, typically in a particular focus area (Figure 3). The database may represent (1) the data
as it was collected from the NSO with minimal harmonization to facilitate data extraction, (2)
further modified data to facilitate international harmonization, (3) additional estimates by the
international organization and/or (4) indicators based on calculations performed by the
organization using one or multiple data points. In a few cases international organizations collect
primary data through their own surveys.
Figure 3: International Organizations: Focus Areas and Databases/Sets
Source: Author

19
C. New classification and data source: business functions
Having data on the business functions of establishments or enterprises will benefit GVC analysis
in terms of operationalizing the concept of functional upgrading. As articulated in Sturgeon and
Gereffi (2009), “if key GVC-related questions are not asked on any official survey and do not
exist on any administrative form, then existing data resources can never yield adequate results.
Thus, there is an urgent need to collect new information.”
A business function classification divides the activities of an establishment or enterprise into
“core” and “support” functions. The core productive function has been designated as
“production” (Porter, 1985), the “core function” (Nielsen, 2008) and “operations” (S. Brown,
2008). Even though a business function may be designated as a core function, the function can
be partially or even completely outsourced (Sturgeon & Gereffi, 2009). Firms typically have a
main output, be it a product or service. The main operational function that produces this output is
associated with the firm’s standardized industrial code. Instead of counting all output and
employment under this classification, business function lists permit measurement of economic
activity (e.g. employment, occupations, wages, etc.) in other functions as well.
Furthermore, collecting data by business function enables researchers to systematically identify
activities that are performed by the firm (in-house) or by third parties (outsourced) and the
geography of where the activities take place (domestic/home country or offshore). This is related
to what some have called “trade in tasks.” Business function surveys over the last ten years have
focused on identifying trends related to these concepts rather than identifying the unique
activities undertaken by establishments in different industries. Understanding business function
fragmentation is important for GVC studies, but identifying the unique mix of functions integral
to a particular industry is equally important.
In the GVC realm, Sturgeon has been the primary voice on collecting and standardizing data at
the level of business functions (Sturgeon, 2008; Sturgeon & Gereffi, 2009) and has worked with
statistical agencies and academic researchers in North America and Europe in hope of more
wide-spread standardized and adoption (Claire Brown, Sturgeon, & Cole, 2013; Sturgeon, 2013).
The concept of business functions, however, originates from Porter’s interpretation of a value
chain, which took the firm as the unit of analysis. In his work, a firm engaged in nine business
functions, divided into five core and four supporting functions. In GVC studies, the business
functions concept relates to the idea of “value-adding activities,” however the scope of reference
is the entire chain of activities for an industry rather than an individual firm. In practice, both
interpretations are valid because business functions are carried out at the firm-level and can be
carried out by firms at each stage of an industry’s supply chain.11
An internationally agreed upon classification system for business functions does not yet exist,
however several groups have generated lists ranging from between six and 12 activities. In Table
11
See (Frederick, 2010; Frederick & Cassill, 2009) for a comparison of the value chain concept at the firm versus
industry level and how to two can be combined.

20
2, the business function lists in use or proposed are compared to each other and the GVC concept
of value-adding activities based on the author’s interpretation.12
Table 2: Comparison of Business Function Categories & Definitions
VA Activities Business Function Core/Support
GVC Sturgeon (2009) Eurostat (2008) Porter (1985) Sturgeon Eurostat Porter
Research &
Development
Product or service
development
Research &
development (b) Technology
development
Core Support Support
Design &
Development
Technology and
process development
Engineering and related
technical services (b) Support Support Support
Distribution/
Logistics Procurement (a)
Distribution and
logistics Procurement Core Support Support
Production
Intermediate input
and materials
production
Core/primary business
functions: production of
final goods or services
(& secondary functions
if related to core)
Operations
Core Core
Core
Production Operations
(industry code) Core Core
Distribution/
Logistics
Transportation,
logistics, and
distribution
Distribution and
logistics
In & out-bound
logistics Core Support Core
Marketing &
Branding
Marketing, sales and
account
management
Marketing, sales and
after sales services
Marketing &
sales Core
Support
Core
Service Strategic
management
Administrative and
management functions Service Core Core
Management-Related Activities
Not included
Customer and after-
sales service
Marketing, sales and
after sales services Service Support Support Core
General
management Administrative and
management functions
HRM & firm
infrastructure Support
Support
Support
Human resource
management (HRM) HRM Support Support
Firm infrastructure,
building
maintenance and IT
systems
ICT services Firm
infrastructure Support Support Support
Sources: category correlations by author from the following sources, (Porter, 1985); (Nielsen, 2008); (Sturgeon &
Gereffi, 2009); p.23 and adapted from U.S. BLS Mass Layoff Statistics Program. In a previous paper (Sturgeon,
2008), only ten business functions were included, but this paper separated them into core and support functions.
Notes (a): I’d consider distribution/logistics to be related to transporting the product whether it is inbound or
outbound; I’d consider procurement to be related to sourcing and the parallel to “sales” on the downstream side.
Strategic decision-making related to procurement, such as making the decision on whether to “make or buy” inputs,
would fall under strategic management. (b) Seven business functions (plus a residual “other” category) were
identified using the European Central Product by Activity classification (CPA) in 2008. In the 2012 survey,
engineering and R&D were combined.
Developing a standardized list of business functions and collecting representative data will
provide GVC researchers with information needed to conduct analyses that is currently only
12
The specific functions used in the Canadian SIBS surveys (Industry Canada, DFAIT, & Statistics Canada, 2009,
2012) and the eight functions included in the United States’ NOS survey (Clair Brown & Sturgeon, 2010) are not
included, however they use similar terminology.

21
available by interviewing firms or reviewing secondary literature. However the usefulness of the
new typology will depend on how the classification system is correlated to or embedded within
the existing ISIC system. If the concept of business functions is adapted, how an establishment is
labeled in the ISIC system also needs to be reconsidered because industry-specific, business
function data is needed for GVC studies.
D. Limitations of the ISIC system and availability of data
This section reviews some of the limitations of ISIC, the international standard industrial
classification for all economic activity and other impediments to using industrial statistics in
GVC research.
The first limitation of the ISIC system is that only manufacturing-related codes are industry-
specific. Activities such as professional, scientific and technical activities, transportation and
storage and wholesale and retail trade are either not industry-specific, or the level of data is at a
higher-level of aggregation than the manufacturing codes. This is particularly important in
“buyer-driven” chains in which GVC theory suggests that lead firms classified in manufacturing
add the majority of value (i.e., realizing the most profit) to the final product while contracting out
the processing of the goods.
The ISIC13
structure resembles a supply chain, but the system is not industry supply chain
specific. Rather its 17-21 sections can be viewed as a complete supply chain production model
that begins with raw materials (agriculture and mining), moves on to processing and
manufacturing, then wholesale, retail, service and supporting industries (design, government,
business services, etc.). Resultantly, what is often used to define an industry is a small set of
classification codes such as those that represent manufacturing for durable goods production.
However, this often omits many other important, value-adding activities in an industry such as
input production, distribution, management, marketing, non-manufacturing buyers, and
supporting industries that fall outside of the narrow scope of an industry.
For example, the textile and apparel industries are contained entirely within the manufacturing
sector.14
However, many of the most profitable areas are not contained in manufacturing as a
transformation of material in a new product, but rather in the research, design, marketing,
distributing and retailing of products. Based on extensive research of the U.S. textile and apparel
industries, several limitations of limiting the definition of the textile and apparel industries to
manufacturing-related codes have been identified (Frederick, Cassill, Godfrey, & Little, 2007a,
2007b):
1) Raw materials that are directly part of the textile supply chain such as: cotton farms,
cotton gins, sheep farms, petroleum refineries and resin manufacturers.
2) Fibers are the basis of textile production, but man-made fibers are considered to be in
the chemical sub-sector rather than within the textile sub-sectors.
3) Final products that are not made entirely of textile inputs, yet utilize textile
components. The markets for these products represent growth areas for textile
13
Adapted from (Frederick, 2008) based on NAICS codes. 14
Textiles, textile products and apparel are represented by ISIC 17 and 18 or NAICS codes 313, 314 and 315.

22
materials and should be acknowledged as significant buyers of textile components.
Examples of products include composites, sporting goods, air filters, air bags,
cleaning tools, and mattresses.
4) Input industries that are vital to the textile supply chain, such as chemical
manufacturers, packaging and labeling companies, and machinery, equipment, and
software producers. In some cases these functions are carried out by the textile
manufacturers; however, in many cases these are separate companies that provide
significant services to the textile complex.
5) Wholesalers of textile components (yarn & fabric) and final textile products (apparel
and home & interiors).
6) Management, marketing, and retail companies that primarily sell textile final
products (apparel and home & interiors). These companies do not manufacture
textiles, but they are responsible for many of the value-adding functions such as
design, distribution, marketing, and branding of textile products.
7) The supporting environment that is vital to the formation and performance of the
industry, which includes utilities, business services, finance, research, trade
associations, colleges, training & testing centers, government and other regulatory
entities.
Secondly, firms are classified under one ISIC code rather than several codes based on the
percentage of their business activities or products sold. A third limitation is that researchers do
not know how a company is classified in aggregated government statistics (i.e., ISIC/NAICS)
and in the U.S., different agencies may assign different codes. This is a significant limitation in
terms of identifying types of buyers.
Take the following example. A company is headquartered in the United States and employs
approximately 5,000 people engaged in activities related to the apparel industry. Twenty years
ago the company was considered a “brand manufacturer” and the majority of the firm’s workers
were engaged in manufacturing or assembling apparel. However, over the years the company
changed its business model. First the company “offshored” production via foreign investments in
nearby countries and later the company moved out of production altogether and now outsources
all production to third parties. Even with this change in business model, the company’s
employment has remained constant, just the skills of the workers has changed from
manufacturing-related to management, marketing and design. How should the company be
classified using the ISIC system? They are still in the apparel industry, but their domestic
activities are not in manufacturing. Are they classified under ISIC 18, manufacturer of wearing
apparel, or are they considered part of the wholesale or management industry? If they are
classified as a manufacturer, there needs to be an additional survey that collects supplementary
data on the business functions, basic classes of the goods produced and end markets in
conjunctions with overseas manufacturing activities of the firm. It is also through the
supplementary information and use of alternative classification of this company in ISIC that the
occupational classification of the workforce of the company can be related to the ISIC activities
of the firm. Alternatively ISIC data could be linked to occupational data and the activities of the
firm could be identified by profiling the labor force.
23
In order to gain a better understanding of how ISIC codes are being applied in specific industries,
a study by industry experts should be conducted using micro-data to identify how existing lead
firms that are factory-less goods producers should be classified building on the ISIC system.
Beyond the limitations of the ISIC system, there are three other main issues related to using
industrial statistics in GVC studies. First, ISIC and the data collected based on it tends to be too
aggregated or overly broad to provide the industry-specific data needed in GVC studies. A recent
paper by Sturgeon and Memedovic (2011) finds evidence of deepening global economic
integration, but note that the degree and character are highly dependent on the characteristics of
specific products, processes, routines and regulations that prevail in particular industries. As
such the authors recommend policy development take industry-specific characteristics into
account and avoid “over-generalizations, blanket statements, and blunt policy instruments” with
an eye towards gaining a better understanding of the factors underlying industry differences. In
order to understand these industry-specific characteristics, data beyond the one and two-digit
ISIC levels is needed.
The second issue concerns the availability of data. GVC studies often focus on or at least include
developing countries where data tends to be collected on a very limited basis, and if it is, may not
be widely disseminated or available in an easy to use format (e.g., PDF versus electronic access).
The third issue concerns the harmonization of data. Countries collect data at different levels of
detail using various revisions of the ISIC system, use different sampling frames, ask questions
related to different variables and/or use different terms to describe similar concepts. Even though
international collections of data exist, researchers still need to evaluate country-level metadata to
ensure comparability of information over time and across countries for a particular industry. This
can be a time consuming and arduous task, particularly when studying a new industry.
E. Limitations of the GVC research approach
The analysis and policy recommendations provided in GVC studies are often based on
qualitative data and are therefore subjective. Policymakers need to have concrete evidence to
support the decision-making process in order to justify investments and wide-spread policy
changes.
“A major impediment to using qualitative research and conceptual theories to support
specific policy interventions is the lack of comparable and detailed data on the industrial
capabilities of firms, industries, and countries and the roles that they play in the global
economy. The GVC framework provides a conceptual toolbox, but quantitative measures
are lacking. While the development of objective, industry-neutral measures of GVC
governance is a laudable goal and survey questions are currently being fielded to collect
data on the governance character of inter-firm linkages in both cross-border and
domestics sourcing relationships,15
better information to characterize the roles of firms,
regions, and countries in GVCs is urgently needed” (Sturgeon & Gereffi, 2009).
15
Specifically, Statistics Canada, in an international sourcing survey currently being tested, asks firms if relationships with
important suppliers are simple market relationships or something more complex, and if transactions involve the exchange of
codified or tacit information.

24
Purpose. Whereas the majority of GVC studies are labeled as “GVC analysis”, many studies
either have a primary focus on the first two “mapping” parts of the framework (input-output and
geography), one of the two “analysis” components (governance, institutions; identification of
power) or simply on identifying upgrading strategies and constraints and providing policy
recommendations. In order to provide a thorough analysis or recommendations, a detailed
mapping process needs to occur. If a study only focuses on the “mapping” components then it is
purely descriptive and could also be labeled as an industry or market report.
Repeatability. Given that most GVC studies are not based on industrial or trade classification
systems, the ability to easily update, expand or replicate a study is limited.
Time-consuming. Conducting a thorough GVC mapping and analysis is an arduous and time-
consuming process that often takes between six months to a year depending on the number of
people on the research team.
V. Developing an industry-neutral Value Chain Reference Model
This section introduces a value chain reference model (VCRM), and how it can be used as a
classification system and as a means to visually represent an industry’s value chain. The model is
industry-neutral and can be modified to fit to any industry. It is also scalable as it can be used to
map industry structure with a local to global focus.
The VCRM provides a holistic framework that includes the entire supply chain, from raw
materials through retail to recycling, plus the value-added business functions along the chain.
The reference model also includes end markets, a concept that is of particular importance for
intermediate products that are often used in final products in multiple industries. Lastly the
model includes the supporting environment that provides the infrastructure and public policy that
can facilitate or hinder an industry’s competitiveness. The VCRM represents both a visual
depiction of the structure of an industry as well as a conceptual model of industrial organization.
The VCRM has been applied to several industries by the author. It has been used as a
classification system in research reports as well as the basis of a web-based information
management system, visual analytics and learning tools. A brief introduction to existing
applications of the VCRM is provided in Appendix 3: Applications of the VCRM.
A. The Value Chain Reference Model (VCRM)
The value chain concept is commonly used as an organizational structure to visual, classify and
analyze people, places, and processes and their linkages in the global economy. The VCRM
presented in this paper provides an industry-neutral, scalable visual template of the local to
global stakeholders and the input-output activities that link these activities and actors together.
In the VCRM, the value chain is conceptualized as a combination of parts that work together to
produce final products and services for end markets. The four parts include value-adding

25
activities or business functions, the supply chain, end-use markets, and the supporting
environment (Figure 4).
Figure 4: Four Parts of the Value Chain Reference Model
Source: Frederick (2010)
i. Value-Adding Activities (Business Functions)
The value-adding activities are the broadest six16
classifications of the steps that may be
required to create a product or service and represent the functional activities that members
engage in or support. The six activities include research and product development, design,
production, logistics (physical distribution and logistics management/sourcing), marketing
and branding, and strategic management (
Table 3). These activities are viewed as a series of business functions stakeholders can engage in
to bring a product from concept through to consumers. Each of these varies in degree of
importance, depending on the product and market the firm focuses on. A firm may engage in one
or all six of these activities (Frederick, 2008).
Including the value adding-activities as part of the model provides a way to showcase all the
functions a firm can engage in that may not require physically transforming the product. This
model provides a way to both separate and link the activities required to physically transform a
product through the input-output structure (supply chain) of the chain from the separate activities
16
Six activities are commonly listed in GVC studies, however more activities could be included (see the “New
classification and data source: business functions” section).

26
that add value to a product (value-adding activities). This overcomes several of the previously
mentioned limitations of the ISIC system.
Table 3: Value-Adding Activities (Business Functions)
Value-Adding Activity Description
Research and Development
Companies, organizations, institutions, etc. that engage in research
and/or new product development. This includes both activities related
to improving the physical product or process as well as market and
consumer research
Design & Development
People and companies that offer aesthetic design services for products
and components throughout the value chain. Design and style
activities are used to attract attention, improve product performance,
cut production costs, and give the product a strong competitive
advantage in the target market. Design can also refer to “engineering”
or industrial design in which the focus is placed on optimizing the
relationship between materials and function.
Production Or manufacturing; this step is the actual production of the product.
Logistics
Inbound and outbound companies and processes involved in
transporting products between all stages in the value chain (full-
package) or between two stages. This function includes companies
that are involved in physically transporting products as well as
managing or providing technology and equipment for supply chain
coordination. Logistics can involve domestic or overseas
coordination.
Marketing
All activities and companies associated with pricing, selling, and
distributing a product including activities such as branding or
advertising any product, service, or entity in the supply chain. These
companies frequently do not make any physical alternations to the
product.
Strategic Management
Activities related to setting the overall strategy for a company or a
chain; these activities would typically be undertaken at the
headquarters location.
Source: adapted from Frederick (2010)
ii. Supply Chain
The second part, the supply chain and end-use markets, represent an expansion of the production
and logistics activities in the simple value chain. Expansion of these two steps results in an input-
output process that has four basic stages that vary based on the market the supply chain feeds
into: inputs, components, final product manufacturing, and distribution and sales. These make up
the production-related links in the chain and between each of these steps is the distributing of
products from one place to the next, also referred to as logistics. Each of the markets represents
unique combinations of the four parts of the supply chain that lead to the creation of final end-
user products.
The supply chain represents the unique input-output process of an industry that begins with raw
materials and continues through the making of components and subassemblies, final product

27
manufacturing, distribution and sales. In the value chain visual, the supply chain is broken into
five colors; each represents one of the basic stages in the supply chain. The large arrows
represent the main stages in the supply chain, whereas the boxes listed directly below a large
arrow represent specific types of products.
The supply chain portion of the reference model can be linked to the international standard
industrial classification (ISIC) system of all economic activities or national level systems that are
based on this system. In the applications of this model for the textile and apparel industries, the
boxes in the chain correspond to codes in the North American Industry Classification System
(NAICS). In the visual, the large arrows represent NAICS sub-sectors (three-digit codes) and the
boxes listed directly below the large arrows represent U.S. industry groups or industries (4-6-
digits). Having an established set of codes that can be used to identify participants in the value
chain allows both establishments and industry statistics to be identified through a variety of
sources (Frederick, 2008).
Figure 5: Parts of the Supply Chain
Source: Frederick, S. (2010).
As previously mentioned, the ISIC/NAICS structure resembles a supply chain, but the system is
not industry supply chain specific. There has been increasing interest in recent years to discover
a systematic way to expand coverage of traditional industries to include all the members of an
industrial complex. One way to accomplish this is by using the Benchmark Input-Output (I-O)
Accounts prepared by the U.S. Census Bureau based on the five-year U.S. Census. The I-O
accounts show the value of what is produced by each industry (make table) and the value of what
is consumed by each industry and final users in the economy (use table) (Horowitz & Planting,
28
2006). Other researchers (Feser & Bergman, 2000; Feser & Isserman, 2005; Porter, 2003) have
used the Benchmark I-O Accounts to identify economic clusters based on common trading
patterns and spatial proximity, but not to identify extended supply chains without geographic
constraints (see Mapping: Industry-specific value chains using VCRM & I-O tables).
Having an established process and set of codes that can be used to identify participants in the
value chain allows both establishments and industry statistics to be identified through a variety of
sources. Examples of sources for establishment data in the U.S. include Dun & Bradstreet and
Reference USA and industry statistics can be collected from national and state government
agencies, trade associations, and independent consulting organizations (Frederick, 2008).
One of the advantages of basing the model on a standard classification system is the ability to
link it to other establishment, process and product-based classification systems. Comparison and
crosswalk files can be created for product classification systems used to analyze trade patterns
(i.e., Harmonized System (HS), Standard International Trade Classification (SITC)) as well as
country specific systems such as the General Name for Economic Activities in the European
Union (NACE) codes. Integrating these systems enables the development of a global value chain
model.
iii. Distribution & Sales and End-Use Markets
There are three broad types of final product market distribution channels and buyers. The key
distinction is based on the purpose for purchasing the product. Consumer retail markets are
consumer products and services (such as clothes and household items) that can be purchased via
brick and mortar retail outlets, catalogs, or via the Internet. Consumer products are produced for
personal use. Industrial markets are for products that are purchased by firms that are used to run
or operate a business (such as machinery, equipment and building materials). Industrial products
typically purchased by a business for further processing or for use in conducting the activities of
the business. Institutional (Public-Use) markets are for products purchased for public use by
public “institutions.” Institutional buyers include firms in the hospitality (hotels, restaurants),
medical (hospitals), contract (offices), and government (military, prisons, schools).
End markets are included as a separate concept from the industry because many products,
particularly at the raw materials and components stages, feed into more than one final product.
For example, a textile fabric is classified under ISIC 17 (textiles), which is typically aggregated
with ISIC codes 18 and sometimes 19 (wearing apparel and leather) to represent the “textile and
apparel industry.” However textile fabrics are actually an intermediate input into several
industries including furniture, industrial products, medical devices and motor vehicles (see
Error! Reference source not found. for an example using the U.S. fabric industry as an
example).
Rather than develop a new taxonomy, the ISIC sections and manufacturing-related industries can
be used as a basis to classify end markets and distribution channels as well as industries. End

29
market classifications have been developed and used in studies of the textile and apparel
industries and for the electronics industry.17
Figure 6: Textile Fabric (3132) Supply Chain (based on U.S. Benchmark I-O 2007)
Source: Author, from (U.S. BEA, 2013a, 2013b)
iv. Supporting Business Environment
The fourth part of the model is the external supporting business environment, which includes
both the local to global entities that support and influence internal stakeholders. Members of the
supporting business environment can be separated into six categories: business, information, and
technology services, education, testing, and training, government services, infrastructure and
finance, NGOs and standards, and trade and professional organizations.
The organizations in each of these categories provide rules and resources to internal actors in the
value chain. Members of the supporting environment are responsible for establishing and
enforcing institutions in various form such as norms and customs, regulations, policies, laws,
17
End market used in the electronics industry included aerospace, automotive, computers, consumer electronics,
industrial, medical and telecommunications (Frederick & Gereffi, 2013).

30
international trade agreements, taxes, quotas, subsidies, licenses, anti-corruption, property rights,
etc. that can facilitate or hinder the movement of a product or service along its value chain. The
geographic scope of influence ranges from local through national to global, and the focus of their
activities can be economy-wide or industry-specific. Economy-wide activities provide the basic
structure on which all economic activities rely including transportation, communication,
financial, and business-related and public services that cross-cut multiple industries.
Furthermore, the actors can represent public or private interests (Frederick, 2008; Frederick &
Cassill, 2009).
B. The VCRM classification
The supply chain portion of VCRM is based on existing classification systems, but the VCRM
also represents a new classification system. Existing classification systems are either industry-
specific or process-specific, however the VCRM classification system can be used for both. The
firms, resources, and supporting entities included in the supply chain of the VCRM can be
classified based on their place in the supply chain, the value adding-activities they engage in, the
markets they serve, and by the supporting environment organizations and institutions they are
affiliated with. The process is based on the four parts of the value chain reference model.
1. The process begins by determining which of the six value-adding activities a firm
engages in at a particular establishment. Instead of having all establishments associated
with manufacturing, firms may also be associated with distribution/logistics functions as
well as pre- and post-production activities. This overcomes one of the major limitations
of ISIC codes.18
2. The next step is to determine the parts of the supply chain the establishment performs the
selected value-adding activities for. An establishment may select a position in one or
multiple supply chain sectors: inputs, components, final products, or distribution and
sales. Furthermore, the establishment can be affiliated with one or more types (or
products) within the sector. For example is a user chooses fabric, woven, narrow,
nonwoven, and knitted types are all options.
3. The third step is to determine which end-use markets the final products produced from
the establishment’s goods or services feed into. Combining these first three pieces of
information begin the process of creating complete industry supply chains by product and
by end-use market. Providing a means to collect this type of information systematically
provides a means to fill the current information gap in the specific capabilities of firms.
4. The next step in the process seeks to determine the specific products an establishment
produces or conducts other value-adding activities for. The addition of product
information builds a more comprehensive database of existing firm capabilities. In
addition to the creating a list of products a firm currently produces, it is also helpful to be
aware of the products a firm is capable of producing. To determine capabilities, it is
18
A web-based version of this process is currently used for the account creation process on NC Textile Connect and
SC Textile Connect websites (Frederick, 2010).
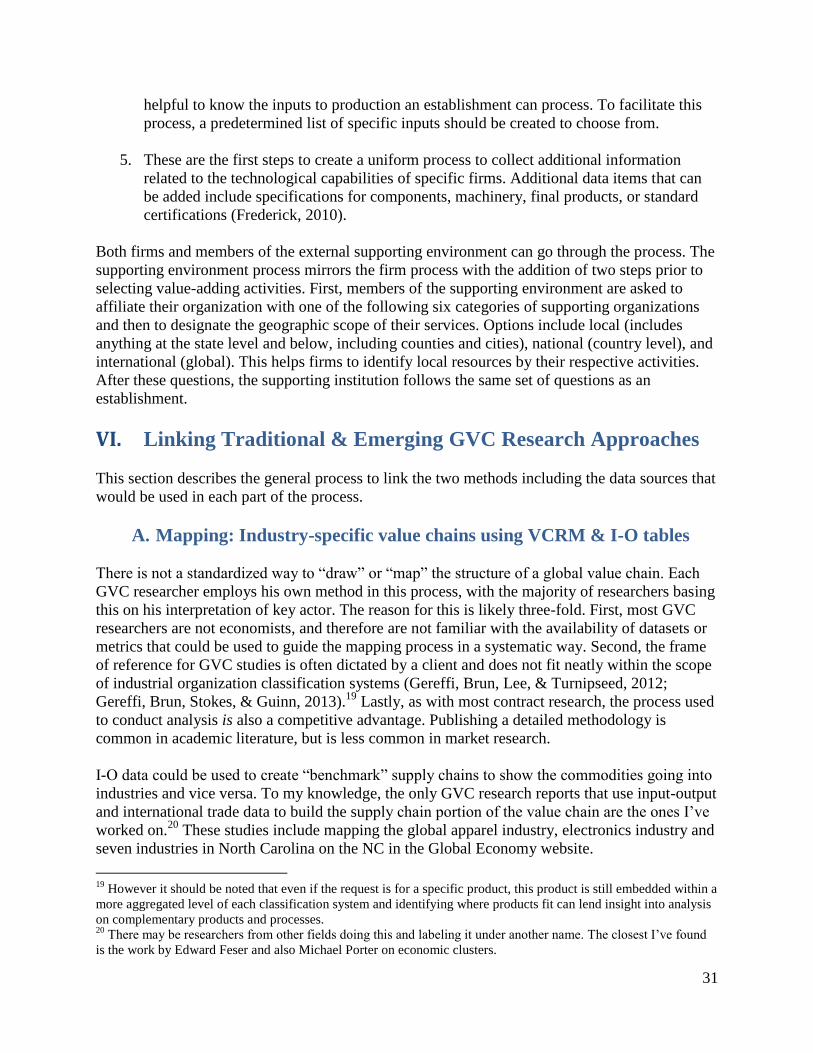
31
helpful to know the inputs to production an establishment can process. To facilitate this
process, a predetermined list of specific inputs should be created to choose from.
5. These are the first steps to create a uniform process to collect additional information
related to the technological capabilities of specific firms. Additional data items that can
be added include specifications for components, machinery, final products, or standard
certifications (Frederick, 2010).
Both firms and members of the external supporting environment can go through the process. The
supporting environment process mirrors the firm process with the addition of two steps prior to
selecting value-adding activities. First, members of the supporting environment are asked to
affiliate their organization with one of the following six categories of supporting organizations
and then to designate the geographic scope of their services. Options include local (includes
anything at the state level and below, including counties and cities), national (country level), and
international (global). This helps firms to identify local resources by their respective activities.
After these questions, the supporting institution follows the same set of questions as an
establishment.
VI. Linking Traditional & Emerging GVC Research Approaches
This section describes the general process to link the two methods including the data sources that
would be used in each part of the process.
A. Mapping: Industry-specific value chains using VCRM & I-O tables
There is not a standardized way to “draw” or “map” the structure of a global value chain. Each
GVC researcher employs his own method in this process, with the majority of researchers basing
this on his interpretation of key actor. The reason for this is likely three-fold. First, most GVC
researchers are not economists, and therefore are not familiar with the availability of datasets or
metrics that could be used to guide the mapping process in a systematic way. Second, the frame
of reference for GVC studies is often dictated by a client and does not fit neatly within the scope
of industrial organization classification systems (Gereffi, Brun, Lee, & Turnipseed, 2012;
Gereffi, Brun, Stokes, & Guinn, 2013).19
Lastly, as with most contract research, the process used
to conduct analysis is also a competitive advantage. Publishing a detailed methodology is
common in academic literature, but is less common in market research.
I-O data could be used to create “benchmark” supply chains to show the commodities going into
industries and vice versa. To my knowledge, the only GVC research reports that use input-output
and international trade data to build the supply chain portion of the value chain are the ones I’ve
worked on.20
These studies include mapping the global apparel industry, electronics industry and
seven industries in North Carolina on the NC in the Global Economy website.
19
However it should be noted that even if the request is for a specific product, this product is still embedded within a
more aggregated level of each classification system and identifying where products fit can lend insight into analysis
on complementary products and processes. 20
There may be researchers from other fields doing this and labeling it under another name. The closest I’ve found
is the work by Edward Feser and also Michael Porter on economic clusters.

32
As a starting point, GVC maps should be constructed for each of the two-digit ISIC codes for all
manufacturing and agriculture-related codes (sectors A-C in ISIC rev.4). A similar process
could be used to develop GVC maps for service related industries. Mapping a GVC for a service
is different because in many cases it can be viewed as an “overlay” to a goods producing GVC
and it has an industry-neutral “supply chain-like” flow of its own. This process has been
completed by the author using data for the United States textile and apparel industries, however
it could be replicated using global I-O tables. For the textile and apparel industries detailed files
that break up the various segments of the chain using HS, SITC and ISIC/NAICS codes have
been developed. The division of the textile and apparel industry codes between intermediate and
final goods was compared to the BEC divisions and the two had similar results. The limiting
factor is that BEC only breaks the codes into two parts (intermediate and final), whereas there
are more than just two main nodes in the chain.
Three recent reports on the electronics industry also provide a list of HS codes to analyze the
industry. In a report prepared by Frederick and Gereffi (2013) for Costa Rica, the HS codes used
to analyze the industry are listed by product category (pgs. 53-60). Information was also
collected on the end markets served by individual electronics firms, which was also used to
provide aggregate statistics on the end markets served by the electronics industry in Costa Rica.
Similarly in a report led by Sturgeon, Gereffi, Guinn, and Zylberberg (2013) for Brazil, HS
codes are provided based on intermediate or final product and end market (pg. 96-101). Both
studies use the codes outlined in (Sturgeon & Memedovic, 2011) as a starting point. To illustrate
how different researchers choose to visualize or map this information, see

33
Figure 7 comparing the electronics GVC maps provided in the two studies below.
Once the industry-specific chains are developed, concordance files are readily available to link to
other international classification systems for products and occupations among other things.
Efforts to link these statistics to world input-output tables are also underway. The WIOD appears
to be the most focused in this area and the OECD-WTO TiVA project also mentions this as a
focus area.
B. Analysis: “Quantify” GVC perspective with industrial data
GVC studies can be improved by using existing data based on industrial statistics to quantify the
GVC theories of governance and upgrading. Annex 5: Potential Ways to “Measure” Upgrading
lists the main types of upgrading used in GVC studies and provides examples of (1) how it is (or
could be) measured using readily available datasets, (2) how it could be measured by linking data
from other classification systems or datasets and (3) additional information and/or datasets
needed.
i. Improvements to GVC analysis using I-O data
There are several ways GVC analysis could be improved using existing data. For example, I-O
data can be used to find the share of key inputs to particular ISIC industry compared to domestic
production (backward linkages). End market (product) shifts/upgrading can be evaluated by
identifying changes over time in the industries (downstream) that purchase the commodities
(upstream) over time or this information could be compared using national I-O tables for
different countries. With a world I-O table, one could track the shifts in end markets over time
and using national data, determine which countries are shifting to the new markets and which
countries are lagging behind. One can also use I-O tables and trade data to evaluate end market
(geographic) shifts/upgrading. This is of particular importance for fast growing economies that
are currently key exporters, but may shift to supply products and services to the domestic
economy as population and demand increase in the home countries.
ii. Improvements to GVC analysis using trade data
GVC analysis can also be improved by incorporating more detailed trade data. This can be used
to analyze product upgrading and geographic end market upgrading. Trade data is used to
describe these types of upgrading in the textile, apparel and electronics industries (Frederick,
Bair, & Gereffi, 2014; Frederick & Gereffi, 2011, 2013; Frederick & Staritz, 2012). This will
also be expanded in a forthcoming World Bank apparel project. This project will include a
variety of datasets on industrial economic activities and labor market data.
iii. Using the VCRM to guide GVC analysis
The VCRM can also serve as the organizing structure to guide value chain analysis of
competitive dynamics and relationships (Frederick, 2010). In the research approach, the degree
to which firms in the supply chain engage themselves in the value-adding activities determines

34
their position in the global industry. They can be viewed from the perspective of a firm or the
entire chain/inter-firm network. Firms can facilitate this process by interacting with the
institutions that make up the global supporting environment. Furthermore, firms can upgrade or
create a unique advantage by interacting with other parts of the supply chain, or by focusing on
different markets (Frederick, 2008; Frederick & Cassill, 2009). The VCRM can be used as part
of a process firms go through to determine where they are in the value chain. This visual process
can be used as the basis of an educational or competitiveness tool used to determine the structure
of an industry as well as potential strategies and tactics.
C. Steps to a combined approach
In order to evaluate GVC dynamics, classification systems are needed that enable
establishments to be classified along five* dimensions: industry (including products by
industry), supply chain position, end markets, value-adding activities (or business
functions) and occupations.
Table 4 lists the availability of classification systems in each area and the type of upgrading it
pertains to.
Existing economic activity and product classification systems were originally created decades
ago when the activities of establishments and the end-use and industry of products could be
much more narrowly-defined. Resultantly, the concepts of industry, supply chain, end market
and activity-specificity are all embedded in these systems to some extent, but all four are
combined in a non-uniform fashion. In Annex 6: ISIC Rev.4 Sectors Correlation to Value and
Supply Chain Stages, the ISIC Rev. 4 sectors are correlated to the value chain stages and supply
chain positions they generally represent for goods producing industries. In the ISIC system, the
majority of the codes represent a “service” industry, however in reality establishments that
provide services often do so for a specific industry. However in the ISIC system there is not a
way to separate out these activities by industry (in detail). For example, one could map out all of
the stages in the accommodation and food service activities industry however this industry also
represents one of the main categories of buyers for goods producing industries within the
manufacturing sector (i.e., food, furniture, textiles, etc.).
Table 4: Classification Focus Areas: Existing Systems & Relationship to Upgrading
Focus Existing Classification
Systems Notes Upgrading
Industry (and product)-
specific
Two-digit ISIC codes
(~23-24) within the
manufacturing section can
be used as a starting point
Well-established
correlations to product-
specific systems (i.e.,
HTS, CPC) exist
Product upgrading
(industry-specific)
Supply chain-specific
(including intermediate
and final goods)
ISIC is supply-chain
specific to an extent, but
only industry-specific for
manufacturing codes (see
visual)
BEC is somewhat of a
cross between a supply
chain and an end-
market (capital vs.
consumption) system
Supply chain upgrading;
Backward/forward linkages
35
End market-specific
None;
ISIC/BEC could be used
as a rough starting point
Can relate to the
industry21
or type of
buyer (consumer,
industrial, institutional)
End market upgrading
Value-Adding Activity-
specific “Business
Functions”
International classification
system does not exist
Two options:
(1) Develop a
“Business Functions”
classification system
and correlate data from
existing survey sources
for data on specific
functions (see page 13).
(2) Add industry-
specific options to ISIC
for sectors other than
manufacturing.
Functional upgrading
Occupation-specific* ISCO-ISIC Functional upgrading;
Process upgrading
Source: Author; Note (*): linking ISCO-ISIC does not appear to be the focus of any existing research efforts.
21
More important as a means to classify intermediate goods than final products
36
VII. Appendices
Appendix 1: Background, objectives & methods of stakeholders
interested in GVCs
Research labeled “GVC” can be broken into the following groups
Academics: people based at universities, many of which have research centers engaged in
contract-type research
o Social science: the GVC framework primarily originated from a group of
international researchers from economic sociology and geography backgrounds
engaged in economic development research (Annex 1).
o Economists: value chain research by economists traditionally focused on the firm
as the primary unit of analysis and was centered on maximizing competitiveness
at the firm level. In recent years “new” GVC researchers have emerged – whereas
the majority of the work from these groups is not labeled as GVC, they are
engaging in research that will enable “quantifying” GVC activity (Annex 2).
International NGOs and national governments: these groups are the primary funders of
GVC-related research. They are primarily interested in how studies using a GVC lens can
guide policymaking and economic development (Annex 3).
Statistical agencies: these groups are responsible for collecting and disseminating data
that can be used to measure and benchmark the performance of countries and industries
(Annex 4).
Academic Divide: Traditional GVC Social Scientists & “GVC” Economists
Annex 1 includes the “traditional” group of GCC, GVC and GPN researchers; this group
primarily consists of the creators of the GVC framework and the GPN framework and others that
work at affiliated research centers. The data used to conduct a traditional GVC study and the
resulting analysis is primarily qualitative. Information is typically conducted by collecting basic
industry-specific statistics, gathering secondary information from journal articles, reports and
market research and through primary data collection via interviews or surveys with firms and
supporting organizations.
A significant component of many GVC is simply data gathering. Given that most government
officials and international NGOs are policy or development specialists rather than industry
specialists, simply knowing where to find information, let alone analyze it, is both a daunting and
arduous task. The group in Annex 2 includes research centers and economists that have started to
engage in “GVC” research, primarily over the last five years. Prior to this, value chain-like
research focused at the firm-level and was primarily composed of groups that followed the
frameworks of Porter. Unlike traditional GVC studies, economists first look to available datasets
to guide research and prioritize developing quantitative results. Economists acknowledge that
data is imperfect, but prefer to have measurable outcomes versus subjective analysis.
The interest in GVCs for economists is largely related to what Baldwin refers to as the “second
unbundling” (Baldwin, 2009). The first unbundling came from trade theory, and was based on
comparative advantage and sectors were the unit of analysis. The second unbundling is based on

37
trade in tasks and started in mid-1980s (Grossman & Rossi-Hansberg, 2008). It occurred due to
(1) decrease in trade costs, (2) policies, (3) demand and (4) technological change (De Backer &
Miroudot, 2013).22
The groups below are international organizations that either contract out GVC related research or
have staff that work with outside groups to conduct value chain studies. Nearly all of these
groups have published GVC guides, toolkits and handbooks on how to do value chain research
(see Annex 3Error! Reference source not found. for the main publications by organization).
These organizations are primarily interested in GVC research as a framework to guide
policymaking that provides equitable development that factor in economic, social and/or
environmental concerns.
Interest in GVCs by international NGOs and national governments has been a recent
phenomenon that started roughly a decade ago, but intensified in 2008/2009 with the onset of the
global economic crisis. Prior to this, the majority of GVC research was conducted in academic
institutions and research outputs were primarily developed for inclusion in scholarly journals.
Today the majority of GVC studies are in the form of reports sponsored by national governments
or international agencies on behalf of their constituents.
The organizations in Annex 4 are international, regional and national statistics agencies
responsible for collecting industrial and/or trade statistics. These groups are all, in some way,
leading the charge in exploring how to make better use of available data and/or create new
surveys in areas with limited data availability such as business function data.
22
Baldwin prioritizes technology change as the primary driver.
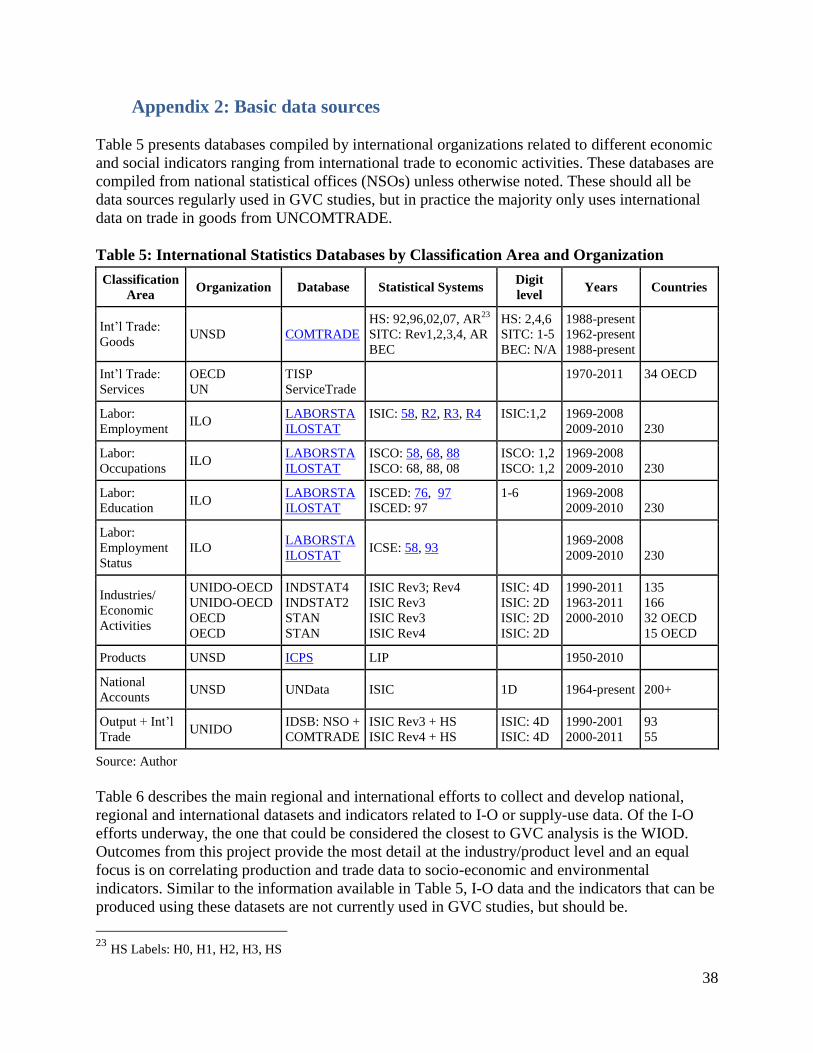
38
Appendix 2: Basic data sources
Table 5 presents databases compiled by international organizations related to different economic
and social indicators ranging from international trade to economic activities. These databases are
compiled from national statistical offices (NSOs) unless otherwise noted. These should all be
data sources regularly used in GVC studies, but in practice the majority only uses international
data on trade in goods from UNCOMTRADE.
Table 5: International Statistics Databases by Classification Area and Organization
Classification
Area Organization Database Statistical Systems
Digit
level Years Countries
Int’l Trade:
Goods UNSD COMTRADE
HS: 92,96,02,07, AR23
SITC: Rev1,2,3,4, AR
BEC
HS: 2,4,6
SITC: 1-5
BEC: N/A
1988-present
1962-present
1988-present
Int’l Trade:
Services
OECD
UN
TISP
ServiceTrade
1970-2011
34 OECD
Labor:
Employment ILO
LABORSTA
ILOSTAT
ISIC: 58, R2, R3, R4
ISIC:1,2
1969-2008
2009-2010
230
Labor:
Occupations ILO
LABORSTA
ILOSTAT
ISCO: 58, 68, 88
ISCO: 68, 88, 08
ISCO: 1,2
ISCO: 1,2
1969-2008
2009-2010
230
Labor:
Education ILO
LABORSTA
ILOSTAT
ISCED: 76, 97
ISCED: 97
1-6
1969-2008
2009-2010
230
Labor:
Employment
Status
ILO LABORSTA
ILOSTAT ICSE: 58, 93
1969-2008
2009-2010
230
Industries/
Economic
Activities
UNIDO-OECD
UNIDO-OECD
OECD
OECD
INDSTAT4
INDSTAT2
STAN
STAN
ISIC Rev3; Rev4
ISIC Rev3
ISIC Rev3
ISIC Rev4
ISIC: 4D
ISIC: 2D
ISIC: 2D
ISIC: 2D
1990-2011
1963-2011
2000-2010
135
166
32 OECD
15 OECD
Products UNSD ICPS LIP 1950-2010
National
Accounts UNSD UNData ISIC 1D 1964-present 200+
Output + Int’l
Trade UNIDO
IDSB: NSO +
COMTRADE
ISIC Rev3 + HS
ISIC Rev4 + HS
ISIC: 4D
ISIC: 4D
1990-2001
2000-2011
93
55
Source: Author
Table 6 describes the main regional and international efforts to collect and develop national,
regional and international datasets and indicators related to I-O or supply-use data. Of the I-O
efforts underway, the one that could be considered the closest to GVC analysis is the WIOD.
Outcomes from this project provide the most detail at the industry/product level and an equal
focus is on correlating production and trade data to socio-economic and environmental
indicators. Similar to the information available in Table 5, I-O data and the indicators that can be
produced using these datasets are not currently used in GVC studies, but should be.
23
HS Labels: H0, H1, H2, H3, HS
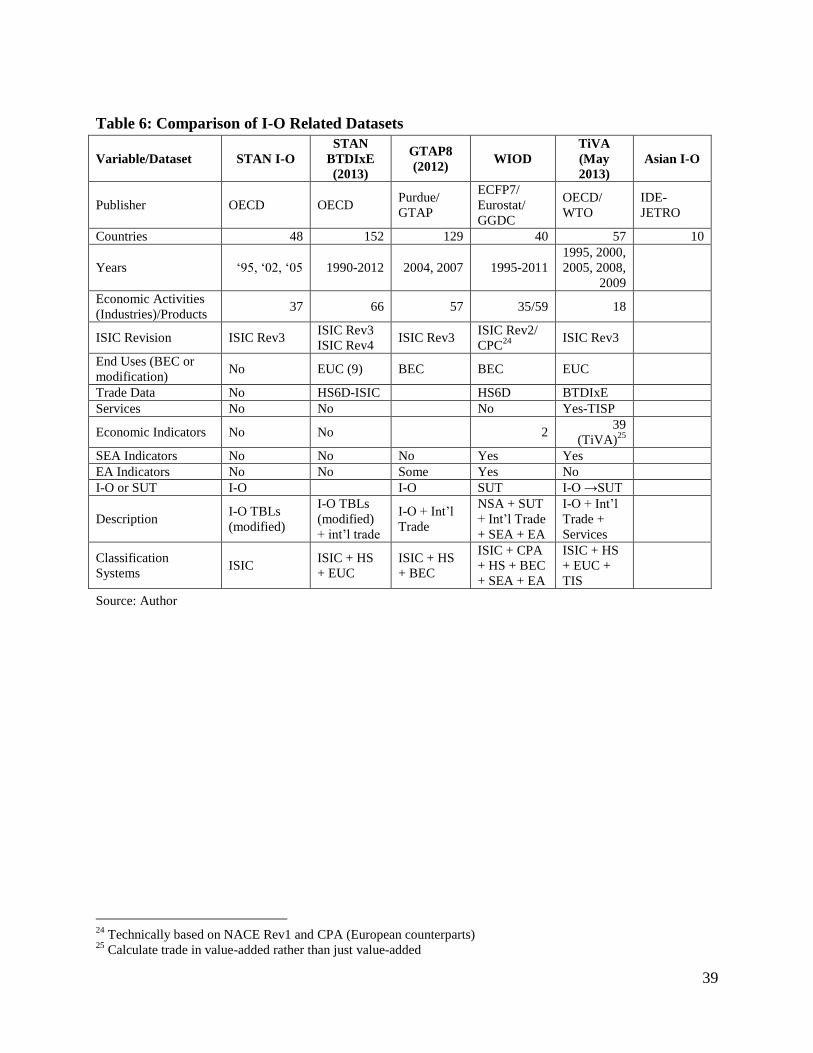
39
Table 6: Comparison of I-O Related Datasets
Variable/Dataset STAN I-O
STAN
BTDIxE
(2013)
GTAP8
(2012) WIOD
TiVA
(May
2013)
Asian I-O
Publisher OECD OECD Purdue/
GTAP
ECFP7/
Eurostat/
GGDC
OECD/
WTO
IDE-
JETRO
Countries 48 152 129 40 57 10
Years ‘95, ‘02, ‘05 1990-2012 2004, 2007 1995-2011
1995, 2000,
2005, 2008,
2009
Economic Activities
(Industries)/Products 37 66 57 35/59 18
ISIC Revision ISIC Rev3 ISIC Rev3
ISIC Rev4 ISIC Rev3
ISIC Rev2/
CPC24
ISIC Rev3
End Uses (BEC or
modification) No EUC (9) BEC BEC EUC
Trade Data No HS6D-ISIC HS6D BTDIxE
Services No No No Yes-TISP
Economic Indicators No No 2 39
(TiVA)25
SEA Indicators No No No Yes Yes
EA Indicators No No Some Yes No
I-O or SUT I-O I-O SUT I-O →SUT
Description I-O TBLs
(modified)
I-O TBLs
(modified)
+ int’l trade
I-O + Int’l
Trade
NSA + SUT
+ Int’l Trade
+ SEA + EA
I-O + Int’l
Trade +
Services
Classification
Systems ISIC
ISIC + HS
+ EUC
ISIC + HS
+ BEC
ISIC + CPA
+ HS + BEC
+ SEA + EA
ISIC + HS
+ EUC +
TIS
Source: Author
24
Technically based on NACE Rev1 and CPA (European counterparts) 25
Calculate trade in value-added rather than just value-added

40
Appendix 3: Applications of the VCRM
Information Management System and Online Directory
This VCRM can be used as an online information management system and platform for a
website directory to disseminate and collect business information among members of an
industry. The VCRM is used to bring together and organize information from diverse resources
available to an industry. By displaying this system as a web based application, users are able to
traverse the information for each stage of the value chain through the use of a visual depiction.
This type of industry resource can serve four primary functions: describe, promote, and explain
an industry value chain; provide a comprehensive repository of data; create a medium for
increased collaboration among government, academia, and industry; and serve as a learning tool
(Frederick, 2008). There are currently two examples that use the VCRM as the basis of an
industry-specific information directory for the textile value chain: NC Textile Connect
(www.nctextileconnect.com) and SC Textile Connect (www.sctextileconnect.com). These two
websites were created by the author and are maintained by North Carolina State University,
College of Textiles. These sites are designed to increase awareness of these states’ textile
industries and increase collaboration among its respective members.
The Textile Connect sites provide industry information based on the VCRM applied to the textile
value chain. Major sections of the website include: textile research, trade data, local to global
events, news, publications, business information, and a directory of all the members of each
state’s textile complex. All information on the websites is classified and searchable by the value
chain classification system and visual representation. The value chain visual is interactive, and
when clicked, each box in the value chain proceeds to a unique page for that part of the value
chain. On each unique value chain page are links to all of the other sections of the website
(events, trade data, publications, consumer market data, news, companies) but only the resources
within each section that pertain to that part of the value chain (Frederick, Dunning, & Cassill,
2009).
Companies can create a login and password to add their profiles to the database or edit their
existing profile. In doing so, this portal allows administrators to collect contact information from
the textile community to facilitate future dialogue. Firms can identify potential buyers and
suppliers using this comprehensive database and economic developers can use the site to identify
firms and support within their areas by each part of the value chain.
Value Chain Visual Analytics
Another website resource that connects the parts of the value chain is found on the North
Carolina in the Global Economy (NCGE) (www.NCGlobalEconomy.com) website at Duke
University (CGGC, 2014). This website analyzes seven of North Carolina’s major industries
(including textiles) based on the same value chain model. The ability to apply the same reference
model to other industries creates a way for researchers to identify commonalities among
industries undergoing similar development trajectories.
The value chains on the NCGE site are all interactive models that exhibit additional ways
industry data and statistics can be connected to the value chain model. For example, when the

41
user places the cursor over the supply chain boxes, a description of each NAICS-based activity
appears along with statistics from QCEW on the number of firms, employees, and average
annual wages per employee in North Carolina.
Visualization is also used as an analytical tool on the NCGE site. By placing the mouse over the
supporting industries or value-adding activities boxes, the stages in the supply chain that are
highly impacted by these areas are highlighted, in addition to a description of activities and
statistics when available. Additionally, the firm structures of the top five employers in each NC
industry are mapped on the value chain. This is accomplished by identifying all of subsidiaries
and accompanying NAICS codes for each establishment within a firm and relating this back to
the value chain model (CGGC, 2014).
The goal of the project is to simplify understanding of industrial organization, international trade and
economic development patterns by integrating empirical and analytical data with user-friendly, web-
based visualizations. A more recent example, also created by the author, combines the concepts behind
Textile Connect and NCGE. The California in the Nano Economy website
(www.CaliforniaNanoEconomy.org) is both an educational resource and an information directory of
firms and organizations engaged in all aspects of nanotechnology research through production for all
impacted industries.

42
Appendix 4: Methods used in three industries (apparel, auto,
electronics)
This section provides a profile of how the GVCs of three well studied industries have been
analyzed, including the methods used, to identify overlaps in methodology. For a complete
listing of studies for these industries and others, see www.globalvaluechains.org.
Studies on the global apparel industry have primarily been written by Gary Gereffi and more
recently by Stacey Frederick and Cornelia Staritz (Frederick & Gereffi, 2011; Frederick &
Staritz, 2012; Gereffi & Frederick, 2010). A number of researchers also specialize on a country-
specific basis including Meenu Tewari (India), John Pickles (Eastern Europe, China) and Mike
Morris (Africa) to name a few.
The following 15 studies (2003-2014) all use a GVC framework to analyze the automotive
industry: (Abe, 2013; Conteras, Carrillo, & Alonso, 2012; De Backer & Miroudot, 2013; Gereffi
& Guler, 2010; GERPISA, 2010; Humphrey & Memedovic, 2003; Kaplinsky, 2005; Sturgeon &
Memedovic, 2011; Sturgeon, Memedovic, Van Biesebroeck, & Gereffi, 2009; Sturgeon & Van
Biesebroeck, 2011; Sturgeon, Van Biesebroeck, & Gereffi, 2007, 2008, 2009; van Biesebroeck
& Sturgeon, 2010).
GVC research on the electronics industry has been carried out by Tim Sturgeon and colleagues
(Frederick & Gereffi, 2013; Sturgeon, 2003, 2007; Sturgeon et al., 2013; Sturgeon & Kawakami,
2010a, 2010b, 2011; Sturgeon & Lee, 2004; Sturgeon & Memedovic, 2011). Electronics industry
research has also been conducted by economists engaged in product “teardown” studies by
researchers at Research Institute of the Finnish Economy (ETLA) and the Sloan Personal
Computing Industry Center (PCIC) at UC-Irvine.

43
Figure 7: Electronics GVC Maps (Brazil & Costa Rica Country Report)
Sources: Top (Sturgeon et al., 2013); Figure 8: The Electronics Global Value Chain Map; Bottom (Frederick &
Gereffi, 2013); Figure 1: The Electronics Global Value Chain

44
VIII. Annexes
Annex 1: GVC-GPN-GCC Researchers Centers (Academics-Social
Sciences) # Organization Focus Areas People
1 Duke University, Center on Globalization,
Governance & Competitiveness (CGGC)
Home GVC Initiative; all
theoretical and industry topics;
CtG
Gary Gereffi*,
Stacey Frederick,
Karina Fernandez-
Stark
2 MIT, Industrial Performance Center (IPC)
Governance; Business
Functions; Definitions;
Automotive; Electronics
Tim Sturgeon*
3 University of Manchester (UK); Brooks World
Poverty Institute Social upgrading; CtG; GPN
Stephanie
Barrientos; Martin
Hess
4 Open University (UK) Rent/Profit Raphael Kaplinsky*
5
University of Cape Town, South Africa; Policy
Research in International Services and
Manufacturing (PRISM)
Africa Mike Morris*
6 University of Sussex, Institute for Development
Studies (IDS) Industrial upgrading
Hubert Schmitz*,
John Humphrey*
7 Danish Institute for International Studies (DIIS) Theory; Africa Stefano Ponte, Peter
Gibbon
8 UNC-Chapel Hill Apparel, India, Eastern
Europe, Asia, GPN; CtG
Meenu Tewari, John
Pickles
9 National Singapore University (NUS) GPN Neil Coe, Henry
Yeung
10 University of Colorado Social; Institutional
Governance, Apparel, CtG Jennifer Bair
11 Austrian Research Foundation for International
Development (OFSE) Apparel; CtG; Cornelia Staritz
Source: Author; Notes (*): indicates person involved in original GVC framework planning

45
Annex 2: New GVC Economists
# Organization People Focus Areas/
Projects
1 The New School (NY), Schwartz Center for
Economic Policy Analysis (SCEPA)
Will Milberg, Deborah
Winkler
2 University of Groningen, Groningen Growth &
Development Centre (GGDC)(Netherlands)
Marcel Timmer, Bart
Los, Erik
Dietzenbacher
WIOD
3 Graduate Institute/CEPR (Switzerland) Richard Baldwin
4 Research Institute of the Finnish Economy
(ETLA) Timo Seppälä Case Studies; Electronics
5 IDE-JETRO Bo Meng
Satoshi Inomata
Measuring GVCs/GFTS
Asian IO TBLs
(Meng, Zhang, & Inomata,
2013)
6 UC-Irvine, Personal Computing Industry Center
(PCIC) (Sloan Center)
Kenneth Kraemer,
Jason Dedrick Case Studies; Electronics
7 Center for Global Trade Analysis, Global Trade Analysis Project (GTAP),
Purdue University, Department of Agricultural Economics GTAP
8 Peterson Institute for International Economics (PIIE) Measuring GVCs/GFTS
9 Vienna Institute for International Economic
Studies (WIIW) Robert Stehrer
WIOD
Measuring GVCs/GFTS
10 Harvard Michael Porter Firm VC; Clusters; USA
11 UC-Davis; NBER Robert Feenstra
Production Fragmentation;
Int’l Economics (Late
‘90s)
Source: Author
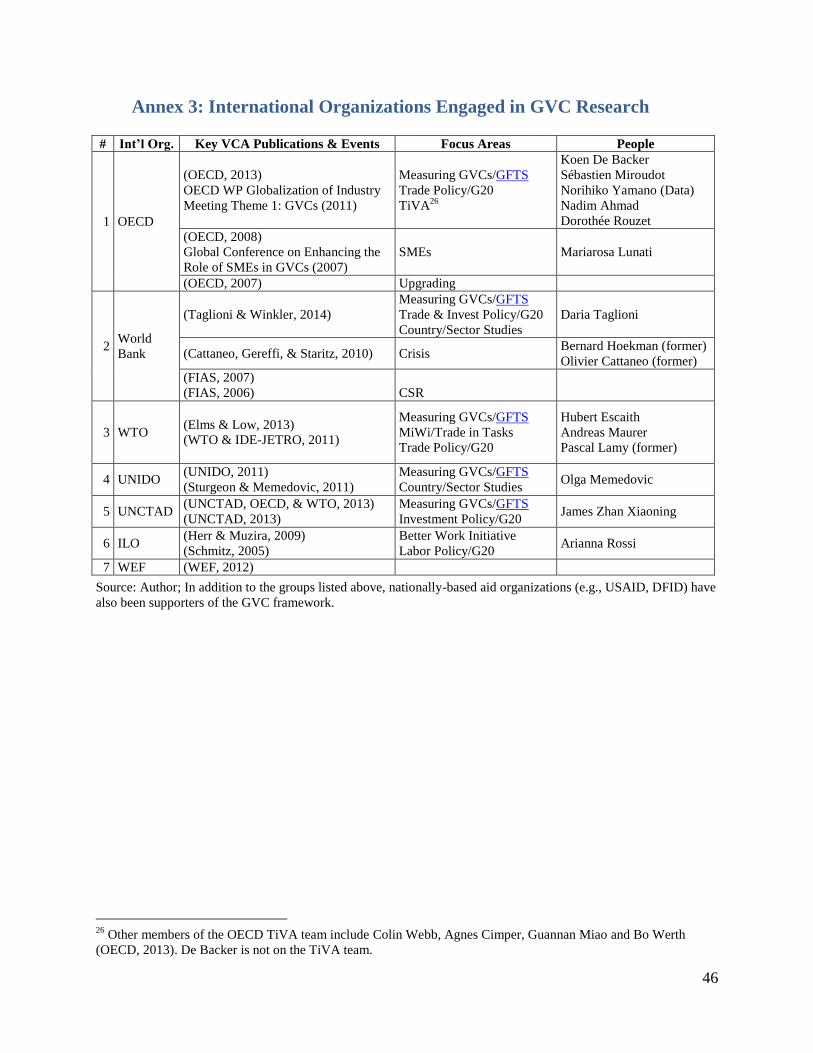
46
Annex 3: International Organizations Engaged in GVC Research # Int’l Org. Key VCA Publications & Events Focus Areas People
1 OECD
(OECD, 2013)
OECD WP Globalization of Industry
Meeting Theme 1: GVCs (2011)
Measuring GVCs/GFTS
Trade Policy/G20
TiVA26
Koen De Backer
Sébastien Miroudot
Norihiko Yamano (Data)
Nadim Ahmad
Dorothée Rouzet
(OECD, 2008)
Global Conference on Enhancing the
Role of SMEs in GVCs (2007)
SMEs Mariarosa Lunati
(OECD, 2007) Upgrading
2 World
Bank
(Taglioni & Winkler, 2014)
Measuring GVCs/GFTS
Trade & Invest Policy/G20
Country/Sector Studies
Daria Taglioni
(Cattaneo, Gereffi, & Staritz, 2010) Crisis Bernard Hoekman (former)
Olivier Cattaneo (former)
(FIAS, 2007)
(FIAS, 2006)
CSR
3 WTO (Elms & Low, 2013)
(WTO & IDE-JETRO, 2011)
Measuring GVCs/GFTS
MiWi/Trade in Tasks
Trade Policy/G20
Hubert Escaith
Andreas Maurer
Pascal Lamy (former)
4 UNIDO (UNIDO, 2011)
(Sturgeon & Memedovic, 2011)
Measuring GVCs/GFTS
Country/Sector Studies Olga Memedovic
5 UNCTAD (UNCTAD, OECD, & WTO, 2013)
(UNCTAD, 2013)
Measuring GVCs/GFTS
Investment Policy/G20 James Zhan Xiaoning
6 ILO (Herr & Muzira, 2009)
(Schmitz, 2005)
Better Work Initiative
Labor Policy/G20 Arianna Rossi
7 WEF (WEF, 2012)
Source: Author; In addition to the groups listed above, nationally-based aid organizations (e.g., USAID, DFID) have
also been supporters of the GVC framework.
26
Other members of the OECD TiVA team include Colin Webb, Agnes Cimper, Guannan Miao and Bo Werth
(OECD, 2013). De Backer is not on the TiVA team.

47
Annex 4: Statistical Agencies Interested in GVCs
# Organization Key Publications Focus Areas/ Projects Surveys
1 UNSD Measuring GVCs/GFTS
2 USITC Measuring GVCs/GFTS
GTAP w/other data
3 Eurostat & European
NSOs
(Sturgeon, 2013)
(Alajääskö, 2009)
(Nielsen, 2008)
Measuring GVCs/GFTS
Business Functions
WIOD & WORKs
International Sourcing
Statistics (ISS):
(Eurostat, 2001-2006,
2009-2011)
4
Statistics Canada &
Foreign Affairs and
International Trade
(DFAIT), Canada
Business Functions
Survey of Innovation
and Business Strategy
(SIBS): (2009, 2012)
5 National Science
Foundation (NSF)
(Claire Brown et al.,
2013) Business Functions
(Clair Brown &
Sturgeon, 2010)
6 Statistics Netherlands
(Statistics
Netherlands, 2009,
2011)
Measuring GVCs/GFTS
Linking
7 Statistics New Zealand LBD Research Measuring GVCs/GFTS
Linking
8 Japan - METI Measuring GVCs/GFTS
9 COMEX Measuring GVCs/GFTS
Source: Author; Notes: Linking: linking business characteristics with trade data

48
Annex 5: Potential Ways to “Measure” Upgrading
Upgrading
Type Existing Datasets/Examples
Linking Economic Activity (ISIC)
to Existing Datasets27
New Datasets/
Information Needed
Functional
Upgrading
WIOD: SEA Worker-Skill
Level (ISIC-ISCED-97)28
CtG Economic/Social
Upgrading (Barrientos,
Gereffi, & Rossi, 2010)
U.S. BRDIS: R&D
investment (NSF-NCSES,
2010)
Occupational data (ISIC-ISCO);
share of workers industry by
occupation
Patent Statistics – R&D & Design
(ISIC-IPC-CPC); Trademarks –
Marketing/Branding (firm-level;
microdata)
Bibliometric analysis – research
Business function data
Backward
Linkages
TiVA: foreign value-added
share of gross exports
Increase in production
output or employment
(ISIC) in upstream ISIC
Trade data: export/import of
inputs compared to other
countries
HS-ISIC/I-O: share of inputs
imported vs. domestic purchases
I-O: identify
benchmark upstream
sectors
End Market Geographic end market:
Trade data: export shifts
Buyer end market: I-O
downstream shifts in final-use
categories
Industry end-market
classification system
(ISIC); add national
survey questions
Product
Trade data: increase in
export unit values
Trade data: shift to products
in industry with higher unit
values
Trade data based on
quantities
Process
Productivity: increase in
industrial output/worker;
Increase in capital
expenditures
Machinery imports
Social Increase in
wages/employment by ISIC
(INDSTAT)
Nationality of
management
Firm
ownership
Domestic vs. FDI by ISIC
WIOD SEA: investment or
capital flow data (?)
Country-
Level
Benefits
Increase in domestic value-
added (gross & TiVA)
Increase in employment
Increase in tax income
Strength of
Institutions Educational programs
availability
Trade & tariff data (HS);
Trade preference programs
(impact on import/export partners)
Governance Firm concentration ratio
Source: Author
27
Potential additions to international input-output efforts 28
Also applicable for social upgrading

49
Annex 6: ISIC Rev.4 Sectors Correlation to Value and Supply Chain
Stages ISIC
Sector ISIC Description
Value Chain Stage
(to Goods Industry)
Supply Chain Position
(to Goods Industry)
Industry
Type
A Agriculture, forestry and fishing Production Raw materials;
Intermediate & Final Goods
B Mining and quarrying Production Raw materials;
Intermediate & Final Goods
C Manufacturing Production Intermediate & Final;
Buyers (All) Goods
D Electricity, gas, steam and air
conditioning supply
Buyers (Industrial);
Supporting Environment Service
E
Water supply; sewerage, waste
management and remediation
activities
Buyers (Industrial);
Supporting Environment Service
F Construction Production Final;
Buyers (Industrial)
Goods;
Service
G Wholesale and retail trade; repair of
motor vehicles and motorcycles
Wholesale/Logistics;
Management/Marketing
Intermediaries;
Buyers Service
H Transportation and storage Wholesale/Logistics Intermediaries;
Buyers Service
I Accommodation and food service
activities Buyers (Institutional) Service
J Information and communication Wholesale/Logistics;
Management/Marketing
Intermediates & Final;
Intermediaries;
Supporting Environment
Goods;
Service
K Financial and insurance activities Management/Marketing Supporting Environment Service
L Real estate activities Supporting Environment Service
M Professional, scientific and technical
activities
R&D;
Design All Service
N Administrative and support service
activities
Management/Marketing;
Services (After-Sale) All Service
O Public administration and defense;
compulsory social security Buyers (Institutional) Service
P Education Buyers (Institutional);
Supporting Environment Service
Q Human health and social work
activities Buyers (Institutional) Service
R Arts, entertainment and recreation Buyers (Institutional) Service
S Other service activities Service
T
Activities of households as
employers; undifferentiated goods-
and services-producing activities of
households for own use
U Activities of extraterritorial
organizations and bodies
Source: Author Interpretation; see Steps to a combined approach

50
IX. References
Abe, M. (2013). Expansion of global value chains in Asian developing countires: automotive
case study in the Mekong sub-region Global value chains in a changing world (pp. 385-
409). Geneva, Switzerland: World Trade Organization (WTO), Fung Global Institute
(FGI) and Nanyang Technological University (NTU).
Alajääskö, P. (2009). International Sourcing in Europe. Statistics in focus(4).
Baldwin, R. (2009). Integration of the North American Economy and New-Paradigm
Globalization CEPR Discussion Paper Series No. 7523. London, UK: Center for
Economic and Policy Research (CEPR).
Barrientos, S., Gereffi, G., & Rossi, A. (2010). Economic and Social Upgrading in Global
Production Networks: Developing a Framework for Analysis Capturing the Gains
Working Paper 2010/03. Manchester, UK.
Barrientos, S., Gereffi, G., & Rossi, A. (2011). Economic and social upgrading in global
production networks: A new paradigm for a changing world. International Labour
Review, 150(3-4), 319-340.
Barrientos, S., & Smith, S. (2007). Do Workers Benefit from Ethical Trade? Assessing Codes of
Labour Practice in Global Production Systems. Third World Quarterly, 28, 713-729.
Brown, C., & Sturgeon, T. (2010). National Organizations Survey, 2010: Examining the
Relationships Between Job Quality and the Domestic and International Sourcing of
Business Functions by United States Organizations. Retrieved September 17, 2014, from
Inter-university Consortium for Political and Social Research (ICPSR)
http://www.icpsr.umich.edu/icpsrweb/ICPSR/studies/35011/version/1
Brown, C., Sturgeon, T., & Cole, C. (2013). The 2010 National Organizations Survey:
Examining the Relationships Between Job Quality and the Domestic and International
Sourcing of Business Functions by United States Organizations IRLE Working Paper No.
156-13. Berkeley, CA: University of California, Berkeley: Institute for Research on
Labor & Employment (IRLE).
Brown, S. (2008). Business Processes and Business Functions: a new way of looking at
employment. Monthly Labor Review, 51-70.
Cattaneo, O., Gereffi, G., & Staritz, C. (Eds.). (2010). Global Value Chains in a Postcrisis
World. Washington, DC: The World Bank.
CGGC. (2005). Global Value Chains Initiative. Retrieved August 7, 2014, from
www.globalvaluechains.org
CGGC. (2014). NC in the Global Economy (NCGE). Retrieved August 26, 2014, from
www.ncglobaleconomy.com
Conteras, O., Carrillo, J., & Alonso, J. (2012). Local Entrepreneurship within Global Value
Chains: A Case Study in the Mexican Automotive Industry. World Development, 40(5),
1013-1023.
De Backer, K., & Miroudot, S. (2013). Mapping Global Value Chains OECD Trade Policy
Papers No. 159. Paris, France: Organisation for Economic Co-operation and
Development (OECD).
Elms, D., & Low, P. (Eds.). (2013). Global Value Chains in a Changing World. Geneva,
Switzerland: World Trade Organization (WTO), Fung Global Institute (FGI) and
Nanyang Technological University (NTU).
51
Erumban, A. A., Gouma, R., de Vries, G. J., de Vries, K., & Timmer, M. (2012). Sources for
National Supply and Use Table Input files Project funded by the European Commission,
Research Directorate General as part of the 7th Framework Programme, Theme 8:
Socio-Economic Sciences and Humanities: Grant Agreement No. 225 281
Eurostat. (2001-2006). International Sourcing Statistics Survey 2007 Retrieved September 17,
2014, from Statistical Office of the European Union (Eurostat)
http://epp.eurostat.ec.europa.eu/portal/page/portal/european_business/data/database
Eurostat. (2009-2011). International Sourcing Statistics Survey 2012. Retrieved September 17,
2014, from Statistical Office of the European Union (Eurostat)
http://epp.eurostat.ec.europa.eu/portal/page/portal/european_business/data/database
Feser, E., & Bergman, E. (2000). National industry cluster templates: a framework for applied
regional cluster analysis. Regional Studies, 34(1), 1-19.
Feser, E., & Isserman, A. (2005). Clusters and rural economies in economic and geographic
space: University of Illinois at Urbana-Champaign.
FIAS. (2006). A Corporate Social Responsibility (CSR) Diagnosis Module for Application in
Value Chain Analysis (VCA). Washington, DC: Foreign Investment Advisory Service
(FIAS), International Finance Corporation (IFC) and the World Bank.
FIAS. (2007). Moving Toward Competitiveness: A Value-Chain Approach. Washington, DC:
Foreign Investment Advisory Service (FIAS), a joint facility of the International Finance
Corporation (IFC), the Multilateral Investment Guarantee Agency (MIGA) and the World
Bank.
Frederick, S. (2008). A New Model for Analyzing, Visualizing and Connecting the Textile Value
Chain in the "New World of Textiles". Paper presented at the Textile Futures, North
Carolina State University, Raleigh, NC.
Frederick, S. (2010). Development and application of a value chain research approach to
understand and evaluate internal and external factors and relationships affecting
economic competitiveness in the textile value chain. (Doctor of Philosophy), North
Carolina State University, Raleigh, NC. Retrieved from
http://www.lib.ncsu.edu.www.lib.ncsu.edu:2048/theses/available/etd-03132010-084518/
Frederick, S., Bair, J., & Gereffi, G. (2014). Nicaragua and the Apparel Value Chain in the
Americas: Implications for Regional Trade and Employment. Durham, NC: Duke
University, Center on Globalization, Governance & Competitiveness (CGGC).
Frederick, S., & Cassill, N. (2009). Industry Clusters and Global Value Chains: Analytical
Frameworks to Study the New World of Textiles. Journal of the Textile Institute, 100,
668.
Frederick, S., Cassill, N., Godfrey, B., & Little, T. (2007a). A Descriptive Analysis of the North
Carolina Textile Complex: 2006. Journal of Textile and Apparel, Technology and
Management (JTATM), 5.
Frederick, S., Cassill, N., Godfrey, B., & Little, T. (2007b). Textile Information Warehouse for
the North Carolina Textile Complex: Providing Assistance to Enhance Global Market
Competitiveness Report to the NC Department of Commerce (NCDOC). Raleigh, NC:
North Carolina State University, College of Textiles.
Frederick, S., Dunning, S., & Cassill, N. (2009). Maintaining the North Carolina Textile
Information Warehouse: NC Textile Connect Report to the NC Department of Commerce
(NCDOC). Raleigh, NC: North Carolina State University, College of Textiles.

52
Frederick, S., & Gereffi, G. (2009a). Upgrading. In A.-V. A. B. Consortium (Ed.), Value Chain
Development Wiki: USAID, Microenterprise Development Team. Retrieved from
http://microlinks.kdid.org/good-practice-center/value-chain-wiki/upgrading.
Frederick, S., & Gereffi, G. (2009b). Value Chain Governance USAID Briefing Paper.
Washington, DC: USAID.
Frederick, S., & Gereffi, G. (2011). Upgrading and Restructuring in the Global Apparel Value
Chain: Why China and Asia are Outperforming Mexico and Central America.
International Journal of Technological Learning, Innovation and Development, 4, 67 -
95.
Frederick, S., & Gereffi, G. (2013). Costa Rica in the Electronics Global Value Chain:
Opportunities for Upgrading Prepared for the Costa Rica Foreign Trade Ministry
(COMEX). Durham, NC: Center on Globalization, Governance & Competitiveness
(CGGC).
Frederick, S., & Staritz, C. (2012). Developments in the Global Apparel Industry after the MFA
Phaseout. In G. Lopez-Acevedo & R. Robertson (Eds.), Sewing Sucess? Employment,
Wages and Poverty following the End of the Multi-fibre Arrangment (pp. 41-86).
Washington, DC: The World Bank.
Gereffi, G. (1994). The Organization of Buyer-Driven Global Commodity Chains: How U.S.
Retailers Shape Overseas Production Networks. In G. Gereffi & M. Korzeniewicz (Eds.),
Commodity Chains and Global Capitalism (pp. 95-122). West Port, CT: Praeger.
Gereffi, G., Brun, L., Lee, J., & Turnipseed, M. (2012). Nova Scotia’s Ocean Technologies
Prepared for a consortium organized by Nova Scotia’s Department of Economic and
Rural Development and Tourism (ERDT) sponsored this report including ACOA, DFAIT,
Industry Canada and NSBI. Durham, NC: Center on Globalization, Governance &
Competitiveness (CGGC).
Gereffi, G., Brun, L., Stokes, S., & Guinn, A. (2013). The NSPS Shipbuilding Value Chains
Prepared for the Nova Scotia Department of Economic and Rural Development and
Tourism (NSERDT). Durham, NC: Center on Globalization, Governance &
Competitiveness (CGGC).
Gereffi, G., & Frederick, S. (2010). Chapter 5: The Global Apparel Value Chain, Trade and the
Crisis: Challenges and Opportunities for Developing Countries. In O. Cattaneo, G.
Gereffi & C. Staritz (Eds.), Global Value Chains in a Postcrisis World (pp. 157-208).
Washington, DC: The World Bank.
Gereffi, G., & Guler, E. (2010). Global production networks and decent work in India and China:
evidence from the apparel, automotive, and information technology industries. In A.
Posthuma & D. Nathan (Eds.), Labour in Global Production Networks in India (pp. 103–
126). New Delhi: Oxford University Press.
Gereffi, G., Humphrey, J., Kaplinsky, R., & Sturgeon, T. (2001). Introduction: Globalisation,
Value Chains and Development. IDS Bulletin, 32(3).
Gereffi, G., Humphrey, J., & Sturgeon, T. (2005). The governance of global value chains.
Review of International Political Economy, 12(1), 78-104.
Gereffi, G., & Korzeniewicz, M. (Eds.). (1994). Commodity Chains and Global Capitalism.
Westport, CT: Praeger.
GERPISA. (2010). The Prospects and Limits to the Development of the Automotive Periphery
(Vol. 42): Groupe d’Études et de Recherche Permanent sur l’Industrie et les Salariés de
l’Automobile (GERPISA).
53
Grossman, G., & Rossi-Hansberg, E. (2008). Trading tasks: A simple theory of offshoring.
American Economic Review, 98(5), 1978-1997.
Herr, M., & Muzira, T. (2009). Value Chain Development for Decent Work: a guide for
development practitioners, government and private sector initiatives. Geneva:
International Labour Office (ILO).
Hopkins, T., & Wallerstein, I. (1986). Commodity chains in the world economy prior to 1800s.
Review, 10(1), 157-170.
Horowitz, K., & Planting, M. (2006). Concepts and Methods of U.S. Input-Output Accounts.
Washington, DC: U.S. Department of Commerce, Bureau of Economic Analysis (BEA).
Hummels, D., Ishii, J., & Yi, K.-M. (2001). The nature and growth of vertical specialization in
world trade. Journal of International Economics, 54(1), 75–96.
Humphrey, J., & Memedovic, O. (2003). The Global Automotive Industry Value Chain: What
Prospects for Upgrading by Developing Countries? UNIDO Sectoral Studies Series.
Vienna, Austria: United Nations Industrial Development Organization (UNIDO).
Humphrey, J., & Schmitz, H. (2002). How Does Insertion in Global Value Chains Affect
Upgrading in Industrial Clusters? Regional Studies, 36(9), 1017-1027.
Humphrey, J., & Schmitz, H. (2008). Inter-firm relationships in global value chains: trends in
chain governance and their policy implications. International Journal of Technological
Learning, Innovation and Development, 1(3), 258–282.
Industry Canada, DFAIT, & Statistics Canada. (2009). 2009 Survey of Innovation and Business
Strategy (SIBS). Retrieved from: www.ic.gc.ca/eic/site/eas-aes.nsf/eng/h_ra02092.html
Industry Canada, DFAIT, & Statistics Canada. (2012). 2012 Survey of Innovation and Business
Strategy (SIBS). Retrieved from: https://www.ic.gc.ca/eic/site/eas-
aes.nsf/eng/h_ra02301.html
Kaplinsky, R. (2005). The Global Dispersion of Production - Three Key Sectors Globalization,
Poverty and Inequality: Between a Rock and a Hard Place.
Kogut, B. (1985). Designing Global Strategies: Comparative and Competitive Value-Added
Chains. Sloan Management Review, 26(4), 15-28.
Lall, S. (2000). The technological structure and performance of developing country
manufactured exports, 1985-98. Oxford Development Studies, 28, 337-369.
Lee, J. (2010). Global Commodity Chains and Global Value Chains. In R. A. Denemark (Ed.),
The International Studies Encyclopedia (pp. 2987-3006). Oxford: Wiley-Blackwell.
Meng, B., Zhang, Y., & Inomata, S. (2013). Compilation and applications of IDE-JETRO's
international input-output tables. Economic Systems Research, 25(1), 122-142.
Nielsen, P. B. (Ed.). (2008). International Sourcing: Moving Business Functions Abroad.
Copenhagen, Denmark: Statistics Denmark (DST), in collaboration with the national
statistical offices of Finland, the Netherlands, Norway and Sweden.
NSF-NCSES. (2010). Business Research and Development and Innovation Survey (BRDIS)
Results: 2010. Detailed Statistical Tables NSF 13-332. Arlington, VA: National Science
Foundation (NSF), National Center for Science and Engineering Statistics (NCSES).
OECD. (2007). Staying Competitive in the Global Economy: Moving up the Value Chain. Paris,
France: Organization for Economic Development and Co-operation (OECD).
OECD. (2008). Enhancing the Role of SMEs in Global Value Chains. Paris, France:
Organization for Economic Development and Co-operation (OECD).
OECD. (2013). Interconnected Economies: Benefiting from Global Value Chains. Paris, France:
Organisation for Economic Co-operation and Development (OECD) Publishing.

54
Ponte, S., & Sturgeon, T. (2014). Explaining governance in global value chains: A modular
theory-building effort. Review of International Political Economy, 21(1), 195-223.
Porter, M. (1985). Competitive Advantage. New York: Free Press.
Porter, M. (2003). The Economic Performance of Regions. Regional Studies, 37(6 & 7), 549–
578.
Schmitz, H. (2005). Value Chain Analysis for Policy-Makers and Practitioners. Geneva,
Switzerland: International Labour Organization (ILO).
Statistics Netherlands. (2009). Internationalization Monitor 2009. The Hague, Netherlands.
Statistics Netherlands. (2011). Internationalization Monitor 2011. The Hague, Netherlands.
Sturgeon, T. (2003). Exploring the Risks of Value Chain Modularity: Electronics Outsourcing
During the Industry Cycle of 1992-2002 MIT IPC Working Paper No. 03-002.
Sturgeon, T. (2007). How Globalization Drives Institutional Diversity: The Japanese Electronics
Industry’s Response to Value Chain Modularity. Journal of East Asian Studies, 7, 1–34.
Sturgeon, T. (2008). Mapping integrative trade: conceptualising and measuring global value
chains. International Journal of Technological Learning, Innovation and Development,
1(3), 237–257.
Sturgeon, T. (2013). Global Value Chains and Economic Globalization - Towards a New
Measurement Framework: Eurostat.
Sturgeon, T., & Gereffi, G. (2009). Measuring Success in the Global Economy: International
Trade, Industrial Upgrading, and Business Function Outsourcing in Global Value Chains.
Transnational Corporations, 18(2).
Sturgeon, T., Gereffi, G., Guinn, A., & Zylberberg, E. (2013). Brazilian Manufacturing in
International Perspective: A Global Value Chain Analysis of Brazil's Aerospace, Medical
Devices, and Electronics Industries Prepared for Brazil’s Confederação Nacional da
Indústria (CNI). Durham, NC: Center on Globalization, Governance & Competitiveness
(CGGC).
Sturgeon, T., & Kawakami, M. (2010a). Global Value Chains in the Electronics Industry: Was
the Crisis a Window of Opportunity for Developing Countries? World Bank Policy
Research Working Paper 5417. Washington, DC: World Bank.
Sturgeon, T., & Kawakami, M. (2010b). Global Value Chains in the Electronics Industry: Was
the Crisis a Window of Opportunity for Developing Countries? In O. Cattaneo, G.
Gereffi & C. Staritz (Eds.), Global Chains in a Postcrisis World (pp. 245-302).
Washington, DC: World Bank.
Sturgeon, T., & Kawakami, M. (2011). Global value chains in the electronics industry:
characteristics, crisis, and upgrading opportunities for firms from developing countries.
International Journal of Technological Learning, Innovation and Development, 4(1/2/3),
120–147.
Sturgeon, T., & Lee, J.-R. (2004). Industry Co-Evolution: A Comparison of Taiwan and North
America’s Electronics Contract Manufacturers ITEC Research Paper Series 04-03:
Institute for Technology, Enterprise and Competitiveness, Doshisha University.
Sturgeon, T., & Memedovic, O. (2011). Mapping Global Value Chains: Intermediate Goods
Trade and Structural Change in the World Economy UNIDO Development Policy and
Strategic Research Branch Working Paper 05/2010. Vienna, Austria: United Nations
Industrial Development Organization (UNIDO).

55
Sturgeon, T., Memedovic, O., Van Biesebroeck, J., & Gereffi, G. (2009). Globalisation of the
automotive industry: main features and trends. International Journal of Technological
Learning, Innovation and Development, 2(1/2), 7-24.
Sturgeon, T., & Van Biesebroeck, J. (2011). Global value chains in the automotive industry: an
enhanced role for developing countries? International Journal of Technological
Learning, Innovation and Development, 4(1/2/3), 181-205.
Sturgeon, T., Van Biesebroeck, J., & Gereffi, G. (2007). Prospects for Canada in the NAFTA
Automotive Industry: A Global Value Chain Analysis Paper prepared for Industry
Canada.
Sturgeon, T., Van Biesebroeck, J., & Gereffi, G. (2008). Value chains, networks and clusters:
reframing the global automotive industry. Journal of Economic Geography, 8(3), 297-
321. doi: 10.1093/jeg/lbn007
Sturgeon, T., Van Biesebroeck, J., & Gereffi, G. (2009). The North American automotive value
chain: Canada’s role and prospects. International Journal of Technological Learning,
Innovation and Development, 2(1), 25-52.
Taglioni, D., & Winkler, D. (2014). DRAFT: Making Global Value Chains Work for
Development. Washington, DC: World Bank.
U.S. BEA. (2013a). 2007 Benchmark Input-Output (I-O) Accounts: Make Tables before
Redefinitions. Retrieved May 9, 2014, from U.S. Department of Commerce, Bureau of
Economic Analysis (BEA) http://www.bea.gov/industry/io_annual.htm
U.S. BEA. (2013b). 2007 Benchmark Input-Output (I-O) Accounts: Use Tables before
Redefinitions: Producer Value. Retrieved May 9, 2014, from U.S. Department of
Commerce, Bureau of Economic Analysis (BEA)
http://www.bea.gov/industry/io_annual.htm
UNCTAD. (2013). World Investment Report 2013: Global Value Chains: Investment and Trade
for Development World Investment Report. Geneva, Switzerland.
UNCTAD, OECD, & WTO. (2013). Implications of Global Value Chains for Trade, Investment,
Development and Jobs Prepared for the G20 Leaders Summit
UNIDO. (2011). Industrial Value Chain Diagnostics: An Integrated Tool. Vienna, Austria:
United Nations Industrial Development Organization (UNIDO).
van Biesebroeck, J., & Sturgeon, T. (2010). Effects of the 2008–09 Crisis on the Automotive
Industry in Developing Countries: A Global Value Chain Perspective. In O. Cattaneo, G.
Gereffi & C. Staritz (Eds.), Global Chains in a Postcrisis World (pp. 209-244).
Washington, DC: World Bank.
WEF. (2012). The Shifting Geography of Global Value Chains: Implications for Developing
Countries and Trade Policy. Geneva, Switzerland: World Economic Forum (WEF),
Global Agenda Council on the Global Trade System.
WTO, & IDE-JETRO. (2011). Trade patterns and global value chains in East Asia: from trade
in goods to trade in tasks. Geneva, Switzerland: World Trade Organization (WTO).