![Research Article A Genetic Algorithm Based Support Vector ...downloads.hindawi.com › journals › bmri › 2015 › 292683.pdfGenetic Algorithms. Genetic algorithms (GA) [ ]are stochastic](https://static.fdocuments.in/doc/165x107/5f0497197e708231d40eb947/research-article-a-genetic-algorithm-based-support-vector-a-journals-a-bmri.jpg)
Combining Support Vector Machine with Genetic Algorithms ... · Combining Support Vector Machine...
10
1 Combining Support Vector Machine with Genetic Algorithms to Optimize Investments in Forex Markets with High Leverage Bernardo Jubert de Almeida Instituto de Telecomunicações Instituto Superior Técnico Lisboa, Portugal Abstract— This work proposes a new approach, based on Evolutionary Computation and Machine Learning algorithms, more precisely, Genetic Algorithms and Support Vector Machine respectively. In the case of financial applications, experiments using genetic evolutionary algorithms have lead to very promising results. In this work, a new algorithm capable of generating technical rules to make investments with a given amount of leverage depending on the certainty of the prediction presented. To forecast those predictions, a combination of a Support Vector Machine algorithm – to identify and classify the market in three different stages –, and a Dynamic Genetic Algorithm – to optimize trading rules, based on several technical indicators – is used. Forex data for the EUR/USD currency pair, in a timeframe between the years of 2003 and 2016, is used as training and test data. The proposed architecture for the machine learning system, as well as the implementation and study of the proposed system is detailed described. The work shows promising results during the test period between the 2 nd of January of 2015 until the 2 nd of March of 2016, where the Return on Investment obtained is 83%. Keywords— Genetic Algorithms; Support Vector Machine; Leverage; Forex; I. INTRODUCTION The Foreign Exchange (FX) Market is a global market for currency trading, it is considered the most liquid financial market in the world. According to the Bank for International Settlements, trading in Forex markets averaged $5.3 trillion per day in April 2013 [1]. One of the great advantages of this kind of markets, compared, for example, with the stock market, is that, they do not require an agreement time, meaning, the investors can trade foreign currencies at current rate almost immediately for major currencies [2]. This financial problematic is a widely studied subject, and constitutes a rather motivating problem to researchers on the Machine Learning field of studies. In this work, more precisely, it is intended to develop an investment strategy, using different Leverage ratios, applied to Foreign Exchange Markets, or more specifically on Forex markets. The work is motivated by the study of techniques within the area of Evolutionary Computation, that are capable of learning past events in order to predict future ones, thus, potentiating the quality and the profits of an investment made by a human. Said that, it is intended to study different approaches using Genetic Algorithms (GA) to optimize investment rules and Support Vector Machine (SVM) to classify the different types of markets. To obtain high returns in this type of markets it is essential to apply a good strategy of leverage. Financial leverage it is a very common tool used in financial markets, and its purpose is to increase the return of an investment, being the losses equally great. Traditional genetic algorithms are good for static problems, i.e., problems that do not change through time and remain in the same environment. Real world problems are constantly changing, making species to adapt, and the ones who adapt faster survive, but, what happens when the environment changes? Is it better to restart the algorithm? This problem can be solve using Dynamic Genetic Algorithms that combine a set of tools to predict and better adapt to new environments, giving new solutions without restarting the whole process. As it was stated before, this work’s main focus is FX markets using a GA to explore the possibilities of financial leverage relying on SVM to market identification on Forex. This paper is composed by five sections. Section 1 – Introduction, Section 2 – Background and State-of-the-Art-, explains some fundamental concepts related to financial markets used, and existing solutions in this field of studies. Following, Section3 – Proposed System Architecture - describes the proposed architecture of the developed system, and the development of the theoretical model used on the matter; Section 4 – System Validation – Evaluates de developed strategy. Finally, Section 5 – Conclusion- summarizes the work done and draws the conclusion. II. BACKGROUND AND STATE-OF-THE-ART This section provides, fundamental concepts about Foreign Exchange Markets, focusing on existing solutions regarding several areas within Machine Learning and Evolutionary Computation. A. Financial Concepts Forex is a largely well known FX Index. Forex has seven major currencies that are traded on a daily basis, and more specifically in this work, the currency traded is EUR/USD. The currencies are called Cross Currency Pairs, being the currency from the left side called the base currency (EUR) or the selling currency and the one from the right side the counter currency (USD) or the buying currency.
Transcript of Combining Support Vector Machine with Genetic Algorithms ... · Combining Support Vector Machine...
1
Combining Support Vector Machine with Genetic Algorithms to Optimize
Investments in Forex Markets with High Leverage
Bernardo Jubert de Almeida Instituto de Telecomunicações
Instituto Superior Técnico Lisboa, Portugal
Abstract— This work proposes a new approach, based on Evolutionary Computation and Machine Learning algorithms, more precisely, Genetic Algorithms and Support Vector Machine respectively. In the case of financial applications, experiments using genetic evolutionary algorithms have lead to very promising results. In this work, a new algorithm capable of generating technical rules to make investments with a given amount of leverage depending on the certainty of the prediction presented. To forecast those predictions, a combination of a Support Vector Machine algorithm – to identify and classify the market in three different stages –, and a Dynamic Genetic Algorithm – to optimize trading rules, based on several technical indicators – is used. Forex data for the EUR/USD currency pair, in a timeframe between the years of 2003 and 2016, is used as training and test data. The proposed architecture for the machine learning system, as well as the implementation and study of the proposed system is detailed described. The work shows promising results during the test period between the 2nd of January of 2015 until the 2nd of March of 2016, where the Return on Investment obtained is 83%.
Keywords— Genetic Algorithms; Support Vector Machine; Leverage; Forex;
I. INTRODUCTION The Foreign Exchange (FX) Market is a global market for currency trading, it is considered the most liquid financial market in the world. According to the Bank for International Settlements, trading in Forex markets averaged $5.3 trillion per day in April 2013 [1]. One of the great advantages of this kind of markets, compared, for example, with the stock market, is that, they do not require an agreement time, meaning, the investors can trade foreign currencies at current rate almost immediately for major currencies [2]. This financial problematic is a widely studied subject, and constitutes a rather motivating problem to researchers on the Machine Learning field of studies. In this work, more precisely, it is intended to develop an investment strategy, using different Leverage ratios, applied to Foreign Exchange Markets, or more specifically on Forex markets. The work is motivated by the study of techniques within the area of Evolutionary Computation, that are capable of learning past events in order to predict future ones, thus, potentiating the quality and the profits of an investment made by a human. Said that, it is intended to study different approaches using Genetic Algorithms (GA) to optimize investment rules and Support Vector Machine (SVM) to classify the different types of markets. To obtain high returns in this type of markets it is
essential to apply a good strategy of leverage. Financial leverage it is a very common tool used in financial markets, and its purpose is to increase the return of an investment, being the losses equally great. Traditional genetic algorithms are good for static problems, i.e., problems that do not change through time and remain in the same environment. Real world problems are constantly changing, making species to adapt, and the ones who adapt faster survive, but, what happens when the environment changes? Is it better to restart the algorithm? This problem can be solve using Dynamic Genetic Algorithms that combine a set of tools to predict and better adapt to new environments, giving new solutions without restarting the whole process. As it was stated before, this work’s main focus is FX markets using a GA to explore the possibilities of financial leverage relying on SVM to market identification on Forex. This paper is composed by five sections. Section 1 – Introduction, Section 2 – Background and State-of-the-Art-, explains some fundamental concepts related to financial markets used, and existing solutions in this field of studies. Following, Section3 – Proposed System Architecture - describes the proposed architecture of the developed system, and the development of the theoretical model used on the matter; Section 4 – System Validation –Evaluates de developed strategy. Finally, Section 5 – Conclusion- summarizes the work done and draws the conclusion.
II. BACKGROUND AND STATE-OF-THE-ART This section provides, fundamental concepts about Foreign Exchange Markets, focusing on existing solutions regarding several areas within Machine Learning and Evolutionary Computation.
A. Financial Concepts Forex is a largely well known FX Index. Forex has seven major currencies that are traded on a daily basis, and more specifically in this work, the currency traded is EUR/USD. The currencies are called Cross Currency Pairs, being the currency from the left side called the base currency (EUR) or the selling currency and the one from the right side the counter currency (USD) or the buying currency.

2
B. Technical Analysis Technical Analysis is the tool required to analyze future prices of financial assets relying on past information based on mathematical transformations of price quotes. There are two main types of technical indicators: • Trend Following - are used to understand trends i.e., they
work better to understand the present trend in order to learn about the asset’s behaviour, trend following indicators identify if the cycle of a trend has begun, or ended;
• Momentum Oscillators - predict sudden changes on the asset’s behavior, meaning that Momentum Oscillators can keep track with the speed of the price movement variation and are able to measure the strength and speed of the price trend direction.
C. Concept of Leverage Leverage is used to profit from fluctuations in exchange rates between two different currencies. Leverage is a loan that is provided to the investor by a broker, i.e., companies that are specialized in financial trading lend money to the investors to increase their investment. Take a small investment of 1,000 euros, if the leverage applied is 100:1, then the investment made is 100,000 euros. The amounts of leverage, that brokers are allowed to provide are 50:1 and 10:1, although the first ratio is extremely risky to apply. This can result on two possible outcomes, the first is, if the investment goes well and the profit is for example 3%, equivalent to 3,000 euros, the trader made an investment of 1,000 euros and took profits that could only be achieved with leverage. Without leverage, the profits would be 30 euros. The second outcome is more pessimistic, due to the fact that using leverage comes with a greater risk and can turn against investors, i.e., if the investment made was the same 100,000 euros, and looses the same 3%, the trader has to pay to the broker 3,000 euros. To overcome this kind of risks brokers, have “Stop Limits” to avoid this type of actions to occur. Fluctuations in Forex usually do not cross over 1% during intraday trading, permitting brokers to provide this much leverage.
D. Approaches on Forex – Overview Works on Foreign Exchange, showed some promising results, using different approaches in Evolutionary Computation (EC), and many different strategies were used to support the optimization algorithms. In this section, different approaches are divided by EC strategies and Machine Learning algorithms, starting with Neural Networks (NN), GAs, then SVM. Regarding wider approach that were not based only on GA and SVMs, Yao and Tan [3], reported empirical evidence that a NN model is applicable to the prediction of foreign exchange rates, using time series and different technical indicators to capture the underlying “rules” of the movement in currency exchange rates. Evans et al., [4] focused on predicting intra-day market exchanges, and their research focused on a hybrid solution between NN and GA. Deng and Sakurai [5] applied a genetic algorithm to generate trading rules based on a single technical indicator (RSI), and multiple timeframes. Hirabayashi et al. [2],
proposed to automatically generate trading rules based on technical indicators, focusing on calculating the most appropriate trade timing, instead of predicting trading prices. Myszkowski and Bicz [6] approached the Forex market with two decision trees, that are responsible for taking the decisions of opening long or short positions on EUR/USD currency pair. Sermpinis et al. [7], introduced a hybrid Rolling Genetic Algorithm-Support Vector Regression(RG-SVR) model to find optimal parameter solution. RG-SVR method genetically searches over a feature space and combines the optimal feature subsets for each exchange rate. Additionally, this work implements a GA-SVM and a GA-SVR hybrid systems that are evaluated alongside the RG-SVR approach. Besides the referred works on Forex it is also important to underline some static problems about GA works that were made in the financial problematic. Starting with the Evaluation Function or Fitness Function, e.g., Gorgulho et al. [8], uses the technical indicator Return on Investment (ROI) to evaluate each individual within the population. Other interesting method proposed by Aranha & Iba [9] was a multi-objective approach that was composed by two functions, a cumulative return and Sharpe ratio. Férnandez-Blanco et al. [10] uses a dynamic method, relying on the premise that the fitness landscape may change over time, thus applying different indicators in different time periods. As for the genetic operators, Hirabayashi et al [2] and Yuan used Tournament Selection Method as a selection operator. Evans et al. [4], and Mendes et al [11], relied on the Roulette Selection Method, to find the probability of a certain individual being selected, depending on the individual’s fitness compared to the fitness values of the population. Many researchers have implemented different strategies to maintain diversity in a population. The first method shows the implementation of mutation operators with a certain mutation rate, e.g., Zhang and Ren [12], Hirabayashi et al. [2] and Gorgulho et al., [13]. Fernández - Blanco et al. [10] used a different approach to maintain diversity that relies on a small set of individuals that are randomly generated every generation, called “Immigrants”, choosing this approach to get the trade off between fast computation and diversity. There are, also, several ways to perform crossover, e.g., Gorgulho et al. [14] compared three different methods, Single Arithmetic Recombination, Whole Arithmetic Recombination and One-Cut Point, concluding that the best results were from the One-Cut Point solution, in order to generate two distinct offspring. Hirabayashi et al. [2] used a Two-Cut Point technique to perform the crossover. To address non-stationary problems, it is necessary to implement Dynamic Genetic Algorithms, thus is important to develop dynamic problem generators to create dynamic test environments [15]. Yang [16] and Yang & Yao [15] developed a XOR DOP Generator that can create DOP’s and detect changes in the environment through the XOR operator, shifting the population of an algorithm to a new location in the fitness landscape [17]; Contrarily to stationary problems, that only need few performance measures, e.g., convergence speed and success rate of reaching optimality [17], DOPs have over 20 measures that were studied by Nguyen et al. [18], thus dividing
3
it in two types of measures: Optimality-based performance measures and Behavior-Based performance measures. Branke [19] implemented a direct memory approach, to store the good solutions throughout time, and examined in what circumstances memory was useful. Yang and Yao [20] investigated associative memory to store the best solutions as well as environment information to improve the algorithms adaptability to the environment. Park et al. [21] implemented an algorithm with two populations to provide additional diversity to the main population through crossbreeding. Yang [22] developed a Memory-Based Immigrants approach, to maintain the diversity and guide immigrants towards the new environment, using memory scheme to adapt the GA faster to the new search space by reusing past information. Cobb & Grenfenstette [23] proposed the hyper-mutation method to raise the mutation rate temporarily, in order to improve adaptive performance to the GA; Yang & Tinos [24] developed the hyper-selection method that aimed to raise the selection pressure temporarily to improve the quality of individuals. Simões & Costa [25] introduced a predictive model based on linear regressions and a Markov model that memorizes past information of when the changes in the environment occurred, to estimate when the next change will occur. Table 1 summarizes the most relevant approaches that were studied to develop this work.
III. PROPOSED SYSTEM ARCHITECTURE The proposed solution intends to develop an algorithm to
trade FX currency pairs, using an SVM to categorize the type of market and a GA to optimize the investment solution in order to trade with several levels of leverage. This section describes the system’s architecture, more precisely the different layers of the system application and the way they were implemented.
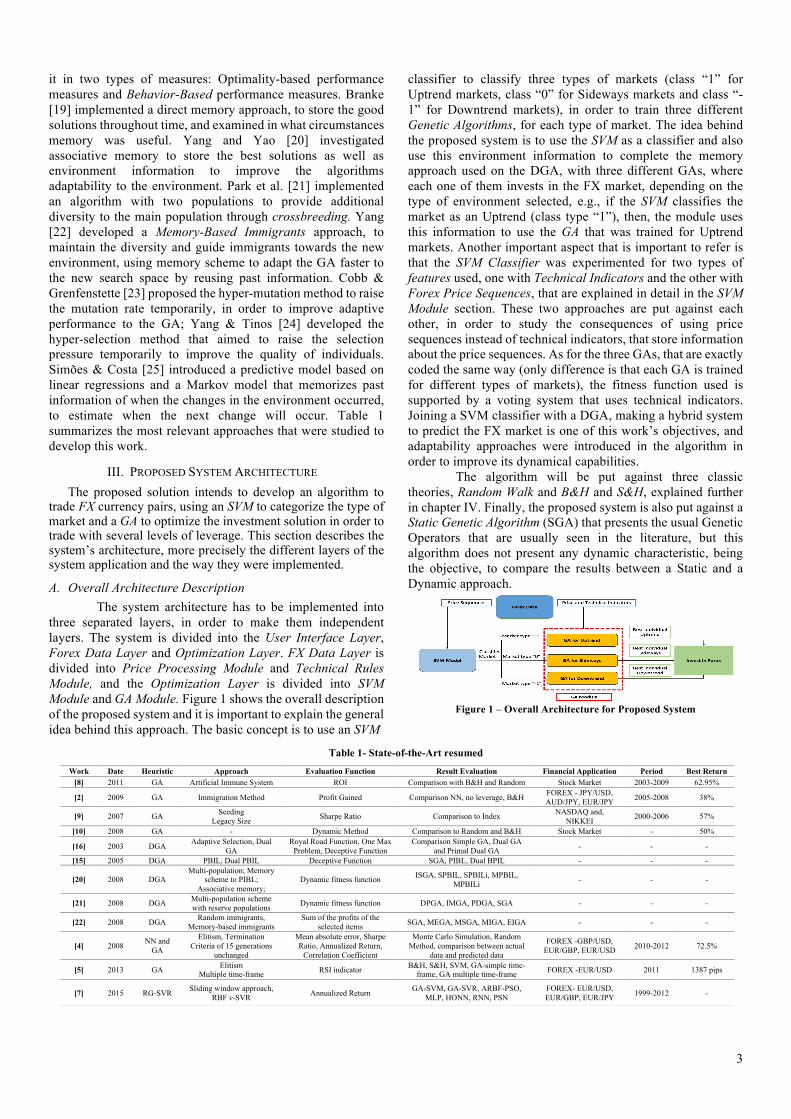
A. Overall Architecture Description The system architecture has to be implemented into three separated layers, in order to make them independent layers. The system is divided into the User Interface Layer, Forex Data Layer and Optimization Layer. FX Data Layer is divided into Price Processing Module and Technical Rules Module, and the Optimization Layer is divided into SVM Module and GA Module. Figure 1 shows the overall description of the proposed system and it is important to explain the general idea behind this approach. The basic concept is to use an SVM
classifier to classify three types of markets (class “1” for Uptrend markets, class “0” for Sideways markets and class “-1” for Downtrend markets), in order to train three different Genetic Algorithms, for each type of market. The idea behind the proposed system is to use the SVM as a classifier and also use this environment information to complete the memory approach used on the DGA, with three different GAs, where each one of them invests in the FX market, depending on the type of environment selected, e.g., if the SVM classifies the market as an Uptrend (class type “1”), then, the module uses this information to use the GA that was trained for Uptrend markets. Another important aspect that is important to refer is that the SVM Classifier was experimented for two types of features used, one with Technical Indicators and the other with Forex Price Sequences, that are explained in detail in the SVM Module section. These two approaches are put against each other, in order to study the consequences of using price sequences instead of technical indicators, that store information about the price sequences. As for the three GAs, that are exactly coded the same way (only difference is that each GA is trained for different types of markets), the fitness function used is supported by a voting system that uses technical indicators. Joining a SVM classifier with a DGA, making a hybrid system to predict the FX market is one of this work’s objectives, and adaptability approaches were introduced in the algorithm in order to improve its dynamical capabilities. The algorithm will be put against three classic theories, Random Walk and B&H and S&H, explained further in chapter IV. Finally, the proposed system is also put against a Static Genetic Algorithm (SGA) that presents the usual Genetic Operators that are usually seen in the literature, but this algorithm does not present any dynamic characteristic, being the objective, to compare the results between a Static and a Dynamic approach.
Figure 1 – Overall Architecture for Proposed System
Work Date Heuristic Approach Evaluation Function Result Evaluation Financial Application Period Best Return [8] 2011 GA Artificial Immune System ROI Comparison with B&H and Random Stock Market 2003-2009 62.95%
[2] 2009 GA Immigration Method Profit Gained Comparison NN, no leverage, B&H FOREX - JPY/USD, AUD/JPY, EUR/JPY 2005-2008 38%
[9] 2007 GA Seeding Legacy Size Sharpe Ratio Comparison to Index NASDAQ and,
NIKKEI 2000-2006 57%
[10] 2008 GA - Dynamic Method Comparison to Random and B&H Stock Market - 50%
[16] 2003 DGA Adaptive Selection, Dual GA
Royal Road Function, One Max Problem, Deceptive Function
Comparison Simple GA, Dual GA and Primal Dual GA - - -
[15] 2005 DGA PBIL, Dual PBIL Deceptive Function SGA, PIBL, Dual BPIL - - -
[20] 2008 DGA Multi-population; Memory
scheme to PIBL; Associative memory;
Dynamic fitness function ISGA, SPBIL, SPBILi, MPBIL, MPBILi - - -
[21] 2008 DGA Multi-population scheme with reserve populations Dynamic fitness function DPGA, IMGA, PDGA, SGA - - -
[22] 2008 DGA Random immigrants, Memory-based immigrants
Sum of the profits of the selected items SGA, MEGA, MSGA, MIGA, EIGA - - -
[4] 2008 NN and GA
Elitism, Termination Criteria of 15 generations
unchanged
Mean absolute error, Sharpe Ratio, Annualized Return,
Correlation Coefficient
Monte Carlo Simulation, Random Method, comparison between actual
data and predicted data
FOREX -GBP/USD, EUR/GBP, EUR/USD 2010-2012 72.5%
[5] 2013 GA Elitism Multiple time-frame RSI indicator B&H, S&H, SVM, GA-simple time-
frame, GA multiple time-frame FOREX -EUR/USD 2011 1387 pips
[7] 2015 RG-SVR Sliding window approach, RBF v-SVR Annualized Return GA-SVM, GA-SVR, ARBF-PSO,
MLP, HONN, RNN, PSN FOREX- EUR/USD, EUR/GBP, EUR/JPY 1999-2012 -
Table 1- State-of-the-Art resumed

4
B. User Interface Layer This layer is the upper layer and provides the program interface for the user. The Python IDE used is Spyder [26] to develop the necessary features to make it possible to implement a graphical interface. The interface has input data, where the user chooses the GA parameters, i.e., how many technical indicators and which ones wants to insert in the GA. The interface returns the output data where it is included which strategy, technical indicators and technical rule will be applied, and the best level of leverage to be used.
C. Forex Data Layer 1) Price Processing Module
The simulations use EUR/USD data since the year 2003 until 2016. This layer is also responsible to calculate each technical indicator, to create the input to insert in the GA. Since the GA needs past information to make predictions about the future, it is only natural to conclude that the more information it retrieves the better. To provision the database (DB), the software relied on a python library called Pandas [27], in order to improve the robustness of data and to reduce the access time when a request to the DB was made. Pandas library was designed to be faster and more organized as a DB when compared to simple array structures. The Technical Indicators were calculated through a Python library called ta-lib [28], making it possible to only calculate them once. The technical indicators used in this work and its parameters are shown in table 2.
2) Technical Rules Module There is no better indicator, only a good combination of them will return a good decision rule. The technical rule applied is a voting system where a combined set of technical indicators voted, depending on specific rules that are shown in table 3.
Table 2 - Parameter intervals used for each technical indicator
Table 3 - Decision Rules used for voting system
D. Optimization Layer As it was said before, this layer is decomposed into two different modules. The first one, is the SVM module, its objective is to identify different market strategies, i.e., the SVM algorithm classifies the currency pair historical data in three groups, Bullish Market, Bearish Market, and. This way, the GA trains its populations to specific types of markets, depending on the trend. This feature is expected to return a better performance to the GA and increase its success rates.
1) Support Vector Machine Module This module is composed by several components, and the first step is to describe the features used in the SVM algorithm. The project relied on scikit learn framework in order to assure reliability in terms of computation and stability, being that the focus of this work is not the implementation of an SVM itself. Although the SVM classifier is the same, there were two possible approaches to choose the type of features used. The first one was the use of technical indicators as features and the second one was the use of price sequences, in order to classify the type of market. In the first case the features used were the six technical indicators calculated in the FX Data Layer, in the second case, sequences of 100 prices were used and each one of the prices worked has a feature of the SVM. Table 4 shows an example of the two types of features used in each scenario.
Table 4 - Features used for the SVM Model
The SVM algorithm takes an X array of size n_samples and n_features like: X= [n_samples, n_features] of training samples and a Y array of class labels of size n_samples like: Y=[n_samples]. In this work’s scenario the labels correspond to the market types, where a bullish market represents a “1”, a sideways market represents a “0” and a bearish market represents a “-1”. The classification of the market is then calculated using all the classifications of the predictions, i.e., The classifier predicted 100 price sequences in a sliding window, returning 100 samples that were classified as “0”, “1” or “-1”. The calculations are made with a Weighted Moving Average (WMA), that analyze the average along a certain period, making the decision of which type of market is based on the result of the WMA. If the result of the WMA is bigger than 0.5, the market is Bullish, if the WMA is lower than -0.5 the market is Bearish, otherwise is Sideways. Moreover, the WMA computes an average where the last prices have more importance, i.e., weight that influences the moving average. The X and Y are then divided into X_train and Y_train for the training set and X_test and Y_test for the test set. First, let’s focus on the training set, where the SVM “learns” from the data in order to classify the market in the test set. To optimize the performance of the SVM training model it is necessary to tune its hyper-parameters, a Grid Search algorithm was implemented to choose the best parameters for the SVM classifier, where an exhaustive search of combinations was made through a specified subset of the hyper-parameter space. The SVM takes three hyper-parameters, where C parameter controls the cost of misclassification on the training data, and it can influence the variance of the solution (large C value makes the cost of misclassification high, hard margin and low C value makes the cost of misclassification low, soft margin). Gamma is the RBF kernel parameter that handles non-linear classification, i.e., it influences the trade-off between the size of the street (from the SVM’s “Widest Street Approach) and the margin for misclassification of a label. The hyper-parameter values used in this work are shown in table 5.
5
Table 5 - Hyper- parameters of the SVM Model
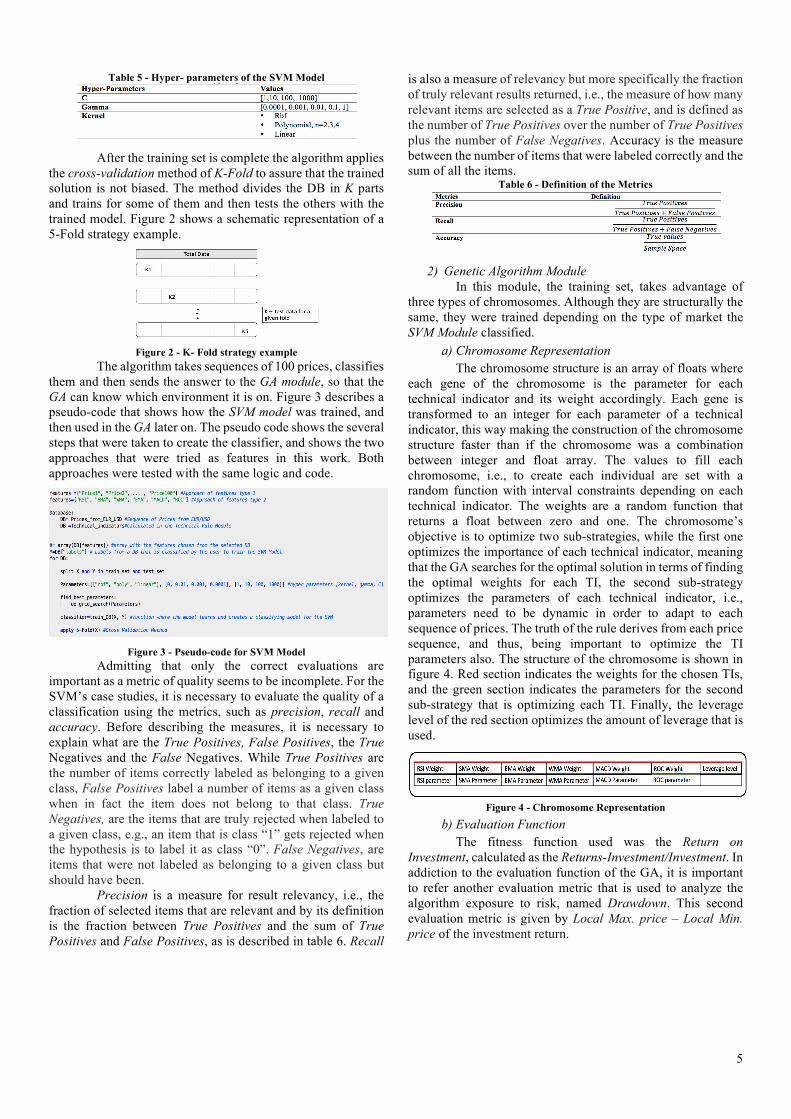
After the training set is complete the algorithm applies the cross-validation method of K-Fold to assure that the trained solution is not biased. The method divides the DB in K parts and trains for some of them and then tests the others with the trained model. Figure 2 shows a schematic representation of a 5-Fold strategy example.
Figure 2 - K- Fold strategy example
The algorithm takes sequences of 100 prices, classifies them and then sends the answer to the GA module, so that the GA can know which environment it is on. Figure 3 describes a pseudo-code that shows how the SVM model was trained, and then used in the GA later on. The pseudo code shows the several steps that were taken to create the classifier, and shows the two approaches that were tried as features in this work. Both approaches were tested with the same logic and code.
Figure 3 - Pseudo-code for SVM Model
Admitting that only the correct evaluations are important as a metric of quality seems to be incomplete. For the SVM’s case studies, it is necessary to evaluate the quality of a classification using the metrics, such as precision, recall and accuracy. Before describing the measures, it is necessary to explain what are the True Positives, False Positives, the True Negatives and the False Negatives. While True Positives are the number of items correctly labeled as belonging to a given class, False Positives label a number of items as a given class when in fact the item does not belong to that class. True Negatives, are the items that are truly rejected when labeled to a given class, e.g., an item that is class “1” gets rejected when the hypothesis is to label it as class “0”. False Negatives, are items that were not labeled as belonging to a given class but should have been. Precision is a measure for result relevancy, i.e., the fraction of selected items that are relevant and by its definition is the fraction between True Positives and the sum of True Positives and False Positives, as is described in table 6. Recall
is also a measure of relevancy but more specifically the fraction of truly relevant results returned, i.e., the measure of how many relevant items are selected as a True Positive, and is defined as the number of True Positives over the number of True Positives plus the number of False Negatives. Accuracy is the measure between the number of items that were labeled correctly and the sum of all the items.
Table 6 - Definition of the Metrics
2) Genetic Algorithm Module
In this module, the training set, takes advantage of three types of chromosomes. Although they are structurally the same, they were trained depending on the type of market the SVM Module classified.
a) Chromosome Representation The chromosome structure is an array of floats where each gene of the chromosome is the parameter for each technical indicator and its weight accordingly. Each gene is transformed to an integer for each parameter of a technical indicator, this way making the construction of the chromosome structure faster than if the chromosome was a combination between integer and float array. The values to fill each chromosome, i.e., to create each individual are set with a random function with interval constraints depending on each technical indicator. The weights are a random function that returns a float between zero and one. The chromosome’s objective is to optimize two sub-strategies, while the first one optimizes the importance of each technical indicator, meaning that the GA searches for the optimal solution in terms of finding the optimal weights for each TI, the second sub-strategy optimizes the parameters of each technical indicator, i.e., parameters need to be dynamic in order to adapt to each sequence of prices. The truth of the rule derives from each price sequence, and thus, being important to optimize the TI parameters also. The structure of the chromosome is shown in figure 4. Red section indicates the weights for the chosen TIs, and the green section indicates the parameters for the second sub-strategy that is optimizing each TI. Finally, the leverage level of the red section optimizes the amount of leverage that is used.
Figure 4 - Chromosome Representation
b) Evaluation Function The fitness function used was the Return on Investment, calculated as the Returns-Investment/Investment. In addiction to the evaluation function of the GA, it is important to refer another evaluation metric that is used to analyze the algorithm exposure to risk, named Drawdown. This second evaluation metric is given by Local Max. price – Local Min. price of the investment return.

6
The Genetic Algorithm function is single objective and tracks to maximize the approaches chosen above. To calculate both objectives, the fitness function relied on the Technical Rules Module to make the decisions according to the TI. The trading rule decides on a voting system, of whom ever won by majority would perform the trade, i.e. if the TIs voted for “Buying” Rule with a K % majority over the “Selling” Rule, then the GA would perform a “Buying” rule instead of a “Selling” rule, and vice-versa. If a majority was not reached, then the GA entered the “Do nothing Rule” and waited until the next entering point. The following equations show, how the voting takes place, being K the parameter that defines the majority thresh hold.
𝑉𝑜𝑡𝑒𝑟𝐵𝑢𝑦 = 𝑤,-./-0 I (1)
𝑉𝑜𝑡𝑒𝑟𝑆𝑒𝑙𝑙 = 𝑤,-./-0 I (2)
𝑉𝑜𝑡𝑒𝑟𝐵𝑢𝑦 > 𝐾 ∗ 𝑉𝑜𝑡𝑒𝑟𝑆𝑒𝑙𝑙 (3) 𝑉𝑜𝑡𝑒𝑟𝑆𝑒𝑙𝑙 > 𝐾 ∗ 𝑉𝑜𝑡𝑒𝑟𝐵𝑢𝑦 (4)
After the voting system takes part, the investment module inside the evaluation function opens a “Long” or “Short” position depending on the voting, if there is no “Opened” position, then the voting system decides to enter the market if the voting rules a buying or selling position. If the voting rules a sideways then it does not enter the market. When there is an “opened” position, then the position maintains opened until the voting system rules otherwise, i.e., if the position is long, then it stays long until the voting system rules a sideways or a short position.
c) Selection The selection method chosen was the Tournament Selection method to define which individuals were to be selected for the next generation. The tournament selection method involves running several tournaments between individuals among the population, and the winner of each tournament is selected to perform crossover. The bigger the tournament size the less chances a weaker individual has to perform crossover. Initially the tournament size was set to 3 and selection probability is 0.5. Only when the hyper-selection [24] was activated that the tournament size was set to 5 to increase the selection pressure in a population. Hyper-selection was chosen to be applied in this work, because some periods of the FX market can be more difficult than others because of an ill-defined market tendency, thus, making ROI harder to increase its value. Said that, the selection pressure is increased temporarily to decrease the probability of weaker individuals to perform Crossover. This can lead to an over fitting, so it is important to keep in mind that the Hyper-Selection should only be temporarily.
d) Crossover The method that was most suitable to solve this problem were the Two-Cut-Point crossover, where two chromosomes exchange two genes between themselves. This algorithm was chosen over the One-Cut-Point because the Two-Cut-Point, slowed the early convergence and thus avoiding faster over fitting in the final solution. This crossover method consists on picking two random points of the parent chromosomes, then, the genes between the two points, and the ones outside the two points are swapped, originating offsprings.
e) Mutation Individuals may go through mutation in the end of each generation and in this work the mutation that one individual performs is derived from a Gaussian Distribution, although its limits are imposed by the gene mutated must be higher than zero to be considered valid. The mean and standard deviation values are linked to the parameter of each gene. Being the mean the parameter and standard deviation 10 % of the parameter value. Mutation is a random process that depends on the mutation rate and on the probability of each individual to get a mutation. Also in these studies, one introduced Hyper-Mutation [23], and according to changes in the environment the mutation parameter will go up temporarily in order to increase the diversity in a given population.
f) SVM and Dynamic Genetic Algorithm Together Like stated above, this is one of the key issues for this work, where it is implemented a memory system, relying on a SVM classifier to identify which type of market and then store the information along side an individual that was specifically trained for that situation. This memory system works as an Associative Memory for the Dynamic Problem of the GA. The goal is to train three different populations for the three types of markets, and then used them during the investment sessions, taking advantage of knowing the type of market they are in, i.e. knowing the environment can increase the performance of each population, and the memory approach proved to be efficient, thus, it is not needed to have a new population every time the environment changes. This solution provides three approaches to solve Dynamic Problems in the GA, which are: • Associative Memory – The SVM provides the information
of the markets(environment) that is saved along side the best individuals of each population, providing a solution where the GA uses this information to adapt to each market according to the continuous change of FX price sequences.
• Hyper-Mutation – This method provides a temporarily raise up of the mutation rate, in order to introduce more diversity in the GA, to avoid local maximums. This method makes the GA more adaptable to find new optimal solutions instead of being stuck in a solution that may have been good for a given price sequence, but has gotten worse every time that price sequence is updated.
• Hype-Selection – This third approach also provides a temporarily condition to the GA but this time is to increase the selection pressure, where the quality of the solution is obligated to increase. This approach is very helpful in the way that it makes possible to increase the quality of the solution without becoming over fitted because it is only a temporarily solution.
g) Implementing Leverage Leverage is explained in section 2.3 and to mitigate the risk exposure, one made the decision to limit the leverage multiplier to a maximum value of 10. This financial tool was applied as the following procedure: • If the trading rule and the SVM classifier are combined, i.e.,
if the trading rule votes a “Buying Rule” and the SVM classifies the market as Bullish, or if the trading rule votes

7
a “Selling Rule” and the SVM classifies the market as Bearish, then leverage is activated; The second step to activate leverage is defined by the Moving Average of the “High” values combined with the Moving Average of the “Low” values, of each closing price e.g. If the Moving Average of the “High” and “Low” values cross the respective “High” and “Low” values to an uptrend when the trading rule votes a “Buying Rule”, or to a downtrend when the trading rule votes “Selling Rule”, then leverage is applied. To better understand the idea, figure 5 shows a chart with entry points where leverage is activated;
• The amount of leverage used, is part of the chromosome structure and when the leverage is activated the amount of leverage goes between 2 and 10;
Figure 5 - Entry Points where Leverage is activated
IV. SYSTEM VALIDATION In this section, it is presented the system validation, where a case study is presented with the results obtained from the experiences of developing a hybrid system with a SVM and a GA. The Backtesting approach is based on a Sliding Window for training and test sets between 2003 and 1st of January of 2015, and then a real test where the approach had never seen the data before between 2nd of January of 2015, until 2nd of March of 2016. Table 7 shows the case study configuration.
Table 7 - Case study configuration
A. Case study – Description In order to include the most possible data for different types of trends in this work, the EUR/USD Forex market was set between 1st of January of 2003 and 1st of January of 2015. This approach is compared against Random Walk, B&H, S&H, and a Static GA approach. • Buy & Hold / Sell & Hold – This two classical approaches
take the believe that the market always takes a trend and it is not possible to predict market fluctuations relying on past data, so, whether the market is bullish or bearish, traders takes the position and holds until he changes his opinion.
• Random Walk – This theory relies on the fact that the market is random, and thus, making random investments as a consequence. This approach decides in totally a random way, if it takes a short or long position and if a position is opened or closed.
Moreover, the Proposed System is compared with the work done by Hirabayashi et al. [2], due to the fact that it is based on Forex Market, although this work is based on Japanese Yen(JPY) against USD and EUR, thus making the behavior of this specific market different from the EUR/USD, it is an important benchmark to compare the behavior of the returns and in the implementation of leverage. Also, the Proposed System is compared with the work done by Sermpinis et al. [7], in terms of Drawdown, since there are no charts showing the evolution of ROI. For both works, actual results on ROI are not reasonable to compare, because the Testing Period is different, and the market is not always the same. Finally, real life transactions are a bit more difficult to calculate in this work, because each broker decides its own cost transaction. The transaction costs are usually low comparing to other types of markets, thus the results do not diverge considerably when applying an average transaction cost of 0.02% of the transaction made.
B. Parameters Setup The parameters are divided between the two modules, the SVM and the GA. In this approach it is allowed to perform long and short selling, including leverage, and also, this approach takes advantage of technical analysis only. As for SVM module, the configuration parameters for the SVM classifier are shown in table 8. The SVM parameters were selected out of 50 experiments set, where these, were the values that presented the best average performance.
Table 8 - Best parameter configuration for the SVM Model
The results obtained for the parameters, regarding the choice of the kernel used and its hyper-parameters, show that the solution does not indicate over fitting in the SVM model, because the C and Gamma obtained are not to “optimized”, i.e., in the C interval of [1, 10, 100, 1000], the value obtained is not too high, as for the Gamma interval of [0.1, 0.01, 0.001, 0.0001] the value 0.001, although is a bit closer to the limit is still a reliable value to use. When comparing this solution against a Linear kernel that has C parameter equal to 1000, this solution for parameter setup is the most appropriate to design the SVM model. As for the GA configuration, table 9 shows the different methods applied in this process, as well as, the value parameters for the proposed methods. A sliding window approach was used to perform training and test sets. The stopping criteria used in this work is inspired on Hirabayashi approach [2], where the generations increased limitless as long as the GA finds a better solution after each generation. If there is no better solution at the end of 30 generations then the GA stopped there.
Table 9 - Configuration of the GA

8
C. Case Study – Performance Analysis 1) SVM Model
The SVM algorithm was trained 50 runs, and the data used to “teach” the model, goes from 2003 until 2015 with the sliding window approach in order to maximize the solution as much as possible. The experiment collected 4000 samples to train the SVM model. To use more than 4000 samples would require more computational power, and the results would not present a considerable growth. Table 10 and table 11, describe the results obtained by the SVM classification metrics used in this paper, where the two approaches were experimented. The Price Sequence approach returned better results when compared to the Technical Indicator approach, it is possible to see that the Price Sequence approach can classify the three types of markets with better results on Precision, Recall and Accuracy, showing that this method is more reliable to use, further on, in the Proposed System. Although the solution shows a good performance, results indicate that label “0”, i.e., the label that classifies sideways markets, it is worse than the others. A reason for this to happen, is that this label is more difficult to classify than the up or down trends, even for the human eye, because it has a bigger degree of subjectivity. Nonetheless, it is possible to see that from the metric’s results, it is clearly that the SVM model can predict successfully the type of markets that are sent to the GA, showing promising results for the algorithm proposed in this work. Table 10 and table 11 describe, for the price sequence and technical indicator approach, the average score of the metrics for each label, “1”, “0”, “-1”, respectively, and the avg. score refers to the average result of the three labels together. Table 10 - Results obtained for the SVM classification of the labels from
the Price Sequence approach
Table 11 - Results obtained for the SVM classification of the labels from
the Technical Indicator approach
2) Proposed approach analysis
The proposed solution, illustrated on figure 6, exhibits a better ROI, compared to the approaches described in section 4.1. The proposed system outperforms the other strategies, although this solution is still a bit heavy on computation, and only breaks the other approaches in the end, duo to its steady growth, it rarely looses positions with considerable losses. As it is possible to observe, the S&H and the SGA approaches reach higher returns at certain points, but they are very volatile, and the objective is to get a steady growth throughout time. The histogram of the ROI described in figure 7, shows that for the proposed approach, 12% of the runs obtained
negative values, 36% were values near zero or results that are somewhat similar to the other approaches, but still, for 76% of runs, the proposed system outperforms the other approaches, giving a high confidence for the proposed strategy. Applying the Random Walk approach is clearly worse in every run, compared to the rest of the approaches, this method shows that in 90% of times, the results were negative. For the B&H and the S&H the results clearly depended on the type of market they were in. For B&H, 100% of the runs, the results were below the proposed solution, and in S&H, 88% of the runs were also below the proposed solution. Moreover, the proposed solution is also put against a SGA, memoryless, without hyper-mutation, and hyper-selection features. The results confirm the assumptions made for this work, where it is possible to conclude that dynamic approaches enhance the performance of the GA, especially the proposed approach of introducing the SVM module in the algorithm, making it as said before more stable and less exposed to great losses. In figure 7, it is possible to see that the proposed solution outperforms the SGA in 66% of the runs.
Figure 6 - Returns with leverage obtained during test period for the
different approaches Regarding the leverage used in this approach, the proposed solution applies leverage in every run, but it is important to say that the level of leverage is chosen by the GA, also, it is possible to conclude that the amount of leverage used by the GA is a good approach, when compared with a fixed level of leverage used by the SGA, where the number of times that the SGA, and Random apply leverage correctly is only 16%, 2%, respectively. Table 12 presents a more detailed statistical analysis of the average results over the 50 runs. Although the work developed by Sermpinis et al. [7] does not show a ROI evolution in a chart, the results provided, regarding Drawdown are of great importance. Table 12 shows that the Best Proposed System has a Max. Drawdown of 14%, and the results obtained for the EUR/USD in the Sermpinis work show very similar results, of 13.63 for the GA-SVM approach, 14.81 for GA-SVR approach and 14.38 for RG-SVR approach. Although the Test Period is not the same, the results obtained by Sermpinis et al. indicate that the Drawdown obtained for the Best Proposed System is a successful result. It is also important to demonstrate that the proposed solution outperforms the other without leverage. Figure 6 indicates that the leverage imposed by the GA chromosome, used in the Proposed System, does not increase the risk when compared with the proposed solution that, does not implement leverage in figure 8, showing the Proposed System does not make considerable mistakes when inserting leverage. Figure 9

9
shows the Best Proposed System, marked with the leverage levels used in the more relevant variations of ROI. As it was stated before, the Proposed System, does not make considerable mistakes when applying leverage, the levels marked in figure 9 indicate that, major variations show leverage levels capable of increasing the ROI and at the same time, avoiding solutions presenting great losses, meaning that the Proposed System is not exposed to great levels of risk. When compared the Best Proposed System with the leverage approach made by Hirabayashi et al. [2], it is possible to see that the Best Proposed System shows a steadier behavior and less risk exposure when trading EUR/USD. Regarding the non-leverage approach, the Proposed System shows higher risk exposure, due to the fact that it is more volatile, when compared with Hirabayashi et al. [2]. Again, these cannot be direct comparisons since the work made by Hirabayashi et al. [2] does not focus on the EUR/USD market and the Test Period is different, nonetheless, the work made by Hirabayashi et al. [2] is a good benchmark to prove that the Proposed System provides promising results. Both the works that were compared with the Proposed System proved that is possible to use Evolutionary Computation in the FX market. Finally, the solutions show that the different approaches might loose more money than the initial investment. This situation can be explained by the fact that the representation is only mathematical, and due to leverage it is possible to loose more money than the initial investment, as shown in “Concept of Leverage” (Section 2.3).
Figure 7 - Histogram with the ROI for the 50 executions
Figure 8 - Returns without leverage obtained during test period for the
different approaches
Table 12 - Comparison between the proposed system and the benchmark approaches
Figure 9 - Returns with leverage marks obtained during Best Proposed
System
V. CONCLUSIONS This work proposes a viable solution to automatically invest in Forex Markets, using technical indicators and price sequences to predict entry and exit points. Although, it is highly recommended to use hardware that has good performance measures, so that is possible for the algorithm to work in real time. This is recommended because, the more information about the FX market, the bigger the populations and the more price sequences the SVM is provided to perfect the training module, the better the solution is. Also, by studying the SVM approach, it is possible to conclude by the results, that the sideways market is more difficult to describe than the others as it was seen in the previous section, where the label “0” showed poorer quality in the classification. As it was possible to see, the GA showed good adaptive response, and a good trade-off between diversity and quality of a given population. It is also true to conclude that the memory approach improved the performance of the GA, and thus, being very important so that the algorithm could adapt to different environments during the evolution of the price sequences. For future works, it is important to keep in mind that, although the Evolutionary Computation plays a fundamental role to provide the best solutions, the investment rules used to entry or exit the market can be perfected with more elegant rules and strategies that are used by professional traders.
REFERENCES [1] S. Cirillo, S. Lloyd, and P. Nordin, "Evolving Intraday Foreign Exchange Trading Strategies Utilizing Multiple Instruments Price Series," CoRR, Nov. 2014 [2] A. Hirabayashi, C. Aranha, and H. Iba, "Optimization of the Trading Rule in Foreign Exchange using Genetic Algorithm," in Proceedings of the 11th Annual Conference on Genetic and Evolutionary Computation (GECCO ’09), Montreal, Canada, New York, USA: ACM, 2009, pp. 1529–1536. [3] J. Yao and C. L. Tan, "A Case Study on Using Neural Networks to Perform Technical Forecasting of Forex," Neurocomputing, vol. 34, no.1–4, pp. 79–98, Sep. 2000. [4] C. Evans, K. Pappas, and F. Xhafa, "Utilizing Artificial Neural Networks and Genetic Algorithms to Build an Algo-trading Model for Intraday Foreign Exchange

10
Speculation," Mathematical and Computer Modelling, vol. 58, no.5–6, pp. 1249–1266, Jan. 2014. [5] S. Deng and S. Akito, "Foreign Exchange Trading Rules Using a Single Technical Indicator From Multiple Timeframes," Advanced Information Networking and Applications Workshops (WAINA),2013 27th International Conference on: IEEE, 2013, pp. 207–212. [6] M. P.B and B. Adam, "Evolutionary Algorithm in Forex Trade Strategy Generation," in Computer Science and Information Technology (IMCSIT), Proceedings of the 2010 International Multiconference on IEEE, 2010, pp. 81–88. [7] G. Sermpinis, C. Stasinakis, K. Theofilatos, and A. Karathanasopoulos, "Modeling, Forecasting and Trading the EUR Exchange Rates with Hybrid Rolling Genetic Algorithms - Support Vector Regression Forecast Combinations, European Journal of Operational Research, vol. 247, no. 3, pp. 831–846, Dec. 2015. [8] A. Gorgulho, R. Neves, and N. Horta, "Applying a GA Kernel on Optimizing Technical Analysis Rules for Stock Picking and Portfolio Composition," Expert Systems with Applications, vol. 38, no. 11, pp. 14072–14085, 2011. [9] A. C and I. H, "Modelling Cost into a Genetic Algorithm-based Portfolio Optimization System by Seeding and Objective Sharing," in Evolutionary Computation, 2007. CEC 2007. IEEE Congress on, IEEE, 2007, pp. 196–203. [10] P. Fernández-Blanco, D. J. Bodas-Sagi, F. J. Soltero, and J. I. Hidalgo, "Technical Market Indicators Optimization Using Evolutionary Algorithms," in Proceedings of the 10th Annual Conference Companion on Genetic and Evolutionary Computation (GECCO ’08), Atlanta, USA, New York, USA: ACM, 2008, pp. 1851–1858. [11] L. Mendes, P. Godinho, and J. Dias, "A Forex Trading System Based on a Genetic Algorithm," Journal of Heuristics, vol. 18, no. 4, pp. 627–656, Aug. 2012. [12] H. Zhang; R. Ren, "High Frequency Foreign Exchange Trading Strategies Based on Genetic Algorithms," in Networks Security Wireless Communications and Trusted Computing (NSWCTC), 2010 Second International Conference on, IEEE, vol.2, pp.426-429, 24-25 April 2010 [13] A. Gorgulho, R. Neves, and N. Horta, "Using GAs to Balance Technical Indicators on Stock Picking for Financial Portfolio Composition," in Proceedings of the 11th Annual Conference Companion on Genetic and Evolutionary Computation Conference: Late Breaking Papers, Montreal, Canada, New York, USA: ACM, 2009, pp. 2041–2046. [14] A. Gorgulho, N. Horta, and R. Neves, Intelligent Financial Portfolio Composition Based on Evolutionary Computation Strategies. Springer-Verlag Berlin Heidelberg, 2013. [15] S. Yang and X. Yao, "Experimental Study on Population-Based Incremental Learning Algorithms for
Dynamic Optimization Problems," Soft Computing, vol. 9, no. 11, pp. 815–834, Nov. 2005. [16] S. Yang, "Non-Stationary Problem Optimization Using the Primal-Dual Genetic Algorithm," In Evolutionary Computation, 2003. CEC '03, IEEE, Vol.3, No., Pp.2246- 2253 Vol.3, 8-12 Dec. 2003 [17] S. Yang, "Evolutionary Computation for Dynamic Optimization Problems," in Proceedings of the Companion Publication of the 2015 Annual Conference on Genetic and Evolutionary Computation (GECCO ’15), Madrid, Spain, New York, USA: ACM, 2015, pp. 629–649. [18] T. T. Nguyen, S. Yang, and J. Branke, "Evolutionary Dynamic Optimization: A Survey of the State of the Art," Swarm and Evolutionary Computation, vol. 6, pp. 1–24, Oct. 2012. [19] J. Branke, "Memory Enhanced Evolutionary Algorithms for Changing Optimization Problems," In Congress On Evolutionary Computation CEC99, IEEE, 1999, Pp. 1875–1882. [20] S. Yang & X. Yao, "Population-Based Incremental Learning with Associative Memory for Dynamic Environments," In Evolutionary Computation, IEEE Transactions On, IEEE, Vol.12, No.5, Pp.542-561, 2008 [21] T. Park, R. Choe, And K. Ryel, "Dual-Population Genetic Algorithm for Non-Stationary Optimization," In Proceedings of The 10th Annual Conference on Genetic and Evolutionary Computation (GECCO ’08), Atlanta, USA, New York, USA: ACM, 2008, Pp. 1025–1032. [22] S. Yang, "Genetic Algorithms with Memory-and Elitism-Based Immigrants in Dynamic Environments," MIT Press Journals, Pp. 385–416, Sep. 2008. [23] H. G. Cobb and J. J. Grenfenstette, Genetic Algorithms for Tracking Changing Environments. NAVAL RESEARCH LAB WASHINGTON DC, 1993. [24] Y. Shengxiang and T. Renato, "Hyper-Selection in Dynamic Environments," in IEEE World Congress on Computational Intelligence., Hong Kong, IEEE, 2008, pp. 3185–3192. [25] A. Simões & E. Costa, "Improving Prediction in Evolutionary Algorithms for Dynamic Environments," In Proceedings of The 11th Annual Conference On Genetic and Evolutionary Computation (GECCO ’09), Montreal, Canada, ACM, 2009, Pp. 875–882. [26] IPython, "Spyder - documentation — Spyder 2.3 documentation", 2009. [Online]. Available: https://pythonhosted.org/spyder/. [27] "Python data analysis library — pandas: Python data analysis library,". [Online]. Available: http://pandas.pydata.org/. [28] TA-Lib.[Online]. Available: https://mrjbq7.github.io/ta-lib/func.html.