COMBINING SMART METERING...
7
WATER AUGUST 2013 66 Technical Features ABSTRACT Smart meters are informative and educational tools that allow households to instantaneously view personal real-time water use feedback. A smart metering trial was incorporated into a residential water efficiency project in Perth, Western Australia. The H 2 ome Smart program by the Water Corporation and its contractor ENV Australia Pty Ltd engaged 12,000 households in selected suburbs of the Perth metropolitan area. After a selection process, nine households were accepted from the most active participants to participate in the Greensense smart metering trial, with the 10th participant being local television sustainable gardening celebrity Josh Byrne. A number of findings were made on how to derive benefits from smart meters in behavioural change programs. INTRODUCTION Smart metering (advanced metering infrastructure – AMI) that is integrated with online portals or in-home displays (IHD) is fairly well established in the US and the UK, especially for the energy sector. Companies such as Opower (Laskey et al., 2010), GreenWave Reality and Tendril provide sophisticated services for energy utilities, while SmartReach (Sensus, 2012) is also undergoing smart metering trials for water utilities. These companies provide online or paper feedback founded on the same principles as Community Based Social Marketing (CBSM) behaviour change programs (McKenzie-Mohr and Smith, 1999), but are generally not implemented in conjunction with any formal behaviour change program that includes one-to-one coaching or dialogue marketing. In Australia, smart metering rollout has commenced, with a number of trials having been undertaken by water and energy utilities. Smart metering for water consumption has been implemented in communities such as Hervey Bay in Queensland (Turner et al., 2010) and trials are recommended by research, such as that conducted for the Victorian Water Trust and Sydney Water (Marchment, 2010; Sydney Water, 2009). At present, smart meter technology in Australia is being implemented rapidly in the energy sector (e.g. by Department of Primary Industries in Victoria and Ausgrid in NSW) and is not integrated with a behaviour change program. The Water Corporation has successfully rolled out smart meters in Kalgoorlie and the Pilbara region of the north-west of Western Australia and follow-up with behaviour change programs is being considered. In Kalgoorlie, 600km inland to the east of Perth, the capital city of Western Australia, 13,838 smart meters were installed on residential and commercial properties. A fixed wireless network collection system, called EverBlu, was used to transmit data by radio frequency (RF) and through the Ethernet. A cyble, or pulse module, an RF radio transmitter/ receiver, is fitted to the meter, records water use by the hour and transmits this data to a collector once a day. A collector can manage up to 50 meters and relays the data, by RF, to an Access Point each day. Access Points can manage up to 1,200 meters and relay the data once per day via the Ethernet, through an FTP server in the Perth central office, into the EverBlu system. The Collectors were installed on the overhead power and street light poles of the electricity network provider, Western Power (Peach, 2012). Water supplied to Kalgoorlie fell by 837,500 kilolitres (kL) (10.13%) over the two-year period (2009–2011) of the smart meter trial. The long-term cost of water supplied to Kalgoorlie is $A7 per kL. Early detection of leaks inside property boundaries is perhaps the greatest benefit to customers from smart meters (Peach, 2012). The future potential benefit is the ability to deliver CBSM programs without the need to physically read meters, thereby resulting in a significant cost saving. Western Australia is experiencing a drying climate. In the South West, Perth has a Mediterranean climate, but winter rainfall has been steadily declining since the 1970s. The Water Corporation is Western Australia’s principal water utility, a state government-owned enterprise, and set the following targets by 2030 to address the state’s water crisis: • Reducing water use by 15%; • Increasing wastewater recycling to 30%; and • Developing new sources (Water Corporation, 2009). In Perth, the city drinking water supply, known as the Integrated Water Supply Scheme (IWSS), is sourced from a combination of surface water catchment dams (15%), groundwater (35%) and seawater desalination (50%) (typical percentages given) to provide an annual total supply of about 300GL/yr. Most of this water supply, 70%, is used by the residential sector. Average household water use in Perth is 280 kilolitres per annum (klpa) and of this about 40% is used outdoors on garden irrigation. Reading of water meters for billing purposes is done physically twice per year. The intention of the Water COMBINING SMART METERING INFRASTRUCTURE AND BEHAVIOURAL CHANGE FOR RESIDENTIAL WATER EFFICIENCY Results of a trial in the southern suburbs of Perth, Western Australia M Anda, J Brennan, E Paskett
Transcript of COMBINING SMART METERING...

water AUGUST 2013
66technical Features
ABSTRACT Smart meters are informative and educational tools that allow households to instantaneously view personal real-time water use feedback. A smart metering trial was incorporated into a residential water efficiency project in Perth, Western Australia. The H2ome Smart program by the Water Corporation and its contractor ENV Australia Pty Ltd engaged 12,000 households in selected suburbs of the Perth metropolitan area. After a selection process, nine households were accepted from the most active participants to participate in the Greensense smart metering trial, with the 10th participant being local television sustainable gardening celebrity Josh Byrne. A number of findings were made on how to derive benefits from smart meters in behavioural change programs.
INTRODUCTION Smart metering (advanced metering infrastructure – AMI) that is integrated with online portals or in-home displays (IHD) is fairly well established in the US and the UK, especially for the energy sector. Companies such as Opower (Laskey et al., 2010), GreenWave Reality and Tendril provide sophisticated services for energy utilities, while SmartReach (Sensus, 2012) is also undergoing smart metering trials for water utilities.
These companies provide online or paper feedback founded on the same principles as Community Based Social Marketing (CBSM) behaviour change programs (McKenzie-Mohr and Smith, 1999), but are generally not implemented in conjunction with any formal behaviour change program that includes one-to-one coaching or dialogue marketing.
In Australia, smart metering rollout has commenced, with a number of trials having been undertaken by water and energy utilities. Smart metering for water consumption has been implemented in communities such as Hervey Bay in Queensland (Turner et al., 2010) and trials are recommended by research, such as that conducted for the Victorian Water Trust and Sydney Water (Marchment, 2010; Sydney Water, 2009).
At present, smart meter technology in Australia is being implemented rapidly in the energy sector (e.g. by Department of Primary Industries in Victoria and Ausgrid in NSW) and is not integrated with a behaviour change program. The Water Corporation has successfully rolled out smart meters in Kalgoorlie and the Pilbara region of the north-west of Western Australia and follow-up with behaviour change programs is being considered.
In Kalgoorlie, 600km inland to the east of Perth, the capital city of Western Australia, 13,838 smart meters were installed on residential and commercial properties. A fixed wireless network collection system, called EverBlu, was used to transmit data by radio frequency (RF) and through the Ethernet. A cyble, or pulse module, an RF radio transmitter/receiver, is fitted to the meter, records water use by the hour and transmits this data to a collector once a day. A collector can manage up to 50 meters and relays the data, by RF, to an Access Point each day. Access Points can manage up to 1,200 meters and relay the data once per day via the Ethernet, through an FTP server in the Perth central office, into the EverBlu system. The Collectors were installed on the overhead power and street light poles of the electricity network provider, Western Power (Peach, 2012).
Water supplied to Kalgoorlie fell by 837,500 kilolitres (kL) (10.13%) over the two-year period (2009–2011) of the smart meter trial. The long-term cost of water supplied to Kalgoorlie is $A7 per kL. Early detection of leaks inside property boundaries is perhaps the greatest benefit to customers from smart meters (Peach, 2012). The future potential benefit is the ability to deliver CBSM programs without the need to physically read meters, thereby resulting in a significant cost saving.
Western Australia is experiencing a drying climate. In the South West, Perth has a Mediterranean climate, but winter rainfall has been steadily declining since the 1970s. The Water Corporation is Western Australia’s principal water utility, a state government-owned enterprise, and set the following targets by 2030 to address the state’s water crisis:
• Reducing water use by 15%;
• Increasing wastewater recycling to 30%; and
• Developing new sources (Water Corporation, 2009).
In Perth, the city drinking water supply, known as the Integrated Water Supply Scheme (IWSS), is sourced from a combination of surface water catchment dams (15%), groundwater (35%) and seawater desalination (50%) (typical percentages given) to provide an annual total supply of about 300GL/yr. Most of this water supply, 70%, is used by the residential sector. Average household water use in Perth is 280 kilolitres per annum (klpa) and of this about 40% is used outdoors on garden irrigation. Reading of water meters for billing purposes is done physically twice per year. The intention of the Water
COMBINING SMART METERING INFRASTRUCTURE AND BEHAVIOURAL CHANGE FOR RESIDENTIAL WATER EFFICIENCY Results of a trial in the southern suburbs of Perth, Western Australia M Anda, J Brennan, E Paskett

AUGUST 2013 water
67technical Features
Corporation is to move to reading meters and billing six times per year.
There are approximately 60 licensed wastewater recycling schemes in small towns across regional Western Australia and these are typically reusing effluent from treatment lagoons for turf irrigation on sports fields at the rate of about 3GL/yr. In Perth, wastewater recycling for industry is undertaken at the Kwinana Water Reclamation Plant at the rate of 6GL/yr. In order to increase this rate of recycling, the Water Corporation will commence recharge of Perth’s main groundwater source, the Gnangara Mound, with treated wastewater. Currently, Perth discharges approximately 130GL/yr of treated wastewater into the Indian Ocean from three main treatment plants. Aquifer recharge is proposed at about 40GL/yr by 2015, with a major trial currently under way. This simultaneously becomes a new source of water for the IWSS.
METHODS In the residential sector, a behavioural change pilot project was designed using Community Based Social Marketing (CBSM) methods to reduce residential water use for a small town in the south-west of Western Australia, Margaret River. Besides raising awareness for water conservation, the project aimed to provide 1,030 participating households with information delivery and a 10% reduction in water consumption in 2009. Starting with an adjusted gross of 1,351, 96% of the contacted households were interested in the project. With 89% requesting information, delivery to a total number of 1,157 participating households was accomplished. A continuously high participation resulted in 1,043 households being part of the project until the very end.
Upon completion of the project, the participating households reduced their water consumption by 12%, amounting to a saving of 35 kilolitres per household in one year. Due to a highly effective diffusion effect in the community, all residents in the Margaret River township reduced their water consumption by 7% to 11%, adding up to savings of 72,970 kilolitres in one year for all 2,644 residential properties for which valid readings existed.
Before the project the households had used an average of 296kL/yr; after the project they reduced to 260kL/yr. With 97% being satisfied with the project,
a deeper understanding of their own water use and a considerable number of water-saving appliances purchased during the project, the evaluation of the participants’ behavioural changes seems to indicate sustainable water savings for some time to come.
The Water Corporation then decided to apply the methods in the north of the state, on a select group of towns that were experiencing water shortages. All households in these towns could participate. The selected group of eight towns in the north of the state have an annual average household water use of 606kL/yr. This is about twice that of towns and cities in the south of the state. The higher water use in the north is due to a combination of factors, including year-round higher temperatures, dust, free water use allowances for mining company housing tenants, and the fact that fewer demand management programs have been implemented compared to those in the southern towns and cities.
It was estimated that the water use in these households of the north was evenly split between indoor and outdoor use, the latter including gardens and wash-down of cars and boats. Another important factor is the relatively low cost of water at approximately $A1.90 per kilolitre at this level of consumption. This tariff is approximately the same across the state, even though cost of supply in the north is much higher. This is made possible by a state government subsidy to the Water Corporation. By
comparison, the residential tariff for electricity in WA is $A0.25/kWh.
McKenzie-Mohr (2000) and Sheehy & Dingle (2005) identified that unintegrated intensive approaches towards changing individuals’ behaviour, such as provision of information and economic self-interest, are not successful. Instead, CBSM has shown to be very effective at inducing behavioural change, due to its pragmatic approach. In particular, it is important to introduce goal setting (Sheehy and Dingle, 2005), a sense of community (“your neighbours are doing it”) and to inspire concern for the environment (McKenzie-Mohr, 2000) as better motivators for change.
Accordingly, the H2ome Smart programs by Water Corporation and ENV have undertaken the following methodological development.
Firstly, a conceptual framework of CBSM has been refined, with the main actions developed into an ongoing feedback loop, as shown in Figure 1.
Secondly, community engagement strategies have been incorporated that connect people with their community interests and raise awareness of the drying climate. After recruitment, coaching is done with facilitative conversations that help customers set targets for themselves.
The CBSM methods deployed across these towns during 2010 and 2011 included:
Figure 1. The CBSM eco-coaching feedback loop for residential water use behaviour change programs.

water AUGUST 2013
68technical Features
a. identifying the barriers to engaging sustainable behaviours through research prior to delivery;
b. designing a strategic approach that integrates behaviour change tools;
c. announcement letter and phone call;
d. delivery of requested educational materials;
e. three annual meter reads supplemented by five more by the contractor and self-reads by willing households;
f. five feedback/progress letters followed by coaching phone calls, each conducted by trained eco-coaches;
g. final thank you letter and scorecard.
The Water Corporation coined the term “H2ome Smart” for this program and specified a target of 15% water savings from behavioural change in 8,331 households to be recruited from 13,643 in eight selected towns in the Pilbara and Kimberley regions of the north-west of Western Australia. Another 8% savings was targeted from retrofits to houses that provided free product upgrades, including new shower roses, toilet cisterns and tap aerators.
Water Corporation was the Principal in this program with methodological design, project management, community forums, training of coaches, call and mail centre operations, including coaching, meter reading, website development, statistical analysis of data and evaluation by subcontractors. The targets were overly ambitious in the absence of sound information at the time of scoping.
Unknown at the time was the very small proportion of owner-occupied households. The vast majority of tenancies were employer-owned housing (large mining companies) with free water-use allowances provided as part of the salary package, thereby creating disincentives for water conservation practices and participation in the program.
Despite the target of engaging 8,331 households, the Water Corporation databases only held 4,413 accounts, with most of these lacking customer contact details. Eventually, 1,428 of these households were registered on the program – only 17% of the registration target. Therefore the project team needed to source other databases to increase the potential number of registrations. After several months,
when contact details could be augmented from other sources and a total of 4,997 households were ultimately registered (with some withdrawals along the way), a reduced amount of time was available for engagement of the new recruits with CBSM techniques.
Not all households received all calls because of their late recruitment in the program. Nevertheless, final evaluation showed that, as an overall average, participating households achieved a 6.9% savings from behavioural change and 9.9% overall if the results were annualised.
Once the north-west region H2ome Smart program was underway, and despite the difficulties encountered, results were encouraging enough, so the Water Corporation decided to launch similar CBSM programs in the Great Southern and Perth regions in the south-west of the state, jointly funded by the Water Corporation and the Australian Government’s Water for the Future initiative.
In Perth, the target number of households was specified as a minimum of 10,000 households participating throughout the program. The water reduction target to be achieved by the contractor with the participating households was an average of 12% in the first full year after program completion compared to non-participating households. Wastewater flows from these households were to be reduced accordingly. The program intent was to inform and empower the participating households on a one-on-one basis so they were able to formulate their own plan to put water efficiency into practice in their homes and ensure efficient use of scheme water into the future by forming sustainable water saving habits.
The CBSM core methods of Figure 1 were again applied, with five rounds of meter reading, data analysis, feedback letters and coaching calls after the initial planning and announcement phase. During this research before delivery, baseline meter reads were taken, control households selected and appropriate communications and feedback materials developed in focus groups and surveys.
A smart metering trial was run in conjunction with the Perth H2ome Smart program as a prize. Smart meters are an informative and educational tool that allows households to instantaneously view personal real-time water use
feedback. Western Australian company, Greensense, partnered with the H2ome Smart program to run the trial.
After a selection process, nine participants agreed to participate in the trial, with the 10th participant being local television sustainable gardening celebrity, Josh Byrne, at his local Perth metropolitan residence. Josh was included in the trial to provide a baseline dataset of efficient water use for households to compare their water use and aim to emulate. The selection of the nine households was based on the following factors:
• The budget available only allowed for this small-scale trial;
• The offer was made only to participants in the southern suburbs to reduce geographical coverage and thereby minimise the time required for installation of the equipment;
• A shortlist of 30 households was compiled from those that had registered early and online to H2ome Smart; had access to a computer and the internet; were clearly a keen H2ome Smart participant; and willing to monitor their water use weekly and engage with the H2ome Smart team;
• The project team reviewed the selected properties and compared the data collected during the first round of phone calls, and the latest aerial imagery;
• The project team called the shortlisted households to collect additional data needed to determine eligibility and their enthusiasm for the program;
• The project team conducted a site visit to assess the shortlisted properties on site and to assess the households on a variety of parameters including meter access, meter type, water consumption and participation level, among others;
• The final nine households were confirmed by direct contact.
The Greensense product, GreensenseView, is provided as a hosted software service (Figure 2). It monitors electricity, water and gas use, displaying the results on an interactive ‘dashboard’ on a website or kiosk displays within homes or buildings. Greensense brings the data to life for building users, enabling people to see, in real time, how their actions impact on the sustainability performance on the spaces they live and work in. The Greensense product
AUGUST 2013 water
69technical Features
works by providing timely and sustained feedback and evidence of performance improvements. One of the unique features of the Greensense product is its ability to aggregate information across multiple facilities to enable real-time benchmarking, comparative performance tracking, and competitions between home or office occupants.
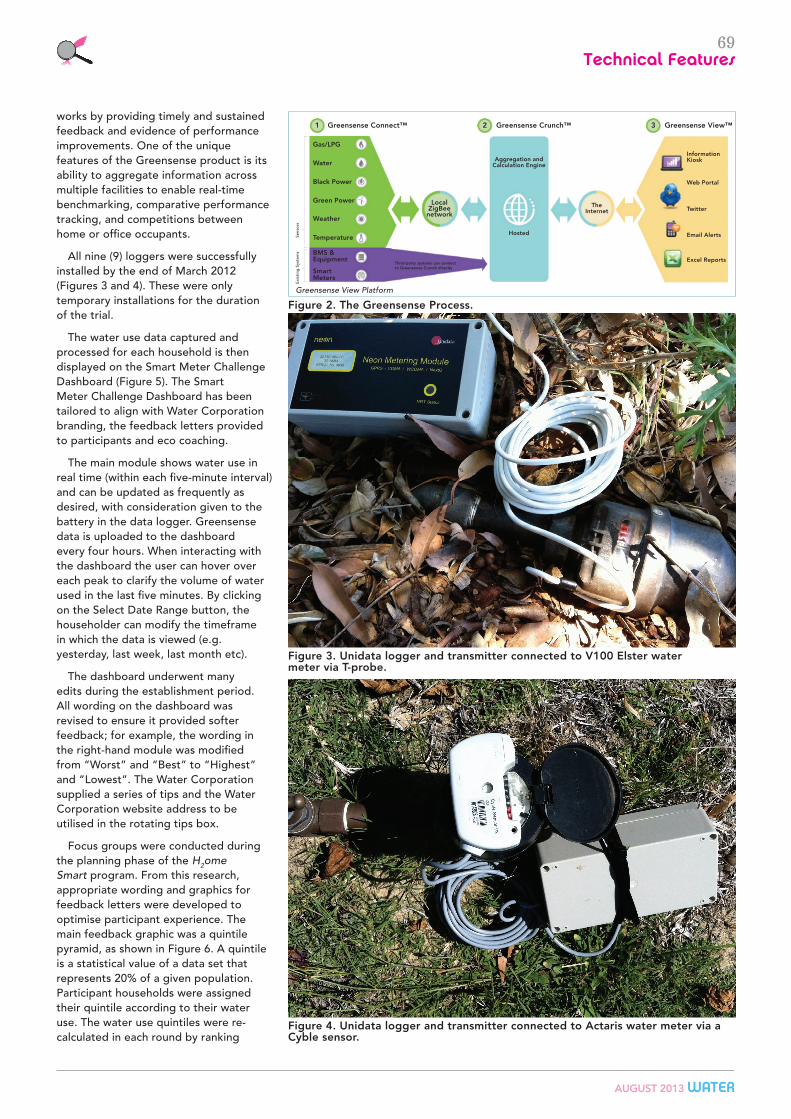
All nine (9) loggers were successfully installed by the end of March 2012 (Figures 3 and 4). These were only temporary installations for the duration of the trial.
The water use data captured and processed for each household is then displayed on the Smart Meter Challenge Dashboard (Figure 5). The Smart Meter Challenge Dashboard has been tailored to align with Water Corporation branding, the feedback letters provided to participants and eco coaching.
The main module shows water use in real time (within each five-minute interval) and can be updated as frequently as desired, with consideration given to the battery in the data logger. Greensense data is uploaded to the dashboard every four hours. When interacting with the dashboard the user can hover over each peak to clarify the volume of water used in the last five minutes. By clicking on the Select Date Range button, the householder can modify the timeframe in which the data is viewed (e.g. yesterday, last week, last month etc).
The dashboard underwent many edits during the establishment period. All wording on the dashboard was revised to ensure it provided softer feedback; for example, the wording in the right-hand module was modified from “Worst” and “Best” to “Highest” and “Lowest”. The Water Corporation supplied a series of tips and the Water Corporation website address to be utilised in the rotating tips box.
Focus groups were conducted during the planning phase of the H2ome Smart program. From this research, appropriate wording and graphics for feedback letters were developed to optimise participant experience. The main feedback graphic was a quintile pyramid, as shown in Figure 6. A quintile is a statistical value of a data set that represents 20% of a given population. Participant households were assigned their quintile according to their water use. The water use quintiles were re-calculated in each round by ranking
Figure 3. Unidata logger and transmitter connected to V100 Elster water meter via T-probe.
Figure 4. Unidata logger and transmitter connected to Actaris water meter via a Cyble sensor.
Figure 2. The Greensense Process.
Greensense Connect™1 2 3
Gas/LPG
Water
Black Power
Local ZigBee network
Aggregation and Calculation Engine
Hosted
The Internet
Information Kiosk
Web Portal
Email Alerts
Excel Reports
Green Power
Weather
Temperature
BMS & Equipment
Smart Meters
Third-party systems can connect to Greensense Crunch directly
Greensense Crunch™ Greensense View™
Sens
ors
Exi
stin
g S
yste
ms
Greensense View Platform

water AUGUST 2013
70technical Features
the control households according to
their water use (highest to lowest) and
allocating 20% of the control households
to each water use quintile. This meant
that the water use of the household at
the bottom of each 20% group (in L/
person/day) was a ‘breakpoint’.
During eco-coaching weeks the quintile
diagram (Figure 6) for each household
was displayed on the dashboard, and for
all other weeks a general weather module
took its place. The draft information pack
was edited and updated to reflect all of
the above changes to the dashboard.
Once confirmed and approved the
packs were individually tailored to each
Greensense participant to include their
username and password.
To ensure Greensense smart metering
challenge households got a targeted and
specific type of eco-coaching call, only
two eco-coaches were identified to call
the households for the remaining rounds. This approach allowed the team to technically train these two eco-coaches and allow them to become familiar with the real-time data and develop a rapport with the households.
These two eco-coaches underwent a targeted training session covering the following:
• A summary of what the participants received (letter and information pack);
• An online run through GreensenseView and dashboard; and
• Discussion around the script and how important it would be for the coaches to try and tailor their eco-coaching to the available real time data.
The selected eco-coaches also had access to each household’s dashboard and web-based reports to allow them to further understand the household’s water use and facilitate behavioural change. In order to understand the real-time water use data received and to provide personalised feedback to Greensense participants it was essential that each individual household’s situation was understood.
An example of a web-based ‘heat map’ report is shown in Figure 7. This report shows the average pattern of water use in a given period. In the example shown, the report provides evidence of a household using automatic garden irrigation in winter (the large flows at 10:00pm on Thursday and Sunday) and possible evidence of a water leak (minimum night-time flows are above zero).
Figure 5. Smart meter challenge dashboard.
Figure 6. Quintile module.
02:00 PM 12.3 20.8 11.9 16.5 15.0 12.3 19.6
03:00 PM 19.2 15.8 10.0 20.8 11.9 12.7 5.4
04:00 PM 24.2 18.8 11.2 16.2 10.8 21.9 8.8
11:00 PM 7.7 4.2 2.7 8.8 7.3 5.8 3.1
12:00 PM 22.7 24.6 33.8 11.2 13.5 36.9 37.3
01:00 PM 23.8 19.2 23.8 24.6 16.5 8.5 19.2
08:00 PM 13.8 16.9 8.8 8.5 17.7 4.6 8.5
09:00 PM 11.2 18.5 7.7 6.5 18.1 16.5 7.3
10:00 PM 11.9 9.2 7.7 168.1 10.0 7.7 164.2
05:00 PM 13.8 16.5 9.2 10.0 20.0 29.2 9.6
06:00 PM 11.2 17.7 16.5 14.2 10.8 15.8 17.3
07:00 PM 22.7 14.6 6.9 13.5 8.5 10.0 14.6
02:00 AM 0.0 0.4 2.3 1.5 0.0 0.4 0.8
03:00 AM 3.1 1.2 1.2 2.3 0.4 0.0 0.0
04:00 AM 1.9 1.2 10.4 1.2 0.4 0.8 0.0
11:00 AM 28.5 26.5 23.5 12.3 13.1 47.3 42.7
12:00 AM 4.2 0.4 5.0 1.9 2.3 3.5 1.5
01:00 AM 1.9 1.2 3.1 0.4 0.0 1.2 0.0
08:00 AM 83.8 77.3 83.8 85.0 81.9 29.2 61.9
09:00 AM 30.8 36.5 50.0 38.8 28.1 43.1 39.2
10:00 AM 15.0 21.9 34.2 23.1 9.6 70.8 32.7
05:00 AM 1.5 5.8 2.3 1.5 2.3 2.3 1.5
06:00 AM 3.8 16.5 18.1 6.5 13.8 5.4 18.1
07:00 AM 55.0 39.6 61.2 23.8 29.2 8.5 18.1
Mon Tue Wed Thu Fri Sat Sun
This report shows the average 24-hour consumption profile over each day of the week for 'Water (L)' for the period 1-Jul-2012 to 30-Sep-2012.
Figure 7. Heat-map report.

AUGUST 2013 water
71technical Features
RESULTS The Perth H2ome Smart program ran from July 2011 to August 2012 and 12,256 households were initially recruited from approximately 33,000 households in the target suburbs. By the end of the program 11,067 were still participating. At the time of publishing this paper, the water saved as a result of this program was still being evaluated.
The Greensense smart metering trial system started to record data for all 10 participating households on Wednesday, 1 February, 2012. It is interesting to note the patterns in water use before households could view their dashboards, and after they had access to their dashboard and had had a few days to understand the real-time data and patterns in water use.
By comparing these two separate date ranges (‘before’ corresponding to Thursday, 23 February, 2012–Wednesday, 28
March, 2012, and ‘after’ corresponding to Thursday, 29 March, 2012–Wednesday, 2
May, 2012) we can see the effect that access to real-time water use data can have on water use behaviours.
The Greensense smart metering trial, or ‘challenge’ as it was communicated to participants, demonstrated a variable response to the real-time water use dashboards. By utilising Heat Maps the Greensense system can retrieve hourly averages for water use in an average week and display the data using average litre figures and colour coding to help identify anomalies and patterns of water
use. The Greensense system can also produce Weekly Profile Comparison Reports where the average water use and maximums can be tabulated and graphed for two periods of time.
Water use data was downloaded from GreensenseView to track water usage in each household. It is evident from Figure 8 that most households made significant water savings since the start date.
Josh Byrne, from ABC TV’s Gardening Australia, and his family were consistently low-water users. Their household is a great example of a waterwise household that has a highly functional (and productive) garden. Indeed, many of their water savings come from actions taken in the garden. Some of the other households in the smart metering trial had established gardens with lower percentages of lawn, but most of these were not highly functional. In order to create a highly productive and waterwise garden, the Byrne household has implemented the following:
• Careful design of the garden with consideration to space, sunlight, aspect etc;
• Hydrozoning of plants;
• Seasonal planting of food plants;
• Collection and treatment of greywater for drip irrigation;
• Collection of rainwater for drip irrigation, as well as supplying water to the toilet and washing machine.
As can be seen in Figure 8, water use
is generally much higher in the months
of February and March, when high
summer temperatures require garden
irrigation. One particular household,
Bodis (green line) showed the highest
water use due to large areas of turf that
were subsequently replaced with a more
waterwise garden design leading to
substantial reduction in water use.
The Byrne household (purple line)
water use during this same time was
low, even with the lush, productive
garden, because of the use of greywater
for irrigation.
FINDINGS
At the conclusion of the program the
team collated all water use data and
feedback from the participants to
complete a final analysis demonstrating
the outcomes of the challenge, including
its advantages/disadvantages and
opportunities/constraints for the future.
The following findings are important
for the future:
1. The display of water use versus time
can be limited by water meters that
measure in 5-litre intervals; the data
displayed is likely to lag behind when
the water was actually used.
2. The integration of two data collection
methods (real-time and manual
meter reads) proved difficult. Though
significant effort was expended to
design meaningful modules for the
dashboard, the quintile module was
eventually pulled down.
3. Participants enjoyed seeing
their water use in real-time, but
engagement by the participants
with the dashboard was lower than
anticipated and decreased as the
program progressed. Monitoring their
own water use was not a high priority
and there were no mechanisms to
ensure that participants would log on.
4. Some participants stated that they
would prefer an in-home display (IHD),
whereas others preferred an online
portal. This suggests that one solution
does not fit all.
0
100
200
300
400
500
600
700
800
900
1000
February March April May June July (to date)
Average daily water consumption (L/pp/day)
Ramlugan Byrne PowellChen Cooper McGowanKeenan Chang BodisWestwood Household Average Perth Average Scheme Water Use
Figure 8. Average daily water use (L/p/day) of Greensense VIP households.

water AUGUST 2013
72technical Features
5. The eco-coaches found it beneficial if they and the participant were viewing the dashboard during the coaching calls, but this would not be practical as part of a larger program where speed and efficiency is necessary to achieve cost-effectiveness.
6. To integrate the data collected into this trial, the dashboards were reviewed manually and key points summarised for the eco-coach. However, the ideal scenario would be for the data to be analysed automatically and then included within feedback letters and scripting.
RECOMMENDATIONS The following recommendations are particularly relevant for utilities, industry practitioners and project managers of behaviour change programs:
1. Install water meters with a small logging interval (i.e. 1 litre instead of 5 litres) to improve the accuracy of real-time data and allow actions to be directly correlated to water use.
2. Smart metering should be utilised to collect baseline data for at least a year before the implementation of a BCP.
3. IHDs or online portals should be opt-in, as it is unlikely that all households will engage with these as often as desired.
4. Water use feedback should also be available as an automatic daily or weekly email, with embedded charts showing comparative water use to continuously re-engage participants through the duration of the program.
5. The display of data and any additional analysis for participants should be as clear and easy to understand as possible. It is recommended that water use be displayed in litres per 1 min. units (although this will only be effective if the water meter logs in 1L intervals). Analysis results displayed on an IHD or portal must align with the aims of the program and provide real value.
6. Results from regular data analysis of the real-time data should be incorporated into personalised feedback letters, along with up-to-date results of the community effort and a reminder of their agreed actions.
7. Feedback letters should be followed by an eco -coaching call that does not require the eco -coach or the participant to see their real-time data to be effective.
ACKNOWLEDGEMENTS Particular thanks are owed to Kim Dennison, Aisha Chalmers, Kristy Ferguson, John Hunt and Brenten Wellington at ENV Australia Pty Ltd, Fabian Le Gay Brereton at Greensense, Bill Heppard at Research Panel, Bartholomew Hart at IA (Australia) Group Pty Ltd, Alex Maund at Data Analysis Australia Pty Ltd, Colin Ashton Graham and Josh Byrne.
THE AUTHORSDr Martin Anda (email: [email protected]) is Coordinator Environmental Engineering, School of Engineering and Information Technology,
Murdoch University, Perth, WA.
John Brennan has retired from his position as Manager of Water Efficiency Projects Team at Water Corporation, Leederville, Perth, WA.
Elise Paskett (email: [email protected]) is Water Efficiency Project Manager at Water Corporation, Leederville, Perth, WA.
REFERENCES Laskey A & Kavazovic O (2010): Opower: Energy
Efficiency Through Behavioural Change and Technology, XRDS Magazine, Vol 17, No 4.
Loh M & Coghlan P (2003): Domestic Water Use Study: In Perth, Western Australia 1998–2000. Water Corporation, Perth, Western Australia.
Marchment Hill Consulting Pty Ltd (2010): Smart Water Metering Cost Benefit Study,
Final Report – Available for Information. Report prepared for the Victorian Water Trust, Melbourne.
McKenzie-Mohr D & Smith S (1999): Fostering Sustainable Behaviour: An Introduction to Community-Based Social Marketing. New Society Publishers: Gabriola Island, BC Canada.
McKenzie-Mohr D (2000): Fostering Sustainable Behaviour Through Community Based Social Marketing. American Psychologist, 55, 5: 531537.
Peach G (2012): Kalgoorlie Smart Metering Trial: Key findings and outcomes, Water Corporation, Perth.
Sensus (2012): Thames Water and SmartReach Extend Smart Water Meter Trial, sensus.com/web/usca/news/display?news_ id=thames-water-and-smartreach-extend-smart water-meter-trial-press-release, access 19/9/12.
Sheehy L & Dingle P (2005): Evaluating Environmental Education Programs: How Do We Know if They Work? AAEE 2004, Adelaide.
Sydney Water (2009): National Smart Metering Program, Discussion Paper for the Requirements Work Stream, Sydney Water, Sydney.
Turner A, Retemal M, White S, Palfreeman L & Panikkar A (2010): Third Party Evaluation of Wide Bay Water Smart Metering and Sustainable Water Pricing Initiative Project. DEWHA, Canberra.
Water Corporation (2009): Water Forever: Towards Climate Resilience. Water Corporation, Perth.
Water Corporation (2010): Perth Residential Water Use Study 2008/2009. Water Corporation, Perth.