Combining semantic 3D GIS with numerical Simulation for assessing the impact of Blasts in urban...
33
CREATE MAINTAIN PUBLISH Combining semantic 3D GIS with numerical Simulation for assessing the impact of Blasts in urban Environments Coupled Problems 2015 Venice Arne Schilling Stefan Trometer virtualcitySYSTEMS GmbH CADFEM GmbH Berlin, Germany Grafing, Germany
-
Upload
virtualcitysystems-gmbh -
Category
Technology
-
view
196 -
download
1
Transcript of Combining semantic 3D GIS with numerical Simulation for assessing the impact of Blasts in urban...

CREATE MAINTAIN PUBLISH
Combining semantic 3D GIS with numerical Simulation for assessing the impact of Blasts in urban Environments
Coupled Problems 2015
Venice
Arne Schilling Stefan Trometer
virtualcitySYSTEMS GmbH CADFEM GmbH
Berlin, Germany Grafing, Germany

Arne Schilling, Stefan Trometer 2
What is Urban Simulation?
Challenge
Use Case: Simulating Explosions in Urban Environments
Discussion
What‘s Next?
Outline
3 Arne Schilling, Stefan Trometer
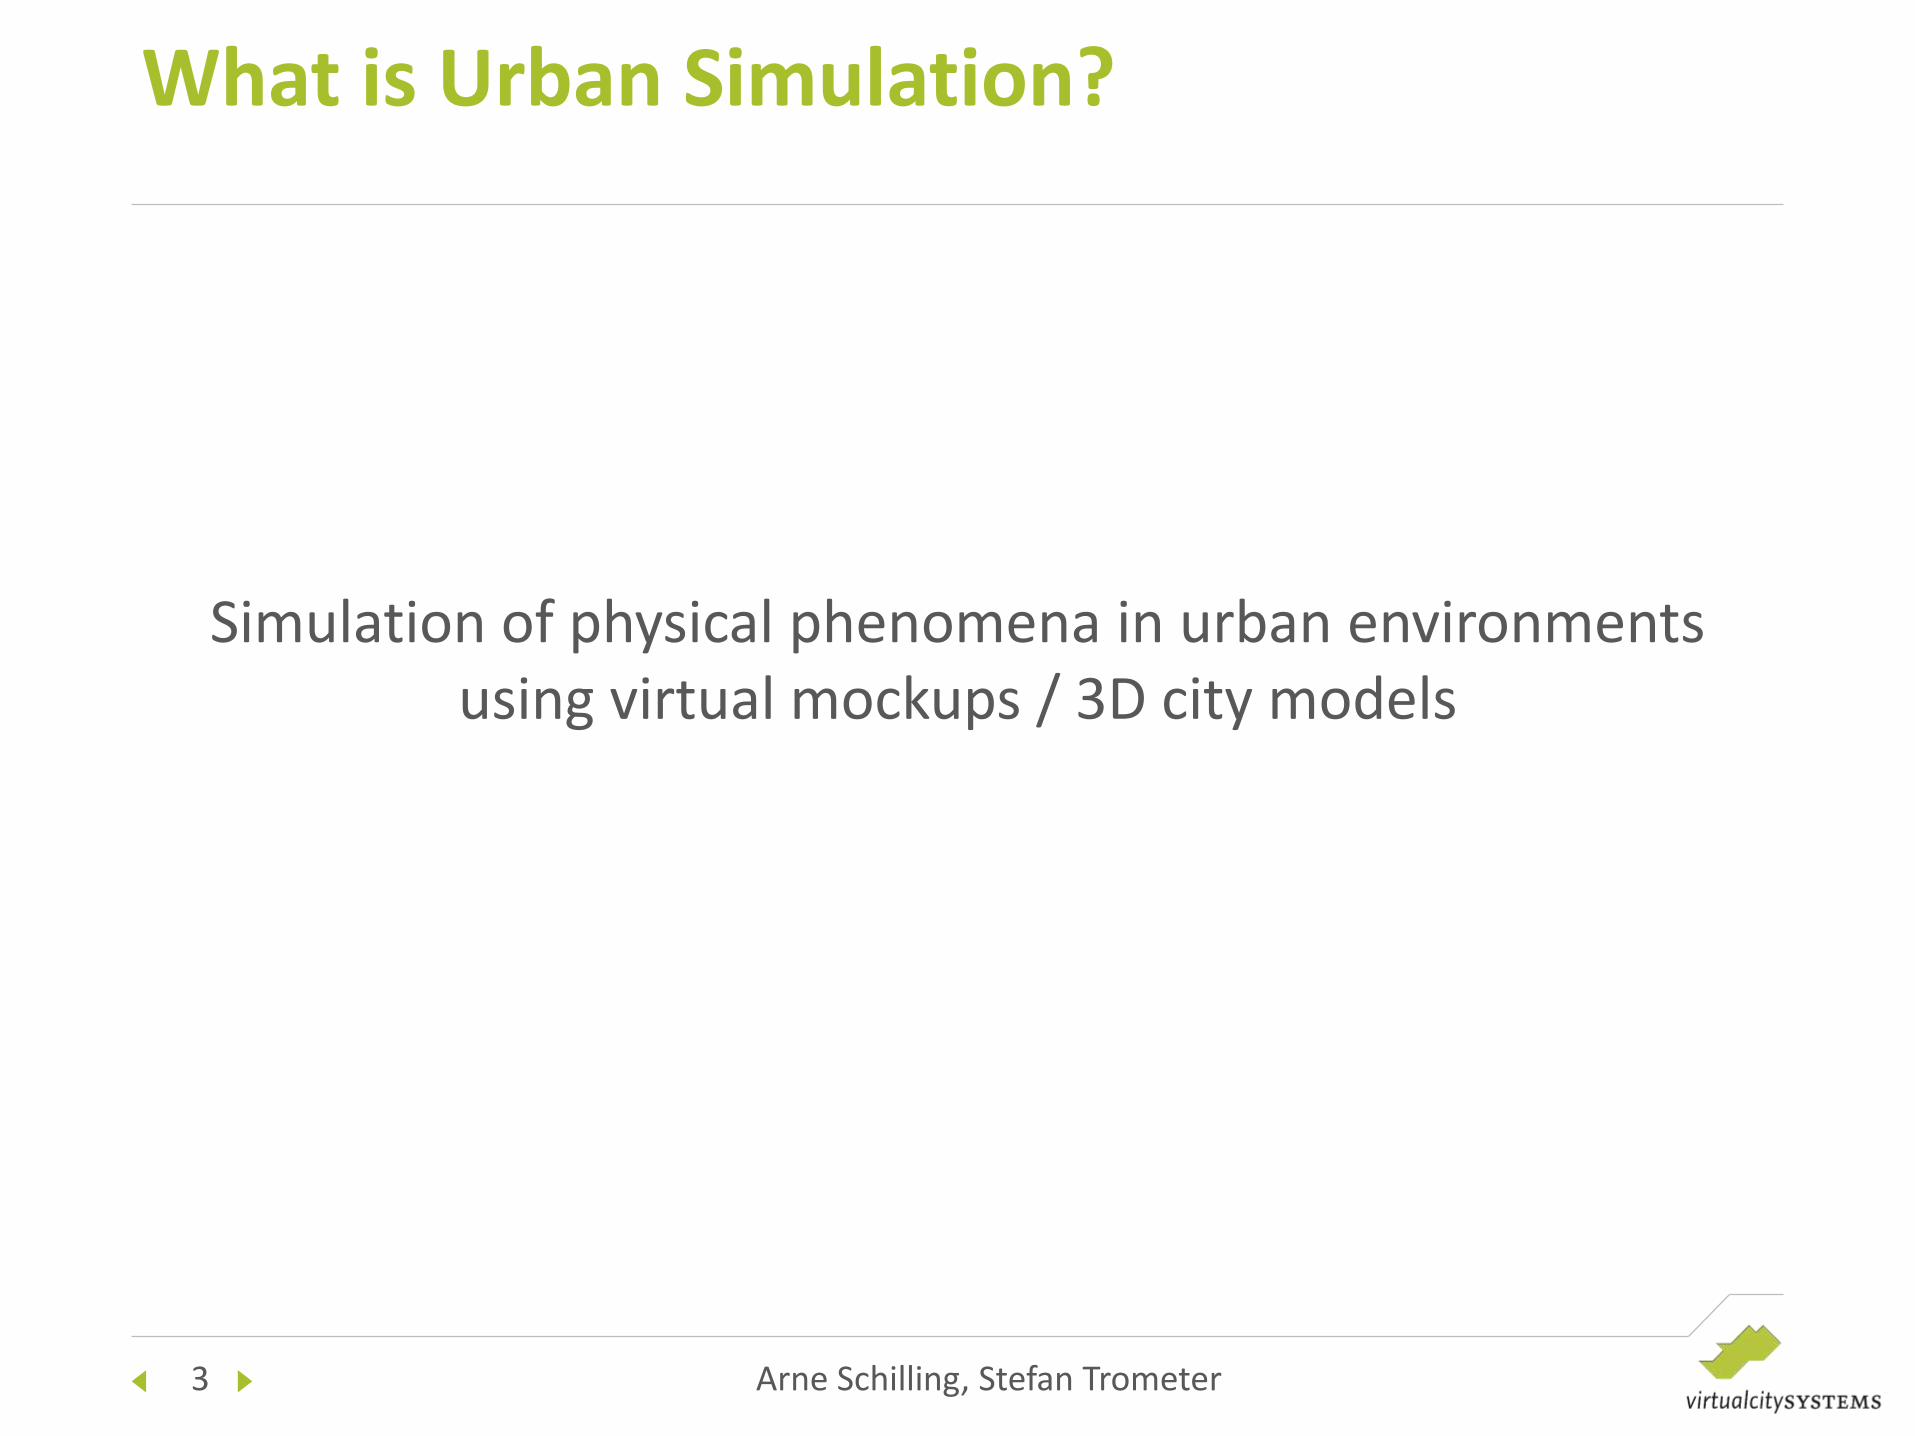
What is Urban Simulation?
Simulation of physical phenomena in urban environments using virtual mockups / 3D city models
4 Arne Schilling, Stefan Trometer
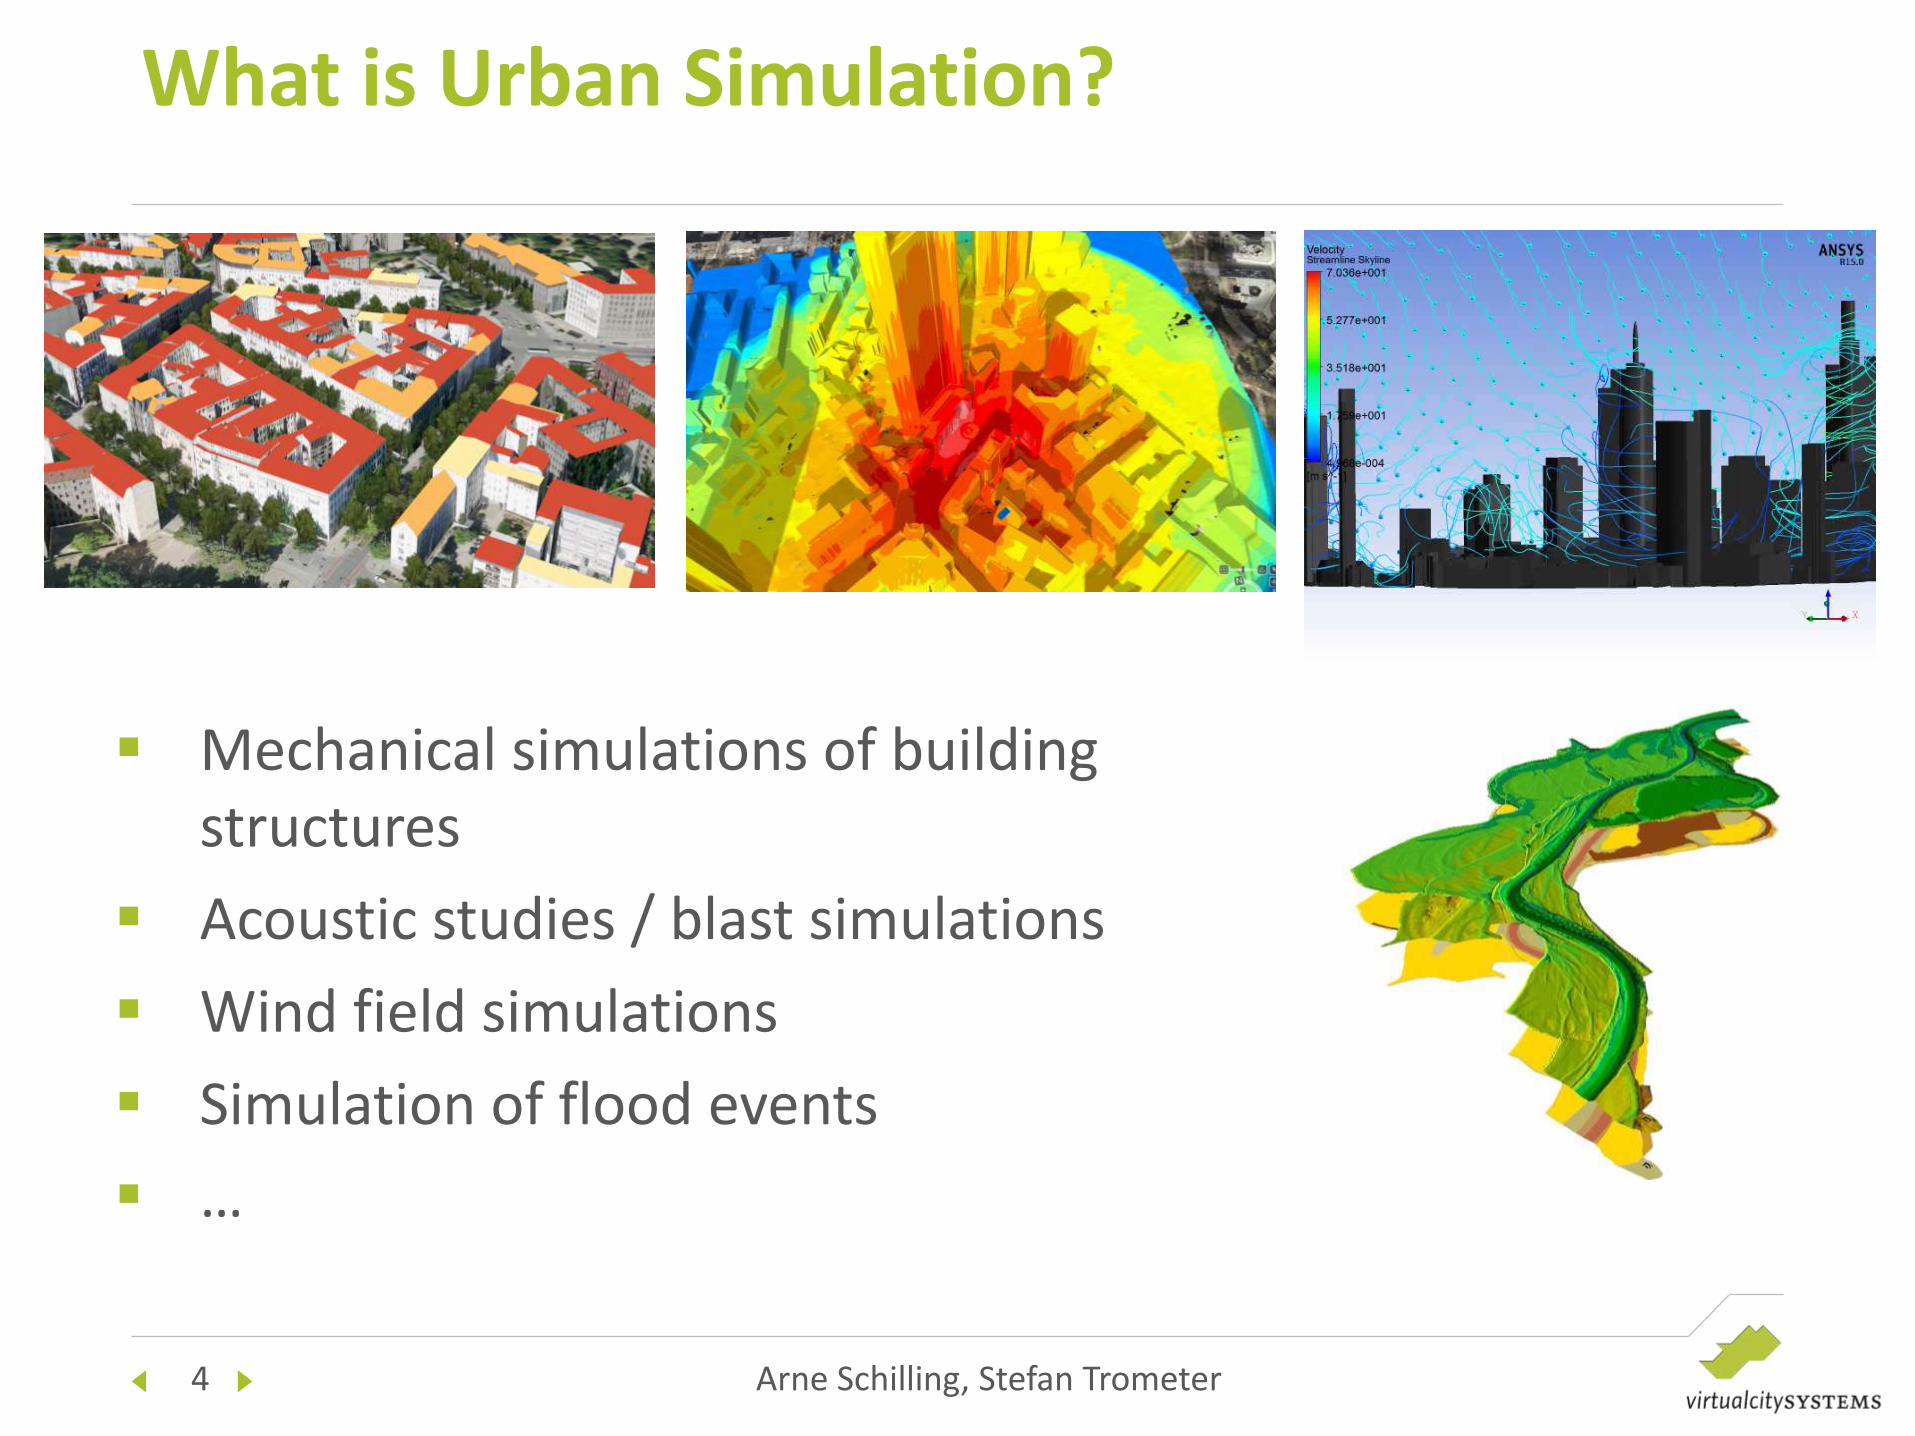
What is Urban Simulation?
Mechanical simulations of building structures
Acoustic studies / blast simulations
Wind field simulations
Simulation of flood events
…
5 Arne Schilling, Stefan Trometer
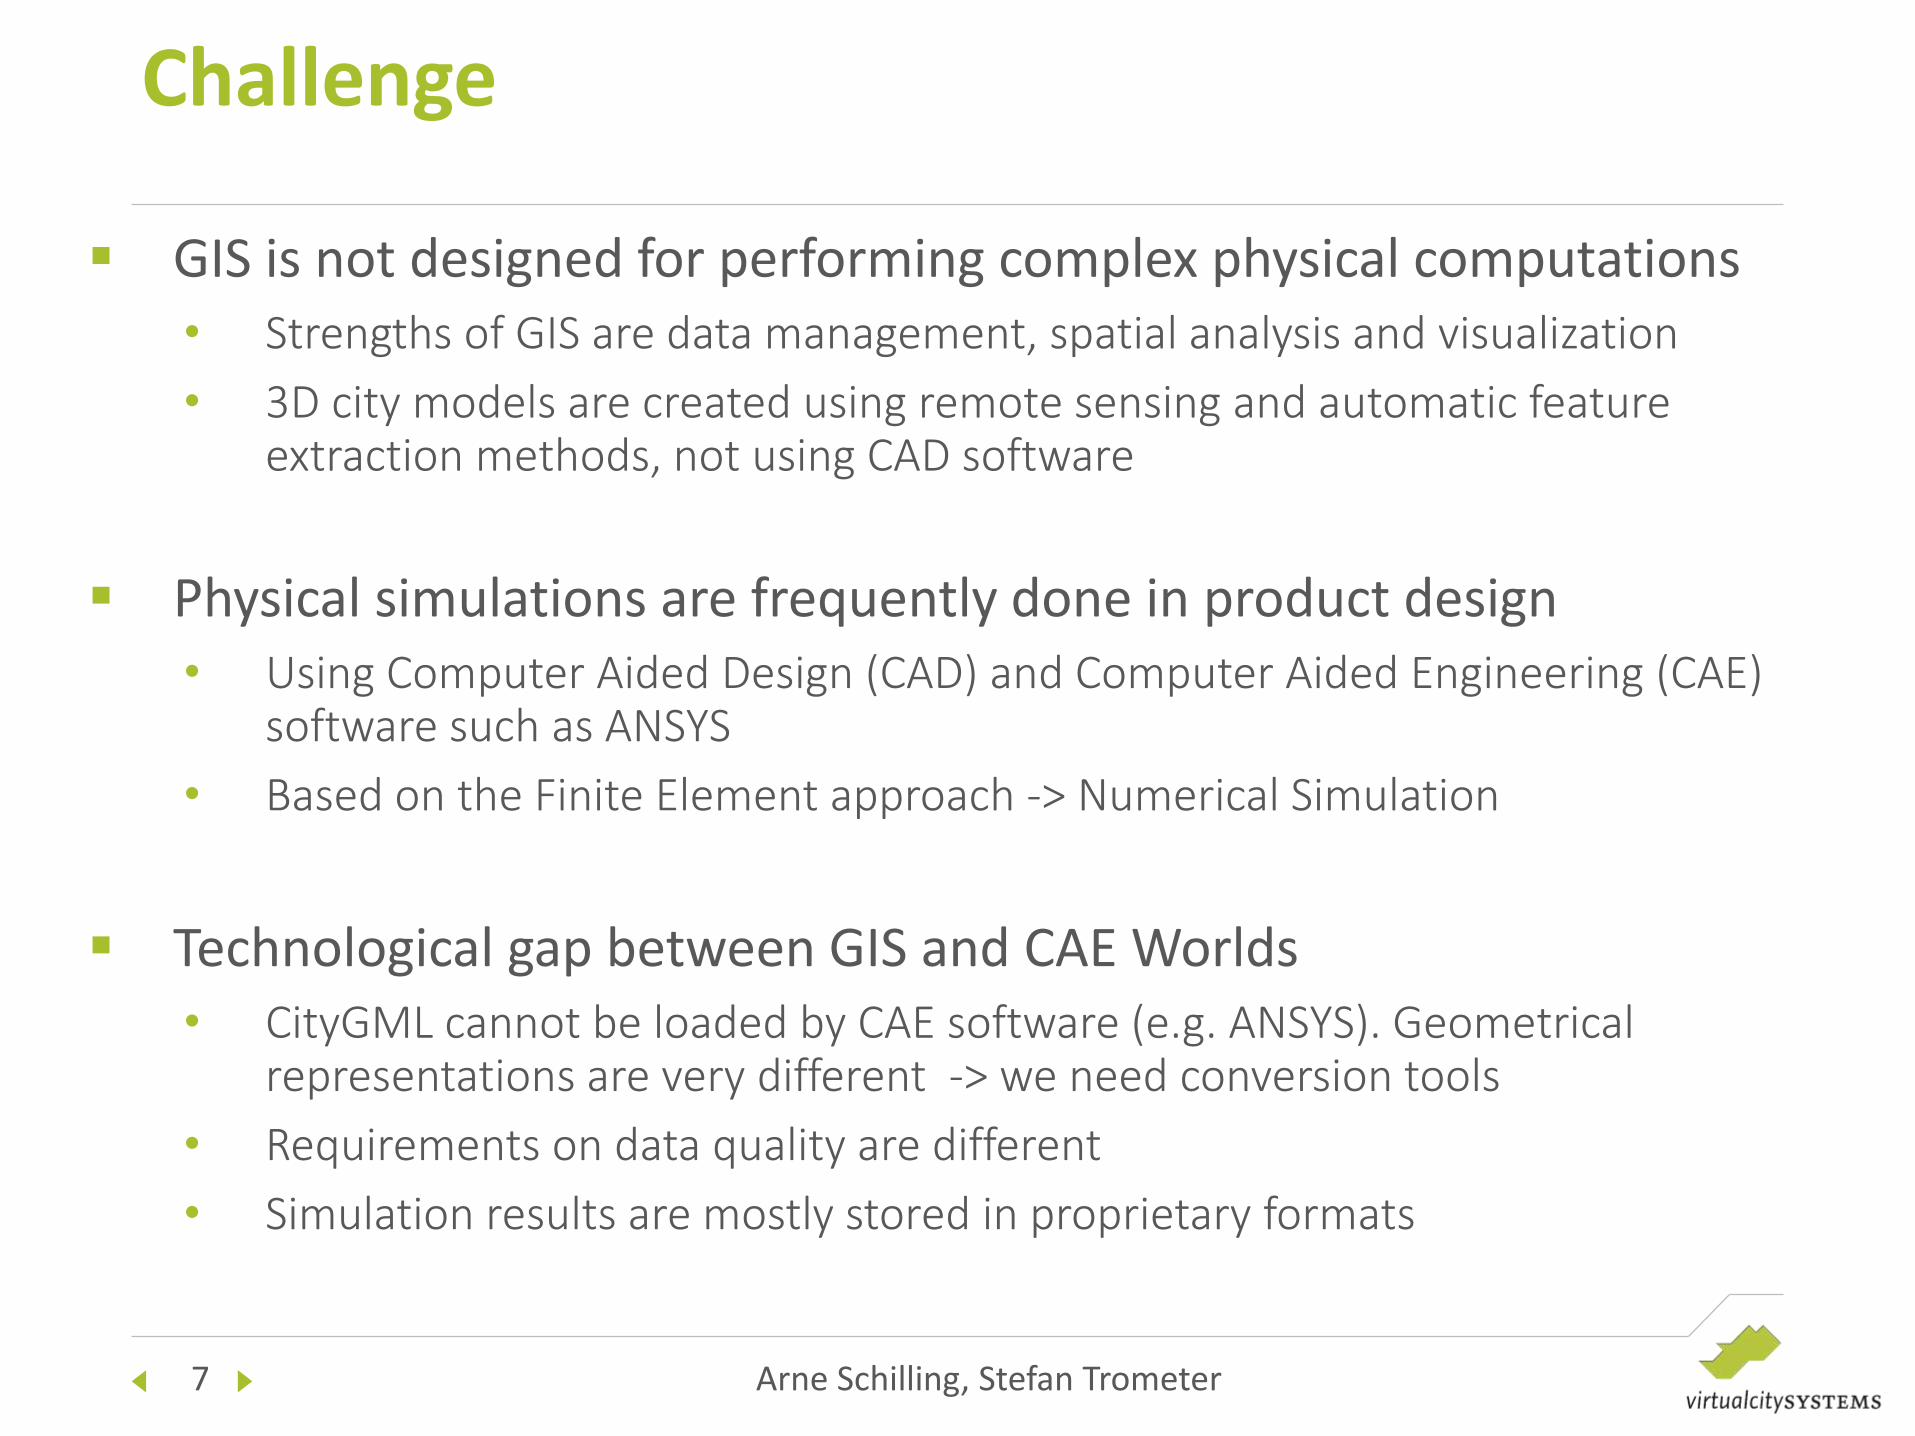
GIS is not designed for performing complex physical computations • Strengths of GIS are data management, spatial analysis and visualization
• 3D city models are created using remote sensing and automatic feature extraction methods, not using CAD software
Challenge

6 Arne Schilling, Stefan Trometer
Challenge
GIS is not designed for performing complex physical computations • Strengths of GIS are data management, spatial analysis and visualization
• 3D city models are created using remote sensing and automatic feature extraction methods, not using CAD software
Physical simulations are frequently done in product design • Using Cumputer Aided Design (CAD) and Computer Aided Engineering (CAE)
software such as ANSYS
• Based on the Finite Element approach -> Numerical Simulation
7 Arne Schilling, Stefan Trometer
Challenge
GIS is not designed for performing complex physical computations • Strengths of GIS are data management, spatial analysis and visualization
• 3D city models are created using remote sensing and automatic feature extraction methods, not using CAD software
Physical simulations are frequently done in product design • Using Computer Aided Design (CAD) and Computer Aided Engineering (CAE)
software such as ANSYS
• Based on the Finite Element approach -> Numerical Simulation
Technological gap between GIS and CAE Worlds • CityGML cannot be loaded by CAE software (e.g. ANSYS). Geometrical
representations are very different -> we need conversion tools
• Requirements on data quality are different
• Simulation results are mostly stored in proprietary formats

8 Arne Schilling, Stefan Trometer
Challenge
Create a workflow from 3D Geographic Information Systems to Simulation frameworks and back
9 Arne Schilling, Stefan Trometer
Use Case: Simulating Explosions in Urban Environments
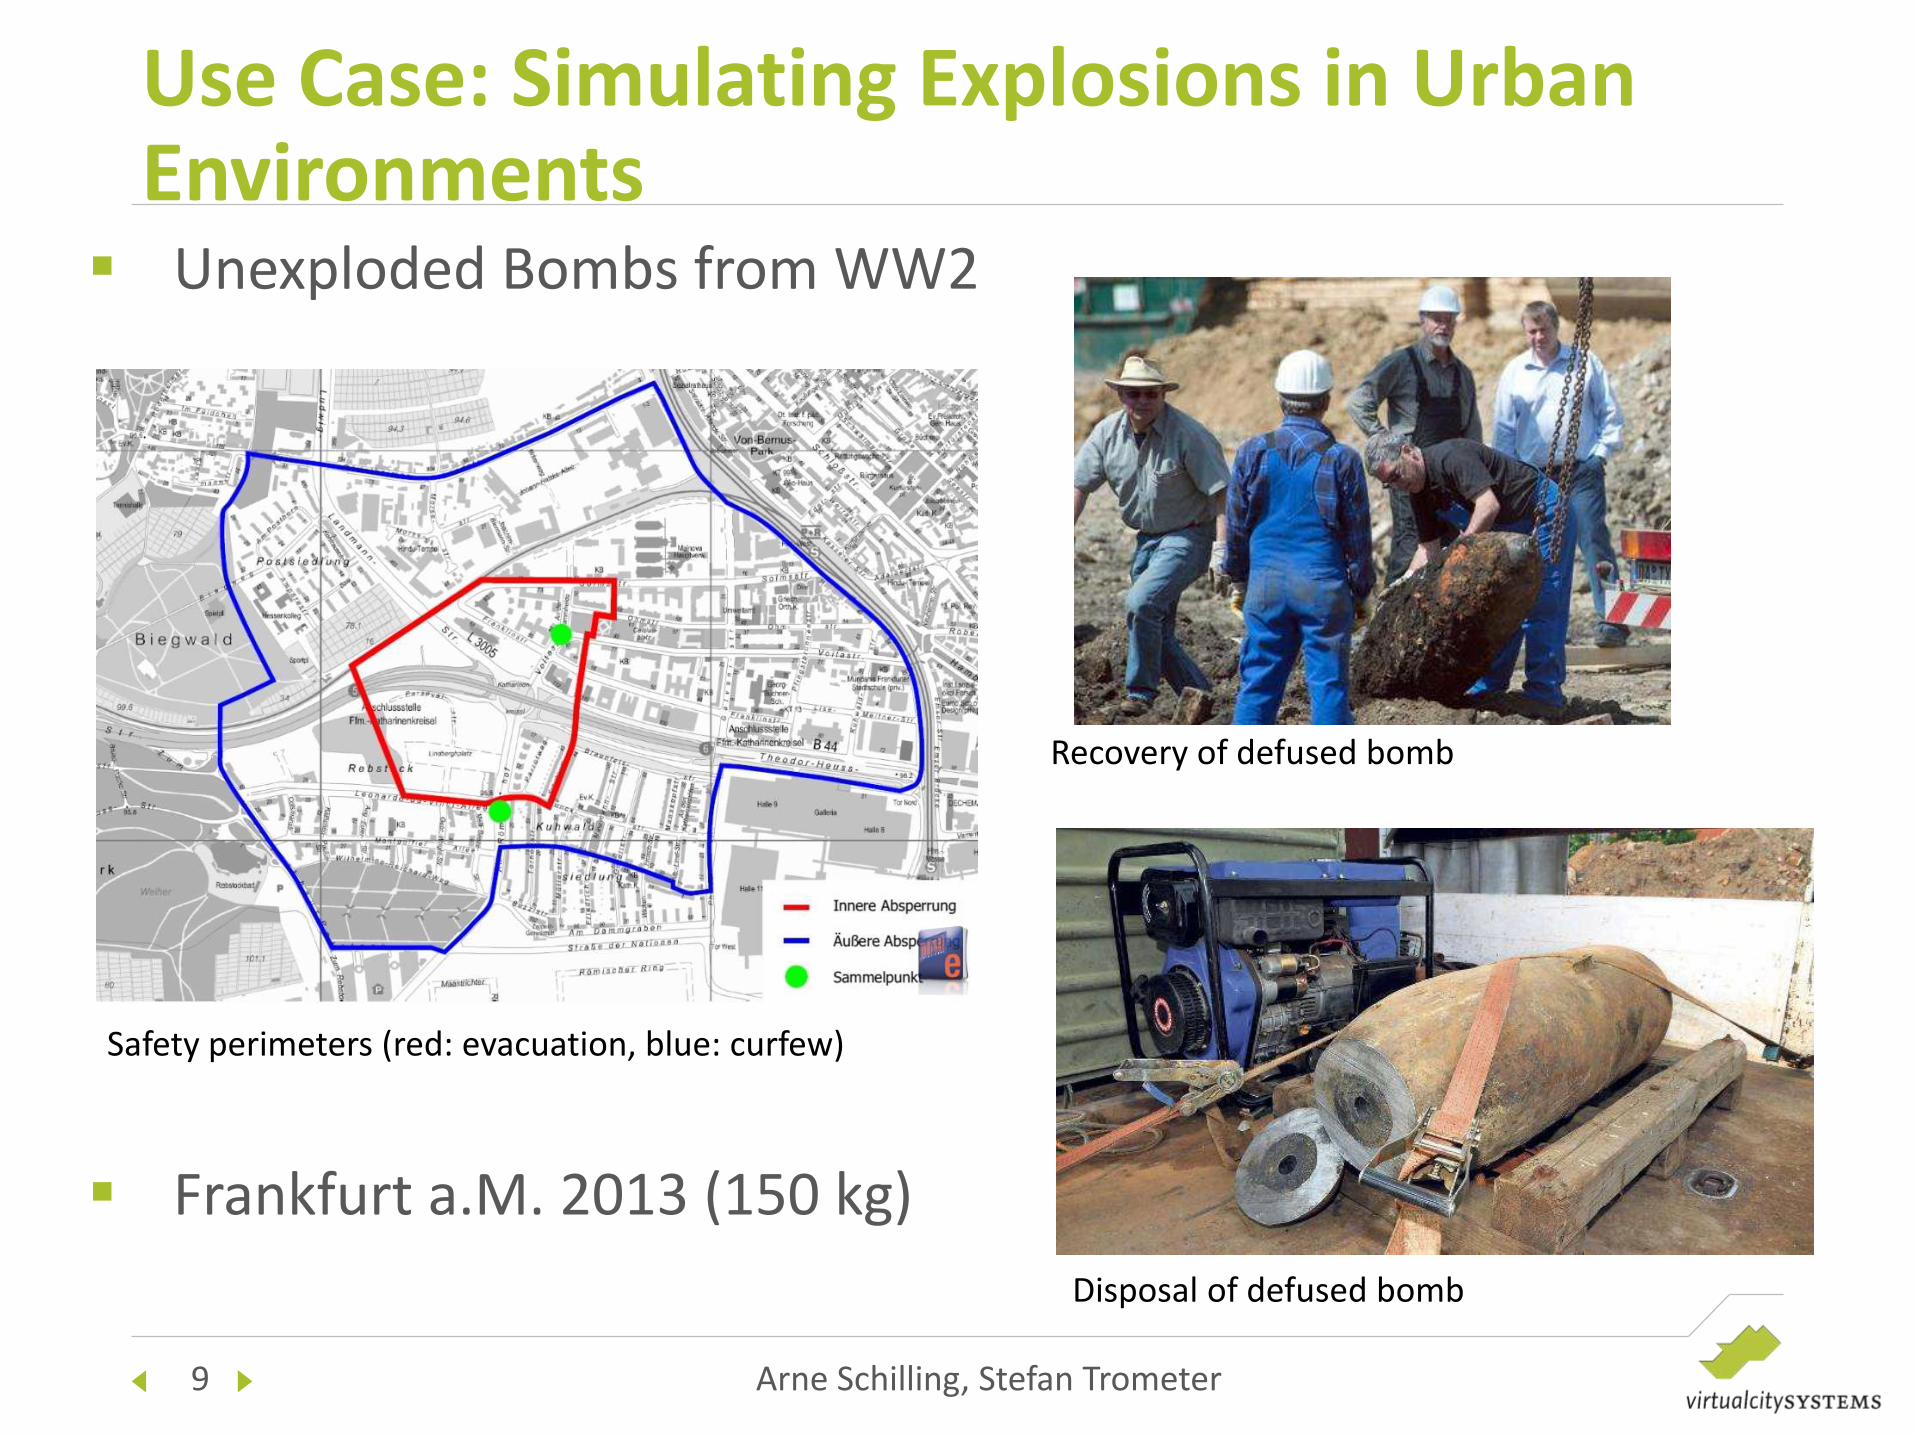
Safety perimeters (red: evacuation, blue: curfew)
Unexploded Bombs from WW2
Frankfurt a.M. 2013 (150 kg)
Recovery of defused bomb
Disposal of defused bomb
10 Arne Schilling, Stefan Trometer
Use Case: Simulating Explosions in Urban Environments
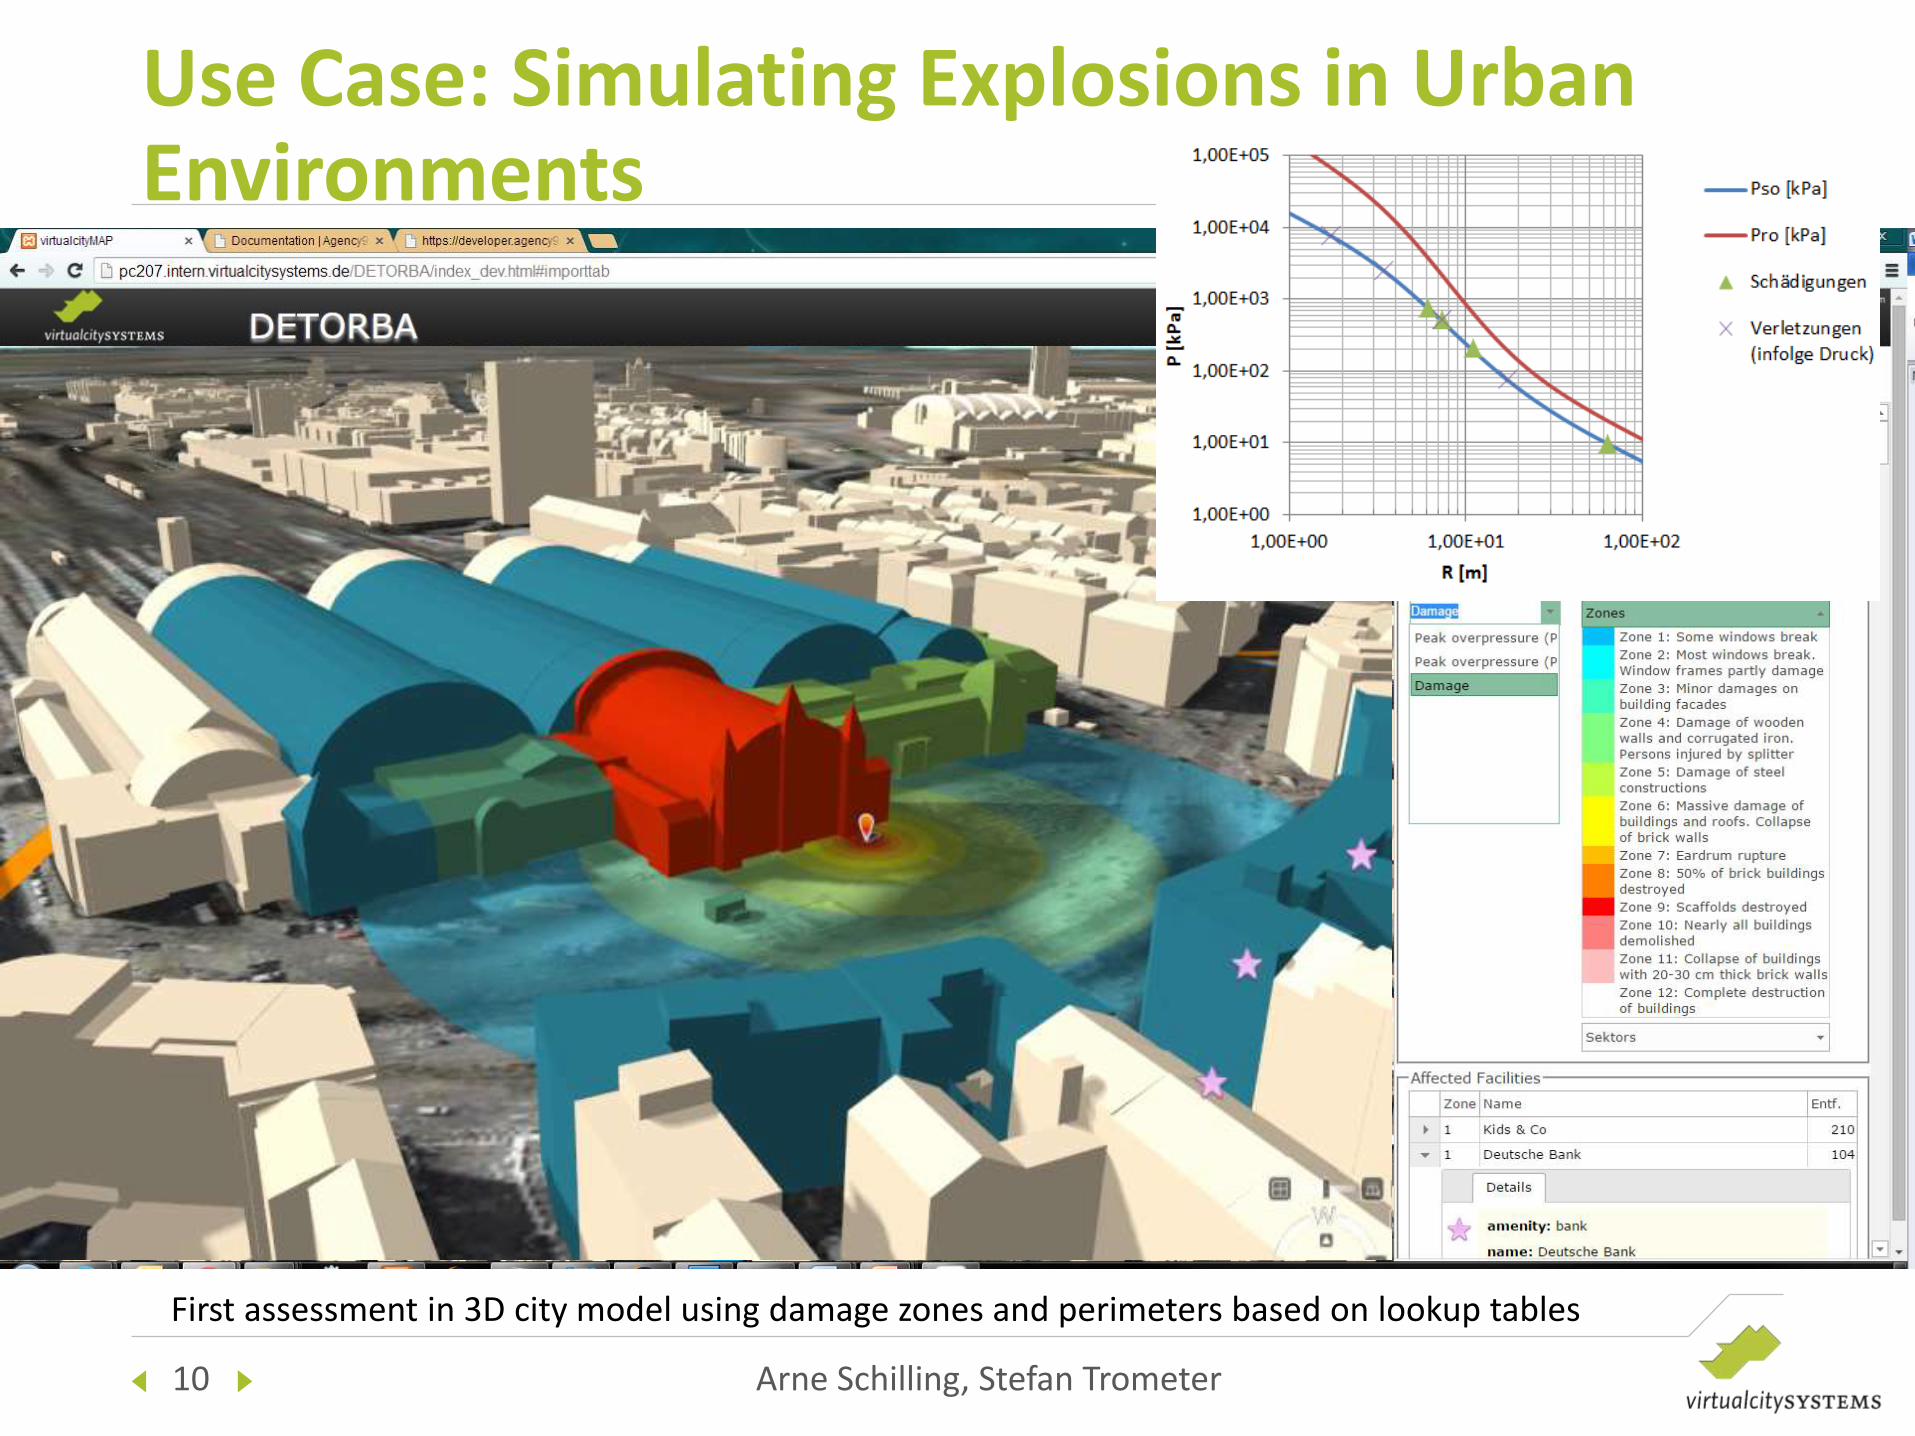
First assessment in 3D city model using damage zones and perimeters based on lookup tables

11 Arne Schilling, Stefan Trometer
Simulation of shockwave propagations in ANSYS
• Extracting 3D city model from a CityGML database
• Geometry processing, geometry healing for creating solid models
Use Case: Simulating Explosions in Urban Environments
Geometry healing, e.g. removing inner surfaces (top) and resolving self-intersections (bottom)
12 Arne Schilling, Stefan Trometer
Simulation of shockwave propagations in ANSYS
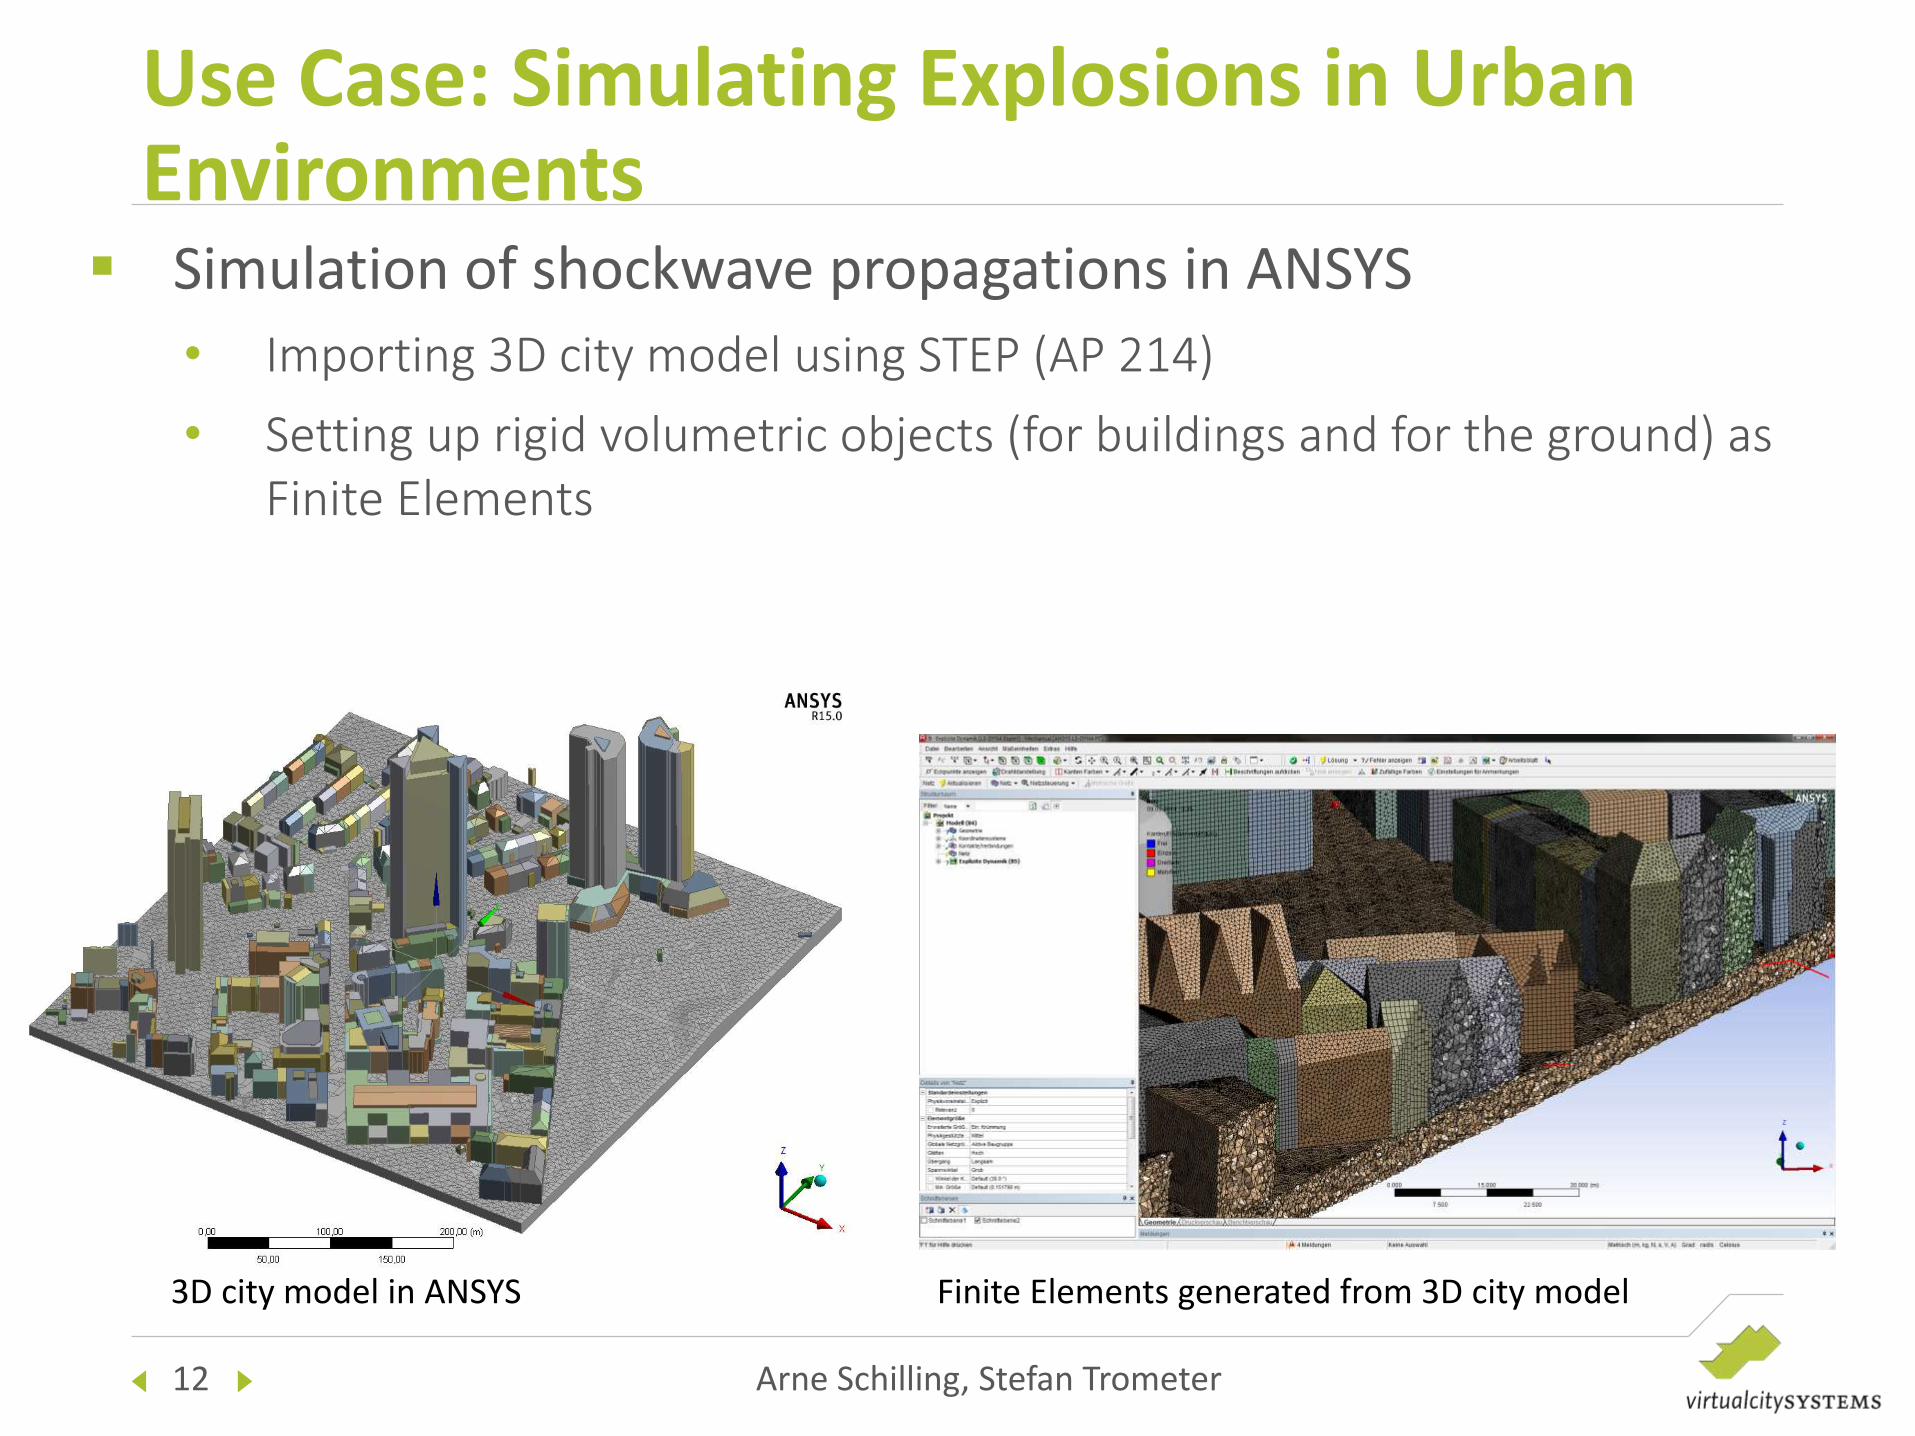
• Importing 3D city model using STEP (AP 214)
• Setting up rigid volumetric objects (for buildings and for the ground) as Finite Elements
Use Case: Simulating Explosions in Urban Environments
3D city model in ANSYS Finite Elements generated from 3D city model
13 Arne Schilling, Stefan Trometer
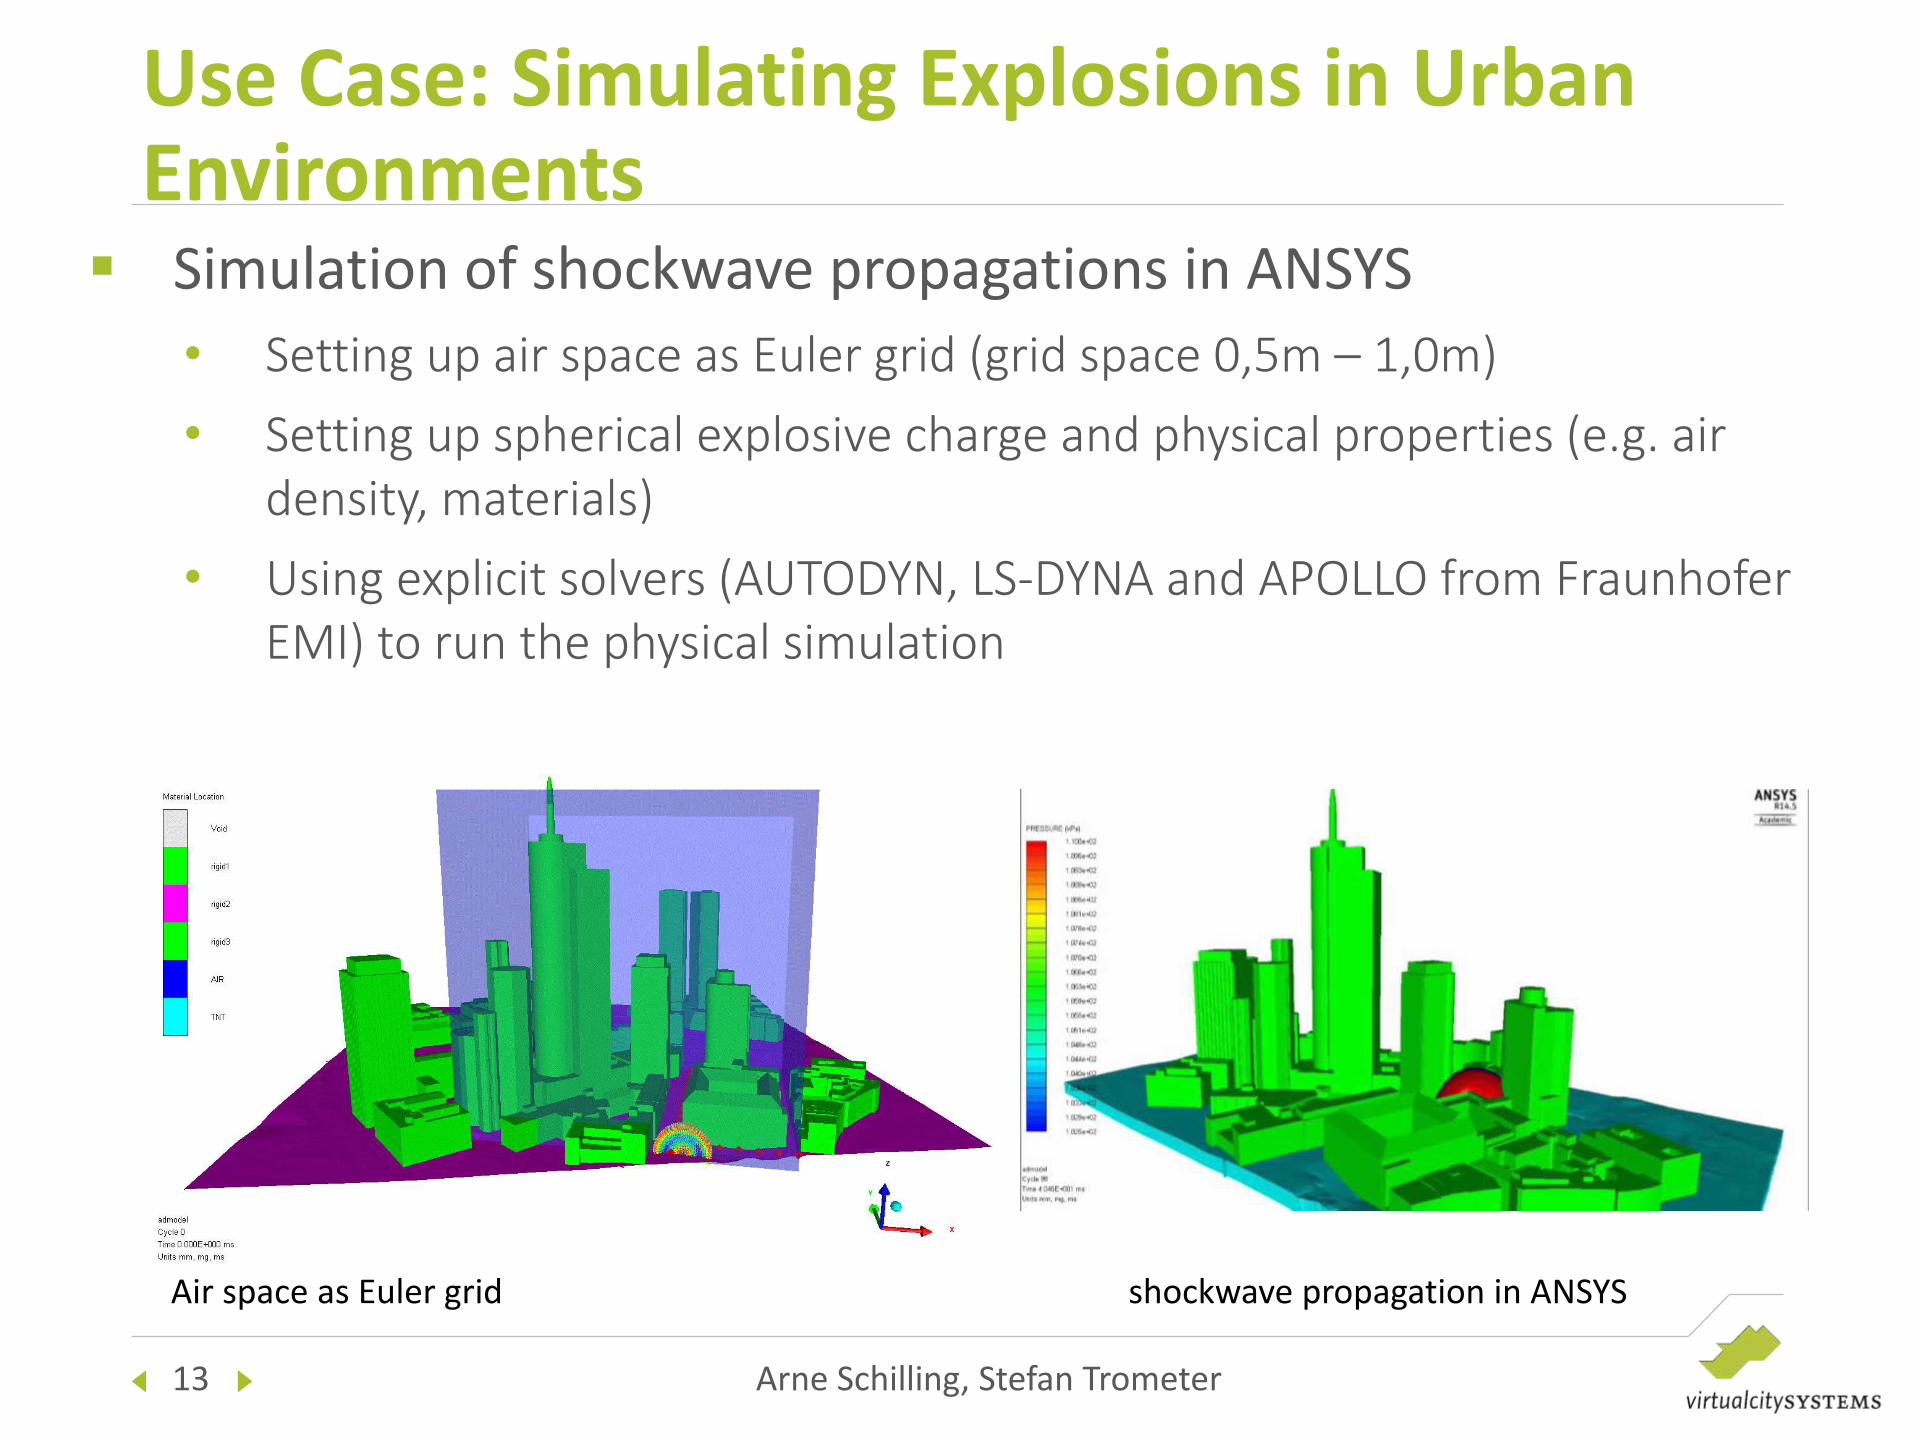
Simulation of shockwave propagations in ANSYS
• Setting up air space as Euler grid (grid space 0,5m – 1,0m)
• Setting up spherical explosive charge and physical properties (e.g. air density, materials)
• Using explicit solvers (AUTODYN, LS-DYNA and APOLLO from Fraunhofer EMI) to run the physical simulation
Use Case: Simulating Explosions in Urban Environments
Air space as Euler grid shockwave propagation in ANSYS
14 Arne Schilling, Stefan Trometer
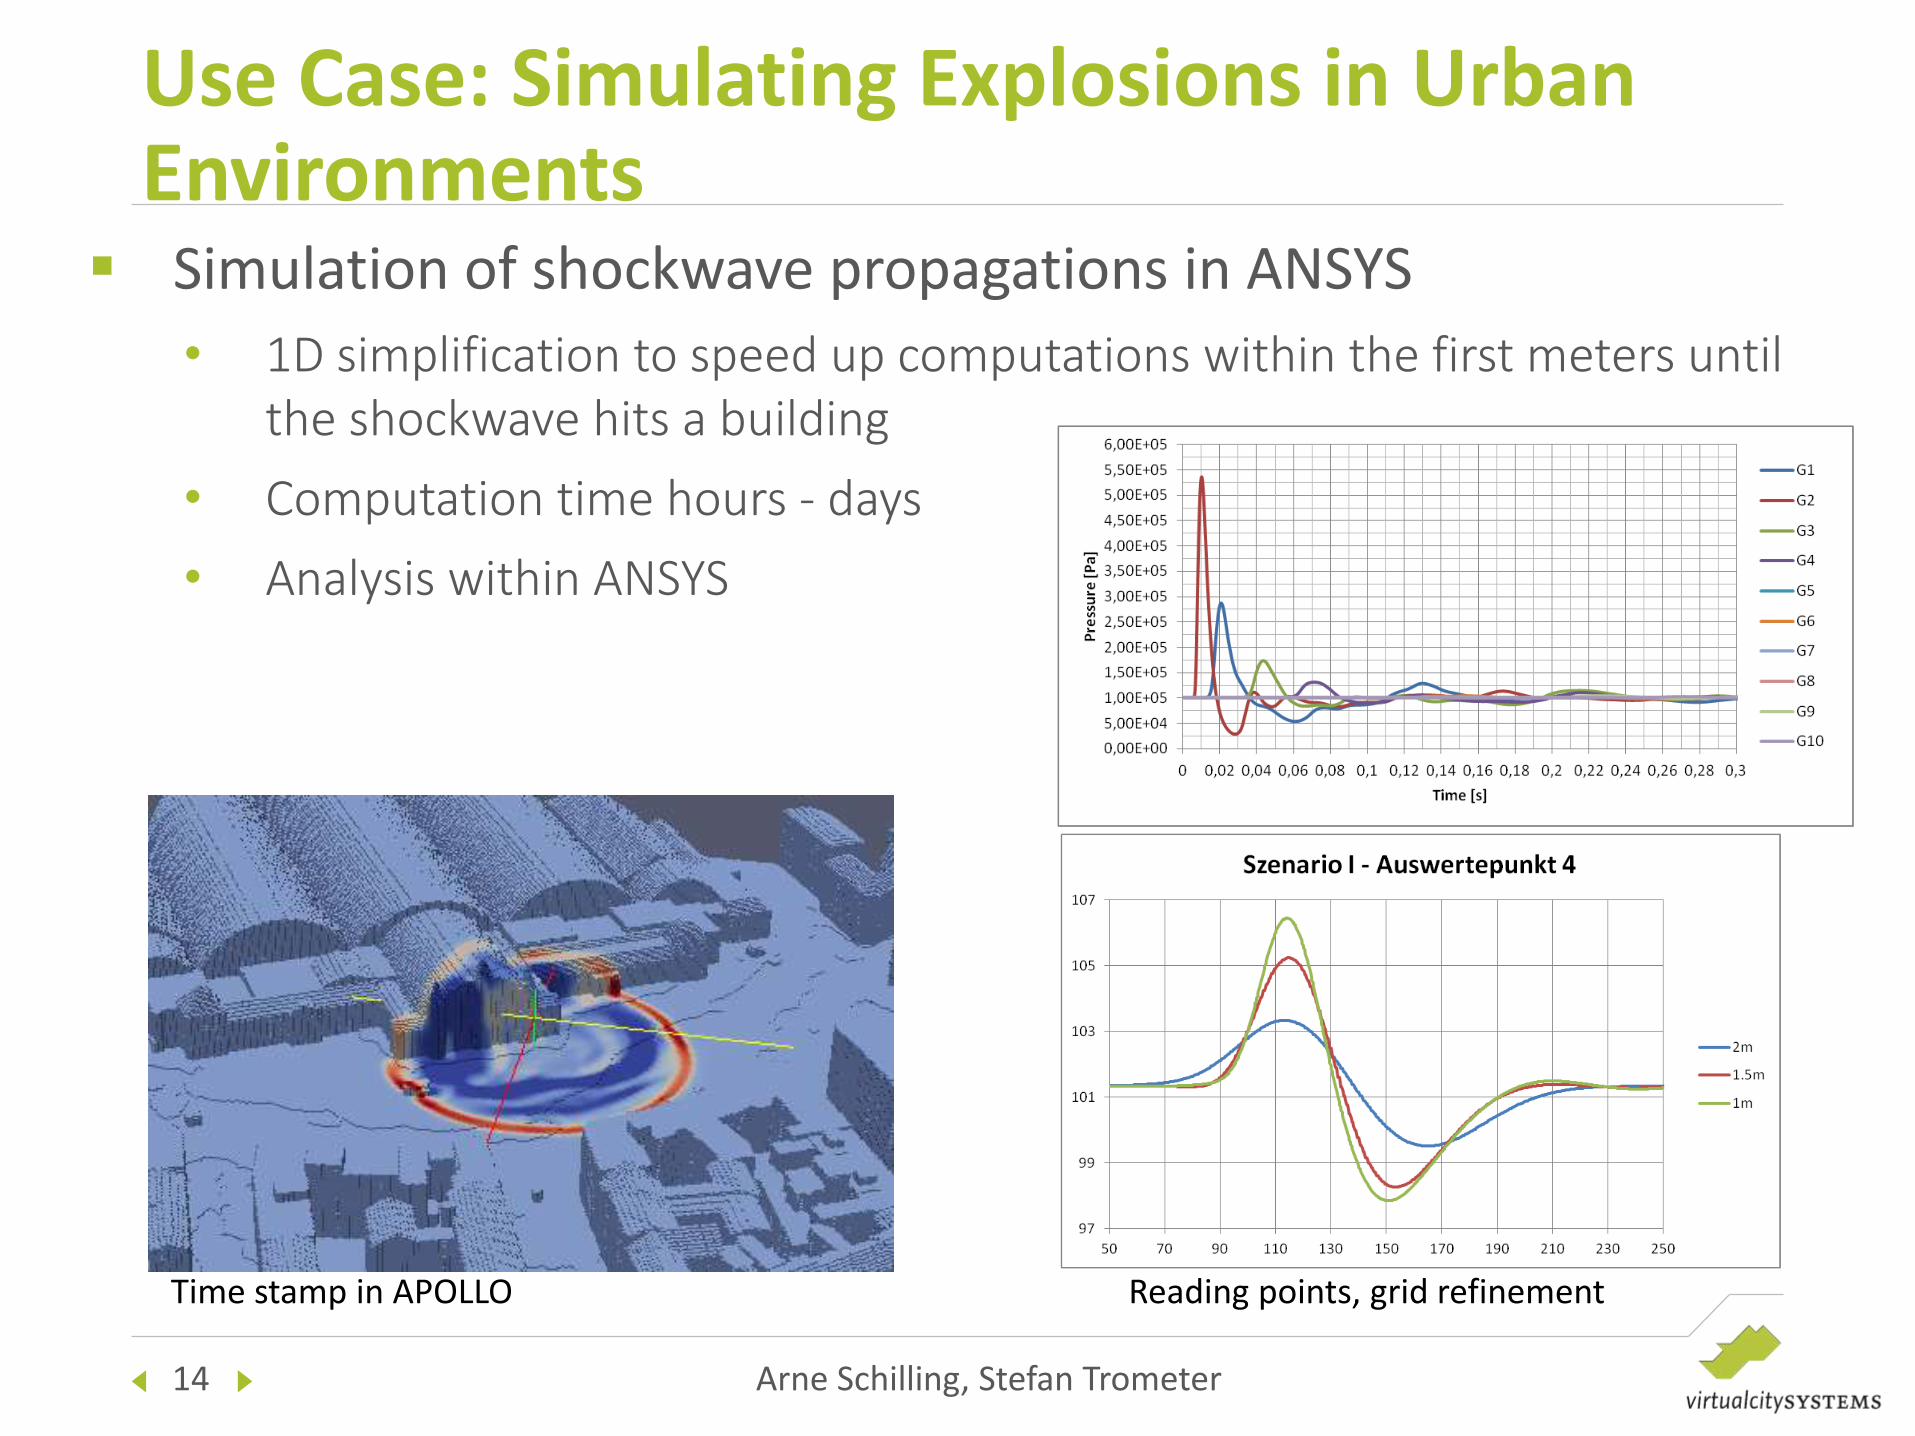
Simulation of shockwave propagations in ANSYS
• 1D simplification to speed up computations within the first meters until the shockwave hits a building
• Computation time hours - days
• Analysis within ANSYS
Use Case: Simulating Explosions in Urban Environments
Time stamp in APOLLO Reading points, grid refinement

15 Arne Schilling, Stefan Trometer
Simulation of shockwave propagations in ANSYS
• Export simulation results as 3D grid data sets for several result types:
Single time stamps
Peak overpressure
Impulse values
Damage indicators for glass, masonry, injuries based on pressure and impulse values
• Create 3D models that can be used in online portals
-> important for decision makers
Use Case: Simulating Explosions in Urban Environments
Triangulated model for visualizations Results in online portal

16 Arne Schilling, Stefan Trometer
Scenario 2: 34 ms

17 Arne Schilling, Stefan Trometer
Scenario 2: 84 ms
18 Arne Schilling, Stefan Trometer
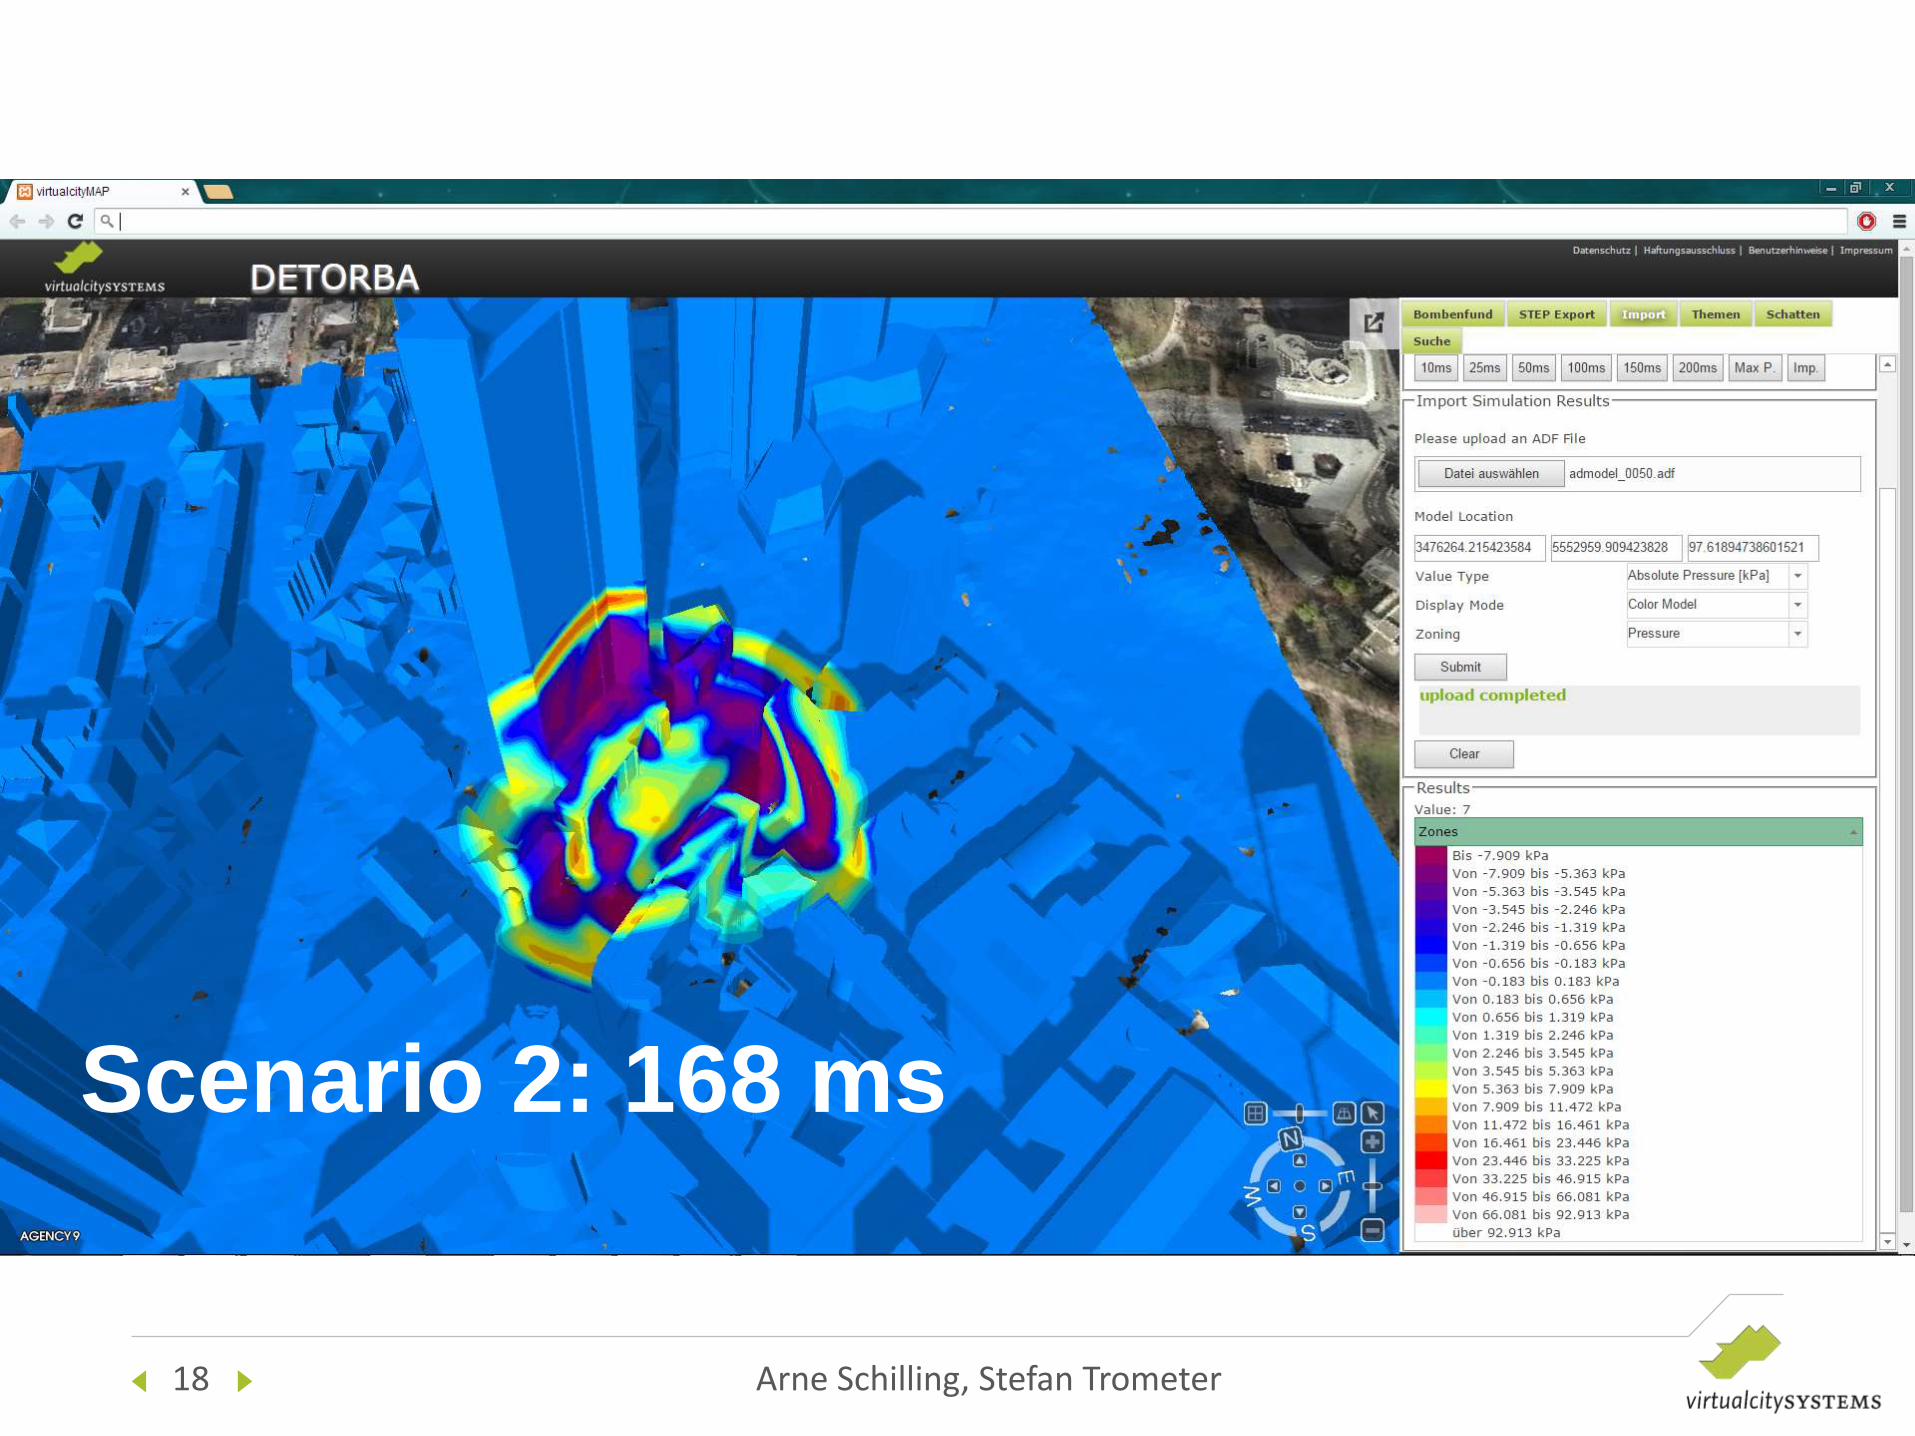
Scenario 2: 168 ms
19 Arne Schilling, Stefan Trometer
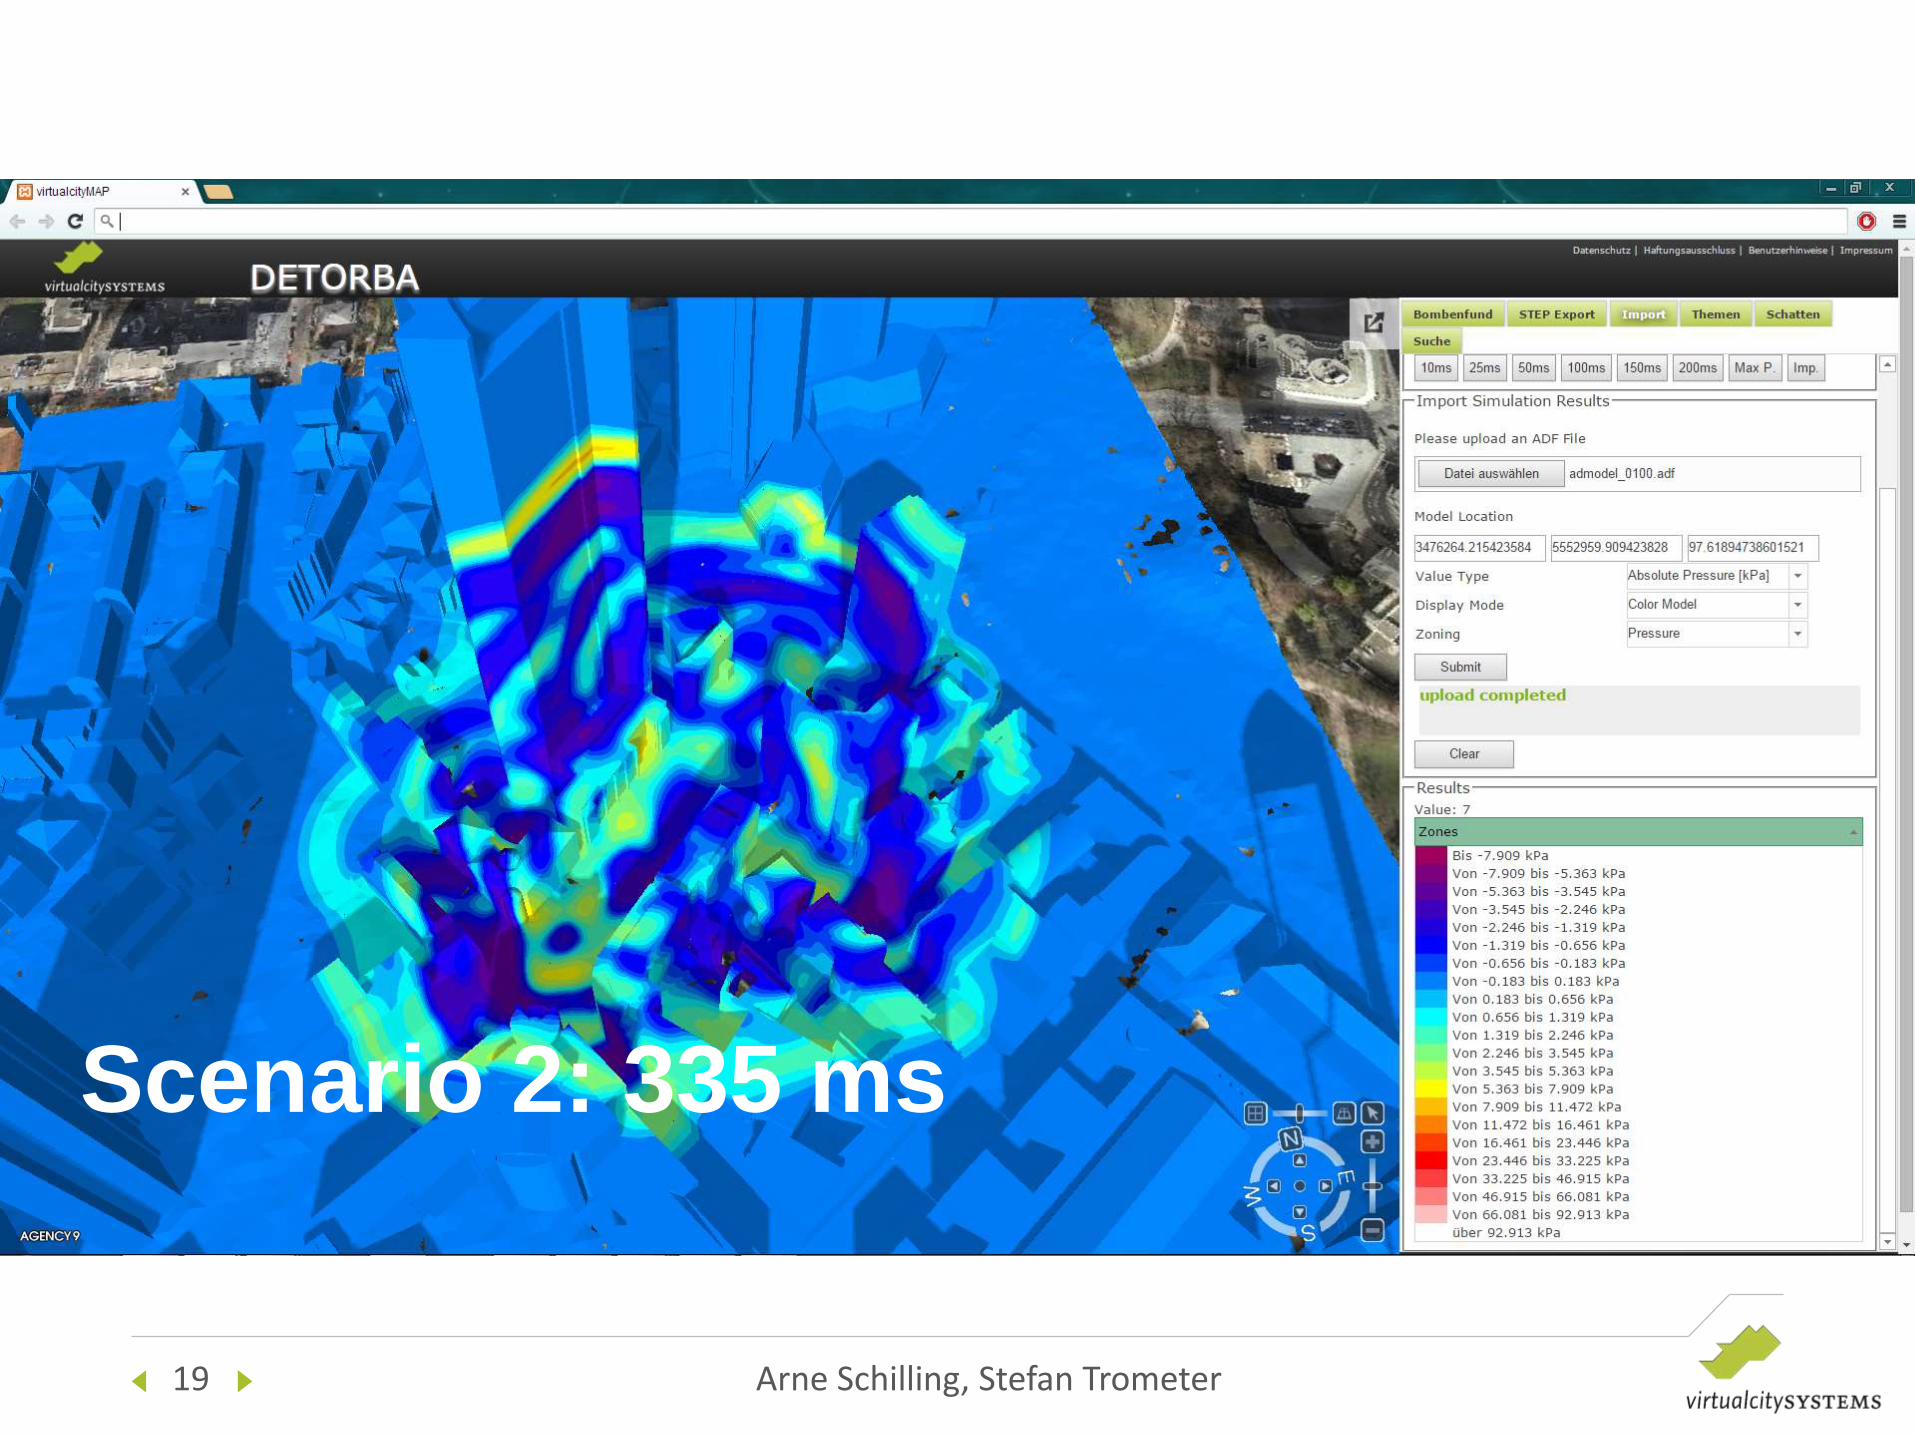
Scenario 2: 335 ms
20 Arne Schilling, Stefan Trometer
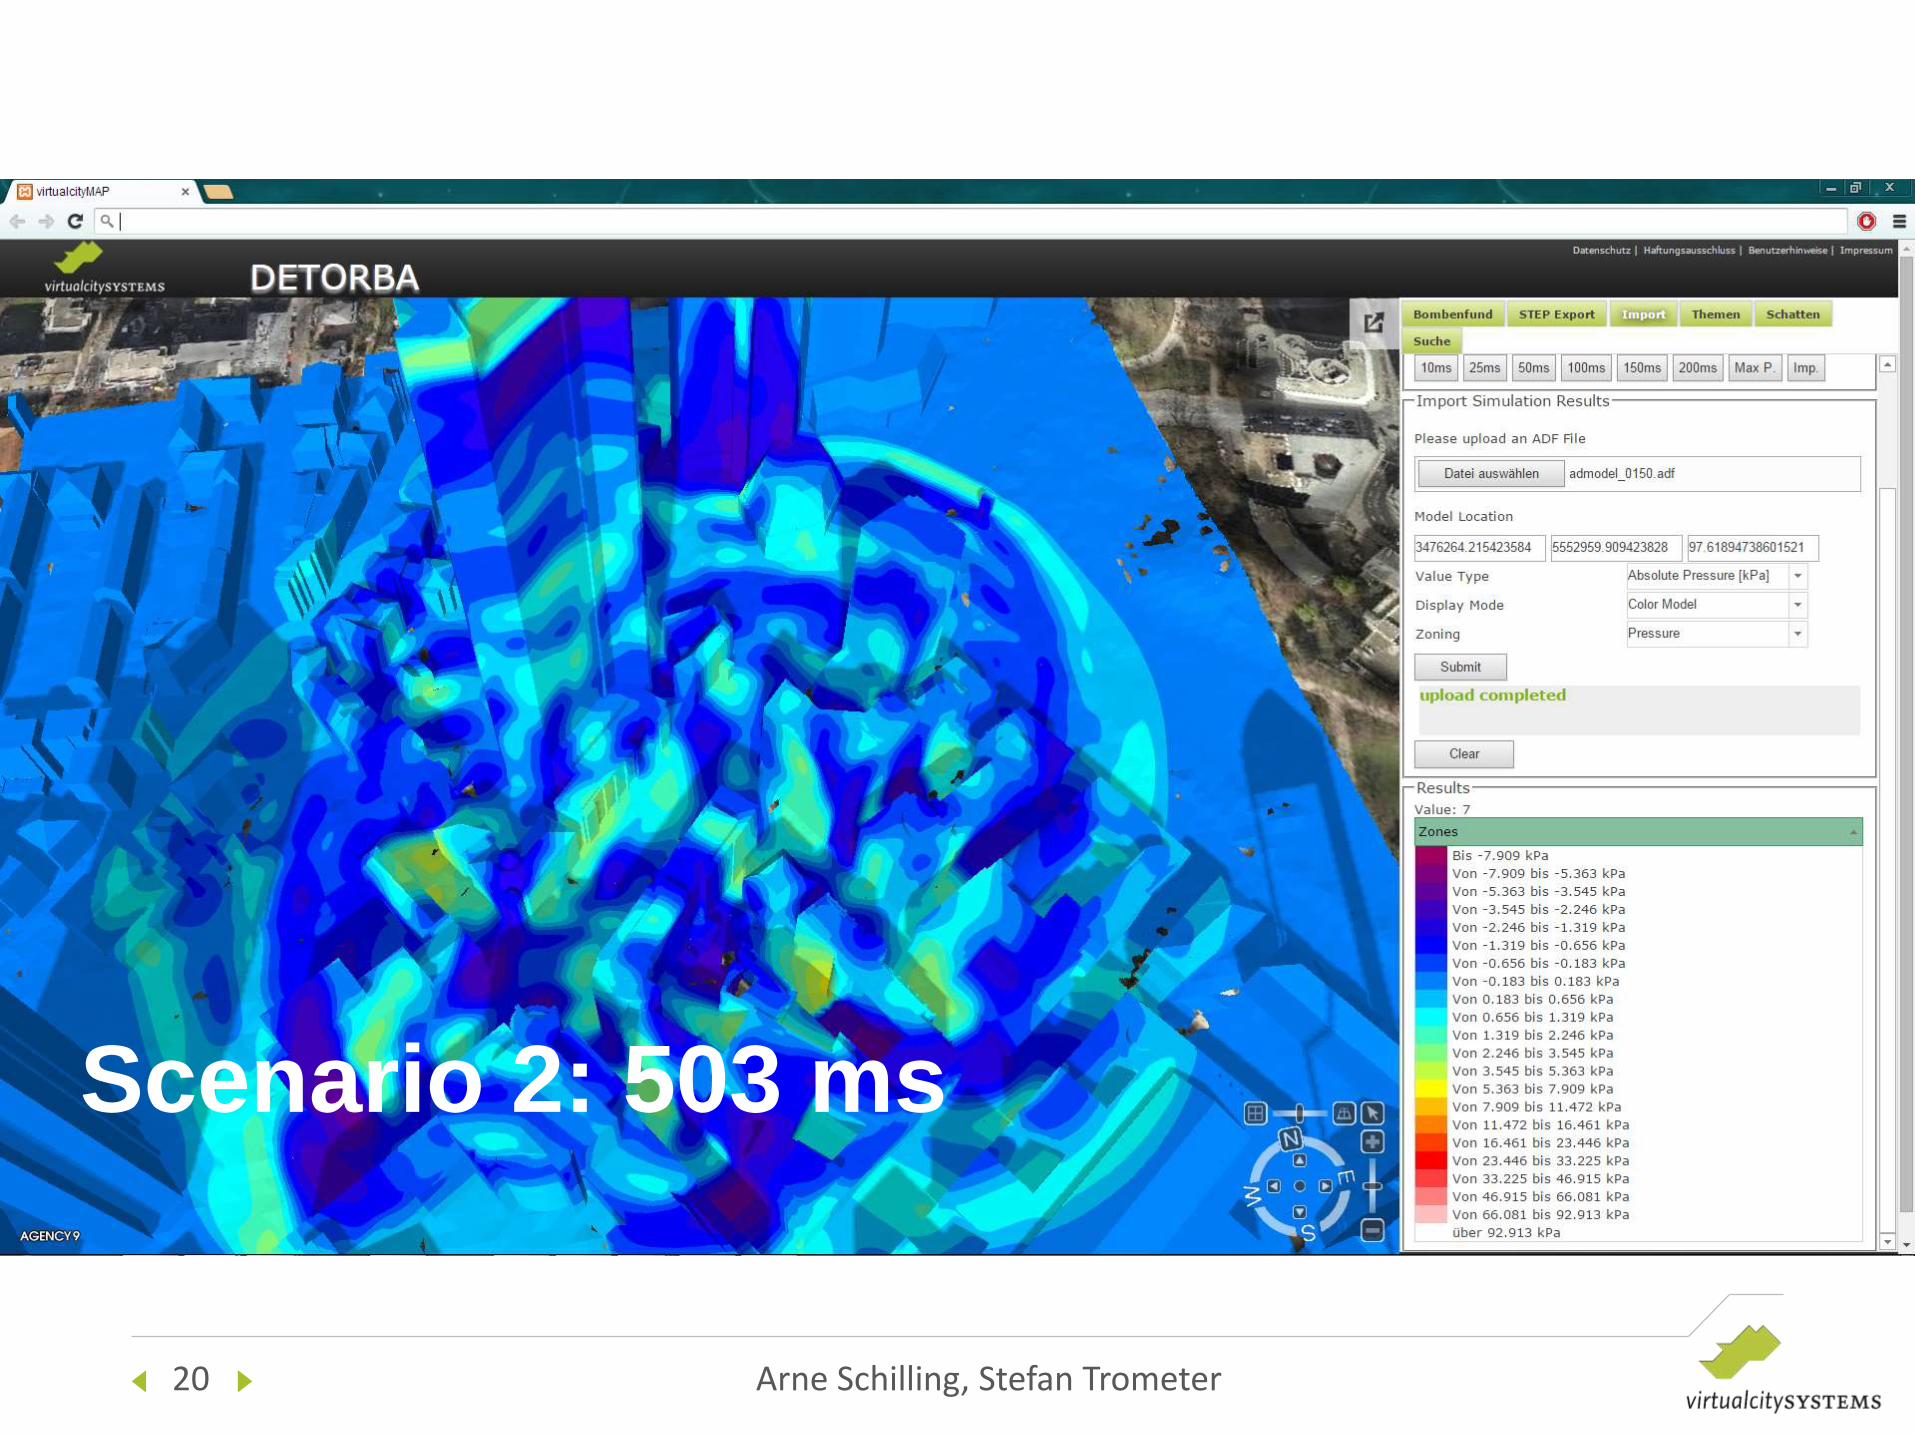
Scenario 2: 503 ms
21 Arne Schilling, Stefan Trometer
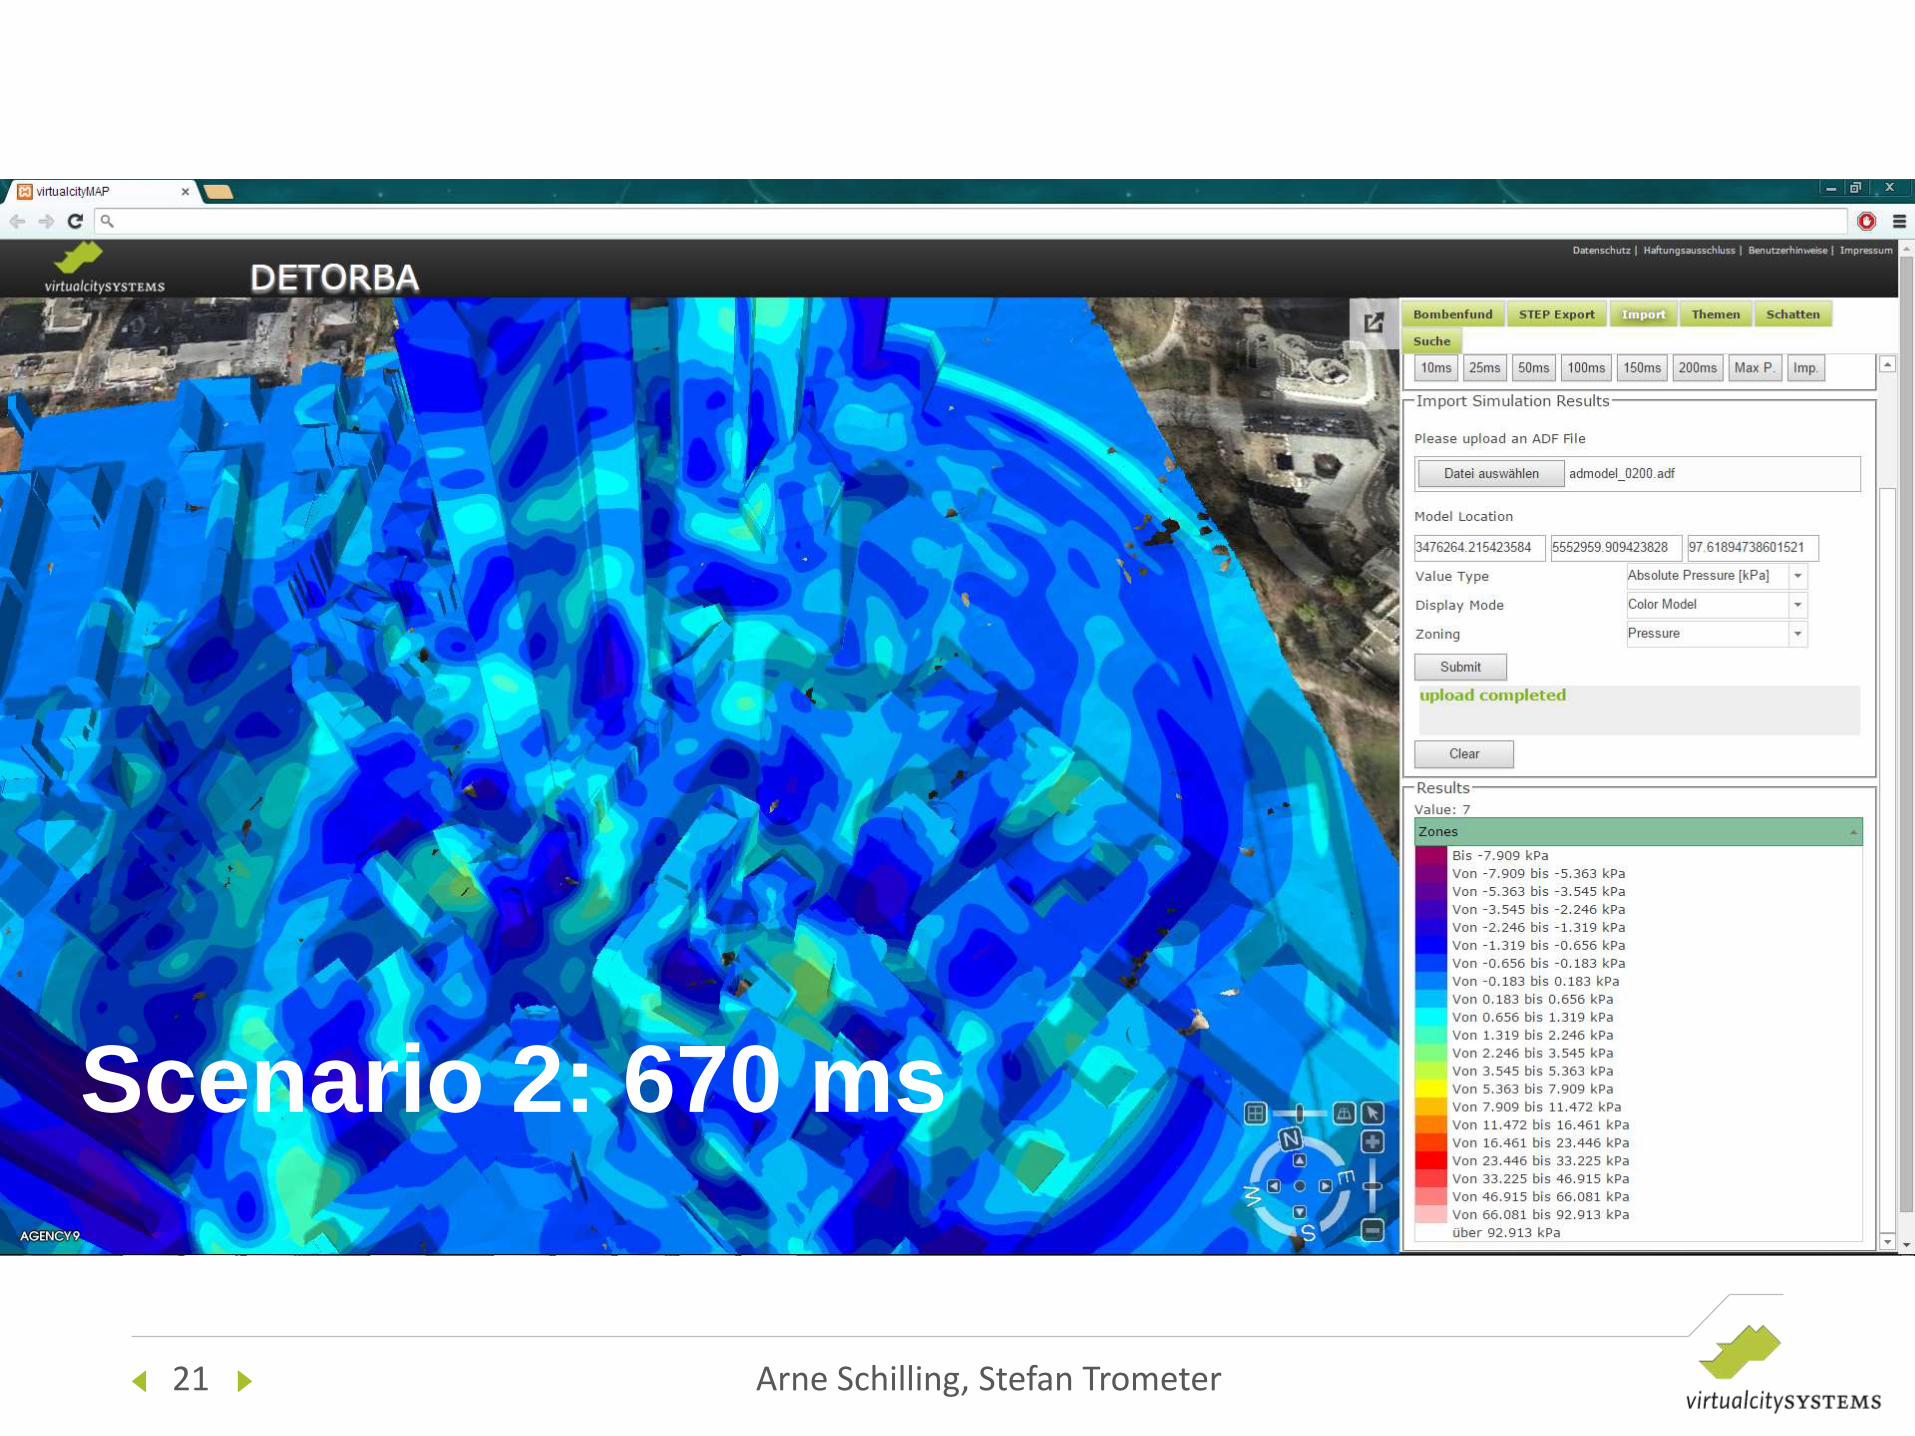
Scenario 2: 670 ms

22 Arne Schilling, Stefan Trometer
Scenario 2:
Peak Overpressure

23 Arne Schilling, Stefan Trometer
Scenario 2:
maximum Impulse

24 Arne Schilling, Stefan Trometer
Scenario 2: Damage
Categories

25 Arne Schilling, Stefan Trometer
Scenario 2: Quick
Assessment

26 Arne Schilling, Stefan Trometer
Gefahrenkarte Szenario 2
Scenario 2:
Indicator Glass
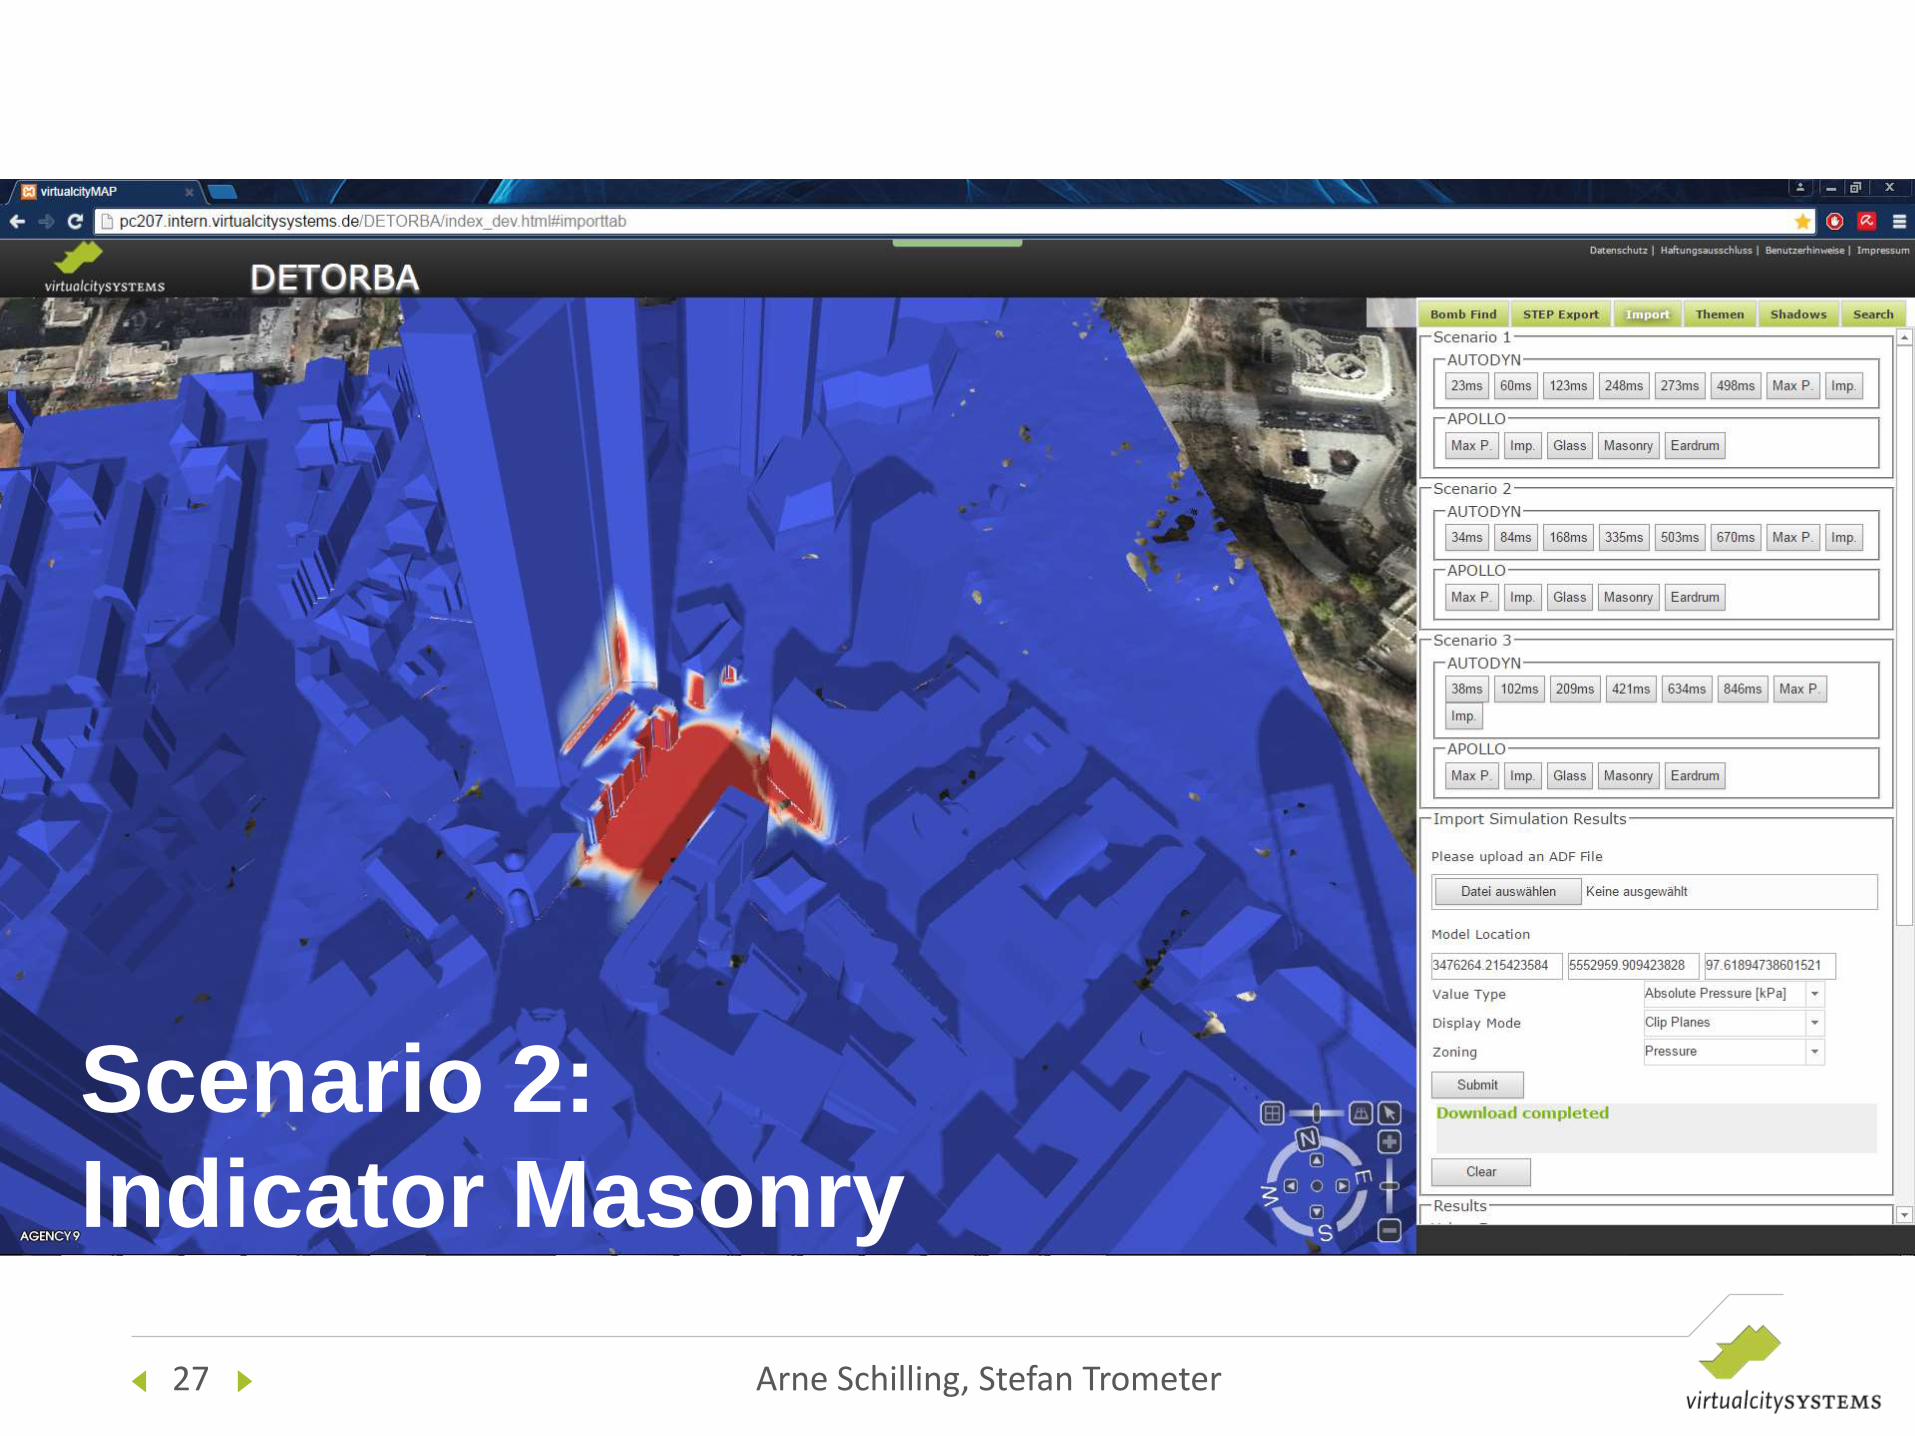
27 Arne Schilling, Stefan Trometer
Gefahrenkarte Szenario 2
Scenario 2:
Indicator Masonry

28 Arne Schilling, Stefan Trometer
Gefahrenkarte Szenario 2
Scenario 2:
Indicator Eardrum

29 Arne Schilling, Stefan Trometer
Discussion
Model Quality • CityGML LOD 2 city models (no windows, balconies etc, roof
information)
• Simulated area limited to 1x1km (limitation in ANSYS)
LOD2 model of Berlin Simulation with LOD3 model
Super-detailed simulation

30 Arne Schilling, Stefan Trometer
Discussion
Comparison of AUTODYN, APOLLO and LS-DYNA solvers • Computations in AUTYDYN and LS-DYNA took 3 days
• Computations in APOLLO took 3 hours
31 Arne Schilling, Stefan Trometer
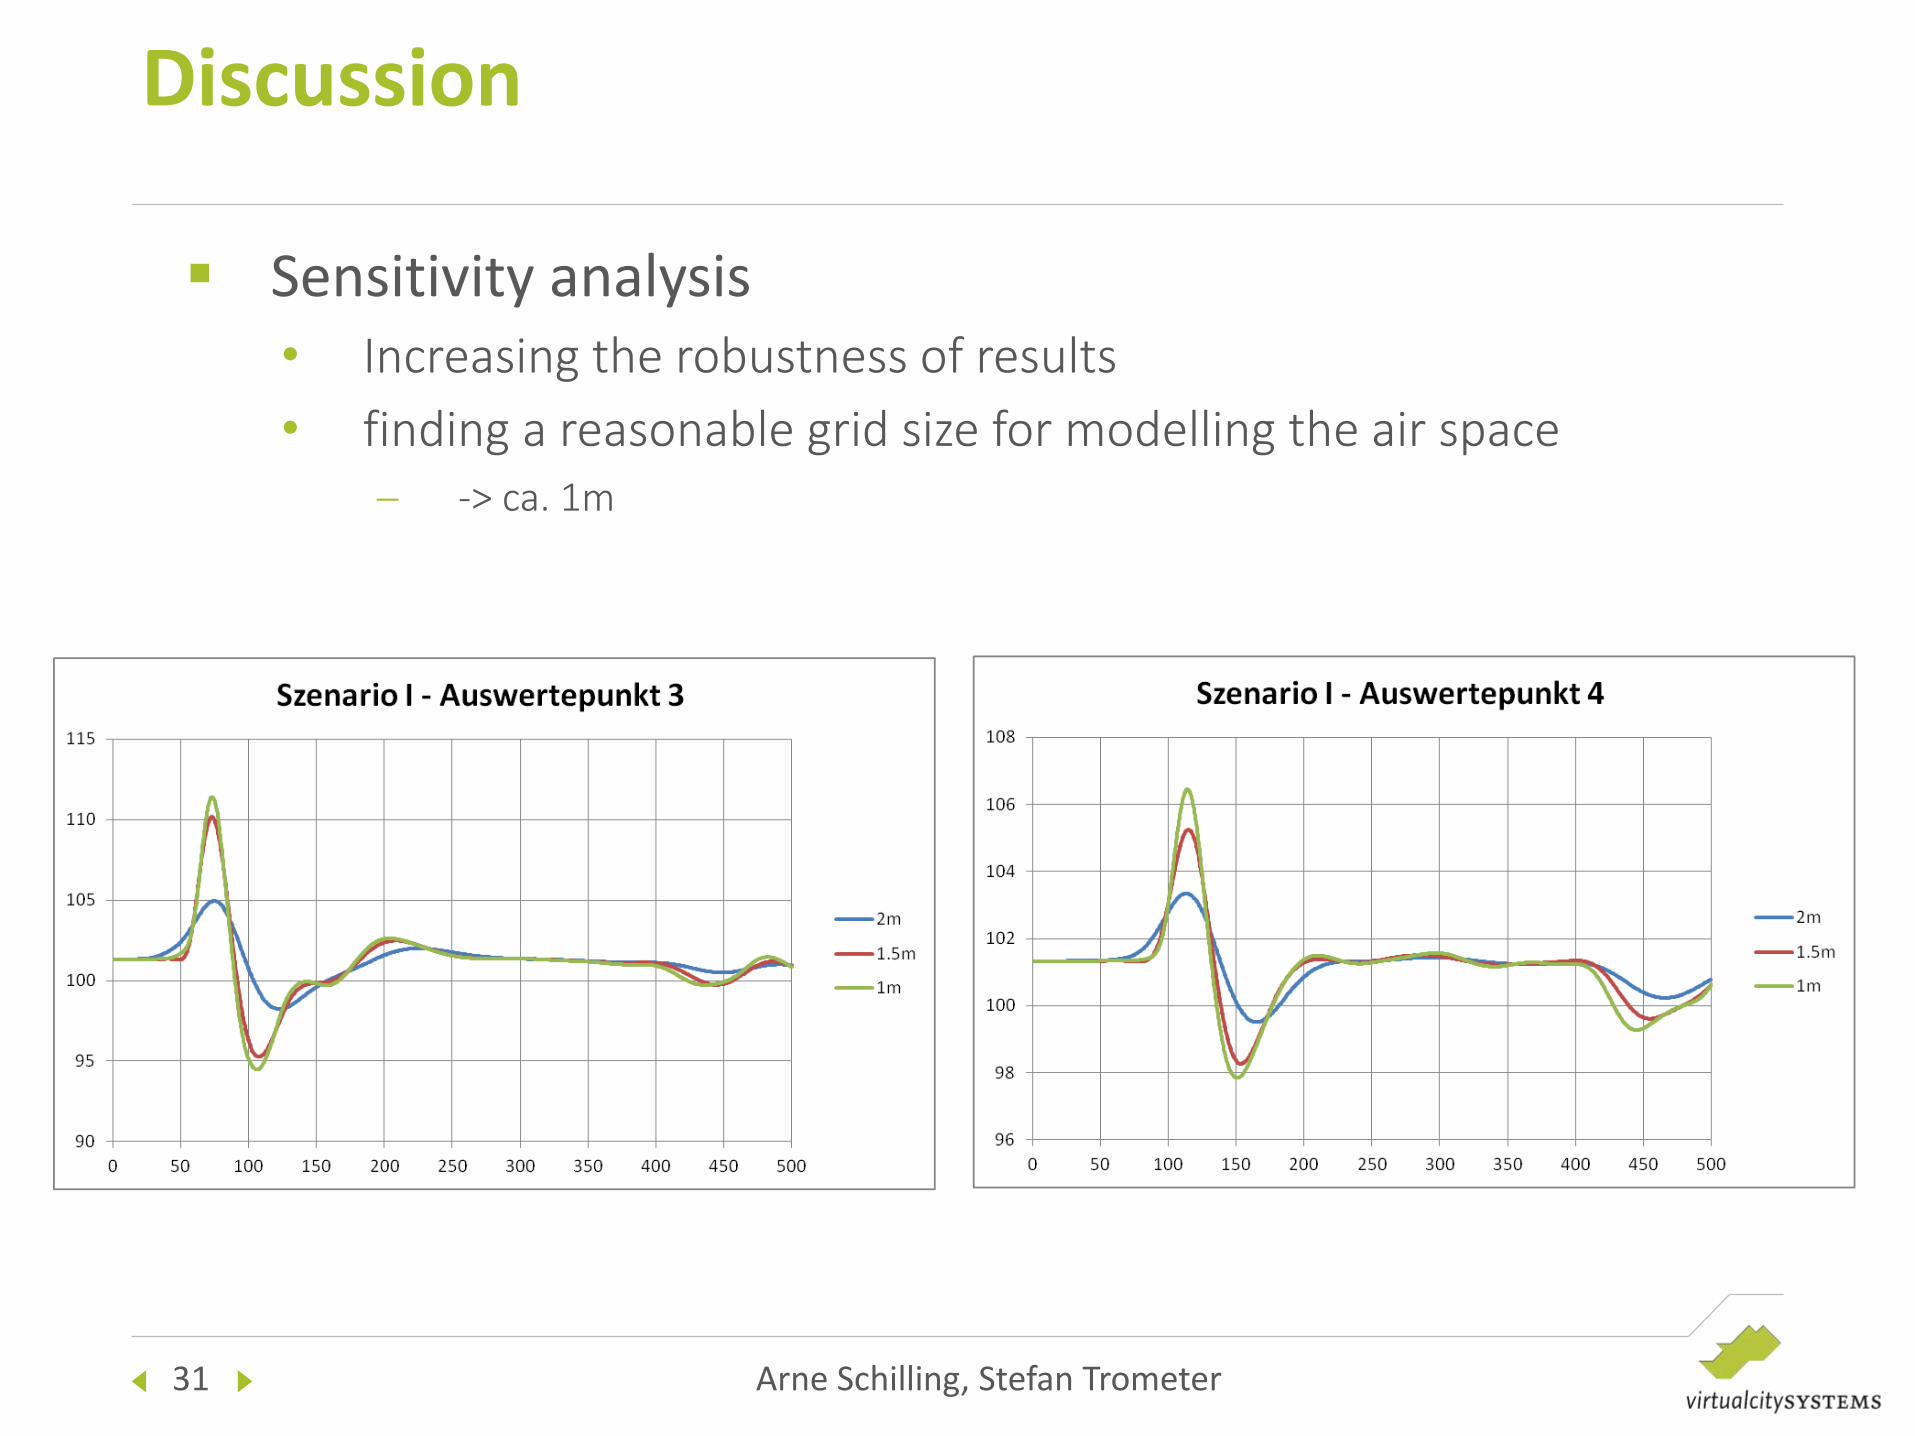
Discussion
Sensitivity analysis • Increasing the robustness of results
• finding a reasonable grid size for modelling the air space -> ca. 1m
32 Arne Schilling, Stefan Trometer
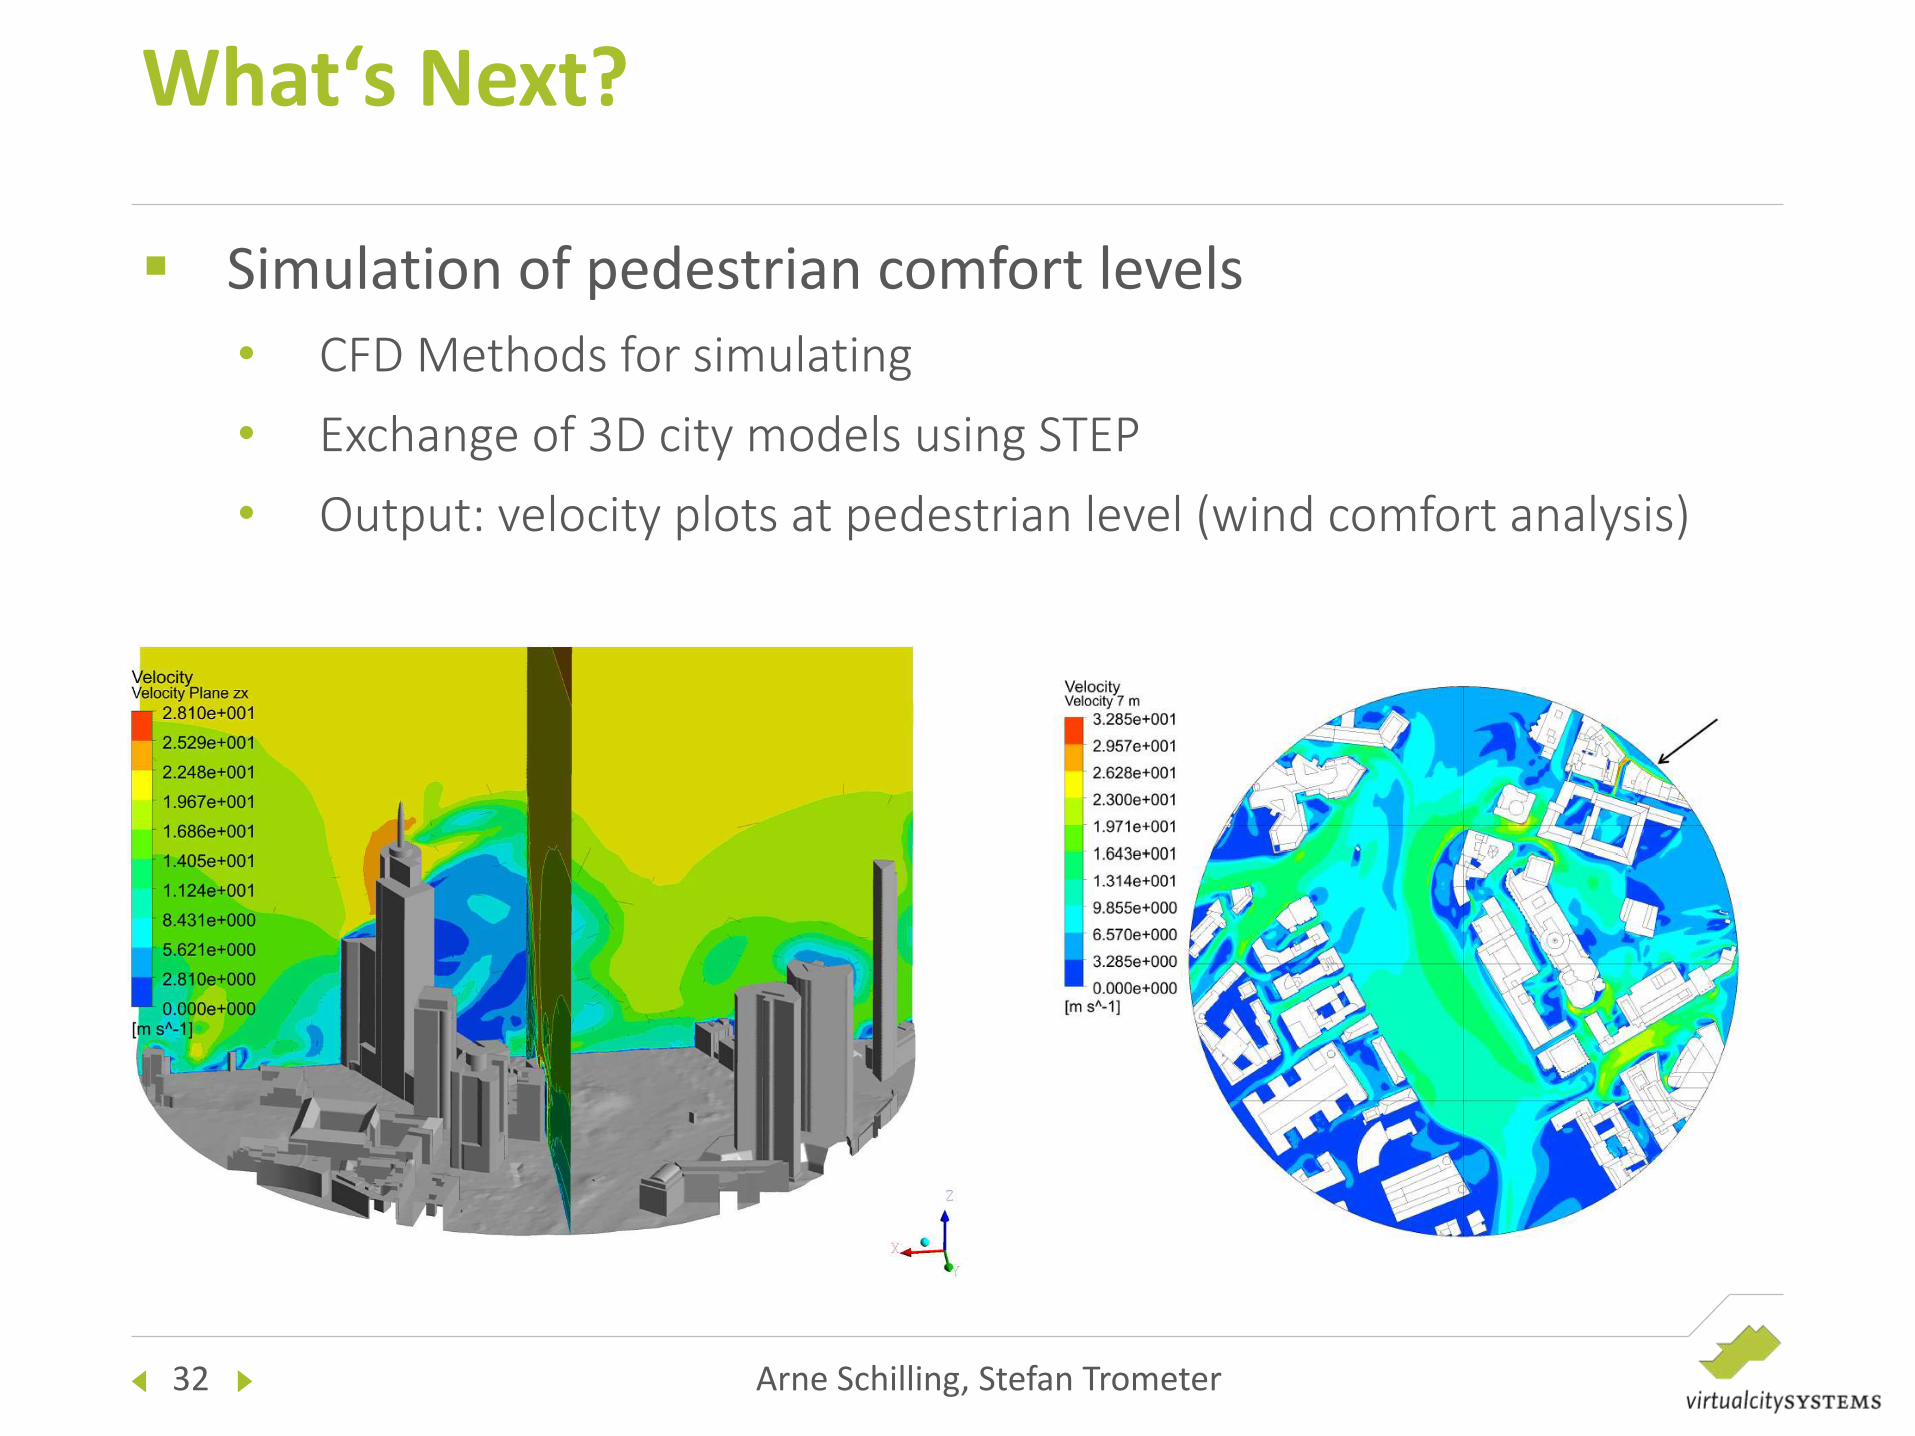
What‘s Next?
Gefahrenkarte Szenario 2 Simulation of pedestrian comfort levels
• CFD Methods for simulating
• Exchange of 3D city models using STEP
• Output: velocity plots at pedestrian level (wind comfort analysis)

Thank You Arne Schilling Stefan Trometer
virtualcitySYSTEMS GmbH CADFEM GmbH
[email protected] [email protected]
http://www.virtualcitysystems.de http://www.cadfem.de