Combining Program Visualization with Programming …complexity is defined (by providing the...
13
Journal of Technology and Science Education JOTSE, 2018 – 8(4): 268-280 – Online ISSN: 2013-6374 – Print ISSN: 2014-5349 https://doi.org/10.3926/jotse.420 COMBINING PROGRAM VISUALIZATION WITH PROGRAMMING WORKSPACE TO ASSIST STUDENTS FOR COMPLETING PROGRAMMING LABORATORY TASK Elvina Elvina , Oscar Karnalim , Mewati Ayub , Maresha Caroline Wijanto Faculty of Information Technology, Maranatha Christian University (Indonesia) [email protected], [email protected], [email protected], [email protected] Received March 2018 Accepted March 2018 Abstract Numerous Program Visualization tools (PVs) have been developed for assisting novice students to understand their source code further. However, none of them are practical to be used in the context of completing programming laboratory task; students are required to keep switching between PV and programming workspace since PV’s features are considerably limited for developing programming solution from scratch. This paper combines PV with programming workspace to handle such issue. Resulted tool (which is named PITON) has 13 features extracted from PythonTutor (a program visualization tool), PyCharm (a programming workspace), and student’s feedbacks about PythonTutor. According to think-aloud and user study, PITON is more practical to be used than a combination of PythonTutor and PyCharm. Further, its features are considerably helpful; students rated these features as useful and frequently used. Keywords – Educational tool, Program visualization, Programming workspace, Programming, Computer science education. ---------- 1. Introduction When learning programming, one of the most important skills to master is to build a mental model of how source code fragments correspond to runtime processes (Sorva & Juha, 2013). Learner should know how each instruction works and empirically deduct what will happen if several instructions are executed in sequence. For novice learners (e.g., undergraduate Computer Science students), mastering such skill is not trivial; some of them have no experiences in programming beforehand and most programming concepts are abstract. Therefore, several Program Visualization tools (PVs) have been developed to handle such issue (Sorva, Karavirta & Malmi, 2013). These tools are expected to train novice learners for building a mental model by visualizing how instructions work on a source code. Nevertheless, to our knowledge, none of them are specifically designed to assist learners for writing a solution in programming laboratory session; most of them are more focused on visualization, without providing a comprehensive environment to write the code directly. Consequently, when used as a supplementary tool in programming laboratory session, a dedicated programming workspace is still required for writing the code. Learner should keep switching between PV and programming workspace to write the solution and utilize program visualization at once. We would argue that such mechanism is discouraging for learners because, in most occasions, programming tasks should be completed in a limited time. To fill such gap, this paper proposes a tool which combines PV and programming workspace. This tool is named PITON (Python InTegrated wOrkspace and visualizatioN). It does not only provide a visualization to enhance -268-
Transcript of Combining Program Visualization with Programming …complexity is defined (by providing the...
Journal of Technology and Science EducationJOTSE, 2018 – 8(4): 268-280 – Online ISSN: 2013-6374 – Print ISSN: 2014-5349
https://doi.org/10.3926/jotse.420
COMBINING PROGRAM VISUALIZATION WITH PROGRAMMINGWORKSPACE TO ASSIST STUDENTS FOR COMPLETING PROGRAMMING
LABORATORY TASK
Elvina Elvina , Oscar Karnalim , Mewati Ayub , Maresha Caroline Wijanto
Faculty of Information Technology, Maranatha Christian University (Indonesia)
[email protected], [email protected], [email protected], [email protected]
Received March 2018Accepted March 2018
Abstract
Numerous Program Visualization tools (PVs) have been developed for assisting novice students to understandtheir source code further. However, none of them are practical to be used in the context of completingprogramming laboratory task; students are required to keep switching between PV and programming workspacesince PV’s features are considerably limited for developing programming solution from scratch. This papercombines PV with programming workspace to handle such issue. Resulted tool (which is named PITON) has 13features extracted from PythonTutor (a program visualization tool), PyCharm (a programming workspace), andstudent’s feedbacks about PythonTutor. According to think-aloud and user study, PITON is more practical to beused than a combination of PythonTutor and PyCharm. Further, its features are considerably helpful; studentsrated these features as useful and frequently used.
Keywords – Educational tool, Program visualization, Programming workspace, Programming, Computerscience education.
----------
1. Introduction
When learning programming, one of the most important skills to master is to build a mental model of howsource code fragments correspond to runtime processes (Sorva & Juha, 2013). Learner should know how eachinstruction works and empirically deduct what will happen if several instructions are executed in sequence. Fornovice learners (e.g., undergraduate Computer Science students), mastering such skill is not trivial; some of themhave no experiences in programming beforehand and most programming concepts are abstract. Therefore,several Program Visualization tools (PVs) have been developed to handle such issue (Sorva, Karavirta & Malmi,2013). These tools are expected to train novice learners for building a mental model by visualizing howinstructions work on a source code.
Nevertheless, to our knowledge, none of them are specifically designed to assist learners for writing a solution inprogramming laboratory session; most of them are more focused on visualization, without providing acomprehensive environment to write the code directly. Consequently, when used as a supplementary tool inprogramming laboratory session, a dedicated programming workspace is still required for writing the code.Learner should keep switching between PV and programming workspace to write the solution and utilizeprogram visualization at once. We would argue that such mechanism is discouraging for learners because, in mostoccasions, programming tasks should be completed in a limited time.
To fill such gap, this paper proposes a tool which combines PV and programming workspace. This tool is namedPITON (Python InTegrated wOrkspace and visualizatioN). It does not only provide a visualization to enhance
-268-

Journal of Technology and Science Education – https://doi.org/10.3926/jotse.420
learner’s mental model but also a programming workspace environment to develop the code directly. Asits name states, PITON is exclusively designed to handle Python source code (Python is chosen as ourtarget language since it is frequently used to introduce programming in most academic institutions (Guo,2013)). To enhance its effectiveness further, PITON will be developed by considering student feedbacksabout PythonTutor, a PV tool which features, to some extent, are similar with PITON. These feedbacksare extracted from (Karnalim & Ayub, 2017a, 2017b).
2. Related Work
According to several studies about CS undergraduate students (Lister, Seppälä, Simon, Thomas, Adams,Fitzgerald et al., 2004; McCracken, Almstrum, Diaz, Guzdial, Hagan, Kolikant et al., 2001), some studentsfind it difficult to learn CS materials. They argue that some CS concepts are abstract and difficult to beunderstood. Hence, to handle such issue, some educational tools have been developed. Those tools can beclassified into two categories: algorithm-oriented and programming-oriented educational tool.
Algorithm-oriented Educational Tool (AT) assists learners to understand well-known algorithms. One ofits examples is AP-ASD1 (Christiawan & Karnalim, 2016). It covers algorithms for manipulating basicdata structures (e.g., array, stack, queue, and linked list). This tool is inspired from VisuAlgo (Halim, Koh,Loh & Halim, 2012), another AT which is focused on visualizing algorithm.
Instead of focusing on algorithms for manipulating data structure, some ATs focus on algorithmstrategies. One of them is a work proposed in (Jonathan, Karnalim & Ayub, 2016). It assists learners tounderstand brute force, greedy, backtracking, and dynamic programming algorithm from two case studies:0/1 Knapsack and Minimum Spanning Tree. Another example is a tool proposed in (Zumaytis &Karnalim, 2017). It covers brute force and branch & bound algorithm toward Traveling SalespersonProblem.
Considering algorithm strategy is subject to change depends on given problem, some tools assist learnersto design their own algorithm strategy. GreedEx (Velázquez-Iturbide & Pérez-Carrasco, 2009) is an ATwhich lets learners to try and evaluate their own-defined greedy algorithm. This tool is extended toGreedExCol (Debdi, Paredes-Velasco & Velázquez-Iturbide, 2015) by incorporating collaborative learning.On the other, Complexitor (Elvina & Karnalim, 2017) lets learners to understand how algorithm timecomplexity is defined (by providing the implementation of target algorithm or source code).
It is important to note that not all ATs are focused on well-known algorithms on algorithmic courses. Forinstance, VPMM (Desai, Kulkarni, Vasant Vaibhav, Varalakshmi & Mohamed, 2002) focuses on matrixmultiplication topic. Another example is a work proposed in (da Silva Lourenço, de Araujo Lima & Alvesde Araújo, 2017) which focuses on network optimization problem.
Programming-oriented Educational Tool (PT) assists learners to understand programming. In mostoccasions, it is featured with visualization considering illustration may help students to recall explainedinformation (Mayer, 1989). According to the way visualization is used, PT can be further classified intotwo categories: Visual Programming and Program Visualization tool. Visual Programming tool (VP) letslearners to understand programming without interacting with the source code directly. One of thebackgrounds behind such development is the fact that learners struggle with technical details such asremembering syntaxes (Denny, Luxton-Reilly, Tempero & Hendrickx, 2011). Scratch (Resnick, Silverman,Kafai, Maloney, Monroy-Hernández, Rusk et al., 2009), Alice (Cooper, Dann & Pausch, 2000) andGreenfoot (Kölling, 2010) are three popular examples of VP. Other two examples of VP are Raptor(Carlisle, Wilson, Humphries & Hadfield, 2005) and SFC Editor (Watts, 2004). Unique to these tools,interaction is limited to the creation of flowchart.
Nevertheless, since programming cannot be mastered without direct interaction, Program Visualizationtool (PV) is introduced. Jeliot 3 (Moreno, Myller, Sutinen & Ben-Ari, 2004), VILLE (Rajala, Laakso, Kalla& Salakoski, 2007), and PythonTutor (Guo, 2013) are three examples of such tool. According to their
-269-

Journal of Technology and Science Education – https://doi.org/10.3926/jotse.420
long-term evaluation in (Maravić Čisar, Pinter & Radosav, 2011), (Kaila, Rajala, Laakso & Salakoski, 2010),and (Karnalim & Ayub, 2018) respectively, they are considerably helpful to assist novice learners.
Some PVs are equipped with unique features to enhance learners’ understanding further. First, SeeC(Egan & McDonald, 2014) utilizes natural language sentences to provide a clearer understanding. Second,Omnicode (Kang & Guo, 2017) utilizes live programming environment (i.e., auto-compile environment)on the top of PythonTutor (Guo, 2013) to enhance learners’ understanding further. Third, Verificator(Radošević, Orehovački & Lovrenčić, 2009) limits learners’ interaction per compilation to mitigatetremendous errors occurred at once. Last, SRec (Velázquez-Iturbide, Pérez-Carrasco & Urquiza-Fuentes,2008) incorporates unique view to provide clear visualization for recursion.
Works proposed in (Karnalim & Ayub, 2017b, 2018) state that PV can be used as a supplementary tool tohelp undergraduate students in completing their laboratory task. When students are confused about howtheir code works, they could use PV as an alternative solution to understand their code by themselves. It istrue that asking for a help from instructors (i.e., lecturer and their assistants) is more convenient. However,due to the high number of student, instructors are not guaranteed to be able to assist all students.
Our informal observation shows that utilizing PV along with a standard programming workspacedevelops an issue: the students should copy and paste their code from workspace to PV each time theywant to understand how their code works. Such mechanism might be discouraging for students since ittakes a considerable amount of time. Further, in most occasions, they have no time to do that due tolimited time provided for completing programming task.
One of the solutions to mitigate aforementioned issue is to treat PV as a programming workspace.However, most PVs are not featured with comprehensive workspace’s features (e.g., advanced filemanipulation). Such condition may discourage students for using given tool. Another solution is to use atool for Literate Programming (Knuth, 1984), such as Jupyter Notebook (http://jupyter.org/), as areplacement of both PV and programming workspace. Nevertheless, we would argue that given tool isquite complicated to be used and its visualization is not as clear as PV; a tool for Literate Programming isnot primarily focused on novice students. Further, its feature for collaboration may lead to illegal activitiessuch as plagiarism.
3. PITON Design and ImplementationThis paper proposes a tool that combines PV and programming workspace to assist undergraduatestudents for completing their programming laboratory task. Resulted tool – which is called PITON – isexpected to solve application-switching issue that occurs when PV is used along with programmingworkspace to complete programming task. To gain the benefits from both PV and programmingworkspace, PITON’s features will be derived from existing PV and programming workspace, namelyPythonTutor (Guo, 2013) and PyCharm (https://www.jetbrains.com/pycharm/) respectively.
Three major features are derived from PythonTutor: step-by-step visualization, variable content display,and current line highlighting. Step-by-step visualization enables jumping to previous or next executionstate to see occurred change. The change for each state is displayed using variables content display andcurrent line highlighting. The former feature displays all involved variables in key-value pairs (where keyrefers to variable name and value refers to its value) while the latter one marks the current line that isbeing processed.
Those features are combined with three additional major features derived from PyCharm: standard filemanipulation, compile & run, and syntax highlighting. Standard file manipulation enables creating,opening, updating, and deleting source code file. Compile & run enables further checking of source codebehavior by converting given code to running program. Syntax highlighting enhances students’convenience by displaying source code syntaxes with unique color set (as in typical programmingworkspace).
-270-

Journal of Technology and Science Education – https://doi.org/10.3926/jotse.420
In addition to major features, seven minor features derived from student’s feedbacks about PythonTutor(Karnalim & Ayub, 2017a, 2017b) are also incorporated:
a) No-internet-connection design enables PITON to be used without relying on internetconnection. It is implemented by designing PITON as a standalone offline desktop application.This feature is a response of a claim: internet connection in our country is considerably slow.
b) Noticeable input text field accentuates the existence of input text field by providing attractivecolor and larger size. This feature is a response to a claim: input text field on PythonTutor isconsiderably hard to be noticed.
c) The multiple-inputs mechanism enables numerous input entities to be given at once. This featureis a response to a claim: providing one input entity at a time is considerably discouraging forexecuting source code with numerous inputs.
d) Changed variable highlighting marks updated variables with different color during visualization.This feature is a response to a claim: it is difficult to find out which variables are affected by theexecution of current instructions.
e) Error message simplification generates simpler error message to avoid confusion. This feature is aresponse to a claim: standard error messages are not helpful for some students due to theircomplexity.
f) Once-at-a-time adaptation enables students to adapt with both PV and programming workspaceat oce. This feature is a response to a claim: adapting PV takes a considerable amount of time inaddition to the time required for adapting programming workspace.
g) Direct visualization enables visualization to be generated directly from programming workspace.This feature is a response to a claim: copying and pasting source code from programmingworkspace to PV may generate some technical issues.
It is important to note that the rest of feedbacks about PythonTutor (Karnalim & Ayub, 2017a, 2017b)are excluded from our consideration since, from our perspective, they do not enhance studentunderstanding further. For instance, error-corrector is not provided in PITON even though somestudents asked for it. We do not want PITON to over-pamper the students, mitigating their programmingskill development.
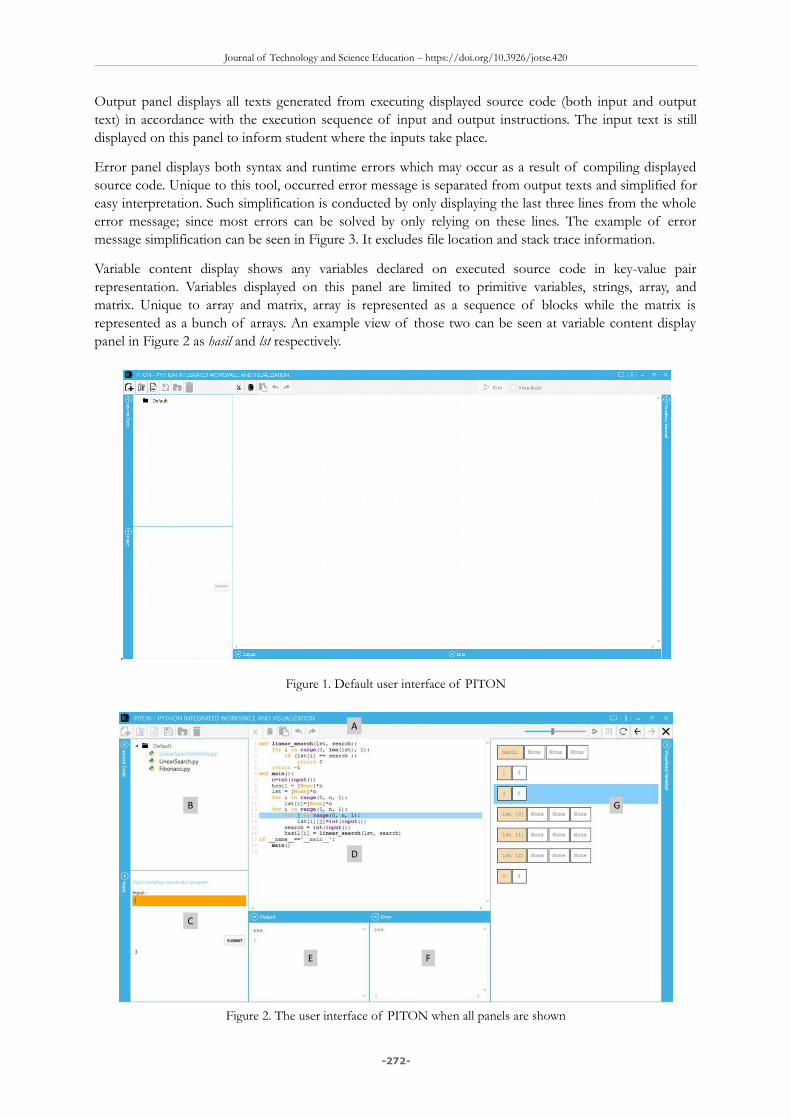
The user interface of PITON can be seen in Figure 1 (for default view) and Figure 2 (for complete viewwhere all panels are shown). It consists of 7 panels: command toolbar, working directory observer, inputpanel, source code editor, output panel, error panel, and variable content display panel. These panels arereferred as A-G respectively in Figure 2.
Command toolbar contains all command buttons for both manipulating and visualizing source code.Student can select one of these buttons to perform an action.
Working directory observer shows all source codes from working directory. Student can select and changecurrent working directory by clicking open directory button on command toolbar. Further, they can alsochange source code displayed on editor panel by clicking one source code file name on this panel.
Input panel accepts inputs required to execute displayed source code. Three input mechanisms areprovided. First, one-input-entity-at-a-time asks student to provide one input entity each time inputinstruction is being executed. Second, multiple-input-entities-from-user asks student to provide the wholeinput entities before executing the source code. Third, multiple-input-entities-from-file asks student toprovide input in a similar manner as multiple-input-entities-from-user mechanism except that such inputsare provided from a text file.
Source code editor is a panel where student can interact with displayed source code. It is featured withsyntax highlighting to enhance source code readability.
-271-
Journal of Technology and Science Education – https://doi.org/10.3926/jotse.420
Output panel displays all texts generated from executing displayed source code (both input and outputtext) in accordance with the execution sequence of input and output instructions. The input text is stilldisplayed on this panel to inform student where the inputs take place.
Error panel displays both syntax and runtime errors which may occur as a result of compiling displayedsource code. Unique to this tool, occurred error message is separated from output texts and simplified foreasy interpretation. Such simplification is conducted by only displaying the last three lines from the wholeerror message; since most errors can be solved by only relying on these lines. The example of errormessage simplification can be seen in Figure 3. It excludes file location and stack trace information.
Variable content display shows any variables declared on executed source code in key-value pairrepresentation. Variables displayed on this panel are limited to primitive variables, strings, array, andmatrix. Unique to array and matrix, array is represented as a sequence of blocks while the matrix isrepresented as a bunch of arrays. An example view of those two can be seen at variable content displaypanel in Figure 2 as hasil and lst respectively.
.
Figure 1. Default user interface of PITON
Figure 2. The user interface of PITON when all panels are shown
-272-

Journal of Technology and Science Education – https://doi.org/10.3926/jotse.420
Three execution modes are provided in PITON. The first one is standard compile & run. Student can runhis own code, provide the input, and see the result. Figure 4 shows PITON’s user interface while runningdisplayed source code. Inputs are given on the bottom-left panel (i.e., input panel) while outputs and errorwill be displayed at panels right beside input panel (i.e., output and error panel). This mode can be usedwhen program visualization is not required by the student. In contrast, the other two are about executingprogram visualization (see Figure 2 for PITON’s user interface while running displayed source code withprogram visualization). The only difference between those modes is the way student interacts withvisualization. One of them will ask student to press next or previous button during visualization while theother will require no interaction; visualization will be displayed as an automated animation.
Visualization on PITON will be displayed on source code editor, input panel, output panel, and variablecontent display. Source code editor will highlight currently-executed line (see line 12 at source code editorpanel in Figure 2 for an example) where input and output panel will accommodate the interaction betweenstudent and source code. For each executed line, the content of all variables will be displayed at variablecontent display panel; where updated variables will be highlighted with different background color (see j atthe variable content display panel in Figure 2 as an example).
For anyone interested to use PITON on their programming course, please kindly inform the first orcorresponding author by email. We will send the tool by email.
Figure 3. An example of error message simplification
Figure 4. The user interface of PITON while running displayed source code without visualization
-273-
Journal of Technology and Science Education – https://doi.org/10.3926/jotse.420
4. Evaluation4.1. Lecturer-Assistant-Oriented Think-Aloud Study
We performed a think-aloud study of 8 lecturer assistants from undergraduate CS major; these assistantswere expected to know novice students’ behavior. Each participant would be asked to solve 4 UVA OnlineJudge problems (https://uva.onlinejudge.org/) – namely 10050, 11360, 11727, and 12250 – with PITON in60 minutes (for convenience, each problem had been translated to participant’s native language). Whilesolving the problems, these participants were asked to take notes about every thought that might berelated to the use of PITON for novice students. These thoughts were then mapped into two categorieswhich are positive and negative feedbacks.
Six positive feedbacks about PITON are collected. First, PITON’s features are comprehensive forcompleting laboratory task. Second, error message provided by PITON is clearer than the standard one(which is displayed by Python compiler). Third, step-by-step visualization is helpful considering eachstudent has his own learning speed. Fourth, multiple-inputs mechanism makes source code testing easier.Fifth, PITON’s text editor is convenient to be used due to syntax highlighting. Last, combiningprogramming workspace with a program visualization tool could assist students to complete theirlaboratory task with ease.
Besides the positive feedbacks, three negative feedbacks are also collected. First, PITON cannot visualizeobject variables (even the simplest one). Second, some minor bugs occurred (e.g., unexpected not-responding state while visualizing the code). Last, some instructions given on tutorial are quite unclear.Those negative feedbacks (except the first one) were immediately handled upon think-aloud study; thefirst feedback will be handled on future work.
4.2. Novice-Student-Oriented User Study
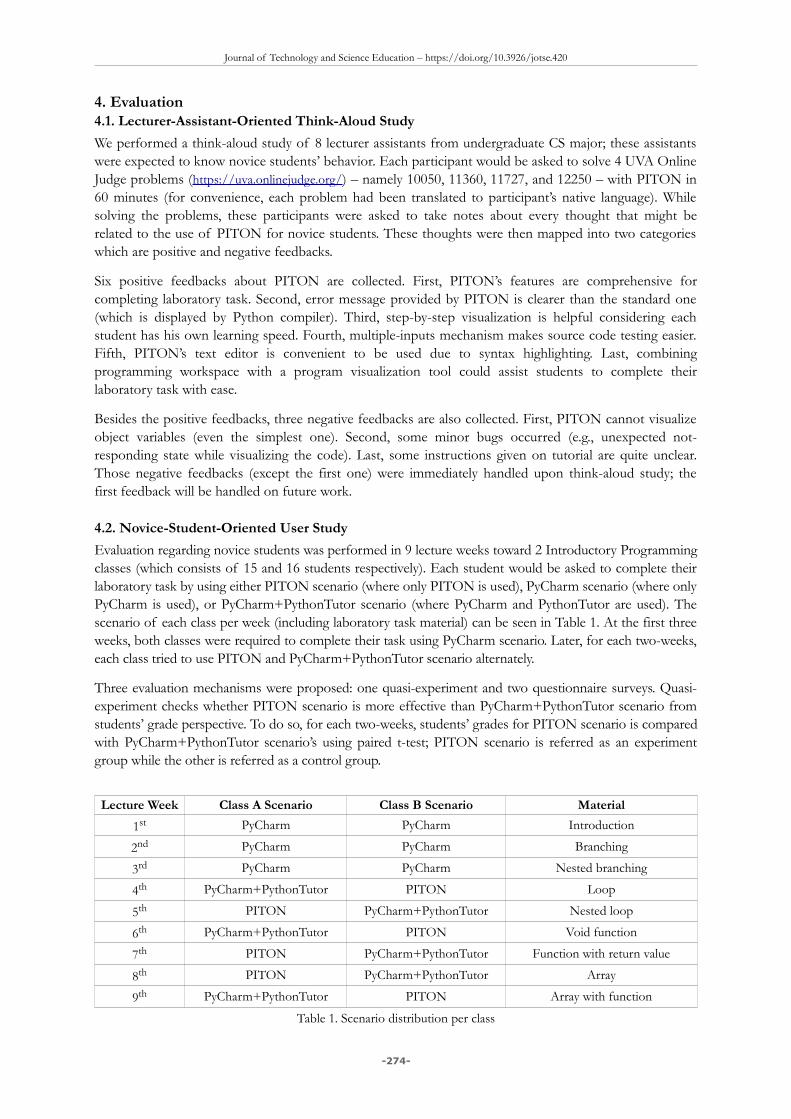
Evaluation regarding novice students was performed in 9 lecture weeks toward 2 Introductory Programmingclasses (which consists of 15 and 16 students respectively). Each student would be asked to complete theirlaboratory task by using either PITON scenario (where only PITON is used), PyCharm scenario (where onlyPyCharm is used), or PyCharm+PythonTutor scenario (where PyCharm and PythonTutor are used). Thescenario of each class per week (including laboratory task material) can be seen in Table 1. At the first threeweeks, both classes were required to complete their task using PyCharm scenario. Later, for each two-weeks,each class tried to use PITON and PyCharm+PythonTutor scenario alternately.
Three evaluation mechanisms were proposed: one quasi-experiment and two questionnaire surveys. Quasi-experiment checks whether PITON scenario is more effective than PyCharm+PythonTutor scenario fromstudents’ grade perspective. To do so, for each two-weeks, students’ grades for PITON scenario is comparedwith PyCharm+PythonTutor scenario’s using paired t-test; PITON scenario is referred as an experimentgroup while the other is referred as a control group.
Lecture Week Class A Scenario Class B Scenario Material
1st PyCharm PyCharm Introduction
2nd PyCharm PyCharm Branching
3rd PyCharm PyCharm Nested branching
4th PyCharm+PythonTutor PITON Loop
5th PITON PyCharm+PythonTutor Nested loop
6th PyCharm+PythonTutor PITON Void function
7th PITON PyCharm+PythonTutor Function with return value
8th PITON PyCharm+PythonTutor Array
9th PyCharm+PythonTutor PITON Array with function
Table 1. Scenario distribution per class
-274-

Journal of Technology and Science Education – https://doi.org/10.3926/jotse.420
In contrast, two questionnaire surveys check PITON’s effectiveness from students’ perspectives. The firstsurvey compares PITON with PyCharm and PythonTutor. Each student is required to rate 7 statements in7-point Likert scale (where 1 refers to completely disagree, 4 refers to neutral, and 7 refers to completely agree). Thissurvey was conducted at the end of 5th week (where students had tried all scenarios). Whereas, the secondone measures how useful PITON’s features and how frequent they are used while completing laboratorytask. Each student is required to rate PITON’s features regarding those two aspects in 10-points scale. Forusefulness metric, 0 refers to not useful and 10 refers to extremely useful; whereas, for frequency metric, 0 refersto never used and 10 refers to always used. This survey was conducted at the end of 9th week. It is important tonote that those two surveys were taken at two different times to avoid human fatigue.
Prior to conducting quasi-experiment, students’ grade means from the 4th to 9th week should be calculated.Figure 5 shows that two findings can be deducted regarding grade means. First, class A has lower chanceto get affected by PITON than class B; its grade mean is more consistent across lecture weeks. Second,students in our evaluation could generate higher score when a closely-related topic is given. The 5 th week(nested loop) and the 7th week (a function with return value) generates higher mean than their predecessorweek (which has closely-related material). It is important to note that the 9 th week (array with function)does not share similar behavior as the 5th and 7th week since its material combines two topics (i.e., arrayand function) instead of deepening its predecessor’s material.
Table 2 shows that only function material on class B generates significance through t-test (p-value < 0.01).However, such significance favors the combination of PyCharm and PythonTutor instead of PITON;grade mean for PyCharm+PythonTutor scenario is higher than PITON’s. Such un-patterned result is dueto the fact that most students did not use PythonTutor during PyCharm+PythonTutor scenario; forstudents, switching between PyCharm and PythonTutor during laboratory session is not practical. Thisphenomenon implicitly changes a comparison between PyCharm+PythonTutor and PITON scenario to acomparison between PyCharm and PITON scenario. When compared to PyCharm, PITON was slightlyless convenient to complete programming task considering students had used PyCharm longer. It isimportant to note that this rationale also backs up two findings regarding students’ grade mean: class Agenerated considerably consistent grade mean and both classes generated higher grade mean when relatedtopic is given regardless of used scenario.
Figure 5. Students’ grade means per class for quasi-experiment
Material Involved Weeks
P-Value
Class A Class B
Loop 4th and 5th week 0.474 0.188
Function 6th and 7th week 0.312 0.0045
Array 8th and 9th week 0.389 0.518
Table 2. P-value for each two-weeks in quasi-experiment
-275-
Journal of Technology and Science Education – https://doi.org/10.3926/jotse.420
In addition to un-patterned result, an implicit finding can also be deducted from quasi-experiment:students tend not to use program visualization tool when it is separated from programming workspace. Inother words, PITON is beneficial to be used for completing laboratory task; it combines programvisualization tool with programming workspace.
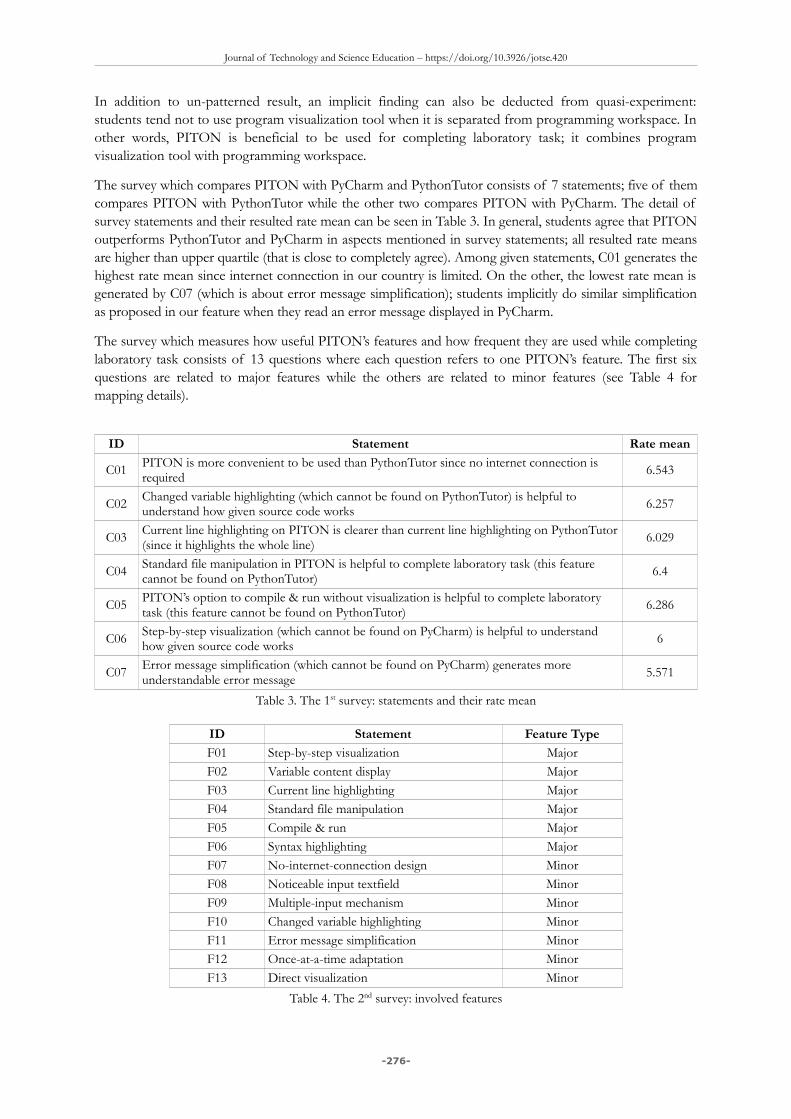
The survey which compares PITON with PyCharm and PythonTutor consists of 7 statements; five of themcompares PITON with PythonTutor while the other two compares PITON with PyCharm. The detail ofsurvey statements and their resulted rate mean can be seen in Table 3. In general, students agree that PITONoutperforms PythonTutor and PyCharm in aspects mentioned in survey statements; all resulted rate meansare higher than upper quartile (that is close to completely agree). Among given statements, C01 generates thehighest rate mean since internet connection in our country is limited. On the other, the lowest rate mean isgenerated by C07 (which is about error message simplification); students implicitly do similar simplificationas proposed in our feature when they read an error message displayed in PyCharm.
The survey which measures how useful PITON’s features and how frequent they are used while completinglaboratory task consists of 13 questions where each question refers to one PITON’s feature. The first sixquestions are related to major features while the others are related to minor features (see Table 4 formapping details).
ID Statement Rate mean
C01 PITON is more convenient to be used than PythonTutor since no internet connection is required
6.543
C02 Changed variable highlighting (which cannot be found on PythonTutor) is helpful to understand how given source code works 6.257
C03 Current line highlighting on PITON is clearer than current line highlighting on PythonTutor(since it highlights the whole line)
6.029
C04 Standard file manipulation in PITON is helpful to complete laboratory task (this feature cannot be found on PythonTutor) 6.4
C05 PITON’s option to compile & run without visualization is helpful to complete laboratory task (this feature cannot be found on PythonTutor)
6.286
C06 Step-by-step visualization (which cannot be found on PyCharm) is helpful to understand how given source code works 6
C07 Error message simplification (which cannot be found on PyCharm) generates more understandable error message
5.571
Table 3. The 1st survey: statements and their rate mean
ID Statement Feature Type
F01 Step-by-step visualization Major
F02 Variable content display Major
F03 Current line highlighting Major
F04 Standard file manipulation Major
F05 Compile & run Major
F06 Syntax highlighting Major
F07 No-internet-connection design Minor
F08 Noticeable input textfield Minor
F09 Multiple-input mechanism Minor
F10 Changed variable highlighting Minor
F11 Error message simplification Minor
F12 Once-at-a-time adaptation Minor
F13 Direct visualization Minor
Table 4. The 2nd survey: involved features
-276-

Journal of Technology and Science Education – https://doi.org/10.3926/jotse.420
When perceived from usefulness metric, Figure 6 shows that all features are considerably useful; theirusefulness degree mean is higher than 6 (i.e., a minimum threshold in positive degree category). F13generates the highest usefulness degree; it generates 9.071 of 10. We would argue that such finding isnatural considering students tend not to use program visualization tool when it is separated fromprogramming workspace (as stated in quasi-experiment result). In contrast, F12 generates the lowestusefulness degree. It is the only usefulness degree that is lower than upper quartile. Further observationshows that F12’s feature (i.e., once-at-a-time adaptation) was not felt useful since students had adaptedother program visualization tool (i.e., PythonTutor) and programming workspace (i.e., PyCharm)beforehand.
From frequency perspective, Figure 6 shows that all features are used in more than 50% occasions; theirfrequency degree mean is higher than 5. Implicit features (e.g., once-at-a-time adaptation) do not generatethe highest degree since students did not feel that they use it that frequent (even though they do so). Wewould argue that the finding is natural; the impact of some implicit features is not extreme enough to befelt in all occasions.
Among given statements, F07 is rated the highest (i.e., 8.286 of 10). Students felt that no-internet-connection design (which is F07’s feature) is frequently used despite its implicit behavior. This findingsupports our previous finding from the 1st survey: the need of internet connection plays an important rolewhen designing tool for areas with limited internet connection. The lowest frequency degree is resulted byF02; most students did not concentrate on variable content display (which is F02’s feature) duringvisualization. They concentrated more on current line highlighting (i.e., F03’s feature) and changedvariable highlighting (i.e., F10’s feature).
Figure 6. Usefulness and frequency result toward PITON’s features
5. Conclusions and Future WorksThis paper presents a combination of program visualization tool and programming workspace, namelyPITON. Using this tool, novice students could utilize program visualization while completing theirlaboratory task with ease. PITON is featured with 3 major features from PythonTutor (i.e., programvisualization tool), 3 major features from PyCharm (i.e., programming workspace), and 7 minor featuresextracted from student’s feedbacks about PythonTutor (Karnalim & Ayub, 2017a, 2017b). According toour evaluation, PITON is preferred than the combination of PythonTutor and PyCharm for completinglaboratory task (even though it is still less convenient when compared to PyCharm as a programmingworkspace). Further, all features proposed in PITON are helpful since they are perceived as useful andfrequently used by students.
For future work, we plan to observe PyCharm’s convenient features and apply them to PITON. Further,in response to negative feedback from think-aloud study, we also plan to extend PITON’s scope to cover
-277-

Journal of Technology and Science Education – https://doi.org/10.3926/jotse.420
object visualization (especially data-structure-related objects such as Stack, Queue, and Linked List). Thisfeature is expected to help students for learning advanced topic.
Declaration of Conflicting Interests The authors declared no potential conflicts of interest with respect to the research, authorship, and/orpublication of this article.
Funding This work is financially supported by a grant from Maranatha Christian University, Indonesia.
References
Carlisle, M.C., Wilson, T.A., Humphries, J.W., & Hadfield, S.M. (2005). RAPTOR: a visual environment forteaching algorithmic problem solving. Acm Sigcse Bulletin, 37(1), 176-180. Retrieved from:https://dl.acm.org/citation.cfm?id=1047411
Christiawan, L., & Karnalim, O. (2016). AP-ASD1 : An Indonesian Desktop-based Educational Tool for Basic Data Structure Course. Jurnal Teknik Informatika Dan Sistem Informasi (JuTISI), 2(1). Retrieved fromhttp://jutisi.maranatha.edu/index.php/jutisi/article/view/422
Cooper, S., Dann, W., & Pausch, R. (2000). Alice: a 3-D tool for introductory programming concepts. InJournal of Computing Sciences in Colleges, 15, 107-116. Retrieved from https://dl.acm.org/citation.cfm?id=364161
da Silva Lourenço, W., de Araujo Lima, S.J., & Alves de Araújo, S. (2017). TASNOP: A tool for teachingalgorithms to solve network optimization problems. Computer Applications in Engineering Education.https://doi.org/10.1002/cae.21864
Debdi, O., Paredes-Velasco, M., & Velázquez-Iturbide, J.Á. (2015). GreedExCol, A CSCL tool forexperimenting with greedy algorithms. Computer Applications in Engineering Education, 23(5), 790-804.Retrieved from: https://onlinelibrary.wiley.com/doi/full/10.1002/cae.21655
Denny, P., Luxton-Reilly, A., Tempero, E., & Hendrickx, J. (2011). Understanding the syntax barrier fornovices. In Proceedings of the 16th annual joint conference on Innovation and technology in computer science education -ITiCSE ’11, 208. New York, New York, USA: ACM Press. https://doi.org/10.1145/1999747.1999807
Desai, S., Kulkarni, S., Vasant Vaibhav, Varalakshmi, M., & Mohamed, P. (2002). VPMM: visualization ofparallel matrix multiplication algorithms. Journal of Computing Sciences in Colleges, 33(1), 24-31. Retrievedfrom: https://dl.acm.org/citation.cfm?id=3144610
Egan, M.H., & McDonald, C. (2014). Program visualization and explanation for novice C programmers.In Proceedings of the Sixteenth Australasian Computing Education Conference - Volume 148 . Australian ComputerSociety, Inc. Retrieved from: https://dl.acm.org/citation.cfm?id=2667496
Elvina, E., & Karnalim, O. (2017). Complexitor: An Educational Tool for Learning Algorithm TimeComplexity in Practical Manner. ComTech: Computer, Mathematics and Engineering Applications, 8(1), 21.https://doi.org/10.21512/comtech.v8i1.3783
Guo, P.J. (2013). Online python tutor: embeddable web-based program visualization for cs education. InProceeding of the 44th ACM technical symposium on Computer science education - SIGCSE ’13, 579. New York,New York, USA: ACM Press. https://doi.org/10.1145/2445196.2445368
Halim, S., Koh, Z. C., Loh, V.B.H., & Halim, F. (2012). Learning Algorithms with Unified and InteractiveWeb-Based Visualization. Olympiads in Informatics, 6, 53-68. Retrieved from:https://www.mii.lt/olympiads_in_informatics/pdf/INFOL099.pdf
-278-

Journal of Technology and Science Education – https://doi.org/10.3926/jotse.420
Jonathan, F.C., Karnalim, O., & Ayub, M. (2016). Extending The Effectiveness of Algorithm Visualizationwith Performance Comparison through Evaluation-integrated Development. In Seminar NasionalAplikasi Teknologi Informasi (SNATI). Retrieved from:http://www.jurnal.uii.ac.id/index.php/Snati/article/view/6263
Kaila, E., Rajala, T., Laakso, M.J., & Salakoski, T. (2010). Effects of Course-Long Use of a ProgramVisualization Tool. In Australasian Computing Education Conference. Brisbane. Retrieved from:https://dl.acm.org/citation.cfm?id=1862234
Kang, H., & Guo, P.J. (2017). Omnicode: A Novice-Oriented Live Programming Environment withAlways-On Run-Time Value Visualizations. In The 30th ACM Symposium on User Interface Software andTechnology (UIST. Retrieved from: https://dl.acm.org/citation.cfm?id=3126632
Karnalim, O., & Ayub, M. (2017a). The Effectiveness of a Program Visualization Tool on IntroductoryProgramming: A Case Study with PythonTutor. CommIT (Communication and Information Technology) Journal,11(2). Retrieved from: http://journal.binus.ac.id/index.php/commit/article/view/3704
Karnalim, O., & Ayub, M. (2017b). The Use of PythonTutor on Programming Laboratory Session:Student Perspectives. KINETIK, 2(4). Retrieved from:http://kinetik.umm.ac.id/index.php/kinetik/article/view/442
Karnalim, O., & Ayub, M. (2018). A Quasi-Experimental Design to Evaluate the Use of PythonTutor onProgramming Laboratory Session. International Journal of Online Engineering (iJOE), 14(2), 155-164.Retrieved from: http://online-journals.org/index.php/i-joe/article/view/8067
Knuth, D.E. (1984). Literate Programming. The Computer Journal, 27(2). Retrieved from:https://academic.oup.com/comjnl/article/27/2/97/343244
Kölling, M. (2010). The greenfoot programming environment. ACM Transactions on Computing Education(TOCE), 10(4), 14. Retrieved from: https://dl.acm.org/citation.cfm?id=1868361
Lister, R., Seppälä, O., Simon, B., Thomas, L., Adams, E. S., Fitzgerald, S., et al. (2004). A multi-nationalstudy of reading and tracing skills in novice programmers. In Working group reports from ITiCSE onInnovation and technology in computer science education - ITiCSE-WGR ’04, 36, 119. New York, New York,USA: ACM Press. https://doi.org/10.1145/1044550.1041673
Maravić Čisar, S., Pinter, R., & Radosav, D. (2011). Effectiveness of Program Visualization in LearningJava: a Case Study with Jeliot 3. International Journal of Computers Communications & Control, 6(4), 668.https://doi.org/10.15837/ijccc.2011.4.2094
Mayer, R.E. (1989). Systematic Thinking Fostered by Illustration in Scientific Text. Journal of EducationalPsychology, 81(2). Retrieved from:http://psycnet.apa.org/record/1989-34646-001 https://doi.org/10.1037/0022-0663.81.2.240
McCracken, M., Almstrum, V., Diaz, D., Guzdial, M., Hagan, D., Kolikant, Y., et al. (2001). A Multi-National, Multi-Institutional Study of Assessment of Programming Skill of First-year CS Students.ACM SIGSCE Bulletin, 33(4). https://doi.org/10.1145/572133.572137
Moreno, A., Myller, N., Sutinen, E., & Ben-Ari, M. (2004). Visualizing programs with Jeliot 3. In Proceedingsof the working conference on Advanced visual interfaces - AVI ’04, 373. New York, New York, USA: ACM Press.https://doi.org/10.1145/989863.989928
Radošević, D., Orehovački, T., & Lovrenčić, A. (2009). Verificator: Educational Tool for LearningProgramming. Informatics in Education, 8(2). Retrieved from: http://citeseerx.ist.psu.edu/viewdoc/summary?doi=10.1.1.148.9441
-279-
Journal of Technology and Science Education – https://doi.org/10.3926/jotse.420
Rajala, T., Laakso, M.-J., Kalla, E., & Salakoski, T. (2007). VILLE: a language-independent programvisualization tool. In Proceedings of the Seventh Baltic Sea Conference on Computing Education Research. 88, 151-159. Darlinghurst: Australian Computer Society. Retrieved from: https://dl.acm.org/citation.cfm?id=2449340
Resnick, M., Silverman, B., Kafai, Y., Maloney, J., Monroy-Hernández, A., Rusk, N., et al. (2009). Scratch:Programming for All. Communications of the ACM, 52(11), 60. https://doi.org/10.1145/1592761.1592779
Sorva, J., & Juha. (2013). Notional machines and introductory programming education. ACM Transactionson Computing Education, 13(2), 1-31. https://doi.org/10.1145/2483710.2483713
Sorva, J., Karavirta, V., & Malmi, L. (2013). A Review of Generic Program Visualization Systems forIntroductory Programming Education. ACM Transactions on Computing Education, 13(4), 1-64.https://doi.org/10.1145/2490822
Velázquez-Iturbide, J.Á., & Pérez-Carrasco, A. (2009). Active learning of greedy algorithms by means ofinteractive experimentation. In Proceedings of the 14th annual ACM SIGCSE conference on Innovation andtechnology in computer science education - ITiCSE ’09 (Vol. 41, p. 119). New York, New York, USA: ACMPress. https://doi.org/10.1145/1562877.1562917
Velázquez-Iturbide, J.Á., Pérez-Carrasco, A., & Urquiza-Fuentes, J. (2008). SRec: : an animation system of recursion for algorithm courses. In Proceedings of the 13th annual conference on Innovation and technology incomputer science education - ITiCSE ’08, 40, 225. New York, New York, USA: ACM Press.https://doi.org/10.1145/1384271.1384332
Watts, T. (2004). The SFC editor a graphical tool for algorithm development. Journal of Computing Sciences inColleges, 20(2), 73-85. Retrieved from: https://dl.acm.org/citation.cfm?id=1040159
Zumaytis, S., & Karnalim, O. (2017). Introducing an Educational Tool for Learning Branch & BoundStrategy. Journal of Information Systems Engineering and Business Intelligence, 3(1), 8.https://doi.org/10.20473/jisebi.3.1.8-15
Published by OmniaScience (www.omniascience.com)
Journal of Technology and Science Education, 2018 (www.jotse.org)
Article’s contents are provided on an Attribution-Non Commercial 4.0 Creative commons International License.Readers are allowed to copy, distribute and communicate article’s contents, provided the author’s and JOTSE
journal’s names are included. It must not be used for commercial purposes. To see the complete licence contents,please visit https://creativecommons.org/licenses/by-nc/4.0/.
-280-