Combining molecular, morphological and ecological data to...
22
Biological Journal of the Linnean Society, 2006, 87, 343–364. With 6 figures © 2006 The Linnean Society of London, Biological Journal of the Linnean Society, 2006, 87, 343–364 343 Blackwell Publishing LtdOxford, UKBIJBiological Journal of the Linnean Society0024-4066The Linnean Society of London, 2006? 2006 87? 343364 Original Article SPECIES BOUNDARIES IN A CRYPTIC PITVIPER K. L. SANDERS *Corresponding author. E-mail: [email protected] Combining molecular, morphological and ecological data to infer species boundaries in a cryptic tropical pitviper KATE L. SANDERS*, ANITA MALHOTRA and ROGER S. THORPE School of Biological Sciences, University of Wales, Bangor, Gwynedd LL57 2UW, UK Received 18 May 2004; accepted for publication 1 February 2005 Few operational methods exist for delimiting species boundaries, and these usually require sampling strategies that are unrealistic for widespread organisms that occur at low densities. Here we apply molecular, morphological and ecological species delimitation criteria to a wide-ranging, fragmented group of Asian green pitvipers, the Popeia popeiorum complex. A mitochondrial DNA phylogeny for the group indicates two well-differentiated clades, corre- sponding mainly to northern and southern parts of its range. Strong phylogeographical structure within each clade suggests isolation in forest refugia during the Pliocene and a southward colonization of the Sunda islands during the Pleistocene. Multivariate analysis of morphological characters reveals a generally conserved pattern of geographical variation, incongruent with the recovered phylogenetic history. We compare groups delineated by mtDNA variation to morphological and ecological divisions in the complex, and discuss the implications of these for the taxonomy of the group. Discordance between species boundaries inferred from different criteria suggests that combining inde- pendent sources of data provides the most reliable estimation of species boundaries in organisms that are difficult to sample in large numbers. © 2006 The Linnean Society of London, Biological Journal of the Linnean Society, 2006, 87, 343–364. ADDITIONAL KEYWORDS: cryptic species – multivariate morphometrics – phylogenetics – phylogeography – Popeia popeiorum – species criteria – systematics. INTRODUCTION A reliable estimate of species boundaries is of central importance to conservation management (Greene, 1997) and to the large body of research that concerns this taxonomic level (Goldstein & Brower, 2002). How- ever, there is no universally applicable, operational definition of species (Harrison, 1998). The literature is instead saturated with ‘species concepts’ promoting a combination of species criteria that reflect the diver- sity of events associated with the speciation process and the differing research interests of authors (de Queiroz, 1998; Hey, 2000). Approaches to species delimitation can be broadly divided into those based on knowledge of the evolu- tionary process (categorized as mechanistic species concepts) and those based on historical patterns of evolution (historical species concepts) (Luckow, 1995; de Queiroz, 1998). Mechanistic species concepts emphasize species criteria that influence the future cohesion of populations (de Queiroz, 1998). Under the reproductive isolation criterion, gene exchange is reduced either at the whole genome level (Mayr, 1963; Avise & Wollenberg, 1997) or at loci of differential adaptation (Wu, 2001). The ‘nonrelational’ recognition criterion promotes common fertilization and shared mate recognition systems (Patterson, 1985). Cohesion species criteria include phenotypic and ecological exchangeability (Templeton, 1989). Alternatively, historical approaches to species delimitation promote criteria that can be used to infer species status from patterns of variation (de Queiroz, 1998). The phenetic criterion (Sokal & Crovello, 1970) distinguishes species as separate clusters in multi- variate morphometric analysis. Phylogenetic species criteria equate species with segments or branches of phylogenetic trees (Cracraft, 1983). Some phyloge- netic concepts require strict monophyly (Donoghue, 1985; Mishler, 1985; Smith, 1994; Baum & Shaw,
-
Upload
hoanghuong -
Category
Documents
-
view
217 -
download
1
Transcript of Combining molecular, morphological and ecological data to...

Biological Journal of the Linnean Society
, 2006,
87
, 343–364. With 6 figures
© 2006 The Linnean Society of London,
Biological Journal of the Linnean Society,
2006,
87
, 343–364
343
Blackwell Publishing LtdOxford, UKBIJBiological Journal of the Linnean Society0024-4066The Linnean Society of London, 2006? 200687?343364Original Article
SPECIES BOUNDARIES IN A CRYPTIC PITVIPER
K. L. SANDERS
*Corresponding author. E-mail: [email protected]
Combining molecular, morphological and ecological data to infer species boundaries in a cryptic tropical pitviper
KATE L. SANDERS*, ANITA MALHOTRA and ROGER S. THORPE
School of Biological Sciences, University of Wales, Bangor, Gwynedd LL57 2UW, UK
Received 18 May 2004; accepted for publication 1 February 2005
Few operational methods exist for delimiting species boundaries, and these usually require sampling strategies thatare unrealistic for widespread organisms that occur at low densities. Here we apply molecular, morphological andecological species delimitation criteria to a wide-ranging, fragmented group of Asian green pitvipers, the
Popeiapopeiorum
complex. A mitochondrial DNA phylogeny for the group indicates two well-differentiated clades, corre-sponding mainly to northern and southern parts of its range. Strong phylogeographical structure within each cladesuggests isolation in forest refugia during the Pliocene and a southward colonization of the Sunda islands during thePleistocene. Multivariate analysis of morphological characters reveals a generally conserved pattern of geographicalvariation, incongruent with the recovered phylogenetic history. We compare groups delineated by mtDNA variationto morphological and ecological divisions in the complex, and discuss the implications of these for the taxonomy ofthe group. Discordance between species boundaries inferred from different criteria suggests that combining inde-pendent sources of data provides the most reliable estimation of species boundaries in organisms that are difficultto sample in large numbers. © 2006 The Linnean Society of London,
Biological Journal of the Linnean Society
,2006,
87
, 343–364.
ADDITIONAL KEYWORDS:
cryptic species – multivariate morphometrics – phylogenetics – phylogeography
–
Popeia popeiorum
– species criteria – systematics.
INTRODUCTION
A reliable estimate of species boundaries is of centralimportance to conservation management (Greene,1997) and to the large body of research that concernsthis taxonomic level (Goldstein & Brower, 2002). How-ever, there is no universally applicable, operationaldefinition of species (Harrison, 1998). The literature isinstead saturated with ‘species concepts’ promoting acombination of species criteria that reflect the diver-sity of events associated with the speciation processand the differing research interests of authors (deQueiroz, 1998; Hey, 2000).
Approaches to species delimitation can be broadlydivided into those based on knowledge of the evolu-tionary process (categorized as mechanistic speciesconcepts) and those based on historical patterns ofevolution (historical species concepts) (Luckow, 1995;
de Queiroz, 1998). Mechanistic species conceptsemphasize species criteria that influence the futurecohesion of populations (de Queiroz, 1998). Under thereproductive isolation criterion, gene exchange isreduced either at the whole genome level (Mayr, 1963;Avise & Wollenberg, 1997) or at loci of differentialadaptation (Wu, 2001). The ‘nonrelational’ recognitioncriterion promotes common fertilization and sharedmate recognition systems (Patterson, 1985). Cohesionspecies criteria include phenotypic and ecologicalexchangeability (Templeton, 1989).
Alternatively, historical approaches to speciesdelimitation promote criteria that can be used to inferspecies status from patterns of variation (de Queiroz,1998). The phenetic criterion (Sokal & Crovello, 1970)distinguishes species as separate clusters in multi-variate morphometric analysis. Phylogenetic speciescriteria equate species with segments or branches ofphylogenetic trees (Cracraft, 1983). Some phyloge-netic concepts require strict monophyly (Donoghue,1985; Mishler, 1985; Smith, 1994; Baum & Shaw,

344
K. L. SANDERS
ET AL
.
© 2006 The Linnean Society of London,
Biological Journal of the Linnean Society,
2006,
87
, 343–364
1995) based on apomorphic characters (Hennig, 1966).Others emphasize diagnosability regardless ofwhether characters are derived (Eldredge & Cracraft,1980) or require that diagnostic characters be fixedcombinations of character states (Nixon & Wheeler,1990; Davis & Nixon, 1992).
Although the theoretical framework underlying spe-cies criteria has been developed extensively, very fewspecific operational methods have been proposed forthe practical delimitation of species (summarized byMallet, 2001; Sites & Marshall, 2003). Moreover, thestatistical power necessary for their application usu-ally requires a level of population sampling (andknowledge of ecology and reproductive biology) that isunrealistic for many taxa. Organisms that occur atnaturally low densities over a wide geographical areaare particularly problematic. Political constraints andrecent habitat fragmentation (MacKinnon, 1997)further preclude complete sampling in the tropics,although a reliable taxonomy is most important forvulnerable populations in areas of high conservationinterest.
The
Popeia popeiorum
complex of South-east Asianpitvipers (
sensu
Malhotra & Thorpe, 2004a) providesan excellent example of the practical difficulties ofdelimiting species. The complex has a wide geographi-cal distribution in South-east Asia, comprising bothtranscontinental and island populations (Fig. 1) thatoccur almost exclusively in undisturbed rainforests atnaturally low densities.
Popeia popeiorum
is one ofnumerous, strikingly convergent, ‘green pitviper’ spe-cies formerly classified in
Trimeresurus
, whose taxo-nomic resolution and field identification have provedproblematic even to professional herpetologists (seee.g. Orlov
et al
., 2002, in which a specimen from Viet-nam is incorrectly identified as
P. popeiorum
). How-ever, the recent application of molecular methods hasresolved the status and relationships of many of thegreen species and in several cases has revealed previ-ously undetected, cryptic species (Malhotra & Thorpe,1997, 2000, 2004b, 2004c; Giannasi, Thorpe & Mal-hotra, 2001) The most recent taxonomic revision of
P. popeiorum
(Regenass & Kramer, 1981) split thecomplex into three subspecies on the basis of ventralscale counts and the number of scale rows at mid-body,although the geographical range of these was signifi-cantly underestimated.
Trimersurus p. popeiorum
wasrecognized on the mainland and its range was given asIndia, Myanmar, Laos, Thailand, Vietnam and Malay-sia. However, on the basis of our identification ofmuseum specimens, this species only occurs in north-east India, Myanmar, Laos, Thailand and Malaysia.Regenass and Kramer coined the name
T. p. barati
forthe Barisan range population in west Sumatra,although specimens referable to
P. popeiorum
of whichthey were apparently unaware have also been col-
lected from north Sumatra. Finally,
T. p. sabahi
wascoined for the population that is restricted to Borneo(Fig. 1).
In this study, we attempt to revise the taxonomy ofthe
P. popeiorum
complex by combining molecular,morphological and ecological pattern-based speciescriteria. Mitochondrial DNA (mtDNA) sequences wereused to reconstruct phylogenies, estimate divergencetimes and compare between-operational taxonomicunit (OTU) frequencies of fixed nucleotide differences.Generalized morphological variation was investigatedusing multivariate ordination methods. Ecologicaldata, including vegetational type and altitudinalrange, was collected from field and museum records.We discuss concordant support for groups delineatedby these data with respect to species boundaries in thecomplex. Finally, we use our data for
P. popeiorum
toassess the limitations of several pattern-based speciescriteria and their combined utility with respect todelimiting species boundaries in organisms that aredifficult to sample in large numbers.
MATERIAL AND METHODS
S
AMPLE
COLLECTION
Fieldwork was carried out in Thailand, Malaysia andIndonesia. Wild-caught specimens provided bloodsamples and morphometric data (under anaesthesis),allowing correspondence between genetic, morphologi-cal and ecological data sets for at least one specimen inmost OTUs. Blood and tissues were also obtained frommuseum and private collections when locality infor-mation was available and species identity could beverified. In total, 32 specimens of
P. popeiorum
weresampled from Myanmar, Thailand, Laos, peninsularMalaysia, Borneo and Sumatra (Fig. 1, Table 1). Bloodsamples were taken from the caudal vein with a hypo-dermic syringe, placed in 1 mL 0.1
M
EDTA, andstored in SDS-Tris buffer (2% SDS, 100 m
M
Tris); liverand muscle tissue was preserved in 80% ethanol.
DNA
PREPARATION
,
AMPLIFICATION
AND
SEQUENCING
Whole genomic DNA was extracted from blood andtissues using standard proteinase K protocols(Sambrook, Frisch & Maniatis, 1989). Four mitochon-drial genes were amplified via polymerase chainreaction: these were cytochrome
b
(cyt
b
), NADH dehy-drogenase subunit 4 (ND4), 12S small subunit riboso-mal RNA (12S) and 16S large subunit ribosomal RNA(16S). Cyt
b
sequences were obtained as described inde Queiroz, Lawson & Lemos-Espinal (2002). ND4sequences were obtained as described in Parkinson,Zamudio & Greene (2000), 12S as described in Knight& Mindell (1993), and 16S as in Parkinson, Moody &Ahlquist (1997). Unincorporated nucleotides andprimers were removed from PCR products using

SPECIES BOUNDARIES IN A CRYPTIC PITVIPER
345
© 2006 The Linnean Society of London,
Biological Journal of the Linnean Society,
2006,
87
, 343–364
QIAquick columns (QIAGen). Single stranded productwas then sequenced using dye-labelled terminators(ABI PRISM BigDye Terminator Cycle SequencingReady Reaction Kit) and run on an ABI Prism 377DNA automated sequencer.
S
EQUENCE
ANALYSES
Outgroups were selected to represent four generaformerly part of
Trimeresurus
(Malhotra & Thorpe,
2004a). These were
Himalayophis tibetanus
,
T. mala-baricus
,
Viridovipera vogeli
and
Cryptelytrops septen-trionalis.
Alignment of cyt
b
and ND4 was trivial asthere were no indels. The 12S and 16S sequences werealigned by eye following Parkinson (1999) with theexception of minor changes, which were required inone region of 12S and one of 16S due to insertionsfound in some of the new sequences obtained. Codinggenes were translated into amino acid sequences tocheck for the presence of stop codons that might indi-
Figure 1.
Distribution of samples included in morphological (bold dots) and molecular (open circles) analysis. Stippledtriangles indicate montane habitats exceeding 1000 m. Numbered OTUs represent localities that were grouped in multi-variate morphometric analysis.
Darjeeling
Khasi Hills (type localtity)
1. northeast India
2. north Thailand
3. west Thailand
4. south Thailand
11. north Sumatra
12. west Sumatra P Pagai
10. P Tioman
9. G Benom
8. Bukit Fraser
7. Cameron Highlands
6. G Lawit
13. BorneoBelum5. P Penang
Thung SongPhang Nga

346
K. L. SANDERS
ET AL
.
© 2006 The Linnean Society of London,
Biological Journal of the Linnean Society,
2006,
87
, 343–364
cate that pseudogenes had been amplified. The fourmitochondrial genes were combined into a single dataset under the rationale that they belong to a singlelinkage group and an increased number of genes arelikely to provide a higher number of potentially infor-mative sites for phylogenetic analysis (Chippindale& Wiens, 1994; Cummings, Otto & Wakeley, 1995).PAUP* 4.0b10 (Swofford, 2003) was used to calculateskewness (g
1
) statistics from 10
6
randomly generatedtrees to evaluate the adequacy of phylogenetic signalin the data (Hillis & Huelsenbeck, 1992).
PAUP* 4.0b10 was used for maximum parsimony(MP) and maximum likelihood (ML) analyses. Amodel of molecular evolution was first assigned to thedata using the log-likelihood function of MODEL-TEST 3.0 (Posada & Crandall, 2001). MODELTESTcompares 56 different nested substitutional modelsand uses log-likelihood scores to determine whichmodel best fits the data. ML analysis, using a heuris-tic search with a starting tree obtained by ten ran-dom additions of taxa and tree-bisection-reconnection(TBR) branch swapping, was conducted using theparameters identified by MODELTEST
.
The parame-ters were then re-estimated from the resulting treeand used in a new ML analysis. The final tree wasnot bootstrapped to save computational time. An MPtree was produced using the same search options asin the ML analysis, but with a starting tree obtainedby 100 random additions of taxa. All sites were
equally weighted and 1000 bootstrap replicates wereperformed.
MrBayes v.2.01 (Huelsenbeck & Ronquist, 2001)was used to conduct Bayesian Markov Chain MonteCarlo (MCMC) phylogenetic inference, using the best-fit model indicated by MODELTEST
.
Substitutionmodel parameters were estimated as part of the anal-ysis. Three heated chains and one cold chain wereinitiated with a random starting tree, run for 10
6
generations, and sampled every 100 generations. Thelog-likelihood scores of sample points were plottedagainst generation time to determine when samplepoints reached stationarity, and samples prior to thispoint were discarded as ‘burn-in’ samples. The topolo-gies of all remaining samples were used to generate amajority rule consensus tree. Three additional MCMCphylogenetic reconstructions were performed to con-firm convergence of resulting tree topologies, and postburn-in trees were combined in a final majority ruleconsensus tree, with the percentage of samples thatrecovered each clade representing posterior cladeprobabilities (Huelsenbeck & Ronquist, 2001).
S
EQUENCE
DIVERGENCE
AND
FIXED
NUCLEOTIDE
DIFFERENCES
MEGA version 2.1 (Kumar
et al
., 2001) was used tomake between-OTU pairwise sequence comparisonsusing the model of best-fit indicated by MODELTEST
.
Table 1.
OTU sample sizes for morphological (MOR) and molecular analyses (MOL)
OTU Locality
MOR MOL
M F M & F
1 North-east India (Darjeeling) 1 0 0North-east India (Khasi Hills) 1 0 0
2 North Thailand 7 4 3Myanmar (central) 4 1 3Laos 0 2 2
3 West Thailand 1 2 2Myanmar (south) 1 0 0South Thailand (Phang Nga) 0 0 1
4 South Thailand (Thung Song area) 8 4 4Thailand/Malaysia border (Belum) 1 0 0
5 West Malaysia (Pulau Penang) 1 0 06 West Malaysia (Gunung Lawit) 2 2 07 West Malaysiia (Cameron Highlands) 1 7 88 West Malaysia (Bukit Fraser) 3 2 39 West Malaysia (Gunung Benom) 0 1 010 Pulau Tioman 2 1 111 North Sumatra 2 0 012 West Sumatra 9 8 113 Borneo (East Malaysia) 4 6 4

SPECIES BOUNDARIES IN A CRYPTIC PITVIPER
347
© 2006 The Linnean Society of London,
Biological Journal of the Linnean Society,
2006,
87
, 343–364
Only ND4 and cyt
b
were used to allow comparisonwith the published literature and application of amolecular clock calibrated in New World pitvipers(Wüster
et al
., 2002). Equality of substitution rateshas been tested between the taxa used in the calibra-tion of this molecular clock and the
P. popeiorum
group, and confirmed not to be significantly different(Malhotra & Thorpe, 2004a).
We systematically compared fixed nucleotide differ-ences between mtDNA lineages using the diagnosticframework of population aggregation analysis (PAA)(Davis & Nixon, 1992). Only the highly conservedrRNA genes were used (12S and 16S), as character-based delimitation requires that potentially diagnos-tic characters evolve relatively slowly. Under PAA,sets of populations that have fixed differences at oneor more sites are considered separate species (Davis &Nixon, 1992). However, if too few individuals are sam-pled the number of species may be overestimated, aspolymorphic traits may appear to be fixed (Walsh,2000). This is evidently the case in our data, in whichfixed differences separate all
T. popeiorum
OTUs. Forthis reason, we interpret our results in the context offrequencies of fixed nucleotide differences betweenOTUs.
M
ULTIVARIATE
MORPHOMETRICS
We examined 74 morphological characters relating toscalation, colour pattern and body proportions(Appendix 1) from 88 museum and wild-caught speci-mens spanning the geographical range of the complex(Appendix 2). Male and female specimens weretreated separately in all analyses to avoid bias causedby sexual dimorphism. Specimens were grouped geo-graphically into operational taxonomic units (OTUs)on the basis of a preliminary ordination using princi-pal components analysis (PCA). PCA was chosen inpreference to canonical variate analysis (CVA) as itsummarizes multivariate patterns of variation with-out requiring that specimens be grouped into specifictaxonomic units prior to analysis, and does not requirehomoscedastic data (Thorpe, 1976). In all furtheranalyses, specimens from north Thailand and proxi-mate localities in Myanmar and Laos were groupedseparately from localities in north-east India; westThailand and an adjacent locality in Myanmar; south-ern Thailand and Belum (Malaysia). All remainingwest Malaysian localities were treated as separateOTUs due to high levels of between-locality variation;north and west Sumatra were also treated separatelyand localities within Borneo were grouped. The OTUsused are illustrated in Figure 1 and sample sizes foreach sex are listed in Table 1.
One-way analysis of variance and covariance(ANOVA/ANCOVA) was used to identify characters
showing significant between-OTU variation. Non-sig-nificant characters were excluded in subsequent anal-yses. Size-correlated characters were adjusted using apooled within-group regression coefficient againsteither snout
−
vent length or head length. PCA analy-ses were performed on all OTUs for each sex to inves-tigate multivariate patterns of variation in the group.
In order to distinguish between clinal and categori-cal patterns of variation between parapatric mainlandOTUs, these were subjected to separate PCAs. Thisinvolved male specimens from Thailand and north-east India, and female specimens from mainland pen-insular Malaysia (the sex used was decided on thebasis of highest available sample size). First principalcomponent (PC1) scores were then plotted against thelatitudinal position of OTUs.
RESULTS
P
RELIMINARY
SEQUENCE
ANALYSIS
A total of 2419 bp (cyt
b
: 809 bp, ND4: 668 bp, 12S:426 bp, 16S: 516 bp) was used to represent 32 ingrouptaxa and four outgroup taxa in the final phylogeneticanalysis (GenBank accession numbers are given inAppendix 3). These contained 638 variable sites, ofwhich 367 (15.2% of all sites) were parsimoniouslyinformative. There was no indication that pseudo-genes had been amplified as no stop codons or indelswere found in coding genes. Tree length distributionwas significantly skewed to the left, indicating thatthere was significant structure in the data (g
1
=
−
0.57,
P
=
<
0.01). The substitutional model of evolutionassigned by MODELTEST was Tamura-Nei (TrN) dis-tance (Tamura & Nei, 1993) with gamma correctionshape parameter
=
0.8448.
P
HYLOGENETIC
RELATIONSHIPS
Bayesian, ML and MP analyses of the combined dataset resulted in identical tree topologies, with generallyhigh support (Fig. 2). The Bayesian tree had a meanlog-likelihood score of
−
7562.72. The final ML tree wasobtained using the TrN model with gamma distri-buted rates and had a log-likelihood score of –Ln8044.23. MP analysis revealed a single most parsimo-nious tree with a length of 1186, a consistency index(CI) of 0.63, a retention index (RI) of 0.73 and arescaled consistency index (RC) of 0.46.
Two strongly supported, well-differentiated cladescorrespond to overlapping lineages in the north andsouth. The northern clade contains three well-supported clusters. The first comprises northThailand/Laos and Myanmar, the second the CameronHighlands, and the third comprises specimens fromwest Thailand. A specimen from Phang Nga (southThailand) is also supported as being in the northern

348
K. L. SANDERS
ET AL
.
© 2006 The Linnean Society of London,
Biological Journal of the Linnean Society,
2006,
87
, 343–364
Figure 2.
Mitochondrial gene tree derived from Bayesian Markov Chain Monte Carlo analysis of combined data from fourmitochondrial genes, with posterior clade probabilities and bootstrap support values from Bayesian and maximumparsimony trees, respectively, reading left to right.
0.1Himalayophis tibetanus (B258)
south Thailand – Phang Nga (B467)
Malaysia - Cameron Highlands (A196)
Malaysia - Cameron Highlands (B235)
Malaysia - Cameron Highlands (B237)
Malaysia - Cameron Highlands (B238)
Malaysia - Cameron Highlands (A197)
Malaysia - Cameron Highlands (B346)
Malaysia - Cameron Highlands (B236)
Malaysia - Cameron Highlands (B345)
Myanmar - Bago Division (B520)
Myanmar – Mon State (B417)
Myanmar – Mon State (B419)
north Thailand – Chiang Mai (B476)
north Thailand – Chiang Rai (A204)
north Thailand – Lampang (A205)
north Laos (B196)
southwest Laos (B195)
west Thailand (B52)
west Thailand (B34)south Thailand – Thung Song (A202)
south Thailand – Thung Song (A203)
south Thailand – Thung Song (B19)
south Thailand – Thung Song (A246)
west Sumatra (B361)
Tioman (B519)
Borneo - Sabah (B344)
Borneo - Sabah (B339)
Borneo - Sabah (B338)
Borneo - Sabah (B341)
Malaysia – Bukit Fraser (B278)
Malaysia – Bukit Fraser (B246)
Malaysia – Bukit Fraser (B469)
Cryptelytrops septentrionalis (A100)
Viridovipera vogeli (B97)
100/100
95/64
98/-
100/100
100/98
100/84
72/-
100/100
100/100
100/100
100/100
100/100
83/67
78/59
100/96
NORTHERN
CLADE
SOUTHERN
CLADE
Trimeresurus malabaricus (A218)
83/-
100/64
89/-
100/100
100/100
98/85

SPECIES BOUNDARIES IN A CRYPTIC PITVIPER
349
© 2006 The Linnean Society of London,
Biological Journal of the Linnean Society,
2006,
87
, 343–364
clade. Relationships among these clusters are less wellresolved. The southern clade also contains severalwell-supported clusters, including Bukit Fraser,Borneo and south Thailand (Thung Song area). Rela-tionships among these clusters, and two sequencesfrom west Sumatra and Pulau Tioman, are less wellresolved.
S
EQUENCE
DIVERGENCE
AND
FIXED
NUCLEOTIDE
DIFFERENCES
Levels of average sequence divergence (Tamura-Neiwith gamma correction) in ND4 and cyt
b range from7.2% ± 1.6–14.8% ± 2.4 between ingroup and outgrouptaxa; 3.0% ± 1.0 and 5.7% ± 1.4 (mean 4.2% ± 1.1)between northern clade OTUs, and 1.7% ± 0.8 and2.7% ± 0.7 (mean 2.1% ± 0.8) between southern cladeOTUs. Average corrected sequence difference betweenthe northern and southern clades is 5.4% ± 1.4 (Figure5).
Frequencies of between-OTU fixed nucleotide differ-ences were higher within the northern clade (mean9.66 fixed differences) than within the southern clade(mean 3.33), and more fixed differences were foundbetween these clades (mean 12.88) than within eitherclade (Table 2). The frequency of fixed differencesbetween parapatric lineages is comparable to thatbetween allopatric lineages. For example, the Cam-eron Highlands population has a comparable numberof fixed differences to the parapatric Bukit Fraserlineage as to geographically isolated populations inThailand (Table 2).
MORPHOMETRIC VARIATION
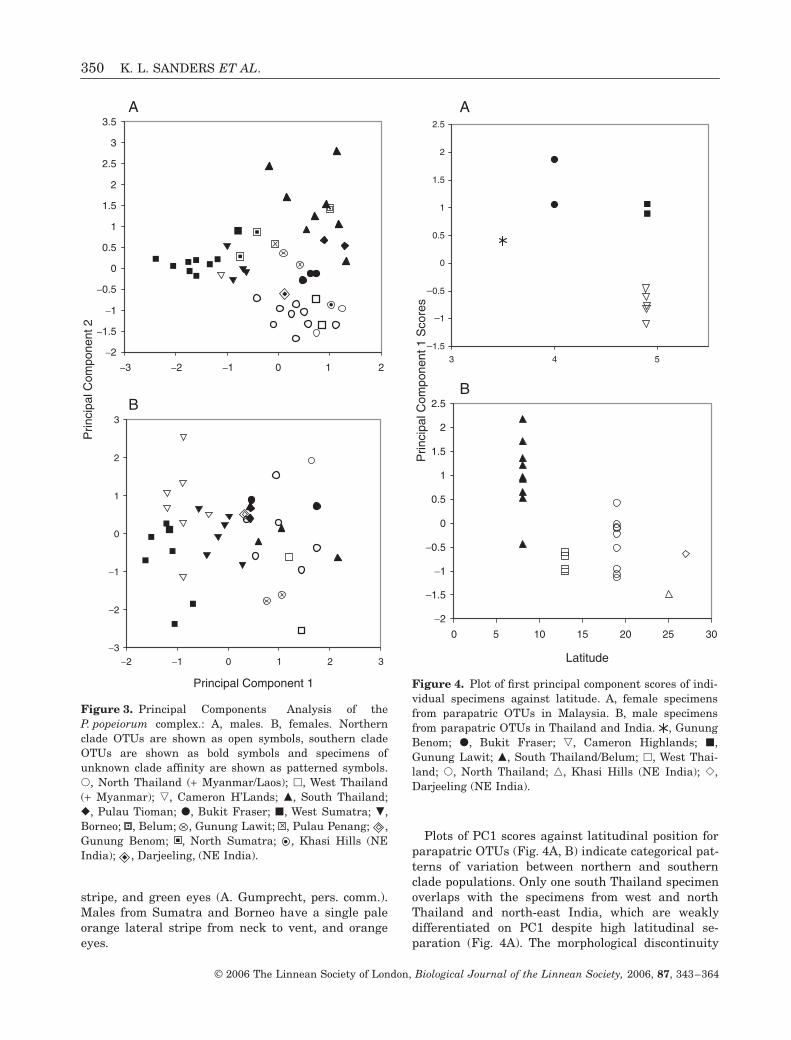
PCA plots (Fig. 3A, B) show a clearer pattern of geo-graphical variation in males than in females, althoughOTUs do not form distinct clusters in either sex. Inboth sexes, the specimens from the Cameron High-lands, Sumatra and Borneo are separated from all
remaining OTUs on PC1 by the more anterior occur-rence of several scale reductions, lower ventral,supralabial and sublabial scale counts, fewer scalesbetween the edge of the mouth and the first ventralscale, and fewer scales between the supraoculars.
Female specimens from Bukit Fraser and GunungLawit (Malaysia), north Thailand, Myanmar, Laos,west Thailand, south Thailand and Pulau Tioman areundifferentiated in our multivariate analysis. How-ever, females from north Thailand, Myanmar, Laosand west Thailand can be distinguished from southThailand, Malaysia and Tioman females by a moredistinct lateral stripe that covers at least 100%(vs. < 50%) of the first dorsal scale row. Females can befurther separated by eye colour, which is orange in theSumatra and Borneo populations, and yellow or greenin all other OTUs.
Male specimens from Thailand, Tioman, BukitFraser and Gunung Lawit, and north-east India areseparated on PC2 primarily by colour pattern charac-ters (they can also be distinguished by eye colour,although this was not included in our analyses), andalso by scalation (scale reduction characters and sub-caudal scale counts). The presence of dorsal cross-bands along the body and tail and yellow eyes distin-guish males from Thailand south of Phang Nga,Belum and Pulau Tioman. Males from west and northThailand form a separate group on the basis of redeyes and a red lateral stripe that runs above a whitestripe from eye to neck, and below a white stripe fromneck to vent. A photograph of the Phang Nga specimenincludes it in this group due to the presence of red eyesand a red postocular stripe. Males from Bukit Fraserand Gunung Lawit have a red (below) and white(above) lateral stripe from neck to vent, but there is nopostocular stripe and the eyes are green (A. Gum-precht, pers. comm.). Cameron Highlands males aredistinguished from these groups by a complete lack ofred pigmentation on the body, a reduced white lateral
Table 2. Between-OTU frequencies of fixed nucleotide differences for 12S and 16S sequences. The mean between-OTUfrequency of fixed differences is 3.33 in the southern clade (above diagonal), and 9.66 in the northern clade (below diagonal).The mean between-clade frequency of fixed differences is 12.88
NN. Thailand& Laos Myanmar W. Thailand Cam h’lands S. Thailand B. Fraser Borneo
N. Thailand & Laos 5 0 7 11 8 11 9 10Myanmar 2 7 0 11 14 15 15 17W.Thailand 2 11 11 0 11 13 12 14Cam h’lands 8 8 14 11 0 17 11 15S. Thailand 4 11 15 13 17 0 3 5B. Fraser 3 9 15 12 11 3 0 2Borneo 4 10 17 14 15 5 2 0
350 K. L. SANDERS ET AL.
© 2006 The Linnean Society of London, Biological Journal of the Linnean Society, 2006, 87, 343–364
stripe, and green eyes (A. Gumprecht, pers. comm.).Males from Sumatra and Borneo have a single paleorange lateral stripe from neck to vent, and orangeeyes.
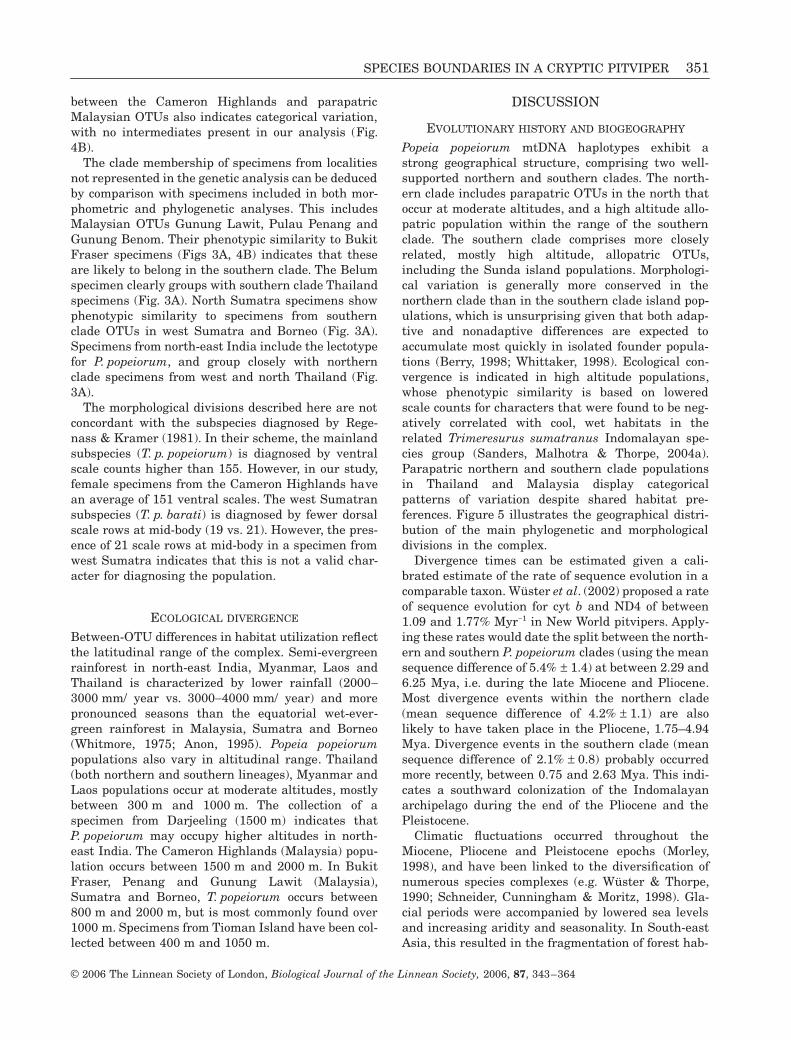
Plots of PC1 scores against latitudinal position forparapatric OTUs (Fig. 4A, B) indicate categorical pat-terns of variation between northern and southernclade populations. Only one south Thailand specimenoverlaps with the specimens from west and northThailand and north-east India, which are weaklydifferentiated on PC1 despite high latitudinal se-paration (Fig. 4A). The morphological discontinuity
Figure 3. Principal Components Analysis of theP. popeiorum complex.: A, males. B, females. Northernclade OTUs are shown as open symbols, southern cladeOTUs are shown as bold symbols and specimens ofunknown clade affinity are shown as patterned symbols.�, North Thailand (+ Myanmar/Laos); �, West Thailand(+ Myanmar); �, Cameron H’Lands; �, South Thailand;�, Pulau Tioman; �, Bukit Fraser; �, West Sumatra; �,Borneo; , Belum; , Gunung Lawit; , Pulau Penang; ,Gunung Benom; , North Sumatra; , Khasi Hills (NEIndia); , Darjeeling, (NE India).
−2
−1.5
−1
−0.5
0
0.5
1
1.5
2
2.5
3
3.5
−3 −2 −1 0 2
−3
−2
−1
0
1
2
3
−2 −1 0 2
Principal Component 1
B
AP
rinci
pal C
ompo
nent
2
1
1 3
Figure 4. Plot of first principal component scores of indi-vidual specimens against latitude. A, female specimensfrom parapatric OTUs in Malaysia. B, male specimensfrom parapatric OTUs in Thailand and India. , GunungBenom; �, Bukit Fraser; �, Cameron Highlands; �,Gunung Lawit; �, South Thailand/Belum; �, West Thai-land; �, North Thailand; , Khasi Hills (NE India); ,Darjeeling (NE India).
−2
−1.5
−1
−0.5
0
0.5
1
1.5
2
2.5
0 10 15 20 25 30
Latitude
−1.5
−1
−0.5
0
0.5
1
1.5
2
2.5
3 4 5
A
B
Prin
cipa
l Com
pone
nt 1
Sco
res
5
SPECIES BOUNDARIES IN A CRYPTIC PITVIPER 351
© 2006 The Linnean Society of London, Biological Journal of the Linnean Society, 2006, 87, 343–364
between the Cameron Highlands and parapatricMalaysian OTUs also indicates categorical variation,with no intermediates present in our analysis (Fig.4B).
The clade membership of specimens from localitiesnot represented in the genetic analysis can be deducedby comparison with specimens included in both mor-phometric and phylogenetic analyses. This includesMalaysian OTUs Gunung Lawit, Pulau Penang andGunung Benom. Their phenotypic similarity to BukitFraser specimens (Figs 3A, 4B) indicates that theseare likely to belong in the southern clade. The Belumspecimen clearly groups with southern clade Thailandspecimens (Fig. 3A). North Sumatra specimens showphenotypic similarity to specimens from southernclade OTUs in west Sumatra and Borneo (Fig. 3A).Specimens from north-east India include the lectotypefor P. popeiorum, and group closely with northernclade specimens from west and north Thailand (Fig.3A).
The morphological divisions described here are notconcordant with the subspecies diagnosed by Rege-nass & Kramer (1981). In their scheme, the mainlandsubspecies (T. p. popeiorum) is diagnosed by ventralscale counts higher than 155. However, in our study,female specimens from the Cameron Highlands havean average of 151 ventral scales. The west Sumatransubspecies (T. p. barati) is diagnosed by fewer dorsalscale rows at mid-body (19 vs. 21). However, the pres-ence of 21 scale rows at mid-body in a specimen fromwest Sumatra indicates that this is not a valid char-acter for diagnosing the population.
ECOLOGICAL DIVERGENCE
Between-OTU differences in habitat utilization reflectthe latitudinal range of the complex. Semi-evergreenrainforest in north-east India, Myanmar, Laos andThailand is characterized by lower rainfall (2000−3000 mm/ year vs. 3000−4000 mm/ year) and morepronounced seasons than the equatorial wet-ever-green rainforest in Malaysia, Sumatra and Borneo(Whitmore, 1975; Anon, 1995). Popeia popeiorumpopulations also vary in altitudinal range. Thailand(both northern and southern lineages), Myanmar andLaos populations occur at moderate altitudes, mostlybetween 300 m and 1000 m. The collection of aspecimen from Darjeeling (1500 m) indicates thatP. popeiorum may occupy higher altitudes in north-east India. The Cameron Highlands (Malaysia) popu-lation occurs between 1500 m and 2000 m. In BukitFraser, Penang and Gunung Lawit (Malaysia),Sumatra and Borneo, T. popeiorum occurs between800 m and 2000 m, but is most commonly found over1000 m. Specimens from Tioman Island have been col-lected between 400 m and 1050 m.
DISCUSSION
EVOLUTIONARY HISTORY AND BIOGEOGRAPHY
Popeia popeiorum mtDNA haplotypes exhibit astrong geographical structure, comprising two well-supported northern and southern clades. The north-ern clade includes parapatric OTUs in the north thatoccur at moderate altitudes, and a high altitude allo-patric population within the range of the southernclade. The southern clade comprises more closelyrelated, mostly high altitude, allopatric OTUs,including the Sunda island populations. Morphologi-cal variation is generally more conserved in thenorthern clade than in the southern clade island pop-ulations, which is unsurprising given that both adap-tive and nonadaptive differences are expected toaccumulate most quickly in isolated founder popula-tions (Berry, 1998; Whittaker, 1998). Ecological con-vergence is indicated in high altitude populations,whose phenotypic similarity is based on loweredscale counts for characters that were found to be neg-atively correlated with cool, wet habitats in therelated Trimeresurus sumatranus Indomalayan spe-cies group (Sanders, Malhotra & Thorpe, 2004a).Parapatric northern and southern clade populationsin Thailand and Malaysia display categoricalpatterns of variation despite shared habitat pre-ferences. Figure 5 illustrates the geographical distri-bution of the main phylogenetic and morphologicaldivisions in the complex.
Divergence times can be estimated given a cali-brated estimate of the rate of sequence evolution in acomparable taxon. Wüster et al. (2002) proposed a rateof sequence evolution for cyt b and ND4 of between1.09 and 1.77% Myr−1 in New World pitvipers. Apply-ing these rates would date the split between the north-ern and southern P. popeiorum clades (using the meansequence difference of 5.4% ± 1.4) at between 2.29 and6.25 Mya, i.e. during the late Miocene and Pliocene.Most divergence events within the northern clade(mean sequence difference of 4.2% ± 1.1) are alsolikely to have taken place in the Pliocene, 1.75–4.94Mya. Divergence events in the southern clade (meansequence difference of 2.1% ± 0.8) probably occurredmore recently, between 0.75 and 2.63 Mya. This indi-cates a southward colonization of the Indomalayanarchipelago during the end of the Pliocene and thePleistocene.
Climatic fluctuations occurred throughout theMiocene, Pliocene and Pleistocene epochs (Morley,1998), and have been linked to the diversification ofnumerous species complexes (e.g. Wüster & Thorpe,1990; Schneider, Cunningham & Moritz, 1998). Gla-cial periods were accompanied by lowered sea levelsand increasing aridity and seasonality. In South-eastAsia, this resulted in the fragmentation of forest hab-

352 K. L. SANDERS ET AL.
© 2006 The Linnean Society of London, Biological Journal of the Linnean Society, 2006, 87, 343–364
itats on the mainland and the formation of landbridges in the Sunda shelf (Hall & Holloway, 1998).The geographical structuring of P. popeiorum haplo-types is suggestive of isolation in mainland forestrefugia and subsequent habitat expansion leading tosecondary contact. Dispersal to the Sunda shelf islikely to have occurred via land bridges; rising sea lev-els would have subsequently led to the isolation of
island populations, which may have followed theirretreating habitats to higher elevations.
DELIMITING SPECIES BOUNDARIES
Lineage-based species concepts recognize species onthe basis of reciprocal monophyly of gene genealogies(Cracraft, 1983, 1987; Donoghue, 1985; Mishler, 1985;
Figure 5. Geographic distribution of phylogenetic and morphological divisions in the P. popeiorum complex. Correctedpairwise sequence divergence (ND4 and cyt b) is shown between OTUs, represented by symbols indicating the maingroupings in morphological analyses. Northern clade OTUs are shown as open symbols, southern clade OTUs are shownas bold symbols.
INDIA
LAOS
MYANMAR
THAILAND
MALAYSIA
SUMATRABORNEO
0.3
0.4
0.4
0.53.0
3.4
4.04.6
5.7
4.2
2.74.8
5.32.6
2.2
1.7
1.72.02.3

SPECIES BOUNDARIES IN A CRYPTIC PITVIPER 353
© 2006 The Linnean Society of London, Biological Journal of the Linnean Society, 2006, 87, 343–364
Smith, 1994; Baum & Donoghue, 1995; Baum & Shaw,1995). However, there are a number of problems asso-ciated with tree-based species diagnosis. Gene treesmay not always be congruent with species trees due tolineage sorting of ancestral polymorphisms (Moore,1995). Furthermore, the matrilinear nonrecombiningmode of mtDNA inheritance results in a phylogeneticpattern of descent even among interbreeding organ-isms (Davis, 1996); thus, even a gene tree that accu-rately represents phylogenetic history is of limitedvalue in predicting hybridization between closelyrelated taxa (Mallet, 2001; Schluter, 2001). Paraphylyis particularly common in groups containing periph-eral isolates, such as divergent island populations,and is a result of the fundamental process of specia-tion in these cases (Harrison, 1998; Funk & Omland,2003).
Monophyly exists at all levels in a phylogeny, andthe actual level at which species should be recognizedis unclear. We could delimit two monophyletic speciesin the P. popeiorum complex, corresponding to thestrongly supported northern and southern clades.Alternatively, we could delimit four species, corre-sponding to the two monophyletic groups in each pri-mary clade. However, the monophyly criterion isunlikely to led to reliable species delimitation in theP. popeiorum complex. Groupings based on monophylydo not correspond either to the geographical distribu-tion of OTUs or to morphological and ecological divi-sions in the complex.
For example, the Thailand OTU of the southernclade is closer to northern clade lineages, in terms ofgeographical and altitudinal range, than to southernclade lineages with which it shares a more recent com-mon ancestor. Furthermore, Thailand, Myanmar, Laosand Cameron Highlands populations of the northernclade are monophyletic with respect to the westThailand population. However, the west Thailand pop-ulation is phenotypically and ecologically undifferen-tiated from parapatric north Thailand, Myanmar andLaos populations. Therefore, these OTUs are morelikely to represent an independent group with respectto the phenotypically divergent, high altitude allopat-ric Cameron Highlands population.
SEQUENCE DIVERGENCE
Mitochondrial pairwise sequence differences, rangingbetween 1.6% and 6.2%, are often used to delimitsnake species (Kraus, Mink & Brown, 1996; Zamudio& Greene, 1997; Rodriguez-Robles & de Jesus-Escobar, 2000; Ashton & de Queiroz, 2001; Keogh,Barker & Shine, 2001; Rawlings & Donnellan, 2003).Comparable levels of divergence are found betweenP. popeiorum lineages (1.7 ± 0.8–5.7% ± 1.6). However,relatively ancient haplotypes can coexist in a single
interbreeding population (Thomaz, Guiller & Clarke,1996; Ogden & Thorpe, 2002) and can mask highlevels of gene flow mediated by dispersing males(Palumbi & Baker, 1994; Thorpe, Black & Malhotra,1996; Stenson, Malhotra & Thorpe, 2002). Conse-quently, mtDNA haplotype distribution alone is aninsufficient criterion for recognizing species, andshould be combined with concordant support from atleast one independent source of data. Parapatricnorthern clade OTUs in Thailand and Myanmar arestrongly differentiated by mtDNA haplotype (averagedivergence = 4.14% ± 1.0), but are phenotypicallyindistinguishable in both sexes. Gene exchangebetween these populations is especially likely giventhat male pitvipers are known to disperse more widelythan females (Shine, 1993).
FIXED NUCLEOTIDE DIFFERENCES
This diagnostic criterion predicts that differences ininherited character states will most often reach fixa-tion in the context of reproductive isolation, and usesthese as evidence for barriers to gene exchange insympatric and parapatric populations (Davis & Nixon,1992). In the present study, higher frequencies of fixeddifferences are found between northern clade lineagesthan between the more recently diverged southernclade lineages. There are no fewer fixed nucleotide dif-ferences between parapatric lineages than betweenallopatric lineages. This could be viewed as evidencefor reduced gene flow between parapatric populations.However, the extent of introgression can vary acrossthe genome (Harrison, 1986) and gene flow is possibledespite fixed differences at some loci (Harrison, 1998).Furthermore, spurious determination of fixed nucle-otide differences may result from insufficient sam-pling within OTUs (Walsh, 2000), or the extinction ofhaplotypes (Templeton, 1989). Unfortunately, thesample sizes currently available do not allow us to dis-tinguish between alternative hypotheses of characterfixation.
PHENETIC SPECIES CRITERIA
The most widely applied morphological method ofdelimiting species is to base species status on the pres-ence of fixed or nonoverlapping character differencesbetween geographical samples (Wiens & Servedio,2000). Alternatively, multivariate analysis of general-ized phenotypes can be used to identify groupings(phenetic clusters), which are considered species inthe absence of intermediates (Sokal & Crovello, 1970;Mallet, 1995).
The lack of discrete clusters in our multivariateanalyses of P. popeiorum morphology is incompatiblewith recognizing multiple species according to this cri-

354 K. L. SANDERS ET AL.
© 2006 The Linnean Society of London, Biological Journal of the Linnean Society, 2006, 87, 343–364
terion. However, extreme morphological conservative-ness is typical even between distantly related greenspecies of the Trimeresurus radiation (Malhotra &Thorpe, 2004a). Popeia popeiorum OTUs can begrouped tentatively on the basis of scalation andcolour pattern characters. These groupings correspondto: (1) north-east India and northern clade Thailand,Myanmar and Laos; (2) southern clade Thailand,Belum and Pulau Tioman; (3) Bukit Fraser, GunungLawit and Pulau Penang (Malaysia); (4) Borneo, westSumatra and north Sumatra; (5) the Cameron High-lands population, although this OTU partially over-laps with Sumatran and Borneon specimens belongingto the southern clade in both sexes.
Potentially informative morphological differencesalso exist between parapatric lineages in Malaysiaand Thailand. There are no known colour patternintermediates between northern and southern clademales in southern Thailand, and only one inter-mediate is present in our analysis of generalizedphenotype. Morphological discontinuity between theCameron Highlands and parapatric Malaysian lin-eages also indicates a categorical pattern of variation.This concordance between morphological and molecu-lar variation in parapatric populations suggests thatin Malaysia and Thailand northern clade OTUsrepresent independent populations with respect tosouthern clade OTUs.
ECOLOGICAL SPECIES CRITERIA
Although relatively few species concepts promote eco-logical criteria (Van Valen, 1976; Templeton, 1989),ecology is an important component of current specia-tion research. Some authors have argued that speciesdelimitation should be treated independently frominvestigations of the speciation process due to a risk ofcircularity and compromised generalizability (Rieppel,1986; Luckow, 1995; Goldstein & DeSalle, 2000). How-ever, given that both sympatric and allopatric popula-tions are more likely to speciate in the context ofadaptive divergence (Endler, 1992; Marchetti, 1993;Schluter, 2001), ecological compatibility may provide auseful indication of whether two closely related popu-lations will hybridize (Schluter, 2001; Templeton,2001).
Overlapping altitudinal range can be used as a basisfor ecological compatibility in the P. popeiorum group.Southern clade P. popeiorum OTUs share moderateand high altitudes, and overlap in altitudinal rangewith moderate altitude northern clade OTUs in Thai-land, Myanmar and Laos. However, the exclusivelyhigh altitude Cameron Highlands population is eco-logically incompatible with the remaining northernclade populations in Thailand, Myanmar and Laos,from which it is also strongly differentiated by pheno-
type. Shared habitat may facilitate introgressionbetween the Cameron Highlands and parapatricMalaysian lineages. However, the morphological dis-continuity between these OTUs indicates that this isimprobable, and introgression is more likely betweennorthern clade OTUs in Thailand, given their lack ofphenotypic differentiation.
TAXONOMIC RECOMMENDATIONS FOR THE P. POPEIORUM COMPLEX
The current subspecific taxonomy of the P. popeiorumcomplex is clearly inconsistent with the molecular,morphological and ecological divisions revealed inthis study. We propose a taxonomic reorganization ofthe complex into three species that conservativelyrepresent the evolutionary units delineated by ourdata. Northern clade OTUs in north-east India,Myanmar, Laos and Thailand are morphologicallyundifferentiated in females, and group closely in ouranalysis of males. Furthermore, there is no knownbiogeographical barrier to introgression of these,mostly parapatric, lineages. Therefore, despite rela-tively high levels of mtDNA haplotype divergence,we recommend that these populations be consideredas a single species. Since it includes the lectotypeof P. popeiorum, this species corresponds toP. popeiorum s.s. The Cameron Highlands populationrepresents a morphologically and ecologically diver-gent allopatric lineage with respect to the remainingnorthern clade OTUs. In addition, we find no evi-dence of intergradation with ecologically compatible,parapatric southern clade OTUs, either in terms ofmtDNA haplotype distribution or the presence ofmorphological intermediates. On this basis we pro-pose full species status for the Cameron Highlandspopulation (Sanders et al., 2004b). The southernclade OTUs (south Thailand, Malaysia, Sumatra,Borneo and Pulau Tioman) represent recentlydiverged populations with compatible habitat pre-ferences. Morphological differentiation is observedwithin this group, but cannot be interpreted in thecontext of intrinsic barriers to gene flow betweenthese populations due to their allopatric distribution.Furthermore, intergradation with parapatric, ecolo-gically compatible northern clade populations isunlikely in light of the categorical patterns of varia-tion between these OTUs. Therefore, we suggest aconservative arrangement of the southern cladepopulations as a single, polytypic, equatorial species.This newly defined species includes two subspecies(T. p. barati and T. p. sabahi) of equal priority sincethey were published in the same paper. We propose touse the name P. sabahi (comb. nov.). The geographicaldistributions of the species of Popeia delimited by thisstudy are illustrated in Figure 6.

SPECIES BOUNDARIES IN A CRYPTIC PITVIPER 355
© 2006 The Linnean Society of London, Biological Journal of the Linnean Society, 2006, 87, 343–364
COMPARISON WITH ALTERNATIVE SYSTEMATIC ARRANGEMENTS
An alternative interpretation of the systematic rela-tionships within the Popeia popeiorum complex waspublished after this paper was accepted (Vogel et al.,2004), in which the subspecies T. p. sabahi and T. p.barati are raised to species status, and two new spe-cies, T. nebularis (Cameron Highlands) and T. fucatus(southern Thailand and West Malaysia excluding the
Cameron Highlands) are described. T. fucatus isreferred to P. sabahi in our arrangement along withpopulations from Sumatra and Borneo, while P. nebu-laris (comb. nov.) takes precedence over P. inornata(Sanders et al., 2004b).
Although the species definitions in Vogel et al.(2004) are also based on the identification of morpho-logically diagnosable clusters in multivariate analy-ses, an examination of their figures 1 and 2, whichshow plots of the first two principle components of an
Figure 6. Geographic distribution of Popeia species delimited by this study. Circles represent P. popeiorum s.s.; squaresrepresent P. sabahi; a triangle represents P. nebularis.
INDIA
MYANMAR
LAOS
THAILAND
MALAYSIA
SUMATRA
BORNEO
Cameron Highlands
356 K. L. SANDERS ET AL.
© 2006 The Linnean Society of London, Biological Journal of the Linnean Society, 2006, 87, 343–364
analysis based on 18 scalation characters for malesand females respectively, clearly shows that the actualdistribution of points representing individual speci-mens bears little relationship to the definition of theclusters which have been superimposed on them (e.g.there is almost complete overlap between Clusters Iand II for both sexes, and Clusters III to V in males).Hence, we believe that the authors’ statement that‘the results of the PCA . . . show in both cases theoccurrence of five clusters of plots’ (Vogel et al., 2004)is unfounded. All subsequent analyses (includingdefinition of species boundaries) are based on theseclusters, and hence have limited utility [see Thorpe(1983) for further discussion of the ability of canonicalvariate analysis, which is identical to DiscriminantCanonical Analysis as used by Vogel et al. (2004), tofind differences between predefined categories even ifthe predefined categories do not match the naturalcategories]. In fact, the main result discernible fromVogel et al.’s morphological analysis is very similar toours, i.e. that the Sumatran, Bornean and CameronHighlands populations are morphologically distin-guishable from the remaining populations. For thesereasons, we do not believe that the delimitation ofspecies in Vogel et al. (2004) reflects biologicallymeaningful units.
IMPLICATIONS FOR THE SPECIES DEBATE
Our study illustrates the discordance between speciesboundaries inferred from different pattern-based crite-ria. This underscores the dichotomy between evolution-ary groups and the categories that we use to definethem (Hey, 2000) and indicates that taxonomic revi-sions based on a single species criterion, despite advan-tages of comparability, are unlikely to lead to a realisticdelimitation of species. Therefore, following Mishler &Donoghue (1982), Baum & Shaw (1995), Mallet (2001),Puorto et al. (2001) and Wiens & Penkrot (2002), werecommend an approach to species delimitation thatcombines as many independent sources of data as areavailable. We further emphasize the importance of crit-ical analysis of species criteria, particularly withrespect to delimiting species on the basis of data setscompromised by incomplete sampling.
ACKNOWLEDGEMENTS
We thank the Natural Environment Research Council(NER/S/A2000/03695), the Leverhulme Trust (F174/Iand F174/0) and the Wellcome Trust (057257/Z/99/Zand 060384/Z/00/Z) for major funding for this project.Grants from the Darwin Initiative (162/6/065), theLinnean Society Side, Bonhote, Omer-Cooper andWestwood Fund, the Royal Society and the CarnegieTrust provided additional support for fieldwork. We
thank Dr Shahrul Anuar of the Universiti SainsMalaysia, Penang, for his assistance in the field. A.Gumprecht, L. Chanhome, K. Thirakhupt, T. Chan-ard, J. Nabhitabhata, P. P. van Dijk, C. Rangsiyanon,S. Paglia, M. J. Cox, J. Murray, G. Valle, B. Yanto, K.Tepedelen, M. Lakim, J. Nais, J. Sani, F. Cheong, L. T.Ming, D. Shoub, and D. Paolini are also gratefullyacknowledged for their assistance with obtaining sam-ples. Tissue loans were provided by the CalifornianAcademy of Sciences and the Field Museum of NaturalHistory, Chicago. We thank the National ScienceCouncil of Thailand, Perhilitan Malaysia and theSabah Parks Board for permission to carry out field-work and collect samples.
REFERENCES
Anonymous. 1995. National Geographic Atlas of the World,6th edn. Washington DC: National Geographic Society.
Ashton KG, de Queiroz A. 2001. Molecular systematics ofthe Western Rattlesnake, Crotalus viridis (Viperidae), withcomments on the utility of the D-loop in phylogenetic studiesof snakes. Molecular Phylogenetics and Evolution 21 (2):176–189.
Avise JC, Wollenberg K. 1997. Phylogenetics and the originof species. Proceedings of the National Academy of Sciences,USA 94: 7748–7755.
Baum DA, Donoghue MJ. 1995. Choosing among alternative‘phylogenetic’ species concepts. Systematic Botany 20: 560–573.
Baum DA, Shaw KL. 1995. Genealogical perspectives on thespecies problem. In: Hoch PC, Stevenson AG, eds. Experi-mental and molecular approaches to plant biosystematics. St.Louis: Missouri Botanical Garden, 289–303.
Berry RJ. 1998. Evolution of small mammals. In: Grant PR,ed. Evolution on islands. Oxford: Oxford University Press,35–50.
Chippindale PT, Wiens JJ. 1994. Weighting, partitioning,and combining characters in phylogenetic analysis. System-atic Biology 43: 278–287.
Cracraft J. 1983. Species concepts and speciation analysis. In:Johnston RF, ed. Current ornithology, Vol. 1. New York:Plenum Press, 159–187.
Cracraft J. 1987. Species concepts and the ontology of evolu-tion. Biology and Philosophy 2: 329–346.
Cummings MP, Otto SP, Wakeley J. 1995. Sampling prop-erties of DNA sequence data in phylogenetic analysis. Molec-ular Biology and Evolution 12: 814–822.
Davis JI, Nixon KC. 1992. Populations, genetic variation,and the delimitation of phylogenetic species. SystematicBiology 41: 421–435.
Davis JI. 1996. Phylogenetics, molecular variation and spe-cies concepts. Bioscience 46: 502–511.
Donoghue MJ. 1985. A critique of the biological species con-cept and recommendations for a phylogenetic alternative.Bryologist 88: 172–181.
Dowling HG. 1951. A proposed standard system of countingventrals in snakes. British Journal of Herpetology 1: 97–99.

SPECIES BOUNDARIES IN A CRYPTIC PITVIPER 357
© 2006 The Linnean Society of London, Biological Journal of the Linnean Society, 2006, 87, 343–364
Eldredge N, Cracraft J. 1980. Phylogenetic patterns and theevolutionary process. New York: Columbia University Press.
Endler JA. 1992. Signals, signal conditions, and the directionof evolution. American Naturalist 139: 125–153.
Funk DJ, Omland KE. 2003. The frequency, causes and con-sequences of species level paraphyly and polyphyly: insightsfrom animal mitochondrial DNA. Annual Review of Ecology,Evolution and Systematics 34: 397–423.
Giannasi NC, Thorpe RS, Malhotra A. 2001. The use ofamplified fragment length polymorphism (AFLP) in deter-mining species trees at fine taxonomic levels: analysis of amedically important snake, Trimeresurus albolabris. Molec-ular Ecology 10: 419–426.
Goldstein PZ, Brower AVZ. 2002. Molecular systematicsand the origin of species. New Synthesis or MethodologicalIntrogressions? In: DeSalle R, Giribet G, Wheeler W, eds.Molecular Systematics and Evolution: Theory and Practice.Switzerland: Birkhauser, 147–161.
Goldstein PZ, DeSalle R. 2000. Phylogenetic species,nested hierarchies, and character fixation. Cladistics 16:364–384.
Greene HW. 1997. Systematics and natural history, founda-tions for understanding and conserving biodiversity. Ameri-can Zoologist 34: 48–56.
Hall R, Holloway JD. 1998. Biogeography and geological evo-lution of SE Asia. Leiden: Backhuys.
Harrison RG. 1986. Pattern and process in a narrow hybridzone. Heredity 56: 337–349.
Harrison RG. 1998. Linking evolutionary pattern and pro-cess: The relevance of species concepts for the study of spe-ciation. In: Howard DJ, Berlocher SH, eds. Endless forms:species and speciation. New York: Oxford University Press,19–31.
Hennig W. 1966. Phylogenetic systematics. Urbana: Univer-sity of Illinois Press.
Hey J. 2000. The mind of the species problem. Trends in Ecol-ogy and Evolution 17 (7): 326–329.
Hillis DM, Huelsenbeck JP. 1992. Signal, noise, and reli-ability in molecular phylogenetic analysis. Heredity 83: 189–195.
Huelsenbeck JP, Ronquist FR. 2001. MRBAYES: Bayesianinference of phylogeny. Bioinformatics 17: 754–755.
Keogh JS, Barker D, Shine R. 2001. Heavily exploited butpoorly known: systematics and biogeography of commer-cially harvested pythons (Python curtus group) in SoutheastAsia. Biological Journal of the Linnean Society of London 73:113–129.
Knight A, Mindell DP. 1993. Substitution bias, weighting ofDNA sequence evolution, and the phylogenetic position ofFea’s viper. Systematic Biology 42: 18–31.
Kraus F, Mink DG, Brown WM. 1996. Crotaline intergenericrelationships based on mitochondrial DNA sequence data.Copeia 1996: 763–773.
Kumar S, Tamura K, Jakobsen IB, Nei M. 2001. MEGA2:Molecular Evolutionary Genetics Analysis Software, Tempe,Arizona: Arizona State University.
Luckow M. 1995. Species concepts, assumptions, methods,and applications. Systematic Botany 20 (4): 589–605.
MacKinnon J. 1997. Protected areas systems review of theIndo-Malayan realm. Hong Kong: Asian Bureau forConservation.
Malhotra A, Thorpe RS. 1997. New perspectives on the evo-lution of South-East Asian pit vipers (genus Trimeresurus)from molecular studies). In: Thorpe RS, Wüster W, MalhotraA, eds. Venomous snakes: ecology, evolution and snakebite.Symposia of the Zoological Society of London 70. Oxford:Oxford University Press, 115–118.
Malhotra A, Thorpe RS. 2000. A phylogeny of the Trimeresu-rus group of pitvipers: new evidence from a mitochondrialgene tree. Molecular Phylogenetics and Evolution 16: 199–211.
Malhotra A, Thorpe RS. 2004a. A phylogeny of four mito-chondrial gene regions suggests a revised taxonomy forAsian pit vipers (Trimeresurus and Ovophis). Molecular Phy-logenetics and Evolution 32 (1): 83–100.
Malhotra A, Thorpe RS. 2004b. Reassessment of the validityand diagnosis of the pitviper Trimeresurus venustus (Vogel,1991). Herpetological Journal 14: 21–33.
Malhotra A, Thorpe RS. 2004c. Maximising information insystematic revisions: a combined molecular and morphologi-cal analysis of a cryptic green pitviper complex (Trimeresu-rus stejnegeri). Biological Journal of the Linnean Society 82(2): 219–235.
Mallet J. 1995. A species definition for the Modern Synthesis.Trends in Ecology and Evolution 10: 294–299.
Mallet J. 2001. Species, concepts of. In: Levin SA, ed. Ency-clopedia of biodiversity, Vol. 5. New York: Academic Press,427–440.
Marchetti K. 1993. Dark habitats and bright birds illustratethe role of the environment in species divergence. Nature362: 149–152.
Mayr E. 1963. Animal species and evolution. Cambridge, MA:Harvard University Press.
Mishler BD. 1985. The morphological, developmental andphylogenetic species basis of concepts in bryophytes. Bryol-ogist 88: 207–214.
Mishler BD, Donoghue MJ. 1982. Species concepts: a casefor pluralism. Systematic Zoology 31: 491–503.
Moore WS. 1995. Inferring phylogenies from mtDNA varia-tion: mitochondrial gene trees versus nuclear gene trees.Evolution 49: 718–726.
Morley RJ. 1998. Palynological evidence for Tertiary plantdispersals in the SE Asian region in relation to plate tecton-ics and climate. In: Hall R, Holloway JD, eds. Biogeographyand Geological Evolution of SE Asia, Leiden: BackhuysPublishers, 211–234.
Nixon KC, Wheeler QC. 1990. An amplification of the phy-logenetic species concept. Cladistics 6: 211–223.
Ogden R, Thorpe RS. 2002. Molecular evidence for ecologicalspeciation in tropical habitats. Proceedings of the NationalAcademy of Sciences, USA 99: 13612–13615.
Orlov NL, Ananjeva NB, Barabanov AV, Ryabov SA,Khalikov R. 2002. Diversity of vipers (Azemiopinae,Crotalinae) in East, Southeast, and South Asia:Annotated checklist and natural history data (Reptilia:Squamata: Serpentes: Viperidae). Faunistische Abhand-

358 K. L. SANDERS ET AL.
© 2006 The Linnean Society of London, Biological Journal of the Linnean Society, 2006, 87, 343–364
lungen. Staatliches Museum fur Tierkunde, Dresden 23:177–218.
Palumbi SR, Baker CS. 1994. Contrasting population struc-ture from nuclear intron sequences and mtDNA of hump-back whales. Molecular Biology and Evolution 11: 426–435.
Parkinson CL. 1999. Molecular systematics and biogeograph-ical history of pitvipers as determined by mitochondrial ribo-somal DNA sequences. Copeia 1999: 576–586.
Parkinson CL, Moody SM, Ahlquist JE. 1997. Phylogeneticrelationships of the ‘Agkistrodon Complex’ based on mito-chondrial DNA sequence data. In: Thorpe RS, Wüster W,Malhotra A, eds. Venomous snakes: ecology, evolution andsnakebite. Symposia of the Zoological Society of London 70.Oxford: Oxford University Press, 63–78.
Parkinson CL, Zamudio KR, Greene HW. 2000. Phylogeo-graphy of the pitviper clade Agkistrodon: historical ecology,species status, and conservation of cantils. Molecular Ecol-ogy 9: 411–420.
Patterson HEH. 1985. The recognition concept of species. In:Vrba ES, eds. Species and speciation. Pretoria: TransvaalMuseum, 21–29.
Posada D, Crandall KA. 2001. Selecting the best-fit model ofnucleotide substitution. Systematic Biology 50: 580–601.
Puorto G, Da Graça Salomão M, Theakston RDG, ThorpeRS, Warrell DA, Wüster W. 2001. Combining mitochon-drial DNA sequences and morphological data to infer speciesboundaries: phylogeography of lanceheaded pitvipers in theBrazilian Atlantic forest, and the status of Bothrops pradoi(Squamata: Serpentes: Viperidae). Journal of EvolutionaryBiology 14: 527–538.
de Queiroz A, Lawson R, Lemos-Espinal JA. 2002. Phylo-genetic relationships of North American garter snakes(Thamnophis) based on four mitochondrial genes: How muchDNA sequence is enough? Molecular Phylogenetics and Evo-lution 22: 315–329.
de Queiroz K. 1998. The general lineage concept of species,species criteria, and the process of speciation. In: HowardDJ, Berlocher SH, eds. Endless forms: species and speciation.New York: Oxford University Press, 57–75.
Rawlings L, Donnellan SC. 2003. Phylogeographic analysisof the green python, Morelia viridis, reveals cryptic diver-sity. Molecular Phylogenetics and Evolution 27: 36–44.
Regenass U, Kramer E. 1981. Systematik der grunengrubenottern Trimeresurus. Revue Suisse de Zoologie 88:186–193.
Rieppel O. 1986. Species are individuals: a review and cri-tique of the evolutionarily significant unit in biodiversityand conservation. Journal of Evolutionary Biology 20: 283–317.
Rodriguez-Robles JA, De Jesus-Escobar JM. 2000. Molec-ular systematics of New World gopher, bull, and pinesnakes(Pituophis: Colubridae), a transcontinental species complex.Molecular Phylogenetics and Evolution 14: 35–50.
Sambrook J, Frisch EF, Maniatis TE. 1989. Molecular clon-ing, A laboratory manual, 2nd edn. New York: Cold SpringHarbour Laboratory Press.
Sanders KL, Malhotra A, Gumprecht A, Thorpe RS,Kuch U. 2004b. A new species of pitviper of the genus Tri-
meresurus from West Malaysia (Squamata: Viperidae). Rus-sian Journal of Herpetology 11: 171–184.
Sanders KL, Malhotra A, Thorpe RS. 2004a. Ecologicaldiversification in a group of Indomalayan pitvipers (Trim-eresurus): convergence in taxonomically important traits hasimplications for species identification. Journal of Evolution-ary Biology 17 (4): 721–731.
Schluter D. 2001. Ecology and the origin of species. Trends inEcology and Evolution 16 (7): 372–380.
Schneider CJ, Cunningham M, Moritz C. 1998. Compara-tive phylogeography and the history of endemic vertebratesin the wet tropics of Australia. Molecular Ecology 7: 487–498.
Shine R. 1993. Sexual dimorphism in snakes. In: Seigel RA,Collins JT, eds. Snakes: ecology and behaviour. New York,USA: McGraw-Hill, 49–78.
Sites JW Jr, Marshall JC. 2003. Delimiting species: aRenaissance issue in systematic biology. Trends in Ecologyand Evolution 18 (9): 462–470.
Smith AB. 1994. Systematics and the fossil record, document-ing evolutionary patterns. Oxford: Blackwell Scientific.
Sokal RR, Crovello TJ. 1970. The biological species concept:a critical evaluation. American Naturalist 104: 127–153.
Stenson A, Malhotra A, Thorpe RS. 2002. Population dif-ferentiation and nuclear gene flow in the Dominican anole(Anolis oculatus). Molecular Ecology 11: 1679–1688.
Swofford DL. 2003. PAUP*. Phylogenetic Analysis Using Par-simony and Other Methods, Version 4.0. Sunderland, MA:Sinauer.
Tamura K, Nei M. 1993. Estimation of the number of nucle-otide substitutions in the control region of mitochondrialDNA of humans and chimpanzees. Molecular Biology andEvolution 10: 512–526.
Templeton AR. 1989. The meaning of species and specia-tion: A genetic perspective. In: Otte D, Endler JA, eds.Speciation and its consequences. Sunderland, MA: Sinauer,3–27.
Templeton AR. 2001. Using phylogeographic analyses of genetrees to test species status and processes. Molecular Ecology10: 779–791.
Thomaz D, Guiller A, Clarke B. 1996. Extreme divergenceof mitochondrial DNA within species of pulmonate landsnails. Proceedings of the Royal Society of London, Series B263: 363–368.
Thorpe RS. 1976. Biometric analysis of geographic variationand racial affinities. Biology Review 51: 407–452.
Thorpe RS. 1983. A review of the numerical methods for rec-ognising and analysing racial differentiation. In: FelsensteinJ, ed. Numerical taxonomy. NATO ASI Series, Vol. G1.Berlin: Springer, 404–423.
Thorpe RS, Black H, Malhotra A. 1996. Matrix correspon-dence tests on the DNA phylogeny of the Tenerife lacertidelucidates both historical causes and morphological adapta-tion. Systematic Biology 45: 35–343.
Van Valen L. 1976. Ecological species, multispecies and oaks.Taxon 25: 233–239.
Vogel G, David P, Pauwels OSG. 2004. A review of morpho-logical variation in Trimeresurus popeiorum (Serpentes:

SPECIES BOUNDARIES IN A CRYPTIC PITVIPER 359
© 2006 The Linnean Society of London, Biological Journal of the Linnean Society, 2006, 87, 343–364
Viperidae: Crotalinae) with the description of two new spe-cies. Zootaxa 727: 1–63.
Walsh PD. 2000. Sample size for the diagnosis of conservationunits. Conservation Biology 14: 1533–1537.
Whitmore TC. 1975. Tropical rain forests in the Far East.Oxford: Clarendon Press.
Whittaker RJ. 1998. Island biogeography: ecology, evolutionand conservation. Oxford: Oxford University Press.
Wiens JJ, Penkrot TA. 2002. Delimiting species using DNAand morphological variation and discordant species limitsin spiny lizards (Sceloporus). Systematic Biology 51 (1): 69–91.
Wiens JJ, Servedio MR. 2000. Species delimitation in sys-tematics: inferring diagnostic differences between species.Proceedings of the Royal Society of London, Series B 267:631–636.
Wu C-I. 2001. The genic view of the process of speciation. Jour-nal of Evolutionary Biology 14: 851–865.
Wüster W, Thorpe RS. 1990. Systematics and biogeographyof the Asiatic cobra (Naja naja) species complex in the Phil-ippine islands. In: Peters G, Hutterer R, eds. Vertebrates inthe tropics. Bonn: Museum Alexander Koenig. 333–341.
Wüster W, Thorpe RS, Salomao M, Thomas L, Puorto G,Theakston RDG, Warrell DA. 2002. Origin and phyloge-netic position of the Lesser Antillean species of Bothrops(Sepentes, Viperidae): Biogeographical and medical implica-tions. Bulletin of the Natural History Museum of London(Zoology) 68 (2): 101–106.
Zamudio KR, Greene HW. 1997. Phylogeography of the bush-master (Lachesis muta, Viperidae) – implications for neotro-pical biogeography, systematics, and conservation. BiologicalJournal of the Linnean Society of London 62: 421–442.
APPENDIX 1
Characters used in morphological analyses. *indicates significant between-OTU variation (P = < 0.05, ANOVA)(A) Scalation
Character Males Females
No. of ventral scales – first ventral identified according to the method of Dowling (1951) * *No. of pairs of subcaudal scales * –No. of unpaired subcaudal scales – –Division of anal scale (recorded as 0 = undivided; 1 = divided) – –Keeling of body scales at mid-body (recorded as 0 = none; 0.5 = weak; 1 = strong) * –No. of scale rows anterior to the vent – –No. of supralabial scales (average on left and right hand sides) * *No. of sublabial scales (average on left and right hand sides) * *No. of postocular scales * –No. of preocular scales – –No. of scales bordering the supraocular scales, excluding the preoculars and postoculars * *Minimum no. of scales separating the supraocular scales – *Maximum no. of scales separating the supraocular scales * *No. of sutures dividing supraoculars – –No. of scales between nasal scale and shield bordering the pit anteriorly – *No. of internasal scales * *Minimum no. of scales separating third supralabial and subocular scale * *Minimum no. of scales separating fourth supralabial and subocular scale * –Minimum no. of scales separating fifth supralabial and subocular scale – *Minimum no. of scales bordering suboculars, excluding the preoculars and postoculars * *Keeling of temporal scales * –Keeling of scales on the back of the head * –No. of scales between first ventral and anterior chin shields * *No. of scales between the edge of the mouth and first ventral scale, including last sublabial * *
(B) Scale reduction formula. Scale reductions along the body were recorded as the number of the ventral scale (VS) or subcaudal scale (SC) opposite which they were situated and the dorso-ventral position (DV) of the merging scale rows. These were transformed to percentage ventral scale (%VS) or subcaudal scale (%SC) position prior to analysis, to compensate for variation in ventral and subcaudal scale number.
Character Males Females
%VS position of reduction from 31 to 29 body scale rows – –%DV position of reduction from 31 to 29 body scale rows – –

360 K. L. SANDERS ET AL.
© 2006 The Linnean Society of London, Biological Journal of the Linnean Society, 2006, 87, 343–364
%VS position of reduction from 29 to 27 body scale rows – –%DV position of reduction from 29 to 27 body scale rows – –%VS position of reduction from 27 to 25 body scale rows – –%DV position of reduction from 27 to 25 body scale rows – –%VS position of reduction from 25 to 23 body scale rows – –%DV position of reduction from 25 to 23 body scale rows – –%VS position of reduction from 23 to 21 body scale rows * –%DV position of reduction from 23 to 21 body scale rows * –%VS position of reduction from 21 to 19 body scale rows * *%DV position of reduction from 21 to 19 body scale rows – –%VS position of reduction from 19 to 17 body scale rows * *%DV position of reduction from 19 to 17 body scale rows * –%VS position of reduction from 17 to 15 body scale rows * *%DV position of reduction from 17 to 15 body scale rows – –%SC position of reduction from 12 to 10 tail scale rows – *%DV position of reduction from 12 to 10 tail scale rows – –%SC position of reduction from 10 to 8 tail scale rows – *%DV position of reduction from 10 to 8 tail scale rows – –%SC position of reduction from 8 to 6 tail scale rows * *%DV position of reduction from 8 to 6 tail scale rows – –%SC position of reduction from 6 to 4 tail scale rows – –%DV position of reduction from 6 to 4 tail scale rows – –
(C) Colour pattern
Character Males Females
Presence of stripe on dorsal scale row one (recorded as 0 = absent; 1 = indistinct; 2 = distinct) * *No. of scale rows involved in stripe * *Presence of postocular stripe (recorded as 0 = absent; 1 = indistinct; 2 = distinct) * *No. of scale rows involved in postocular stripe * *No. of scales above lip covered by ventral colour * *Presence of dark edges body scales (recorded as 0 = none; 1 = narrow; 2 = broad) – –No. of spots on the dorsal surface * *Mean no. of scales covered by the three largest dorsal spots * *Proportion of the first scale row covered by the light area * *No. of bands on body * –Mean width (in no. of scales) of three half bands at 50% VS length * –Mean width (in no. of scales) of three intrahalfband gaps at 50% VS length * –% of ventral scales with darker pigmentation – –
(D) Body dimensions. These were measured on the right side of the head unless damaged, in which case measurements made on the left side.
Character Males Females
Snout to vent length, between tip of snout and cloaca – –Tail length, measured between first subcaudal and tip of tail – –Width of head between the outer edges of the supraoculars * –Width of head at the widest point between the jaw bones – –
Character Males Females
APPENDIX 1: Continued
SPECIES BOUNDARIES IN A CRYPTIC PITVIPER 361
© 2006 The Linnean Society of London, Biological Journal of the Linnean Society, 2006, 87, 343–364
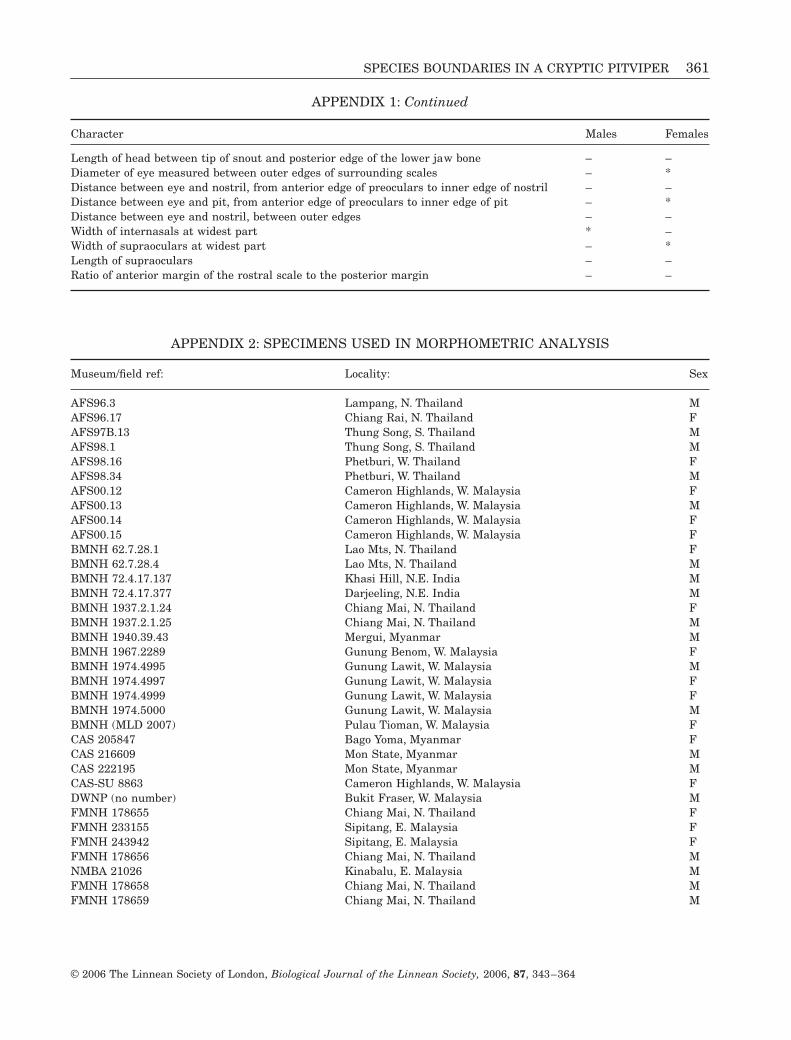
APPENDIX 2: SPECIMENS USED IN MORPHOMETRIC ANALYSIS
Length of head between tip of snout and posterior edge of the lower jaw bone – –Diameter of eye measured between outer edges of surrounding scales – *Distance between eye and nostril, from anterior edge of preoculars to inner edge of nostril – –Distance between eye and pit, from anterior edge of preoculars to inner edge of pit – *Distance between eye and nostril, between outer edges – –Width of internasals at widest part * –Width of supraoculars at widest part – *Length of supraoculars – –Ratio of anterior margin of the rostral scale to the posterior margin – –
Museum/field ref: Locality: Sex
AFS96.3 Lampang, N. Thailand MAFS96.17 Chiang Rai, N. Thailand FAFS97B.13 Thung Song, S. Thailand MAFS98.1 Thung Song, S. Thailand MAFS98.16 Phetburi, W. Thailand FAFS98.34 Phetburi, W. Thailand MAFS00.12 Cameron Highlands, W. Malaysia FAFS00.13 Cameron Highlands, W. Malaysia MAFS00.14 Cameron Highlands, W. Malaysia FAFS00.15 Cameron Highlands, W. Malaysia FBMNH 62.7.28.1 Lao Mts, N. Thailand FBMNH 62.7.28.4 Lao Mts, N. Thailand MBMNH 72.4.17.137 Khasi Hill, N.E. India MBMNH 72.4.17.377 Darjeeling, N.E. India MBMNH 1937.2.1.24 Chiang Mai, N. Thailand FBMNH 1937.2.1.25 Chiang Mai, N. Thailand MBMNH 1940.39.43 Mergui, Myanmar MBMNH 1967.2289 Gunung Benom, W. Malaysia FBMNH 1974.4995 Gunung Lawit, W. Malaysia MBMNH 1974.4997 Gunung Lawit, W. Malaysia FBMNH 1974.4999 Gunung Lawit, W. Malaysia FBMNH 1974.5000 Gunung Lawit, W. Malaysia MBMNH (MLD 2007) Pulau Tioman, W. Malaysia FCAS 205847 Bago Yoma, Myanmar FCAS 216609 Mon State, Myanmar MCAS 222195 Mon State, Myanmar MCAS-SU 8863 Cameron Highlands, W. Malaysia FDWNP (no number) Bukit Fraser, W. Malaysia MFMNH 178655 Chiang Mai, N. Thailand FFMNH 233155 Sipitang, E. Malaysia FFMNH 243942 Sipitang, E. Malaysia FFMNH 178656 Chiang Mai, N. Thailand MNMBA 21026 Kinabalu, E. Malaysia MFMNH 178658 Chiang Mai, N. Thailand MFMNH 178659 Chiang Mai, N. Thailand M
Character Males Females
APPENDIX 1: Continued

362 K. L. SANDERS ET AL.
© 2006 The Linnean Society of London, Biological Journal of the Linnean Society, 2006, 87, 343–364
FMNH 258950 Phongsaly, Laos FFMNH 258949 Vientiane, Laos FKLS00.001 Bukit Fraser, W. Malaysia FKLS01.103 Pulau Penang, W. Malaysia MKLS01.104 Kinabalu, E. Malaysia FKLS01.114 Kinabalu, E. Malaysia MKLS01.116 Kinabalu, E. Malaysia FKLS01.117 Kinabalu, E. Malaysia MKLS01.122 Kinabalu, E. Malaysia FKLS01.121 Kinabalu, E. Malaysia FLSUHC 4809 Pulau Tioman, W. Malaysia MMCZ 43612 Kinabalu, E. Malaysia MMCZ 43614 Kinabalu, E. Malaysia FNMBE 210b/197 Batak Mts, N. Sumatra MNMBE 210a/198 Batak Mts, N. Sumatra MNMW 23910 : 1 Pulau Pagai, Mentawai Islands FNMW 23910 : 2 Padang, W. Sumatra MNMW 23910 : 3 Padang, W. Sumatra FNMW 23910 : 4 Padang, W. Sumatra MNMW 23910 : 5 Padang, W. Sumatra FNMW 23917 : 1 Padang, W. Sumatra MNMW 23917 : 2 Padang, W. Sumatra MNMW 23917 : 3 Padang, W. Sumatra FNMW 23917 : 4 Padang, W. Sumatra MNMW 23917 : 5 Padang, W. Sumatra MNMW 23917 : 6 Padang, W. Sumatra MNMW 23917 : 7 Padang, W. Sumatra FNMW 23917 : 8 Padang, W. Sumatra FNMW 23917 : 9 Padang, W. Sumatra MNMW 23917 : 10 Padang, W. Sumatra FNMW 23923 : 1 Karen Mts, Myanmar MNMW 23923 : 2 Karen Mts, Myanmar MNMW 27947 : 1 Chiang Mai, N. Thailand MQSMI (no number) Krabi, S. Thailand FQSMI (no number) Krabi, S. Thailand MQSMI 13.1 Krabi, S. Thailand MQSMI13.2 Krabi, S. Thailand MQSMI 17 Krabi, S. Thailand MQSMI 7 Krabi, S. Thailand MQSMI 50.1 Krabi, S. Thailand FQSMI 50.2 Krabi, S. Thailand FQSMI 50.3 Krabi, S. Thailand FPCGV 34 Thung Song, S. Thailand MPCGV 223 Thung Song, S. Thailand MRMNH 16715 Uthai Thani, W. Thailand FSMF 21226 West Sumatra MZRC 2.2884 Cameron Highlands, W. Malaysia FZRC 2.2886 Cameron Highlands, W. Malaysia FZRC 2.2889 Bukit Fraser, W. Malaysia MZRC 2.2891 Bukit Fraser, W. Malaysia MZRC 2.2892 Bukit Fraser, W. Malaysia F
Museum/field ref: Locality: Sex
APPENDIX 2: Continued

SPECIES BOUNDARIES IN A CRYPTIC PITVIPER 363
© 2006 The Linnean Society of London, Biological Journal of the Linnean Society, 2006, 87, 343–364
APPENDIX 3: GENBANK ACCESSION NUMBERS FOR SEQUENCES USED IN THIS STUDY
ZRC 2.3493 Pulau Tioman, W. Malaysia MZRC 2.5164 Cameron Highlands, W. Malaysia FZRC 2.5361 Belum, W. Malaysia M
Museum acronymsBMNH The Natural History Museum, LondonCAS California Academy of Sciences, San FranciscoDWNP Department of Wildlife and National Parks, MalaysiaFMNH Field Museum of Natural History, ChicagoLSUHC La Sierra University Herpetology Collection, CaliforniaMCZ Museum of Comparative Zoology, HarvardNMBE Naturhistorisches Museum Basel, SwitzerlandNMW Naturhistorisches Museum Wien, AustriaQSMI Queen Savoabha Memorial Institute, ThailandPCGV Personal collection of Gernot VogelRMNH Rijksmuseum van Natuurlijke Histoire, The NetherlandsSMF Naturmuseum und Forschungsinstitut Senckenberg, GermanyZRC Raffles Museum of Biodiversity Research, National University of SingaporeAFS/KLS indicates wild caught specimens examined under anaesthesis.
Locality Catalogue No.
GenBank Accession Codes
Cyt b ND4 12S 16S
Myanmar B417 (CAS 216609) AY371805 AY371845 AY371743 AY371776B419 (CAS 222195) AY371806 AY371841 AY371738 AY371777B520 (CAS 205847) AY371816 AY371855 AY371751 AY371783
North Thailand B476 AY371809 AY371852 AY371745 AY371782A204 AF171902 AY371843 AY371742 AY371784A205 aF171906 AY371854 AY371741 AY371767
Laos B195 AY371799 – – –B196 AY059571 AY059590 AY059538 AY059554
West Thailand B34 AY059572 AY059591 AY059542 AY059558B52 AY371800 AY371836 AY371754 AY371768
South Thailand (Phang Nga) B467 AY371807 AY371851 AY371744 AY371781
South Thailand (Thung Song) A202 AF171904 AY371840 AY371739 AY371770A203 AY371796 AY059588 AY059537 AY059553A246 AY371820 AY371856 AY371749 –B19 AY371804 AY371844 – AY371779
Cameron Highlands (Malaysia) A196 AF171888 – – –A197 AY371808 AY371846 AY371746 AY371773B235 AY371812 AY371838 AY371740 –B236 AY371819 AY371847 AY371747 –B237 AY371813 AY371848 AY371748 –B238 AY371814 AY371839 AY371737 AY371774B345 AY371811 AY371849 – AY371775B346 AY371810 AY371850 – –
Bukit Fraser (Malaysia) B246 AY059570 AY059589 AY059540 AY059556B278 AY371821 AY371857 AY371750 AY371780B469 AY371817 – – –
Museum/field ref: Locality: Sex
APPENDIX 2: Continued
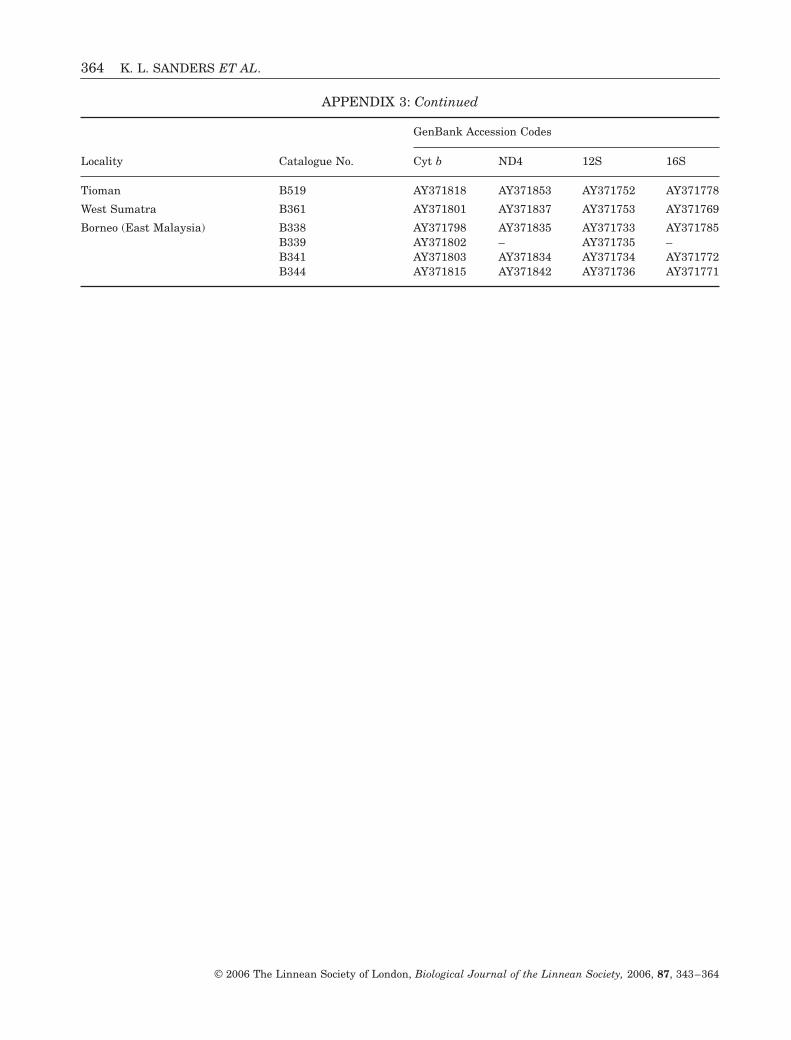
364 K. L. SANDERS ET AL.
© 2006 The Linnean Society of London, Biological Journal of the Linnean Society, 2006, 87, 343–364
Tioman B519 AY371818 AY371853 AY371752 AY371778
West Sumatra B361 AY371801 AY371837 AY371753 AY371769
Borneo (East Malaysia) B338 AY371798 AY371835 AY371733 AY371785B339 AY371802 – AY371735 –B341 AY371803 AY371834 AY371734 AY371772B344 AY371815 AY371842 AY371736 AY371771
Locality Catalogue No.
GenBank Accession Codes
Cyt b ND4 12S 16S
APPENDIX 3: Continued