Combining existing independent seismic reinforcing...
133
Edwin Meulman 15-4-2016 TU Delft & Quake-Shield Combining existing independent seismic reinforcing methods for clay brick masonry Knowledge development of the behaviour of reinforced masonry by using Finite Element Modelling
Transcript of Combining existing independent seismic reinforcing...

Edwin Meulman 15-4-2016
TU Delft & Quake-Shield
Combining existing independent seismic reinforcing methods for clay brick masonry Knowledge development of the behaviour of reinforced masonry by using Finite Element Modelling


Combining existing independent
seismic reinforcing methods for clay
brick masonry
Master thesis
By
Edwin Meulman
Delft University of Technology
Faculty of Mechanical Engineering
Master track: Materials Engineering and Applications
Quake-Shield
April 15, 2016
Graduation committee
Prof. dr. ir. J.G. Rots, Delft University of Technology - Section of Structural Mechanics
Dr. Ir. P.C.J. Hoogenboom, Delft University of Technology - Section of Structural Mechanics
Dr.ir. A. Van Beek, Delft University of Technology - Section of Materials and Environment
Ir. Drs. Ö. Türkmen, Royal Oosterhof Holman – Department of infra
Dr.ir. M. Hermans, Delft University of Technology - Section of Metals Processing, Microstructure and
Properties


Abstract In the last decades induced earthquakes are taking place more frequently in Groningen. This is due to
gas extraction form the soil. Buildings are damaged by the earthquakes and building collapse is
possible in the near future. Houses in Groningen are commonly build up out of single leaf masonry
cavity walls and are not designed for earthquake loads. Oosterhof Holman and SealteQ Group have
designed a masonry reinforcing method that is called Quake-Shield. Quake-Shield is an unique
reinforcing method and consists out of a combination of two existing independent seismic
reinforcing measures.
These two existing independent seismic reinforcing measures are: NSM FRP strips and an EB FRP
layer. Carbon strips are placed in vertical grooves in the masonry which are filled with a ductile
adhesive to bond the strips to the masonry (NSM FRP strips).
A polymer or cementitious base layer with an embedded polymer or carbon mesh is attached to one
side of the masonry on the outer surface (EB FRP layer).
Both reinforcing measures increase stiffness, strength and ductility of the masonry. These three
factors result in an increase in earthquake energy absorption and dissipation of the masonry. Which
is important when reinforcing houses and buildings to prevent collapse due to earthquake loads.
In this project a FEM model is made based on a three point bend test (out-of-plane bending)
performed on Quake-Shield reinforced masonry samples. The FEM model is used to develop
knowledge about the effect of combining two existing independent seismic reinforcing measures as
used in the Quake-Shield masonry reinforcing method.
The FEM model is a 3D model with a simplified micro-model approach for the masonry. The bricks
are solid elements, the reinforcing materials are shell elements and the mortar and the ductile
adhesive are interface elements.
The bond-slip behaviour of the ductile adhesive has a significant contribution in the behaviour of
Quake-Shield reinforced masonry. The mechanical properties of the ductile adhesive determines
mainly the pre and post peak behaviour of the reinforced masonry. Providing gradually decline in
load bearing capacity after the peak load. The EB FRP layer has a significant contribution to the
reinforced masonry in the displacement range from the initiation of the first crack in the masonry till
the onset of yielding of the EB FRP layer. In this range the EB FRP layer is the dominant reinforcing
measure. After yielding of the EB FRP layer the NSM CFRP strip becomes the most dominant of the
two. The EB FRP layer also provides cohesion between the individual bricks, keeping the masonry
wall together after severe cracking has taken place.
The FEM model is also used for a configuration analysis to research different geometrical and
material variations of the Quake-Shield masonry reinforcing method. The configuration analysis gives
more insight in the behaviour of reinforced masonry.
For the configuration analysis two independent seismic reinforcing measures, NSM FRP strips and EB
FRP layer, are applied separately to the FEM model. This is done to investigate its individual effect on
the behaviour of reinforced masonry. Strip spacing has a significant effect on the load bearing
capacity. If an epoxy is used as adhesive, which is much stronger and stiffer than the adhesive used
by Quake-Shield, an increase in load bearing capacity is achieved but also sudden failure after the
peak load is observed. This is an undesirable failure mode and reduces the total energy that the
reinforced masonry can absorb.
Results of the different configurations used for the EB layer show that the polymer (PU) base layer
has the most significant contribution of the used EB FRP layer materials when considering overall
ductility and energy absorption of the reinforced masonry.


Summary
Gas extraction from the soil causes induced earthquakes in the east part of Groningen. Houses and
buildings in the Groningen region are not constructed to resist earthquake loads. The most
vulnerable houses need to be reinforced to prevent collapse. The houses in Groningen are commonly
built up out of single leaf masonry cavity walls. Royal Oosterhof Holman and SealteQ Group have
designed a masonry reinforcing method that is called Quake-Shield. Quake-Shield is a unique
reinforcing method and is a combination of two existing independent seismic reinforcing measures.
Test results from small scale masonry samples (870x550 mm2), out-of-plane (OP) loaded, and full size
masonry wall samples (4000x2700 mm2), in-plane (IP) loaded, reinforced with Quake-Shield show
promising results.
This project focuses on the small scale OP loaded masonry samples. The samples are OP loaded with
a three point bend test. A FEM model is made based on this test and used to get better insight in the
combination of two existing independent seismic reinforcing measures used with the Quake-Shield
method. A configuration analysis is done to see the effect on Quake-Shield reinforced masonry when
different geometrical and material variations are applied.
OP loaded single leaf masonry is most critical when considering collapse of a house or building. The
relatively thin wall can easily bend or buckle due to the OP load which results in a sudden loss of load
bearing capacity. The failure mode of masonry depends on the aspect ratio, vertical load from roof or
floor and how the wall is supported.
The basic principle of making single leaf unreinforced masonry (URM) earthquake resistant is to
increase the amount of earthquake energy the masonry can absorb and dissipate. This can be done
by increasing stiffness, strength and ductility of the masonry. Due to dynamic effects it is important
to keep the mass of the reinforced masonry as low as possible.
Commonly applied reinforcing materials are fibre reinforced plastics (FRP) like Carbon (CFRP) or Glass
(GFRP). These materials are applied in two commonly used methods: near surface mount (NSM) FRP
strips and an external bound (EB) FRP layer. These two existing seismic reinforcing measures are
combined in Quake-Shield. The EB FRP layer consists out of a polymer or cementitious base layer
with an embedded polymer or carbon mesh. The NSM FRP strips are CFRP strips embedded in a
groove in the masonry which is filled with ductile adhesive to bond the CFRP strip to the masonry.
In general, masonry has a large variation in mechanical properties due to its sensitivity to
environmental conditions during manufacturing of the bricks and the construction of masonry itself.
Material tests like compression tests are required to have good reference material properties for the
development of the FEM model. In the case of modelling reinforced masonry also bond-slip
behaviour of the NSM FRP strip in the adhesive is critical to achieve a good correlation between test
results and FEM model results. Pull-out tests can provide such information. Material tests and pull-
out tests are performed by the TU/e to get this information for Quake-Shield.
Different earthquake analysis methods can be used to determine if a house or building can resist a
certain earthquake induced load. Lateral force analysis is the least complex method and non-linear

time-history analysis the most complex method. Latter one is used with FEM software. FEM software
(DIANA 9.6) is also used for this project to model the reinforced masonry. Based on the literature
study a 3D FEM model with a simplified micro-model approach is used. The mortar interfaces have a
non-linear material model. Initially the combined cracking-shearing-crushing (CCSC) material model
was selected. The NSM FRP strip is modelled with embedded reinforcing elements in combination
with bond-slip behaviour. The combination of the CCSC (interface) material model and the
embedded reinforcement elements with bond-slip behaviour could not be combined. Also the CCSC
is assumed to be too complex for OP load situation and corresponding masonry failure modes.
Therefore mortar interfaces are changed to a non-linear discrete cracking material model and the
NSM CFRP is modelled discreetly in the FEM model based on the Quake-Shield OP bend test. The
shell elements used for the NSM CFRP strip are connected to the solid (brick) elements by interface
elements that provide bond-slip behaviour.
A FEM model is made, based on the pull-out tests of the TU/e, to calibrate the bond-slip behaviour of
the NSM CFRP strip in the Quake-Shield FEM model.
The significance of the ductility of the adhesive becomes more clear in a sensitivity study that was
done during development of the Quake-Shield FEM model. This was done to develop knowledge
about the effect of certain parameters on the behaviour of the model.
During two calibration steps the FEM model result was adjusted slightly to get a better correlation
with the test result. The stiffness of the model is slightly overestimated by the EB FRP layer. The
polyurea (PU) base layer and polypropylene (PP) mesh are homogenised into a single layer. The
assumptions made for homogenising the layer result in a stiffness overestimation. The mechanical
behaviour of a soft polymer is simplified by the material model used in the FEM model. Material
properties involving this EB FRP layer are adjusted to reduce the overestimation of stiffness and
onset of yielding of the EB FRP layer. Also the onset of compression failure in the bricks initiate at a
too high displacement compared to the test results. Material properties of the bricks are adjusted
slightly so onset of compression failure correlates better with the test results.
After calibration, the model shows a good fit with the test result but has still some deviations. The EB
FRP layer is dominant from the initiation of the first crack in the masonry till the onset of yielding of
the EB FRP layer. From this point the NSM CFRP strip becomes dominant for the behaviour of the
reinforced masonry. Showing a distinct peak which is also the displacement at which the adhesive
reaches its ultimate shear strength. In the test result the peak is less distinctive and could be
considered as a wide plateau before a gradual decline in load bearing capacity sets in. The plateau
could be caused by more severe compression failure compared to the FEM model which shows only
compression failure in the bricks closest to the middle row of bricks. In the test sample the
compression failure is more spread over the three middle rows of bricks. Also imperfection like
premature debonding of the EB FRP layer or imperfection in the test setup could influence the
mechanical properties of the reinforced masonry or displacement measurement, resulting in
different peak load behaviour compared to the model.
The calibrated FEM model is used as a base model for the configuration analysis. In the configuration
analysis multiple geometrical and material variations, based on Quake-Shield, are modelled to get
better insight in the effect of the two combined existing reinforcing methods on the behaviour of
reinforced masonry.

The first model variation is applying one of the two individual FRP reinforcement measures on the
masonry in the model. The FEM results from these variations show the behaviour of the separate FRP
reinforcement measures and show comparable behaviour to test results from a different test series
(AG-series).
Changing the spacing between the NSM FRP strips has a significant effect on the load bearing
capacity. Strip spacing could be expressed as number of strips per meter masonry. The base model
has four strips per meter. Also one and two strips per meter masonry are modelled. Future model
development and Quake-Shield method optimization could be done to find the minimum number of
strips per meter masonry for a certain load condition. Optimization can also be done for the strip
dimensions. The increased bonding area between adhesive, strip and masonry results in more
ductility due to the ductile material properties of the adhesive used by Quake-Shield. The NSM CFRP
strip width has also influence on the bending resistance due to the effect of increased area moment
of inertia of the strip.
Using a stiff epoxy as adhesive to bond the NSM FRP strip to the masonry increases the stiffness and
load bearing capacity of the reinforced masonry significantly. However a sudden loss of load bearing
capacity after peak load takes place when using epoxy compared to the ductile adhesive used in
Quake-Shield. Ductility after the peak load is an important factor for reinforced masonry which
increases energy adsorption by the reinforced masonry. Comparing the energy absorption between
these two variations, the ductile adhesive of Quake-Shield takes up more energy although the load
bearing capacity is significantly lower.
For the EB FRP layer different combinations are compared involving a polymer and carbon mesh
(PP-mesh and C-mesh) embedded in a polymer (PU) or cementitious base layer (AC). AC increases
initial stiffness till the AC layer cracks. From this point on the AC losses its contribution to the
behaviour of the reinforced masonry and functions only as bonding material for the mesh. A polymer
has a contribution over a larger displacement range due to its elastic-plastic properties. From onset
of yielding of the EB FRP layer its contribution to the behaviour of the reinforced masonry is reduced.
C-mesh is stiffer than PP-mesh and therefore increases stiffness and reduces crack opening. This
delay of crack opening and taking op load by the C-mesh reduces stress on the NSM CFRP strip and
adhesive resulting in a higher load bearing capacity. Increasing stiffness and strength to the EB FRP
layer at the bottom side of the masonry sample can result in an increased compression zone at the
top side of the masonry sample. Masonry is in general already the weakest material in reinforced
masonry and so shifting more stress to this material should be avoided.
Based on the results of the FEM models the following can be concluded about the reinforcing
method of Quake-Shield. Both independent seismic reinforcing measure show improved stiffness,
strength and ductility if applied separately. If both combined the EB FRP layer first is dominant,
reducing the stress on the NSM FRP strip, and determines mainly the behaviour of the reinforced
masonry. After the onset of yielding of the EB FRP layer the NSM FRP strip becomes dominant,
determining the load bearing capacity and post peak behaviour of the reinforced masonry.
The bond-slip behaviour of the ductile adhesive to bond the NSM CFRP to the masonry determines
mainly the pre and post peak behaviour of the reinforced masonry with a gradually decline in load
bearing capacity after the peak load. The ultimate shear strength of the adhesive determines mainly

the peak load of the reinforced masonry. The EB FRP layer bonds the individual bricks and provides
stiffness to the reinforced masonry from the first crack initiation till yielding of the EB FRP layer.
The FEM model and Quake-Shield masonry reinforcing method can be developed further and
optimized in the future. Some recommendations for future research are the following.
Research into the adhesion and debonding of the NSM FRP strip adhesive and the EB FRP layer to the
masonry. Improper adhesion or debonding could reduce the mechanical properties of the reinforced
masonry significantly.
Use separate layers for the EB FRP layer in the FEM model. Using embedded grid reinforcement
elements for mesh type materials appears to work properly.
Improve masonry behaviour of the model by improving non-linear behaviour of the masonry when
compression loaded and implement more extensive shear effects in the mortar interfaces.
Perform the OP test in vertical position with an applied normal force to the reinforced masonry
sample to get more realistic loading conditions. Also URM could be tested properly in this position
which can then be used to compare results with Quake-Shield reinforced masonry.

Acknowledgments
This thesis is written to complete my graduation project to obtain a Master’s degree in Mechanical
Engineering at the Delft University of Technology. Research is done on the behaviour of masonry that
is reinforced with the Quake-Shield reinforcing method developed by Royal Oosterhof Holman and
SealteQ Group. FEM modelling is used as a tool to get better insight and develop more knowledge
about the Quake-Shield reinforced masonry when subjected to out-of-plane loading conditions.
During this graduation project guidance was provide by Delft University of Technology, TNO DIANA
and Royal Oosterhof Holman. The graduation project was carried out between March 2015 and April
2016.
I would like to thank my graduation committee: Jan, Pierre, Ton, Marcel and Ömer, for guiding me
during the process of this graduation project and a special thanks to Ab and Shen of TNO DIANA who
offered their time to support me concerning DIANA related problems and development of my FEM
model.
Furthermore I would like to thank my family, friends and colleagues from Royal Oosterhof Holman
for their support.

Acronyms
AC - Armo-crete
AFRP - Aramid fibre reinforced plastic
C-mesh - Carbon mesh
CCSC - Combined cracking-shearing-crushing
CFRP - Carbon fibre reinforced plastic
DIANA - Displacement ANAlyzer
EB - External bond
FEM - Finite element method
FRP - Fibre reinforced plastic
GFRP -Glass fibre reinforced plastic
IP - In-plane
KNMI - Koninklijk Nederlands Meteorologisch Instituut
NSM - Near surface mounted
OP - Out-of-plane
PGA - Peak Ground Acceleration
PP - Polypropylene
PP-mesh - Polypropylene mesh
PU - Polyurea
TU/e - Technische universiteit Eindhoven
URM - Unreinforced masonry
VE - Vijf Eiken

List of Symbols
g Gravitational acceleration m/s2
Kn Normal stiffness modulus N/mm3
Kt Shear stiffness modulus N/mm3
ft Tensile strength MPa
fc Compression strength MPa
f Force N
C Cohesion MPa
Gf I Fracture energy mode-I N/mm
Gf II Fracture energy mode-II N/mm
Gfc Compressive fracture energy N/mm
Cs Shear traction contribution [-]
Kp Peak Equiv. plastic relative displacement mm
Gc Compressive fracture energy of brick N/mm
fc Compressive strength of brick MPa
E E-modulus MPa
Eunit E-modulus of brick MPa
Ejoint E-modulus of mortar MPa
Gunit Shear modulus of brick MPa
Gjoint Shear modulus of mortar MPa
hjoint Height of mortar joint mm
νunit Poisson ratio of brick [-]
Eeq Equivalent E-modulus MPa
Epu E-modulus of polyurea MPa
Epp E-modulus of polypropylene MPa
Apu Cross sectional area of polyurea mm2
App Cross sectional area of polypropylene mm2
Atot Cross sectional area of total PU+PP-mesh layer mm2
Einp Input energy J
Ediss Dissipated energy J
Π Induced potential energy J
ζhyst Hysteretic damping [-]
m Mass kg
a Acceleration m/s2
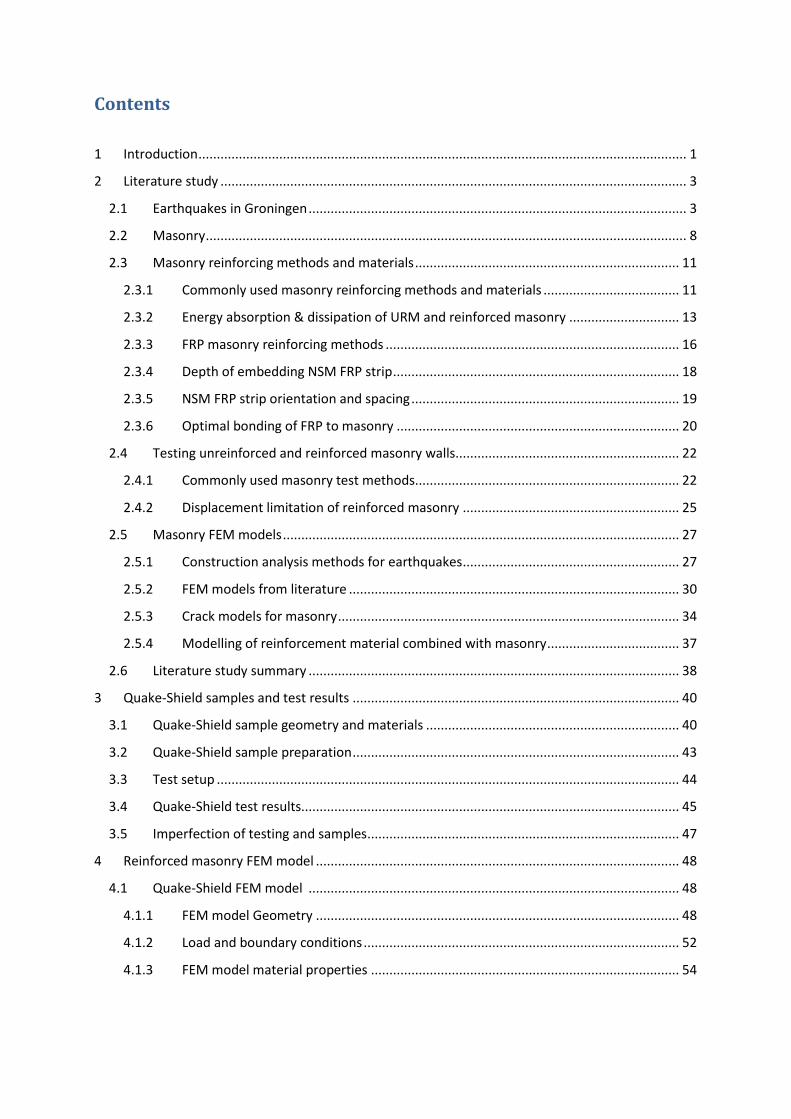
Contents
1 Introduction ..................................................................................................................................... 1
2 Literature study ............................................................................................................................... 3
2.1 Earthquakes in Groningen ....................................................................................................... 3
2.2 Masonry ................................................................................................................................... 8
2.3 Masonry reinforcing methods and materials ........................................................................ 11
2.3.1 Commonly used masonry reinforcing methods and materials ..................................... 11
2.3.2 Energy absorption & dissipation of URM and reinforced masonry .............................. 13
2.3.3 FRP masonry reinforcing methods ................................................................................ 16
2.3.4 Depth of embedding NSM FRP strip .............................................................................. 18
2.3.5 NSM FRP strip orientation and spacing ......................................................................... 19
2.3.6 Optimal bonding of FRP to masonry ............................................................................. 20
2.4 Testing unreinforced and reinforced masonry walls............................................................. 22
2.4.1 Commonly used masonry test methods........................................................................ 22
2.4.2 Displacement limitation of reinforced masonry ........................................................... 25
2.5 Masonry FEM models ............................................................................................................ 27
2.5.1 Construction analysis methods for earthquakes ........................................................... 27
2.5.2 FEM models from literature .......................................................................................... 30
2.5.3 Crack models for masonry ............................................................................................. 34
2.5.4 Modelling of reinforcement material combined with masonry .................................... 37
2.6 Literature study summary ..................................................................................................... 38
3 Quake-Shield samples and test results ......................................................................................... 40
3.1 Quake-Shield sample geometry and materials ..................................................................... 40
3.2 Quake-Shield sample preparation ......................................................................................... 43
3.3 Test setup .............................................................................................................................. 44
3.4 Quake-Shield test results....................................................................................................... 45
3.5 Imperfection of testing and samples ..................................................................................... 47
4 Reinforced masonry FEM model ................................................................................................... 48
4.1 Quake-Shield FEM model ..................................................................................................... 48
4.1.1 FEM model Geometry ................................................................................................... 48
4.1.2 Load and boundary conditions ...................................................................................... 52
4.1.3 FEM model material properties .................................................................................... 54

4.2 Pull-out of NSM CFRP strip .................................................................................................... 59
4.2.1 Pull-out test results ....................................................................................................... 59
4.2.2 Pull-out FEM model ....................................................................................................... 61
4.3 FEM model sensitivity study .................................................................................................. 63
5 FEM model calibration & results ................................................................................................... 68
5.1 FEM model calibration .......................................................................................................... 68
5.2 FEM Base model results ........................................................................................................ 73
5.3 Discussion of FEM Base model results .................................................................................. 77
6 Quake-Shield configuration analysis ............................................................................................. 78
6.1 URM, without NSM CFRP strip, without EB FRP layer ........................................................... 78
6.2 Geometrical variations .......................................................................................................... 81
6.2.1 Spacing of NSM CFRP strips ........................................................................................... 81
6.2.2 Dimensions of the CFRP strips ....................................................................................... 83
6.3 Material variations ................................................................................................................ 85
6.3.1 Different types of NSM FRP reinforcing materials ........................................................ 85
6.3.2 Different types of adhesive ........................................................................................... 87
6.3.3 Different types of EB layer ............................................................................................. 92
6.4 Discussion of configuration analysis results .......................................................................... 97
7 Conclusions & Recommendations ................................................................................................. 99
Bibliography ......................................................................................................................................... 102
Appendix A .......................................................................................................................................... 105
Appendix B .......................................................................................................................................... 113


1
1 Introduction
In the last few years research on earthquakes in the Netherlands is increased. Gas extraction from
the soil in Groningen induces earthquakes that damage buildings and potentially could result in
building collapse. Buildings in the Netherlands are not designed to withstand earthquake loads and
are commonly build out of single leaf masonry cavity walls. To prevent these buildings from
collapsing, reinforcing methods have to be applied to strengthen the masonry walls.
Quake-Shield, a method designed by Royal Oosterhof Holman and SealteQ Group, is a reinforcing
method to strengthen masonry walls. Oosterhof Holman and SealteQ performed small scale out-of-
plane (OP) and large scale in-plane (IP) tests on Quake-Shield reinforced masonry. The results are
promising and the first building in Usquert (Groningen) is reinforced with the Quake-Shield
reinforcing method [1].
The reinforcing method is unique because it combines two in literature common fibre reinforced
plastic (FRP) reinforcing methods. These two reinforcing methods are near surface mounted (NSM)
FRP strips and external bond (EB) FRP layer. Future development and optimization of the Quake-
Shield reinforcing method is possible if knowledge and insight about the behaviour of reinforced
masonry is increased. Finite element method (FEM) modelling can be very useful to research
reinforced masonry behaviour and investigate the combination of two independent reinforcing
methods like Quake-Shield. Conclusions and recommendations found in this thesis could be used for
optimization and further development of the Quake-Shield reinforcing method.
A configuration analysis is used to investigate different variations of reinforced masonry. During the
development of the FEM base model and the results from the configuration analysis, more insight in
the behaviour of Quake-Shield reinforced masonry is obtained. For the configuration analysis a FEM
base model of the Quake-Shield reinforcing method is required. Test results of Quake-Shield
reinforced masonry is used to validate the FEM base model. Due to the difficulties involved in
validating masonry FEM models and the limited time of the graduation project, only a FEM model
based on the OP tests is made. The FEM model is made with use of DIANA 9.6. The model is 3D and
consists out of solid, interface and shell elements. The OP test is a three point bend test in which the
load is applied monotonic.
Goals
Develop knowledge about the effect of combining two existing independent seismic
reinforcing measures used in the Quake-Shield masonry reinforcing method and how this can
be modelled with FEM software (DIANA 9.6)
o FEM model validation by using experimental tests results of Quake-Shield reinforced
masonry
o Applying the two existing independent seismic reinforcing methods to the model
separately to research its contribution to Quake-Shield
Get more insight in the behaviour of reinforced masonry when different geometrical and
material variations are used for the Quake-Shield masonry reinforcing method
o Comparing model variation results to the validated FEM Base model

2
Main research question
What are the effects of combining two independent seismic reinforcing methods and how does this
change the behaviour of a masonry wall?
Thesis outline
Chapter 1 gives an introduction of the thesis describing the subject, goals and main research
question of the project. Chapter 2 contains the literature study. The literature study provides
information about earthquakes in general and the earthquake problems in Groningen. How
unreinforced and reinforced masonry behave during an earthquake. Reinforcing methods used in
other researches and how unreinforced and reinforced masonry is modelled in FEM.
Chapter 3 describes the Quake-Shield samples, test setup and test results.
The Quake-Shield FEM model is described in Chapter 4.
Chapter 5 contains the calibration and results of the Quake-Shield FEM Base model. The calibrated
FEM Base model is used for the configuration analysis. The configuration analysis is described in
Chapter 6. The configuration analysis contains variations in model geometry and material properties.
Results from these Chapters are used to come to conclusions and recommendations that can be
found in Chapter 7.

3
2 Literature study
This chapter covers the literature study. The literature study is used to gain basic knowledge about:
masonry in seismic active areas, how masonry can be reinforced to withstand earthquake loads and
experimental tests that can be used to test reinforced masonry. Eventually a FEM model is made
based on Quake-Shield reinforced masonry. The literature study is used to find out how unreinforced
and reinforced masonry is modelled with FEM by other researchers. The literature study is based on
the Quake-Shield reinforced masonry method, therefore the information mainly relates to the
techniques used in Quake-Shield. Quake-Shield is applied to single leaf masonry walls made out of
clay brick masonry. If from now on masonry is mentioned only clay brick is considered unless
otherwise stated.
First part of the literature study is about earthquakes in Groningen, masonry in general and
reinforcing methods for masonry. The middle part is about tests performed on masonry found in
literature. The last part is literature on FEM models and how masonry is modelled in FEM.
2.1 Earthquakes in Groningen
Earthquakes in the Groningen region are different compared to most earthquakes worldwide
because the earthquakes are induced by gas extraction from the soil and not by a natural
phenomenon like sliding of fault lines [2]. In Groningen the gas volume in the soil is reduced by
extraction of gas. A large area at the east of Groningen sinks slightly due to this volume change. This
sinking does not happen very smoothly but in increments which release large amounts of energy
which is translated to vibrations in the soil. These vibrations are the earthquakes that took place in
Groningen for the last decades.
The first earthquake in Groningen that was noticed due to gas extraction was in 1986 [2]. Last decade
the earthquakes are not getting significantly larger in magnitude but the frequency is increasing.
There are clear indications that there is a correlation between the amount of gas extraction and the
frequency of the earthquakes. Figure 1 shows the number of earthquake in each year from 1995 till
2013 with a magnitude of 1,5 or higher on Richter scale.
Figure 1: Measured earthquakes above 1,5 on Richter scale in Groningen form 1995 till 2013 [3]

4
Figure 2 shows a map of Groningen where all the earthquakes until 2013 took place in the Groningen
region.
Figure 2: Map of east side of the city of Groningen with earthquake locations (yellow dots). The light green indicates the gas field [4].
The earthquake vibration frequency and magnitude are dependent on the type of soil and depth of
the hypocentre (location in the earth where the earthquake energy is released). The hypocentre is
very shallow at Groningen because the gas is also very sallow located in the soil. The soil is soft clay,
which transmits the vibration better compared to a rocky soil. These two factors in combination with
the fact that the earthquakes are induced by gas extraction make the situation of Groningen unique
and therefore a challenge for the scientists and engineers to come up with solutions to either reduce
the earthquakes or make the buildings earthquake resistant. Research on earthquakes and seismic
resistant building design done in other countries cannot always be used in Groningen because of its
unique situation.
Most houses in the east of Groningen are located in villages. The load bearing walls of these houses
are usually made out of single leaf masonry cavity walls and are only designed to withstand wind
loads. The houses in Groningen are not build according to earthquake design standards and
therefore are not designed to withstand earthquakes of large magnitude (about 5 on Richter scale).
Usually the magnitude of an earthquake is expressed on Richter scale. An earthquake is a vibration in
which not only the amplitude of the vibration but also the frequency plays a significant role. In the
case of Groningen peak ground acceleration (PGA) gives a better indication of the earthquake
intensity and the relating earthquake loads on the buildings. Analytical and numerical models can be
used to calculate what forces are acting on a structure when a certain ground acceleration is induced
by an earthquake. More information about modelling can be found in paragraph 2.5.
Research and measurements done by the KNMI provides a contour plot of peak ground acceleration
(PGA) of the Groningen area [5]. The maximum value in this contour plot is 0,42g with a return
period of 475 year (Figure 3).

5
Figure 3: Contour plot peak ground acceleration (PGA) in [g] with return period of 475 year [5]
Between 1970-1980 a building company called Jarino built a lot of terraced houses in the east of
Groningen [6]. Recent inspection showed the quality of these houses are lower than expected due to
poor construction execution by Jarino. Therefore the ‘Jarino houses’ are vulnerable for earthquakes
and should be reinforced before an earthquake occurs with a larger magnitude until now have taken
place. Arup investigated in 2013 many houses in the east part of Groningen [7]. Most of the houses in
this area are built after 1960. Figure 5 gives an overview of the type of house in Groningen put in
categories by Arup. After 1960 the floors are usually concrete which has a lot more mass compared
to wood.
Based on the PGA contour plot of the KNMI (Figure 3) and the house assessment by Arup it is
possible to determine to what level a house needs to be reinforced. These reinforcing levels are
divided in seven ‘intervention levels’ [7].
Figure 4: Seven intervention levels [7]
For example Level 2 ‘tying of floors and walls’ is done to connect walls and floors to create a stiffer
construction so earthquake loads can be transferred trough the connections. Concrete and masonry
have different coefficient of heat expansion. Due to this difference in heat expansion it could be

6
assumed that the walls and floor are not connected if only mortar is used to connect the walls with
the floor. Lateral loads are in this case only transferred between wall and floor by dry friction.
Quake-Shield reinforcing method is a level 4 reinforcing measure. It is only applied to strengthen
existing masonry walls.
Figure 5: Type of houses in Groningen divided in 6 categories by ARUP [7]
Investigation done by Adviesbureau Hageman suggests the critical houses as described above cannot
withstand more than 0,1g to 0,14g depending on the vertical load on the wall [8]. In this investigation
a non-linear pushover analyses is performed on a single leaf masonry wall OP loaded. Until 2016 no
buildings have collapsed or casualties have taken place suggesting the 0,1g-0,14g values have likely
not been exceeded until now. But the contour plot of the KNMI (Figure 3) indicates values above
0,14g are likely to happen in the future. To prevent building collapse, with likely casualties, it is
necessary to improve the earthquake resistance of the current buildings in that area which do not
comply to the earthquake design building standard stated in the European codes and ‘Nederlandse
Praktijkrichtlijn’ [5].
Arup made a risk assessment based on the combination of the research of the KNMI (contour plot)
with the house inspections done by Arup. Arup gives an example of an earthquake with magnitude of
5 on Richter scale. In this case: “expected that 8,000 to 9,000 buildings will be slightly or moderately
damaged, 1,300 to 3,200 buildings extensively to completely damaged and approximately 370 to
1200 buildings will collapse. It is estimated that 470 to over a 1000 people could be injured with 45

7
to over 100 life threatening injuries or direct fatalities” [7]. It should be noted that these values are
based on the contour plot shown in Figure 3 and at the moment of writing the KNMI and other
institutes are still investigating possible improvements of this contour plot. The PGA values could
become higher or lower. Assuming that this plot is generated with a conservative approach, it is
more likely that improvements of this plot result in lower PGA values instead of higher PGA values.
The possible lower PGA values on the contour plot will also influence the risk assessment in a positive
way.

8
2.2 Masonry
All over the world masonry is used for the construction of buildings [9]. It is one of the oldest
techniques to construct buildings. Studies have proven severe building damage and most casualties
during earthquake take place in seismic areas where masonry is used in buildings [10]. Masonry is
used as construction material because it is relatively easy to manufacture, low cost and due to its
good properties to withstand compressive loads [9]. Load bearing masonry walls are mainly loaded in
vertical direction because of the weight of other floors or roof on top of the walls.
During an earthquake the soil will vibrate in longitudinal, lateral and vertical direction. The
longitudinal and lateral directions will introduce horizontal loads in the masonry walls. This results in
bend, shear and tensile loads in the masonry which is not the preferred way to load masonry. The
mortar-brick interface is usually a weak link when these types of loads are applied. The interface
quality between mortar and brick can be of large influence for the total load capacity of the masonry.
Factors that can influence this interface quality are: type of brick, type of mortar, mortar mix ratio
and environmental conditions like for example moisture and temperature [11].
The bend, shear and tensile loads could result in failure modes that are often seen in masonry during
or after an earthquake [12]. The In-plane (IP) failure modes are: shear diagonal failure, shear sliding
failure, rocking failure and toe crushing (Figure 6).
Figure 6: Masonry failure modes when the wall is loaded in-plane [12]
9
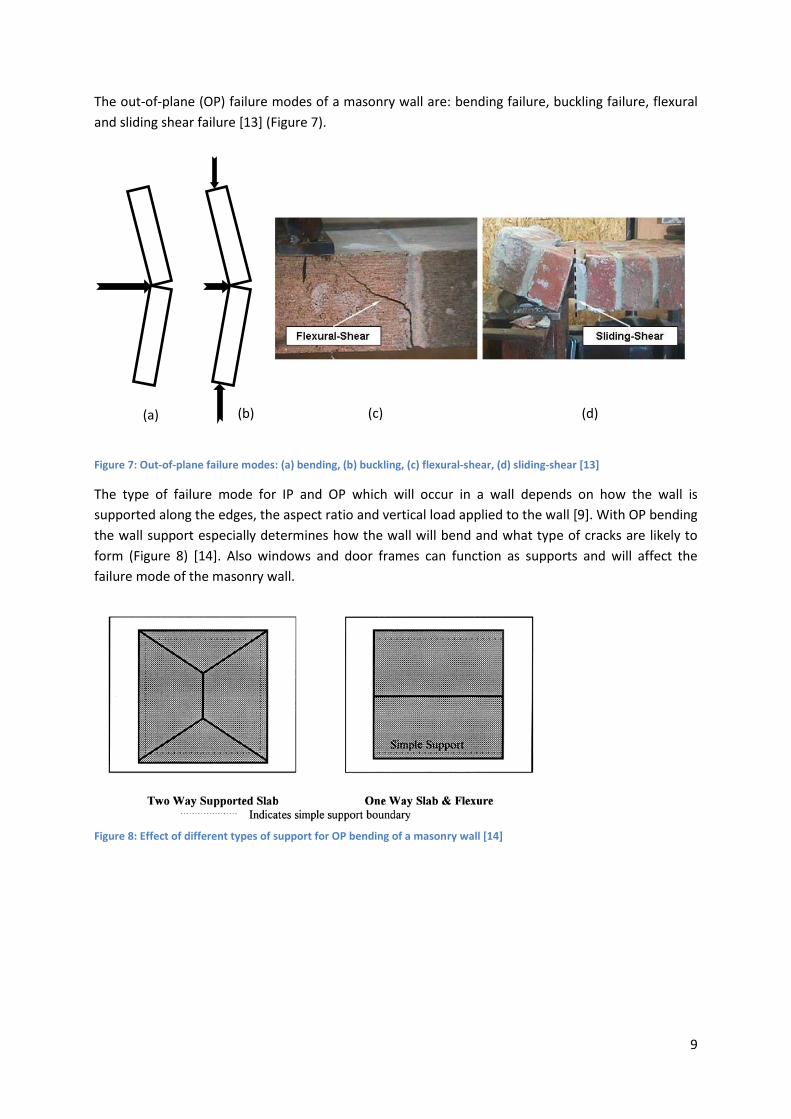
The out-of-plane (OP) failure modes of a masonry wall are: bending failure, buckling failure, flexural
and sliding shear failure [13] (Figure 7).
Figure 7: Out-of-plane failure modes: (a) bending, (b) buckling, (c) flexural-shear, (d) sliding-shear [13]
The type of failure mode for IP and OP which will occur in a wall depends on how the wall is
supported along the edges, the aspect ratio and vertical load applied to the wall [9]. With OP bending
the wall support especially determines how the wall will bend and what type of cracks are likely to
form (Figure 8) [14]. Also windows and door frames can function as supports and will affect the
failure mode of the masonry wall.
Figure 8: Effect of different types of support for OP bending of a masonry wall [14]
(a) (b) (c) (d)
10
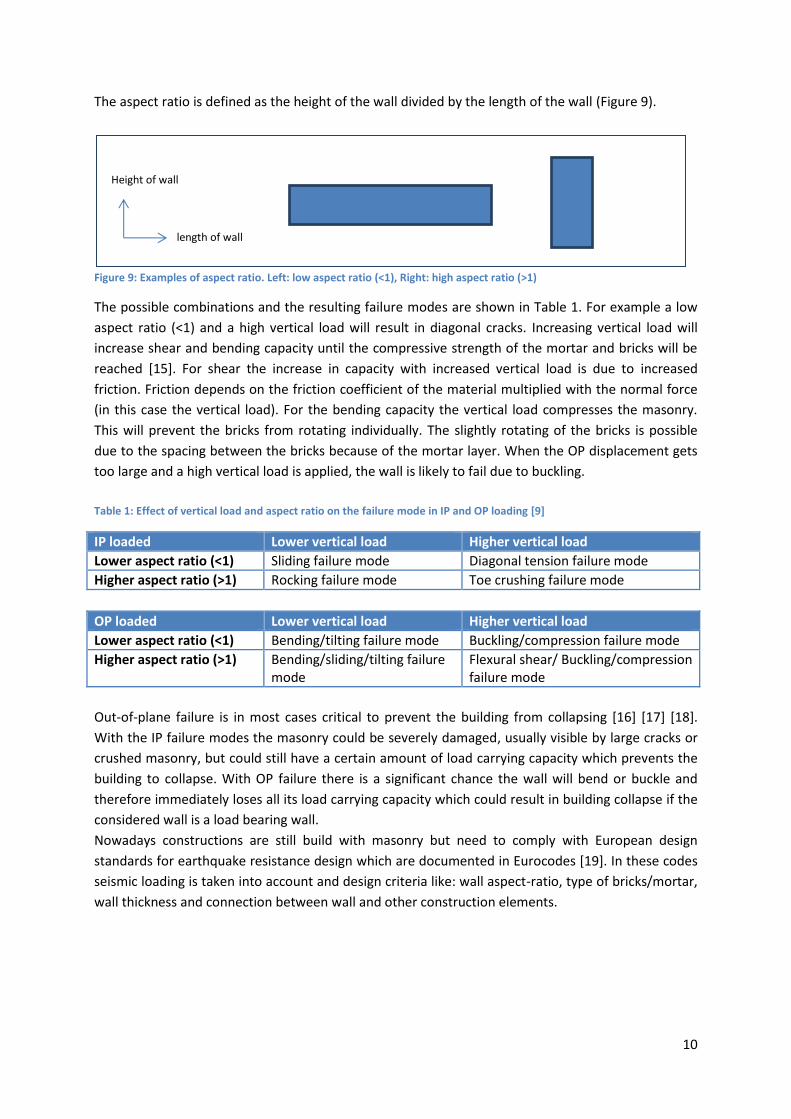
The aspect ratio is defined as the height of the wall divided by the length of the wall (Figure 9).
Figure 9: Examples of aspect ratio. Left: low aspect ratio (<1), Right: high aspect ratio (>1)
The possible combinations and the resulting failure modes are shown in Table 1. For example a low
aspect ratio (<1) and a high vertical load will result in diagonal cracks. Increasing vertical load will
increase shear and bending capacity until the compressive strength of the mortar and bricks will be
reached [15]. For shear the increase in capacity with increased vertical load is due to increased
friction. Friction depends on the friction coefficient of the material multiplied with the normal force
(in this case the vertical load). For the bending capacity the vertical load compresses the masonry.
This will prevent the bricks from rotating individually. The slightly rotating of the bricks is possible
due to the spacing between the bricks because of the mortar layer. When the OP displacement gets
too large and a high vertical load is applied, the wall is likely to fail due to buckling.
Table 1: Effect of vertical load and aspect ratio on the failure mode in IP and OP loading [9]
IP loaded Lower vertical load Higher vertical load
Lower aspect ratio (<1) Sliding failure mode Diagonal tension failure mode
Higher aspect ratio (>1) Rocking failure mode Toe crushing failure mode
OP loaded Lower vertical load Higher vertical load
Lower aspect ratio (<1) Bending/tilting failure mode Buckling/compression failure mode
Higher aspect ratio (>1) Bending/sliding/tilting failure mode
Flexural shear/ Buckling/compression failure mode
Out-of-plane failure is in most cases critical to prevent the building from collapsing [16] [17] [18].
With the IP failure modes the masonry could be severely damaged, usually visible by large cracks or
crushed masonry, but could still have a certain amount of load carrying capacity which prevents the
building to collapse. With OP failure there is a significant chance the wall will bend or buckle and
therefore immediately loses all its load carrying capacity which could result in building collapse if the
considered wall is a load bearing wall.
Nowadays constructions are still build with masonry but need to comply with European design
standards for earthquake resistance design which are documented in Eurocodes [19]. In these codes
seismic loading is taken into account and design criteria like: wall aspect-ratio, type of bricks/mortar,
wall thickness and connection between wall and other construction elements.
Height of wall
length of wall

11
2.3 Masonry reinforcing methods and materials
2.3.1 Commonly used masonry reinforcing methods and materials
First papers about seismic loaded masonry were published around 1960-1970. With the gained
knowledge of these researches many scientist and engineers started to develop and experiment on
reinforcing methods for unreinforced masonry (URM). The key to make URM earthquake resistant is
by increasing the capability of the URM to absorb and dissipate seismic energy which will be
explained more elaborate in paragraph 2.3.2. Increasing energy absorption and dissipation can be
achieved by increasing ductility, strength and stiffness of masonry because the area under the force-
displacement curve is the energy that the wall can absorb. Figure 10 shows an example of a force-
displacement curve that is observed if URM is compared to reinforced masonry in general. Due to the
increase in stiffness, ductility and strength it is visible the area under the curve of reinforced masonry
is significantly increased compared to URM.
Figure 10: Force-displacement curve that is usually observed if URM and reinforced masonry is compared (only for illustrative purpose, not based on real data)

12
The natural frequency of the wall determines its response to a seismic vibration [20]. The natural
frequency of the wall is determined by its mass and stiffness. It is favourable to have a natural
frequency of the structure that is not the same or close to the frequency of the earthquake. This will
result in resonance and triggers a heavy response of the construction to the earthquake causing
usually more damage (Figure 11).
Figure 11: Resonance response spectrum for undamped situation with ω=frequency, ω0=natural frequency, vertical axis is displacement divided by static displacement [20]
It is not desired to increase the mass of the construction to change the natural frequency because
this will increase also the horizontal force which needs to be dealt with by the construction. This
effect can be derived from Newton’s second law (F=m·a). At a certain acceleration induced by the
earthquake and with an increased mass also the force acting on the construction increases. So when
applying reinforcing materials to an URM wall the added mass should be minimized.
Composite materials like FRP such as glass (GFRP), carbon (CFRP) and aramid (AFRP) can be used as
masonry reinforcing materials. These materials provide relatively high strength and high stiffness
with low mass i.e. these types of materials have a high specific strength and high specific stiffness.
Biomaterials as reinforcement material
Besides the common glass, carbon and aramid fibres for FRP also biomaterials can be used as fibre
material. Some examples of these fibre biomaterials are: flax, jute and hemp [21]. If one of these
natural fibres is combined with a matrix like a polymer, it is called a green composite. Usually the
mechanical properties are lower compared to the FRP that contains the traditional synthetic fibres.
The problem with using these synthetic fibres like carbon and glass is that they cannot be reused or
recycled properly. The current increase in using FRP materials for all kinds of products has a large
impact on the environment when these FRP products are disposed. The natural fibres have less
impact on the environment or could be reused in other products. Current development on green
composites is trying to find a biodegradable matrix material which can substitute the polymer matrix
without lowering the mechanical properties of the FRP.
Although FRP is a good reinforcing material for masonry because of its low mass and good
mechanical properties, it should be considered to use other materials like green composites in the
near future. Green composites have usually good thermal and acoustic insulation properties which is
an advantage when using these kind of materials in a building.

13
2.3.2 Energy absorption & dissipation of URM and reinforced masonry
At paragraph 2.3.1 it is stated that to make masonry more earthquake resistant the energy
absorption and dissipation of the masonry needs to be increased. This can be achieved by changing
the ductility, strength and stiffness of the masonry. Some conventional techniques to reinforce
masonry to increase these parameters are: surface treatments with ferrocement, shotcrete,
reinforced plaster, injection with epoxy and grout, confining masonry with reinforced concrete,
mesh, frame or place steel bars and strips in the masonry [9]. An advantage of using steel
reinforcement is the ability of steel to plastically deform. Plastic deformation of a material requires
energy. This energy is introduced by the earthquake and is dissipated by the plastic deformation of
steel. A disadvantage is the large increase in mass if steel or other metals are applied to a
construction. Adding mass results in larger forces acting on the construction during an earthquake.
FRP does not plastically deform and therefore cannot dissipate energy but has a low mass and
provides stiffness and strength to the system as a whole. In combination with the brittle masonry this
results in ductile behaviour of the total masonry wall. Other materials like mortar, bricks and
adhesive need to provide energy dissipation and can do so by crack forming, crushing, plastic
deformation and sliding (friction).
In the case of masonry, the material factures usually in mode 1 or mode 2. Mode 1 is due to tensile
failure of the material and mode 2 due to shear failure of the material (Figure 12)
Figure 12: Fracture modes [22]
During crack forming in a material the surface of that material is increased. Creating surfaces in a
material requires energy. This energy is stored in the material as surface energy and therefore
dissipates the earthquake energy. Crushing also dissipates energy because micro cracks are formed
due to boundary sliding of grains in the material. Movement of the grains relative to each other also
will take up energy. This is the same principle as in sliding of two surfaces where friction will result in
energy dissipation.
During testing of URM or reinforced masonry the dissipated energy can be calculated with use of the
force-displacement curve [23]. The Area under the force-displacement curve is the energy that is
introduced into the wall. When the OP or IP load is removed the curve will show a certain permanent
displacement of the wall. The area that is now enclosed by the axis and the curve is the dissipated
energy due to the deformation, cracking and sliding of the wall. For IP loaded walls usually a static-
cyclic loading pattern is used. The force-displacement curve will become a hysteresis loop due to the

14
tension and compression cycle on the masonry. Figure 13 shows an example of a hysteresis curve
(one cycle) with the marked areas under the curve indicating the input energy (Einp) and the
dissipated energy (Ediss). The energy dissipation can also be expressed as the hysteretic damping (ζhyst)
and is a measure of how well a masonry wall can dissipate energy. Hysteretic damping (ζhyst) is the
dissipated energy (ΔEdiss) divide by the induced potential energy (Π) times 2π (Equation 1) [23].
𝜁ℎ𝑦𝑠𝑡 =
Δ𝐸𝑑𝑖𝑠𝑠
2 ∙ 𝜋 ∙ Π
( 1 )
Figure 13: (a) Input energy by the cyclic loading (b) Dissipated energy in the masonry wall [23]
By adding FRP to the masonry the total wall behaviour changes. Using adhesives to bond the FRP also
provides some elastic behaviour. If an external reinforcing layer like a mesh is applied than the mesh
will create cohesion between the brick units and keeps the masonry wall together to some extent.
During bending tests on the Quake-Shield samples, which will be discussed in more detail in Chapter
3, this effect was noticed. Spring back of the masonry wall was visible when the load was removed
from the sample (Figure 14).
Figure 14: Spring back effect after load is removed from sample (centre displacement: top 4,33mm bottom 1,73mm) (test performed at SealteQ Group Stadskanaal)

15
Spring back is the release of stored elastic energy in the sample. The energy is transferred to other
parts of the construction. This should be kept in mind when masonry walls in a building are
reinforced that it is possible that other components in the building could become critical due to the
extra elastic energy that is transferred from the reinforced masonry to that certain components.

16
2.3.3 FRP masonry reinforcing methods
FRP masonry reinforcing materials are applied in different ways. Most commonly found method in
literature is the external bond (EB) FRP because it is easy to apply to constructions. EB FRP is also a
method used for reinforced concrete retrofitting.
A sheet, mesh or strip of FRP is fixed with an adhesive to one or two of the masonry faces. Research
has shown that the combination of the FRP, adhesive and masonry results in a transition of brittle
failure of masonry to a more ductile failure behaviour. This is for example visible in the
force-displacement curve in Figure 10 (paragraph 2.3.1). The sharp decline in the URM curve could
indicate brittle failure. The plateau forming in the reinforced masonry curve shows ductile behaviour.
Cracks are easily formed in mortar when masonry is OP loaded and due to bending a part of the
mortar will have stresses in tension. Bricks become separated from each other because of cracks in
mortar and cohesion of the masonry wall is lost. The EB FRP connects the brick units and takes over
tensile loads so the cohesion and tensile strength of a reinforced masonry wall is higher compared to
URM.
Figure 15: Axis orientation of carbon strip [25] (figure is modified by the author of this thesis)
Another method to apply FRP to masonry is by embedding FRP strips or bars into the masonry [24].
This is usually done by making a groove in the masonry wall varying from 10mm to 40mm depth. The
groove is than filled with an adhesive and a FRP strip or bar is placed into this adhesive. This method
is called near surface mount (NSM). If OP bending of the masonry wall is taken into consideration the
NSM FRP strips provide much more bending stiffness about the y-axis compared to the x-axis
indicated in Figure 15. Bending about the x-axis happens when the wall is subjected to an IP load.
Although the NSM strips are more effective in OP bending than in IP shearing it still contributes to an
increase in the shear capacity (Figure 16) [24]. This is because the strips provide some dowel action
so shear sliding along the bed joint is partly prevented. If shear sliding occurs the strips will be
tension loaded and as a result the bed joint will be loaded in compression. This compression force
increases friction and therefore also the shear capacity of the wall. This effect has a much larger
contribution in the increase in shear capacity compared to the dowel action.
During diagonal cracking the strips will be loaded in tension and take up a part of the IP load [24].
The strips also reduce crack growth because the strips keep both free edges of a formed crack

17
together to a certain extent. The ductility of the adhesive where the NSM strips are embedded in will
provide some strain and therefore cracks will form but are less coarse compared to cracks in URM.
Figure 16: Effect of NSM strips on shear sliding of masonry [24]
18
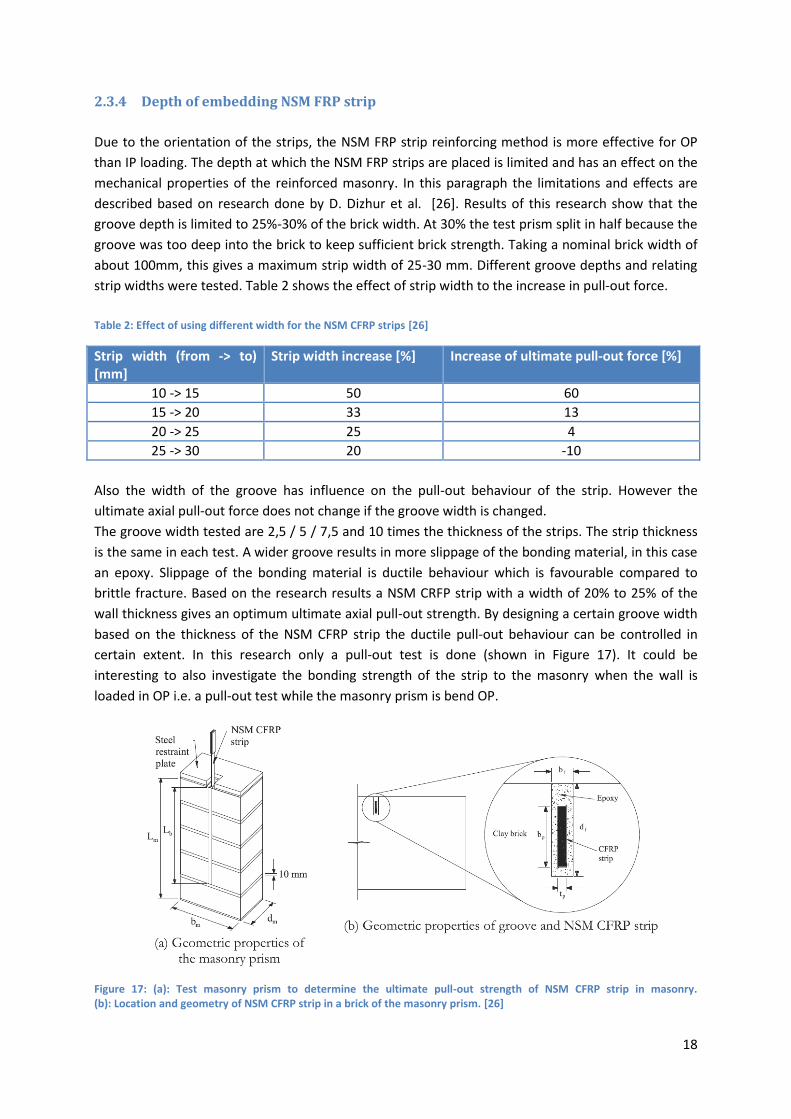
2.3.4 Depth of embedding NSM FRP strip
Due to the orientation of the strips, the NSM FRP strip reinforcing method is more effective for OP
than IP loading. The depth at which the NSM FRP strips are placed is limited and has an effect on the
mechanical properties of the reinforced masonry. In this paragraph the limitations and effects are
described based on research done by D. Dizhur et al. [26]. Results of this research show that the
groove depth is limited to 25%-30% of the brick width. At 30% the test prism split in half because the
groove was too deep into the brick to keep sufficient brick strength. Taking a nominal brick width of
about 100mm, this gives a maximum strip width of 25-30 mm. Different groove depths and relating
strip widths were tested. Table 2 shows the effect of strip width to the increase in pull-out force.
Table 2: Effect of using different width for the NSM CFRP strips [26]
Strip width (from -> to) [mm]
Strip width increase [%] Increase of ultimate pull-out force [%]
10 -> 15 50 60
15 -> 20 33 13
20 -> 25 25 4
25 -> 30 20 -10
Also the width of the groove has influence on the pull-out behaviour of the strip. However the
ultimate axial pull-out force does not change if the groove width is changed.
The groove width tested are 2,5 / 5 / 7,5 and 10 times the thickness of the strips. The strip thickness
is the same in each test. A wider groove results in more slippage of the bonding material, in this case
an epoxy. Slippage of the bonding material is ductile behaviour which is favourable compared to
brittle fracture. Based on the research results a NSM CRFP strip with a width of 20% to 25% of the
wall thickness gives an optimum ultimate axial pull-out strength. By designing a certain groove width
based on the thickness of the NSM CFRP strip the ductile pull-out behaviour can be controlled in
certain extent. In this research only a pull-out test is done (shown in Figure 17). It could be
interesting to also investigate the bonding strength of the strip to the masonry when the wall is
loaded in OP i.e. a pull-out test while the masonry prism is bend OP.
Figure 17: (a): Test masonry prism to determine the ultimate pull-out strength of NSM CFRP strip in masonry. (b): Location and geometry of NSM CFRP strip in a brick of the masonry prism. [26]

19
2.3.5 NSM FRP strip orientation and spacing
NSM strips are used only in vertical direction because in this orientation the NSM strips can increase
the OP bending capacity and also partly the IP shear capacity [24]. If the NSM strips are placed
horizontally they will reduce wall diagonal shear failure but do not contribute to an increase in shear
sliding and OP bending. In the PHD research of Petersen [24] multiple URM and masonry walls with
NSM strips in vertical and horizontal direction are tested with a diagonal tension test. The research
has proven that vertical NSM strips have a higher load carrying capacity increase compared to
horizontal NSM strips. The load increase difference is about 30% (average of multiple samples). The
load increase is the difference in load at first crack and ultimate load. Also the maximum IP
displacement is higher for the vertical NSM strips which is about 22 mm compared to 6,5 mm.
So if NSM FRP strips are used as reinforcement measurement it is recommended to place the strips
in vertical direction.
The spacing between the NSM strips is also of importance to the load bearing capacity and the total
behaviour of the reinforced masonry wall. Research was done by Michael C. Griffith, Jaya Kashyap
and M.S. Mohamed Ali on the effect of the number of NSM FRP strips, strip spacing and the amount
of reinforcing material on the behaviour of a masonry wall OP loaded [16]. The samples have a
constant amount of reinforcing material for the different number of strips and strip spacing tests.
The wall samples are 1070mmx2312mm. Figure 18 shows a clear difference in strength increase
(114%) and displacement increase (60%) when three strips are used instead of one.
Figure 18: Influence of number of strips and reinforcement ratio (results from a masonry wall OP test) [16]
In Figure 18 also the influence of reinforcement ratio (ρ) is indicated, i.e. the amount of reinforcing
material applied. The reinforcement ratio is defined as the surface area of the masonry wall sample
divided by the surface area of the total combined NSM FRP strips applied expressed in percentages.
Also here increase in strength is visible. Due to the increase in the amount of stiffer FRP material the
ductility of the total masonry wall is reduced which can be seen by the reduced maximum
displacement in the graph in Figure 18 (wall 5 & 7). More strips per unit wall area gives a smaller
effective width which results in a smaller compressive zone and more load taken up by the FRP strips.
From this research is it concluded that the bonded surface area of the FRP strip has greater influence
on the wall behaviour compared to the reinforcement ratio. The same accounts if strip spacing is
compared to reinforcement ratio. Thus applying NSM FRP strips of certain dimensions and at optimal
locations is more relevant than the amount of FRP that is applied to the wall for the total behaviour
of the masonry wall.
20
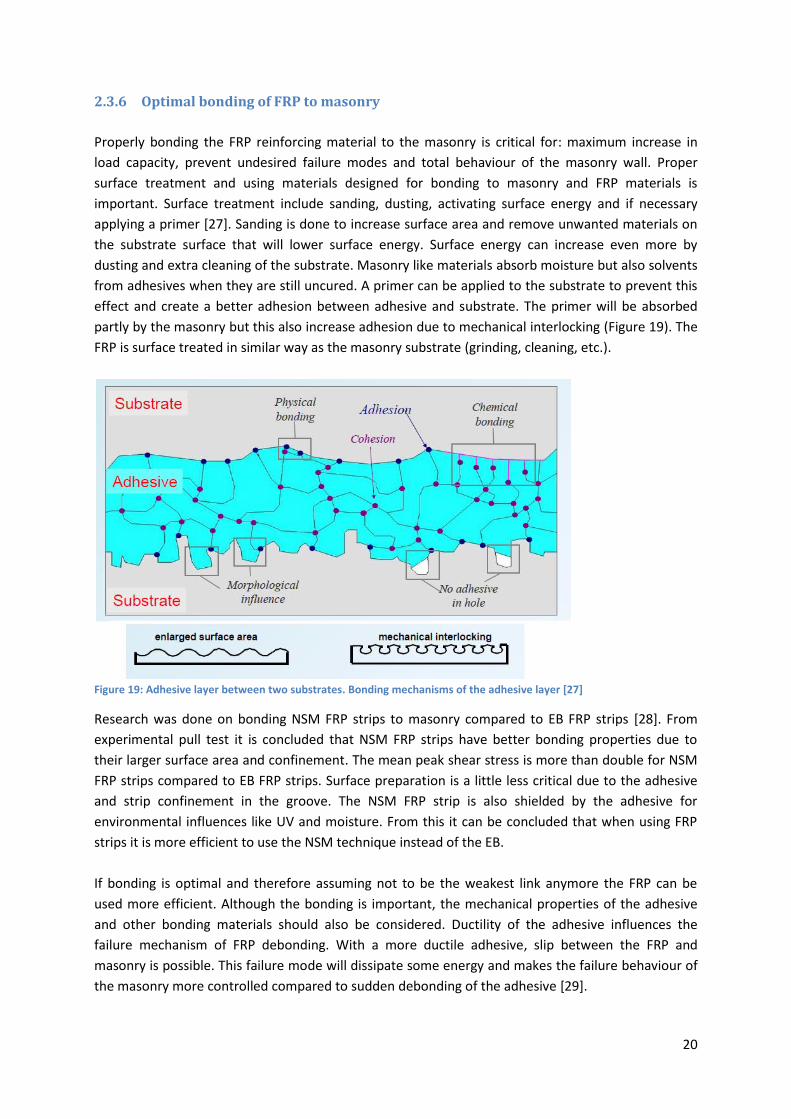
2.3.6 Optimal bonding of FRP to masonry
Properly bonding the FRP reinforcing material to the masonry is critical for: maximum increase in
load capacity, prevent undesired failure modes and total behaviour of the masonry wall. Proper
surface treatment and using materials designed for bonding to masonry and FRP materials is
important. Surface treatment include sanding, dusting, activating surface energy and if necessary
applying a primer [27]. Sanding is done to increase surface area and remove unwanted materials on
the substrate surface that will lower surface energy. Surface energy can increase even more by
dusting and extra cleaning of the substrate. Masonry like materials absorb moisture but also solvents
from adhesives when they are still uncured. A primer can be applied to the substrate to prevent this
effect and create a better adhesion between adhesive and substrate. The primer will be absorbed
partly by the masonry but this also increase adhesion due to mechanical interlocking (Figure 19). The
FRP is surface treated in similar way as the masonry substrate (grinding, cleaning, etc.).
Figure 19: Adhesive layer between two substrates. Bonding mechanisms of the adhesive layer [27]
Research was done on bonding NSM FRP strips to masonry compared to EB FRP strips [28]. From
experimental pull test it is concluded that NSM FRP strips have better bonding properties due to
their larger surface area and confinement. The mean peak shear stress is more than double for NSM
FRP strips compared to EB FRP strips. Surface preparation is a little less critical due to the adhesive
and strip confinement in the groove. The NSM FRP strip is also shielded by the adhesive for
environmental influences like UV and moisture. From this it can be concluded that when using FRP
strips it is more efficient to use the NSM technique instead of the EB.
If bonding is optimal and therefore assuming not to be the weakest link anymore the FRP can be
used more efficient. Although the bonding is important, the mechanical properties of the adhesive
and other bonding materials should also be considered. Ductility of the adhesive influences the
failure mechanism of FRP debonding. With a more ductile adhesive, slip between the FRP and
masonry is possible. This failure mode will dissipate some energy and makes the failure behaviour of
the masonry more controlled compared to sudden debonding of the adhesive [29].

21
Energy dissipation will primarily be accommodated by the masonry if FRP reinforcing measures are
used. By selecting reinforcing materials, FRP and adhesive, with certain mechanical properties a
desired, more ductile, overall failure mode can be designed for. But the long term effect of material
degradation over time should also be taken into account for selecting the proper reinforcement
materials.

22
2.4 Testing unreinforced and reinforced masonry walls
2.4.1 Commonly used masonry test methods
Out-of-plane testing of masonry
In literature two main types of masonry testing are used to determine load bearing capacity of
masonry. These two types of tests are loading masonry in OP and IP. An example of a norm for a four
point bend test for small scale masonry samples is NEN-EN 1052-2 [30]. Also OP loading of masonry
using a three point bend test can be used to determine the bending capacity of the masonry. The
difference between a three point and a four point bend test is with a four point bend test pure
bending is achieved with stress distributed over a larger area. In a three point bend test the stresses
are concentrated around the middle section of the sample.
The test samples are usually relatively small when using a three of four point bend test, ranging from
a masonry prism (single stack of multiple bricks) (Figure 20) to a small size wall of 1,3x1,3m [18] [14].
In the commonly used three of four point bend test setup the sample is placed horizontally. This is
not the orientation in which a masonry wall is applied in a construction. In horizontal position the
URM wall test samples are already close to their maximum bending capacity due to their own weight.
With reinforced masonry the bending capacity is significantly increased so the walls can be tested
horizontally but it should be kept in mind that the own weight of the masonry plays a different role
when the masonry is orientated horizontally instead of vertically. In vertical position the own weight
of masonry will compressive the masonry which is beneficial when testing bending capacity of
masonry.
On large scale masonry walls the OP bending tests is usually done in vertical position and the OP load
is applied with an airbag to create a uniform distributed load (Figure 21) [18]. Also a vertical load is
applied to simulate the weight of a roof or second floor [18]. The airbag is placed on one side of the
wall and air pressure is increased until the wall fails in OP direction. Also a semi-cyclic pressure could
be applied by inflating and deflating the airbag to simulate cyclic loading. This method could also be
used if on both sides of the wall airbags are placed so the wall can be OP loaded in both directions.
The cyclic method showed larger maximum displacement of the wall compared to monotonic loading
although the flexural strength of the wall was the same in both cases [18]. The large lateral
displacement could be caused by the fact that cracks are opened and closed in the cyclic method
which influences crack growth compared to continuously opening of the cracks when monotonically
OP loading is applied.
Figure 20: three point bending test on masonry prism [18]
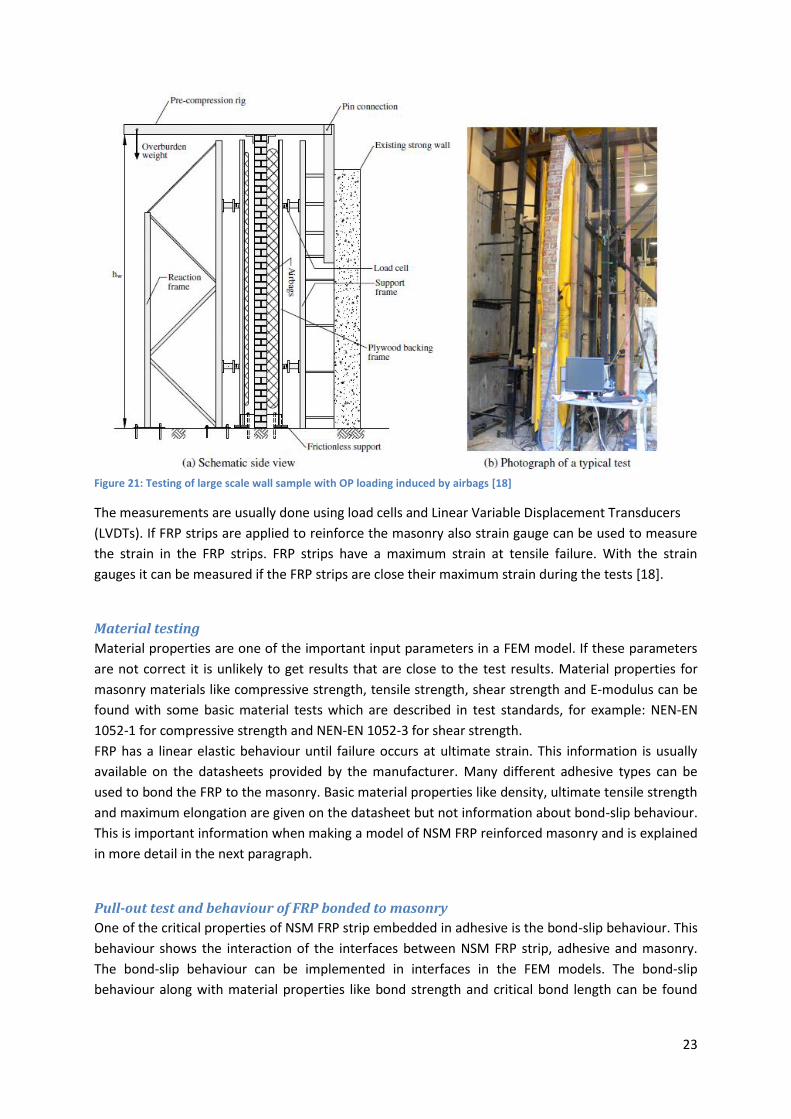
23
Figure 21: Testing of large scale wall sample with OP loading induced by airbags [18]
The measurements are usually done using load cells and Linear Variable Displacement Transducers
(LVDTs). If FRP strips are applied to reinforce the masonry also strain gauge can be used to measure
the strain in the FRP strips. FRP strips have a maximum strain at tensile failure. With the strain
gauges it can be measured if the FRP strips are close their maximum strain during the tests [18].
Material testing
Material properties are one of the important input parameters in a FEM model. If these parameters
are not correct it is unlikely to get results that are close to the test results. Material properties for
masonry materials like compressive strength, tensile strength, shear strength and E-modulus can be
found with some basic material tests which are described in test standards, for example: NEN-EN
1052-1 for compressive strength and NEN-EN 1052-3 for shear strength.
FRP has a linear elastic behaviour until failure occurs at ultimate strain. This information is usually
available on the datasheets provided by the manufacturer. Many different adhesive types can be
used to bond the FRP to the masonry. Basic material properties like density, ultimate tensile strength
and maximum elongation are given on the datasheet but not information about bond-slip behaviour.
This is important information when making a model of NSM FRP reinforced masonry and is explained
in more detail in the next paragraph.
Pull-out test and behaviour of FRP bonded to masonry
One of the critical properties of NSM FRP strip embedded in adhesive is the bond-slip behaviour. This
behaviour shows the interaction of the interfaces between NSM FRP strip, adhesive and masonry.
The bond-slip behaviour can be implemented in interfaces in the FEM models. The bond-slip
behaviour along with material properties like bond strength and critical bond length can be found

24
with a pull-out test [31]. In the pull-out test a NSM FRP strip is embedded in a prism of bricks and is
pulled out by a tensile load in the direction of the strip, as shown in Figure 22.
Figure 22: Typical pull-out test [31]
In the research of Robert B. Petersen, Mark J. Masia and Rudolf Seracino 18 masonry prisms with
NSM FRP strips were tested [31]. One of the results from the tests is shown in Figure 23. At multiple
locations along the length of the NSM FRP strip strain gauges were located to measure the strain at
these locations at a certain load. Relating the strains to shear stress and combining these values with
the measured displacement during the pull-out test gives the bond-slip curve. The curves from
different locations along the strip can be transformed into a bi-linear curve which can be used for the
FEM model to describe the bond-slip behaviour.
Figure 23: Bond-slip behaviour of NSM FRP strip in masonry prism test [31]
Some prisms from the test had a through thickness crack in line with the direction of the NSM FRP
strip [31]. The research recommends to minimize the groove depth to prevent this type of crack from
occurring. A through thickness crack can create a plane of weakness in the wall and could possibly
create problems in the total behaviour of the wall. It is also recommended not to place the NSM FRP
strips in the head joints. Mortar has usually lower mechanical properties and could therefore
potentially reduce the bond strength of the total NSM FRP strip in the masonry wall [28].

25
2.4.2 Displacement limitation of reinforced masonry
The main reason for reinforcing masonry is to prevent wall collapse. OP bending of the wall is the
main failure mode which causes wall collapse. Research found in literature shows that masonry one-
sided reinforced with NSM FRP strips can cope with 4% drift before wall collapse [18] (Figure 25).
Drift is defined as two times mid-plane displacement divided by the wall height (Figure 24).
For a 2,7 m tall wall this gives a displacement of 54mm (4% drift).
Figure 24: Illustration of OP bending of a wall
Translating this to the three point bending tests performed on Quake-Shield (discussed in Chapter 3),
theoretically 14 mm could be achieved based on this 4% drift. Comparing the research of D. Dizhur et
al. [18] to the three point bending test performed by Quake-Shield, the following should be
considered, in the research: double leaf walls, airbag reversed cyclic loading is applied and the walls
were vertical tested. When also a vertical load is applied drift increase to about 8% and the maximum
lateral force also increases (Figure 26).
Figure 25: Test wall reversed cyclic load with airbags without vertical load, shows drift up to 4%-5% is possible before collapse (W1-A = wall 1 as-built URM, W1-R = wall 1 reinforced masonry) [18]
Mid-plane
displacement
Wall height

26
Figure 26: Test wall reversed cyclic load with airbags and with a vertical load of 100kPa, shows drift up to 6%-8% is possible before collapse (W2-A = wall 2 as-built URM, W2-R = wall 2 reinforced masonry) [18]

27
2.5 Masonry FEM models
2.5.1 Construction analysis methods for earthquakes
Building construction materials and particular masonry behave non-linear during loading conditions
like an earthquake. In the past and also still nowadays analytical methods are used to determine how
a building reacts when an earthquake load is introduced onto the construction. The construction is
simplified in a spring-damper system to be able to calculate the response of the building to the
earthquake vibrations.
There are four methods described in Eurocode 8 [32]. Lateral Force Analysis (Figure 27) which uses a
lateral force, determined by the ground acceleration, dead weight and natural frequency of the
construction, to calculate if the construction can withstand the introduced earthquake load.
Figure 27: Lateral Force Analysis [32]
Second method is Modal Response Spectrum Analysis which is the same principle as the Lateral
Force Analysis but also takes the dynamic response of the construction into account. This means the
input is not a lateral force but a vibration and therefore the construction has a dynamic response.
The third method is the Non-linear static (pushover) analysis (Figure 28) which also takes into
account the non-linear behaviour of the construction.
Figure 28: Non-linear static (pushover) analysis [32]
A fourth method is construction analysis by using FEM software and is called Non-linear time-history
analysis (Figure 29). This method is most detailed and simulates construction response to
earthquakes more realistically compared to the other methods. Although the other methods are
more simplified they are also more conservative. If with FEM modelling a mistake is made the model
could lead to an unsafe situation due to the less conservative method and smaller margin of error.
Other disadvantages of this method are that it is time consuming and costly. First a model to a
certain level of detail has to be made where decisions have to be taken how to build up the FEM
model, like which type of: elements, damage models and material models will be used. The choices in
the FEM model development determine also the calculation time that is needed to analyse the
model. This processing time is also depending on the computer processing power. Computer
processing power has increased exponentially in the last decade and will continue to improve which

28
makes FEM models more suitable for this kind of earthquake analysis. The previous mentioned
analytical methods become too much work or too much simplified if the construction that needs to
be analysed is getting too large or has too complex geometries.
Figure 29: Non-linear time-history analysis [32]
Different approaches to FEM model masonry are researched in the past [33]. For large constructions
the macro model is favoured. In this approach the masonry is considered as homogeneous
anisotropic continuum, i.e. a composite material. The brick unit and mortar are modelled as one unit
of material. For large constructions it is more interesting how the construction as a whole response
to earthquakes and not the individual brick-mortar connections. For this model it is assumed that the
stresses are relatively uniform over a large area of masonry. This method of masonry modelling saves
a lot of calculation time for large constructions.
If the behaviour of masonry and the brick-mortar interaction is more interesting to investigate in a
small part of a building, than the micro model is more appropriate. In the micro model the brick unit
and mortar are modelled as continuum elements and the brick-mortar interface as discontinuous
elements. The interfaces can provide shear and crack behaviour of the masonry. The brick units and
the mortar can simulate the inelastic properties of masonry. Also a simplified micro-model can be
used to reduce the level of detail of the model and thus the calculation time. In this model the brick
units and mortar are combined to provide inelastic behaviour of these materials and the interfaces
still simulate the shear and crack behaviour of the unit connections. Figure 30 shows an overview of
the different masonry models that are described.
Figure 30: Different methods to model masonry [33]

29
Research by Lourenço shows that the simplified micro-model in most cases results in relatively
accurate masonry model behaviour compared to experimental tests [33]. The research also indicates
that brick units should be divided by interface elements to accommodate for the potential vertical
crack formation in the brick unit caused by vertical loads. This way the cracks formed in the head
joints can continue through the brick unit which was also observed by Lourenço during experimental
testing of masonry. The research of Lourenço is based on IP loading of masonry walls.

30
2.5.2 FEM models from literature
TNO DIANA provides an example of discrete modelling of masonry in the DIANA manual [34]. The
wall is build up out of half bricks divided in a 2x2 mesh of continuum plane stress linear 4-node
elements. The vertical potential crack in the brick unit and the joints will be modelled with use of
linear interface elements. The brick unit and the vertical potential crack have linear elastic
properties. The joint interface has linear stiffness and non-linear properties. This half brick is copied
to create a wall of the desired size. An opening is cut out of the model which simulates a window
opening. Boundary conditions are set and the wall is loaded monotonically in-plane with
displacement control. This model is also described in the book of ‘Structural Masonry’ [15] and shows
good correlation with experimental test results. The displacement controlled load used in this model
is not self-evident for load control in FEM modelling. The model is compared to results plotted in
force-displacement graph. An increment in displacement in the model results in a reaction force
which can also be plotted in a force-displacement graph. In FEM modelling it is often hard to get
stable model results post peak when force controlled loading is applied. With a displacement
controlled load the chance of converged results post peak is much higher.
Figure 31: Masonry model example TNO Diana [34], (a) based on tests, (b) model before analysis, (c) deformed masonry model, (d) Von Mises strains in masonry
The TU Delft provided Oosterhof Holman with a preliminary analysis of Quake-Shield by making a
simplified 2D FEM model [35]. The model is made with DIANA 9.6 and consists out of three layers of
shell elements. The three layers represent the masonry, NSM FRP strips and the EB FRP layer. For the
purpose of this project this type of model is considered to be too much simplified.
Another FEM model found in literature on masonry modelling is made by H.O. Köksal, O. Jafarov & B.
Doran and C. Karakoç [36]. The research also includes the modelling of reinforced masonry with
GRFP sheets on one-side of the URM which is the EB FRP layer reinforcing method. The FEM model is
made with LUSAS and consists of 3D solid eight-nodded hexahedral elements for the bricks and
mortar. Thick shell four-nodded elements are used for the EB GFRP layer. The walls in this research
are IP loaded. The FEM models are verified with experimental tests. Figure 32 shows the effect of
reinforcing the URM with GFRP. The maximum strain in the lower area of the wall and the sliding
along the bed joint change to diagonal cracking. In Figure 32 the aspect ratio of both walls are the
same only the scale of the wall figure is different.

31
Figure 32 (a) maximum strain in URM (b) crack pattern experimental testing URM (c) maximum strain GFRP reinforced masonry (d) crack pattern experimental testing GFRP reinforced masonry [36]
The resemblance between the model and the experimental tests is also visible in Figure 33 where the
load-displacement curves are plotted.
Figure 33: load-displacement curves comparison between model and experimental tests for URM and GFRP reinforced masonry [36]
With a 3D solid element model both the IP and OP load can be applied. The 3D solids will give a good
indication of the masonry wall behaviour under these kind of loads. Experimental tests are done in
separate IP and OP loading but with a 3D model it should be possible to see the effect of the
combined loads on a masonry wall.
A FEM model of 3D continuum solid elements and 2D interface elements is made by L. Macorini and
B.A. Izzuddin (Figure 34) [37]. ADAPTIC FEM software is used to make the model. In the research the
model is compared to experimental tests based on IP loaded URM and OP loaded URM.
Figure 34: 3D and 2D elements to model masonry with the micro-model method [37]
The FEM model results are compared with experimental results and a 2D shell FEM model proposed
by Lourenço & Rots (1997) (Figure 35). The 3D model shows proper post peak behaviour when
comparing results from the model with the experimental results.

32
Figure 35: FEM model comparison with experimental results and the 2D shell model of Lourenço & Rots (1997) of different type of URM walls IP loaded [37]
Figure 36: (a) Deformed shape of IP loaded masonry wall result with FEM model, (b) Crack pattern observed during experimental tests [37]
The force-displacement curves show good resemblance between the model and the experimental
tests and also the crack patterns are well simulated in the model as can be seen in Figure 36.
The same is visible in the OP loaded masonry wall model (Figure 37). Similar crack patterns are
simulated in the FEM model as was visible in the experimental results.
Figure 37: Left: crack pattern simulated in FEM model, right: crack pattern visible in experimental tests [37]

33
For the FEM model of this project the simplified micro-modelling method is used and so during
literature research into existing masonry FEM models the focus is in the next paragraphs only on the
simplified micro-modelling masonry models. Masonry FEM models with the simplified micro-model
show in general good correlation with experimental test results for both IP and OP loading
conditions.

34
2.5.3 Crack models for masonry
DIANA has different crack models for different materials and construction types [38]. The crack
models available for masonry are discrete crack models like Brittle cracking, (Non)Linear Tension
softening, shear retention and Combined cracking-shearing-crushing. These models can be used for
interface elements in the brick-mortar joint.
Combined cracking-shearing-crushing model Diana
When making a FEM model the possible failure modes of the construction should be known to select
a proper damage or in this case crack model that can be used for the FEM model. In case of masonry
the combined cracking-shearing-crushing (CCSC) model is an appropriate selection for the brick-
mortar joint [38]. The brick and mortar are simulated as a linear elastic continuum element and the
brick-mortar joints as interface elements with the CCSC model because of its non-linear behaviour.
Masonry is considered as a quasi-brittle material with softening properties. This occurs in tension,
compression and shear. The softening effect occurs because of micro crack forming and eventually
will lead to macro cracks [15]. Figure 38 shows a graph of the quasi-brittle behaviour of masonry.
Figure 38: Stress-deformation behaviour of certain materials [15]
This softening behaviour is also taken into account within de CCSC model. Other psychical properties
included in the CCSC model are: shear slipping, dilatancy, tension cut-off and compression cap [38].
Some of these properties interact with each other when stresses are applied which is made visible in
the graph shown in Figure 39. Shear slipping is described in the model by the Coulomb friction
criterion. Tension cut-off accommodates the tension softening in the brick-mortar interface due to
formation of micro cracks [33]. During fracture of the joint in tensile direction energy is dissipated.
The energy that is necessary to fracture the joint in tensile direction is called the mode I fracture
energy. For the Coulomb friction criterion the fracture mode II energy is used in the model. Both
fracture modes are illustrated in Figure 40.
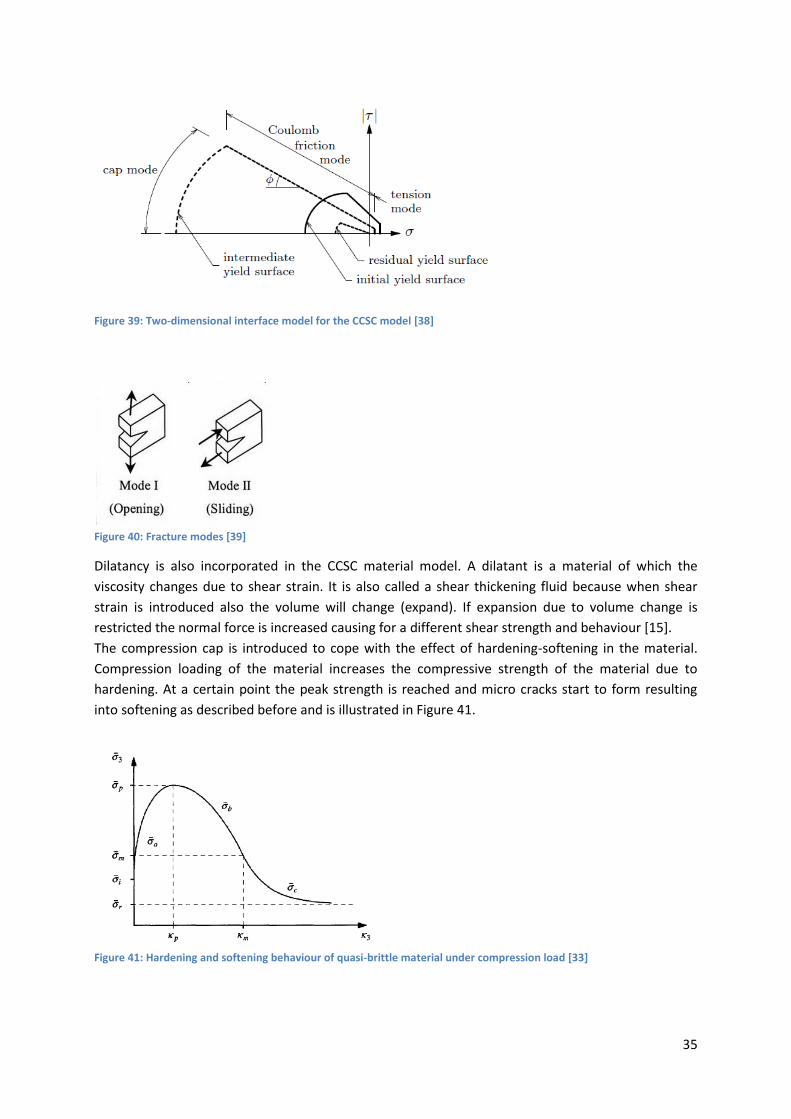
35
Figure 39: Two-dimensional interface model for the CCSC model [38]
Figure 40: Fracture modes [39]
Dilatancy is also incorporated in the CCSC material model. A dilatant is a material of which the
viscosity changes due to shear strain. It is also called a shear thickening fluid because when shear
strain is introduced also the volume will change (expand). If expansion due to volume change is
restricted the normal force is increased causing for a different shear strength and behaviour [15].
The compression cap is introduced to cope with the effect of hardening-softening in the material.
Compression loading of the material increases the compressive strength of the material due to
hardening. At a certain point the peak strength is reached and micro cracks start to form resulting
into softening as described before and is illustrated in Figure 41.
Figure 41: Hardening and softening behaviour of quasi-brittle material under compression load [33]
36
Total strain crack model
For the brick units a total strain crack model can be used [38]. The total strain crack model could be a
better option opposed to a linear elastic material model for the brick units if the brick units are build
up out of 3D solid elements and need to have compression failure abilities.
For masonry the coaxial rotating crack concept as part of the total strain crack model gives good
results [40]. With the rotating crack model the effect of stress-locking should considered because of
the geometrical discontinuities in masonry. This problem does not occur when discrete crack
modelling is used.
In the coaxial rotating crack model the stress is evaluated in the crack directions [38]. The strain
transformation matrix is depended on the strain vector direction. This model allows, for example in
case of bending a concrete beam, rotation in the geometry of the model. This new position of the
model geometry gives a new situation to evaluate how the crack growths further into the material.
The model also takes, degradation and other material property changes due to the cracking into
consideration.

37
2.5.4 Modelling of reinforcement material combined with masonry
The FRP material is build up out of small filaments that are bundled together with a resin. The FRP
strips used in Quake-Shield are unidirectional carbon strips. When modelling a composite product in
general the structural properties of the composite determine what kind of failure modes the product
will have. Delamination between carbon layers or filaments is one of the key failure modes in this
case. To model this failure mode the layers, filaments and resin need to be modelled as separate
materials. In the case of reinforcing masonry with FRP, the masonry structure itself or interfaces like
adhesive bonded to masonry are the weak links. Therefore delamination in the FRP itself is not likely
to happen. Therefore it could be assumed that homogenizing the carbon fibres, resin and adhesive as
one material for the FEM model is possible.
DIANA has the ability to model embedded reinforcement elements in solid elements. This is usually
used for steel bars in reinforcing concrete but with the proper material parameters input for FRP, it is
possible to use these reinforcement elements for modelling the NSM FRP strips. The bond-slip
behaviour of the FRP strip in the adhesive can also be implemented in the embedded reinforcement
model.
The EB FRP layer could be modelled with shell elements which are connected to the solid elements
or with 2D interface elements if slip or debonding between this EB FRP layer and masonry is
required. The values for the different material properties which are also used for the FEM model are
described in Chapter 3 & 4.

38
2.6 Literature study summary
Masonry walls in houses in the Groningen region are not designed for earthquake loads and should
be reinforced to prevent building collapse during, for Groningen standards, a severe earthquake. The
soil in Groningen in combination with the gas extraction induced earthquakes are unique in the
world. This means earthquake knowledge from other countries cannot always be applied for the
Groningen region. Engineers and scientist in the Netherlands are challenged to find solutions for the
unique earthquake situation in Groningen.
Single leaf load carrying masonry walls loaded in OP direction are most critical when collapse of the
building is considered during an earthquake. The main focus in making constructions earthquake
resistant is energy absorption and dissipation which can be increased by applying reinforcing
measures to the construction. Reinforcing URM with FRP appears to be a good measure to increase
strength, stiffness, ductility and cohesion of the masonry wall without adding too much mass to the
building. Shear and bending capacity can be increased significantly with reinforcing methods like
NSM FRP and EB FRP.
Quake-Shield is based on the combination of these two types of reinforcing measures. This makes
Quake-Shield unique because in literature the combination of NSM FRP strips and an EB FRP layer
could not be found. From the test results of Quake-Shield the combination of two existing
independent reinforcing measures looks promising.
More conventional methods to adsorb and dissipate earthquake energy is by applying a steel frame
to a house. Steel has the ability to plastically deform and dissipate energy but adds much mass to the
house or building compared to FRP reinforcing materials. FRP itself does not plastically deform and
thus cannot dissipate energy while other materials like adhesives and masonry can. Bond-slip
behaviour between FRP, adhesive and masonry and crack forming in masonry can dissipate energy
when FRP reinforcements are applied. Combining masonry with FRP reinforcing materials result in a
reinforced masonry wall that has an increased stiffness, strength and ductility which gives an
increased energy absorption and dissipation. The amount of energy absorption and dissipation can
be extracted from a force-displacement curve by taking the area under the curve.
For OP loaded masonry walls the NSM FRP strips are most effective to increase bending capacity. For
IP loaded masonry an EB FRP sheet or mesh is most effective. In an earthquake most of the walls will
be loaded in multiple directions, i.e. in OP and IP direction combined.
Research is done on the influence of the amount of applied NSM FRP strips and different strip
spacing. The location of the strips and spacing has more influence on the behaviour of the masonry
wall compared to the amount of FRP applied. Also the depth and width of the grooves for the NSM
FRP strips are investigated. The depth of the groove should be minimized to a maximum of 30% of
the wall thickness to prevent through thickness cracking.
In literature two main types of masonry tests are used to determine load bearing capacity of
masonry. These two types of tests are loading masonry in OP and IP. For OP loading of masonry a
three point bending test can be used to determine the bending capacity of the masonry. But large
masonry walls tested in vertical direction loaded with airbags give better insight in the behaviour of

39
the wall when it is OP loaded. Research on a full scale half brick, static cyclic OP loaded, NSM FRP
strips reinforced masonry wall, shows a maximum drift of 4% to 8% is possible. Drift is defined as two
times mid-plane displacement divided by the wall height.
In the case of NSM FRP strips the bond-slip behaviour is a critical parameter for the overall behaviour
of the reinforced masonry wall. A small scale pull-out test can give this bond-slip behaviour which is
also critical for implementing in a FEM model to have a proper correlation with the test results.
Based on the literature study the FEM models for this graduation project are in 3D. The masonry
walls that are modelled are relatively small and from the geometrical point of view not complex. It is
assumed that making a more detailed reinforced masonry model gives better understanding of the
behaviour of the reinforced masonry without making the model too complex. The size of the model
is relatively small and therefore calculation times will be not too long. After the model is verified with
the experimental test results a configuration analysis is done. Variants on the calibrated FEM base
model are used to give better insight in the model behaviour. Some of the variations are: spacing and
width of the FRP strips and types of reinforcing materials.
Studies show that a simplified micro-model of masonry gives accurate results compared to
experimental test results performed in other researches. L. Macorini and B.A. Izzuddin [37] made a
model for IP and OP loaded URM. The FEM model is based on this model of L. Macorini and B.A.
Izzuddin. The brick-mortar units are 3D continuum linear elastic solid elements with 2D non-linear
interface elements for the brick-mortar joints. The non-linear interface elements for the brick-mortar
joints use a CCSC model to provide crack, shear and crushing behaviour of the masonry.
The NSM FRP strips are modelled with 1D embedded reinforcement elements. The EB FRP layer is
homogenised into a single layer and is modelled with 2D shell elements. This choice is based on the
research of H.O. Köksal, O. Jafarov & B. Doran and C. Karakoç [36]. In this research EB glass FRP is
modelled as thick-shell elements which give proper results compared to the strains and crack
patterns observed during experimental testing. For the FEM model the length and width of the sheet
is large compared to the thickness. It can be assumed no shear stresses are present over the
thickness of the sheet. Therefore not thick-shell but normal shell elements are used. More details
about the FEM models can be found in Chapter 4.

40
3 Quake-Shield samples and test results
This chapter describes the reinforced masonry samples used for the Quake-Shield OP bend test.
Sample geometry, material properties and the test setup are explained. The test results of the
Quake-Shield OP bend test are described and analysed. Possible imperfection found in the samples
and test setup that are also described in this chapter
3.1 Quake-Shield sample geometry and materials
To make a proper functioning model that correlates with experimental test results key parameters
and accurate material properties need to be implemented in the model. Table 3 gives a list of used
materials and products for the test samples with the corresponding values for the material
properties. The material properties are found in datasheets and literature. Most manufactures of the
materials provide limited material properties or only general material properties. For the FEM model
also FEM specific parameters are required like normal stiffness modulus (Kn) and shear stiffness
modulus (Kt). These values are taken form literature or calculated with equations found in literature.
Details about these kind of specific FEM parameters are discussed in Chapter 4.
Table 3: Material properties from datasheets and literature. Source: datasheet manufacturer, Structural masonry [15], Petersen research [24], Performance Composites [41], Constitutive Modeling and Experiments on Polyurea [42].
Material properties of:
Brick
Mortar
carbon strip adhesive C-mesh PP-mesh
Armo-crete
PU
Density [kg/m^3]
1566 2990 1600 1550 1790 920 2090 1110
Young's modulus [GPa]
6,05 0,7 165 7,5* 160 1,2 26 0,013
Tensile strength [MPa]
1,16 2800 2,5 650 30 6,5 23
Compressive strength [MPa]
20 >12,5-<32,5
38 45,5
Poisson's ratio [-]
0,14 0,3 0,495** 0,3 0,45 0,486
max Elongation tensile [%strain]
1,5-2,0 60 1,5-2,0 600 330
* Calculated with use of given stress at certain strain in datasheet, assuming it is in the elastic range.
** Not known, but is very rubber like so Poisson’s ratio will be close to 0,5.
*** The bricks are from Steenindustrie Strating b.v. type Vuilwerk Waalformaat. The mortar is from
Dyckerhoff type metselcement MC12,5 KAA.

41
The empty cells in Table 3 mean the values for these material properties are unknown and are not
relevant for the development of the FEM model.
The dimensions of the materials used for the Quake-Shield test samples are listed in Table 4. Two
types of EB FRP layers are used for the Quake-Shield samples that are considered in this project. A
polyurea (PU) base layer with an embedded mesh of polypropylene (PP-mesh) which is also the
variant used for FEM Base model. The other variant is a cementitious base layer called Armo-Crete
(AC) with an embedded carbon mesh (C-mesh). This latter variant will be modelled in the
Quake-Shield configuration analyse (Chapter 6).
Table 4: l=length, w=width, h=height, d=diameter, t=thickness. * and ** see Figure 42 for clarification of dimensions of the pp-mesh and c-mesh. *** 5±1mm layer of material, mesh plus 5 to 10mm of material on top of mesh.
Dimensions [mm ]
Brick 209x100x50 (lxwxh)
Mortar joint 100x15 (wxh)
CFRP strip 15x2,5 (wxt)
Cut for strip 12,5x20 (wxd)
PP-mesh (polypropylene) 10x10 D=2±1*
C-mesh (carbon) 20x20 / 3x0,044 (wxt)**
Armo-crete (AC) 5±1+5-10 (t)***
PU (polyurea) 5±1+5-10 (t)***
Before the masonry wall samples were tested the outer dimensions were measured and the total
mass of the sample was calculated. These values can be found in Table 5.
Table 5: Quake-Shield sample dimensions used for the three point bend test
Dimensions [mm] Mass [kg]
URM 870x550x100 (lxwxh) 75
AC + C-mesh 870x550x110 (lxwxh) 98
PU + PP-mesh 870x550x110 (lxwxh) 76
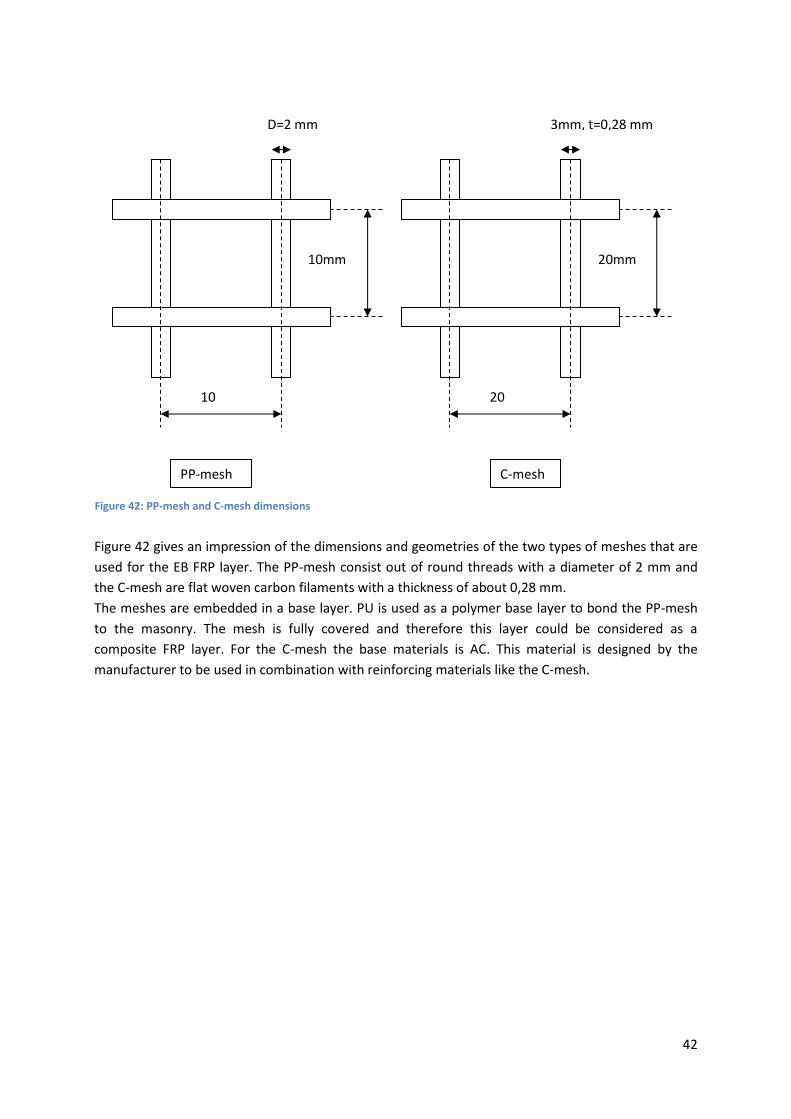
42
Figure 42 gives an impression of the dimensions and geometries of the two types of meshes that are
used for the EB FRP layer. The PP-mesh consist out of round threads with a diameter of 2 mm and
the C-mesh are flat woven carbon filaments with a thickness of about 0,28 mm.
The meshes are embedded in a base layer. PU is used as a polymer base layer to bond the PP-mesh
to the masonry. The mesh is fully covered and therefore this layer could be considered as a
composite FRP layer. For the C-mesh the base materials is AC. This material is designed by the
manufacturer to be used in combination with reinforcing materials like the C-mesh.
Figure 42: PP-mesh and C-mesh dimensions
D=2 mm 3mm, t=0,28 mm
10mm 20mm
10 20
PP-mesh C-mesh

43
3.2 Quake-Shield sample preparation
All masonry wall samples are constructed by the same masons and with the same type of brick and
mortar (Table 3). After a minimum of 28 days of curing the samples are reinforced with the
Quake-Shield reinforcing method. First two grooves are cut with a depth of about 20 mm and
12,5 mm width. The grooves are located 125 mm from the centreline of the sample and are never cut
in one of the head joints. The grooves and carbon strips are cleaned. A primer, adhesive and the
carbon strips are placed in the grooves so the grooves are filled up. A primer is applied to create
proper adhesion between the masonry and the adhesive. After the adhesive has cured sufficiently
the face of the sample is cleaned and a 5 mm layer of PU or AC is applied, depending on the type of
sample. PP-mesh for PU and C-mesh for AC is placed on the still wet PU or AC layer. Then a second
layer (5-10mm) of PU or AC is applied to embed the mesh. Details about the sample construction are
shown in Figure 43 and Figure 44. The figures are only illustrative, the scale is adjusted to make the
build up of the reinforcing layers on the masonry more clear. In reality the layer thickness is in total
about 10 to 15 mm where the brick is 100 mm in thickness.
Figure 43: Side view of reinforced masonry wall sample (scale adjusted for illustrative purpose)
Figure 44: Top view of masonry wall sample (scale adjusted for illustrative purpose)
2e layer = 5-10 mm
Mesh
1e layer = 5±1 mm
masonry
Side view
20 mm
125 mm
12,5 mm 250 mm
2 mm
15 mm
5 mm 2,5 mm
top view

44
3.3 Test setup
The test setup for the OP bending test is located at SealteQ Group (Stadskanaal) (Figure 45). It is a
simple three point bending test where the load is applied with use of a hand pump. Three
displacement measuring devices are placed on the sample to measure the relative displacement at a
certain applied load.
Figure 45: Test setup used for the OP bending test (screenshot taken from a Youtube movie of the Quake-Shield Youtube channel [43])
The samples are horizontally tested during the three point OP bend test with the reinforcing side of
the sample on the bottom side. Figure 46 shows how the sample is supported and loaded during the
three point bend test.
Figure 46: Support and loading locations of test setup and simplified support and load for FEM model
85 mm 700 mm
350 mm
40 mm
55 mm
870 mm

45
3.4 Quake-Shield test results
The sample with PU+PP-mesh EB FRP layer and NSM CFRP strips (BG1 series) is used for the FEM
model which acts as a base model for the configuration analysis. In the configuration analysis the
sample with AC + C-mesh EB FRP layer is one of the variations on the base model.
Figure 47 shows the test results of three samples of the BG1 series. Video material is available from
the BG1-1 test [43]. During the build up of the model the BG1-1 will act as the reference sample.
The test results shown in Figure 47 also show the large variation involved in masonry and in this case
reinforced masonry. Many factors could influence the test results but material properties have a
large contribution to this. Not only the large variation that is usually found in masonry during
material testing but also in the way the reinforced materials are applied. Proper bonding of the FRP
to the masonry has also an influence in the behaviour of the reinforced masonry.
Figure 47: Test results of samples of the BG1 series
Correlating the test results from BG1-1 to the video of the BG1-1 test, some noticeable effect can be
indicated in the test results. It should be noticed that the video is taken from a side view angle so for
instance crack forming is only visible at one of the side edges of the sample.
Figure 48 shows the test result of BG1-1 with numbered vertical lines that indicate the following:
1. Probably first crack initiation at 0,6 mm displacement at 5 kN. The crack has opened
enough to be visible on the video at 1,6 mm displacement. Second crack follows quickly
in the other mortar interface closest to the centre row of bricks in the sample. Here the
relative displacement is the highest and therefore the stresses are also the highest in the
mortar interface.
2. Around 5 mm displacement cracks initiate in the mortar interfaces at the left and right
side of the cracks from the previous step.

46
3. At about 15 mm displacement the first local peak appears in the test results. In the video
the initiation of the first horizontal crack in top of the bricks is visible. Here the stresses in
compression zone are reaching values that exceed ultimate compression strength of the
masonry.
4. A second peak appears in the test results but nothing noticeable is visible in the video.
Cracks keep propagating and opening up more. Also a larger area of the masonry in the
compression zone is affected by compression failure.
5. A plateau is reached. Compression failure continues and significant plastic deformation
of the polymer layer is visible at the location of the cracks at the bottom side of the
sample.
6. Plastic deformation rate of the EB FRP layer increases and eventually partly tensile failure
is visible. The NSM CFRP strips are embedded so it is difficult to see in the video what is
happing with the strips. The measuring device at the mid-plane of the sample reaches its
maximum measuring range at about 48 mm so testing is stopped at this point.
Figure 48: Noticeable effects observed during test and visible in force-displacement curve of sample BG1-1

47
3.5 Imperfection of testing and samples
Observing the sample and test setup some imperfections are noticed. These imperfections can
influence the test results but are also useful to know when comparing the test results to the results
from the FEM model. The remarks for the test sample and test setup are listed below:
Samples are tested horizontally. Masonry walls are normally used in vertical position so a
normal load due to self-weight and dead weight of other floors compresses the masonry
increasing its load carrying capacity. The effect of self-weight of the sample in horizontal
position was also visible with URM samples that were tested. Two out of three collapsed just
by their self-weight when putting them horizontally on the supports of the test setup.
The samples are build up in vertical position and then transferred into horizontal position for
the test setup. This movement could induce unwanted damage to the sample.
Masonry is very sensitive to manufacturing conditions. The condition in which the bricks,
mortar and eventually the build up of the masonry itself is made influences the mechanical
properties of the masonry sample. This introduces large variations in mechanical properties
for masonry.
In the video of the BG1-1 test it is visible that likely the EB FRP layer is not fully bonded to the
masonry from the start of the test.
It is hard to make perfectly straight masonry samples so if for instance the sample is torqued
a little, this will introduce extra stresses in the masonry that are not wanted in a three point
bend test.
Rubber strips at the support are used to compensate for the geometry imperfections but also
influence the displacement measurement because of the indenting of the rubber.
The location of the sample in the test setup is determined with the naked eye. The pressure
beam is located on one of the middle brick rows. The exact location is not measured every
time a new sample is tested.
The measuring devices are digital clocks that are controlled by levers that are placed on the
sample. The lever moves down in an arc and not straight down.
Load is applied to the sample with an hydraulic hand pump which introduce stepwise load
increments instead of more smooth continues like load increase when using a computer
controlled hydraulic pump.
Pressure of the hand pump is displayed with an analog pressure gauge. Test data is observed
by a person and logged on paper. This could introduce some reading errors when logging the
test data.

48
4 Reinforced masonry FEM model
In this Chapter it is explained how the FEM model for Quake-Shield reinforced masonry is made. The
development of this model is a process in which changes are made in the model during model
development. The start point for the development of the Quake-Shield reinforced masonry model
are the findings from the literature study (paragraph 2.5). These findings are first checked with a
more simple FEM model based on a research by Dmytro Dizhur, et al. [18]. In this research a three
point bend test on a NSM CFRP reinforced masonry prism (stack of 10 bricks) is described. More
details about this FEM model can be found in Appendix A.
The results of the FEM model based on this experimental test of Dmytro Dizhur, et al., showed
modelling problems when using embedded reinforcing elements with bond-slip properties in
combination with interface elements for the mortar. For the FEM model of Quake-Shield reinforced
masonry, the NSM CFRP strip is modelled discreetly to resolve this modelling problem. The NSM
CFRP strip is connected to the masonry with interface elements that provide bond-slip behaviour.
Details about the Quake-Shield reinforced masonry FEM model is described in this Chapter.
4.1 Quake-Shield FEM model
4.1.1 FEM model Geometry
Figure 49 shows a top view of a schematic representation of a Quake-Shield reinforced masonry
sample as described in Chapter 3. Symmetry is used to reduce the model size resulting in less
elements and thus faster calculation time. Figure 49 shows how the reinforced masonry sample can
be divided into smaller quarter ‘symmetry sections’ by mirroring the model about the two symmetry
planes. This gives the model overall dimensions of 400x278x100mm3, which is actually a
representation of 1,25 bricks in width and 6,5 bricks in length. The sample has a total of 14 bricks in
length but one row of bricks is removed from the model because this row is outside the span of the
test setup, so does not contribute to the bending capacity. In the test sample the NSM CFRP strips
are placed at 250 mm from each other so the strip is located in the symmetry section at 125 mm
from the symmetry plane.
Figure 49: Top view of reinforced masonry test sample. Red dotted line = mirror planes of quarter symmetry model, green line is location of NSM FRP strips
278 mm
250 mm
400 mm
125 mm

49
Figure 50 shows the FEM model of the reinforced masonry test sample and is thus only a quarter of
the full scale masonry test sample. DIANA has a function to easily mirror results so in Chapter 5 the
results are presented as the full scale reinforced masonry test sample. Figure 51 shows the bottom
side of the FEM model where the EB FRP layer is located. Figure 52 shows a cross-section of the FEM
model to make the NSM CFRP strip better visible
Figure 50: Geometry of FEM model (quarter symmetry model). Light blue and orange section is halve a brick width. Grey section is a quarter brick width.
Figure 51: Section of FEM model, bottom view. The EB FRP layer is visible in dark blue. The EB FRP layer is covering the whole bottom side area of the model.
Figure 52: Cross-section of model along the length of the model with the NSM CFRP Strip visible

50
Table 6 gives more details about the dimensions of the FEM model. The width of half a brick in the
model is chosen by taking the width of a brick plus the thickness of the mortar layer divided by two.
Because the quarter symmetry section is 1,25 bricks wide plus some extra to compensate for the
mortar in the head joints. The model does not contain interfaces at the head joints because these
have not a significant contribution to the overall bending behaviour of masonry compared to the bed
joints.
The mortar joint was given a non-zero-thickness to avoid problems with CFRP strip elements at the
intersection with the mortar interfaces. The mortar interface elements have a thickness of 5 mm
determined by the aspect ratio of the elements of the CFRP strip. If the thickness of the mortar
interface was smaller the aspect ratio would become too low.
The height of the groove for the CFRP strips is determined according to the CFRP strip dimensions.
The width is chosen as the off-centre distance of the FRP strip. So later for the configuration analysis
an easy shift can be made to put the CFRP strip in the centre of the model. Different strip spacings
are investigated in the configuration analysis which is easier if the strip is in the centre of the model.
Table 6: Dimensions used for FEM model, half brick, mortar joint, CFRP strip and EB FRP layer
Dimensions [mm ]
quarter sym. section 400x278x100 (lxwxh)
half brick 111,25x100x57,5 (lxwxh)
mortar joint of half brick 111,25x100x5 (lxwxh)
groove for strip 400x13,75x15 (lxwxh)
CFRP strip 15x2,5 (wxt)
EB FRP layer 400x278x10 (lxwxh)
Different types of elements are used to model the different materials. All elements in this model are
quadratic. The bricks are twenty-node isoparametric solid elements (CHX60) with a default 3×3×3
Gauss integration scheme [44]. The mortar joints are interface elements (CQ48I) with a default 3x3
Newton-cotes integration scheme. The CFRP strip consists out of curved shell elements (CQ40S) with
a default 2x2 Gauss integration scheme. A cut is made into the bricks (solid elements) to place the
NSM CFRP strip in the bricks. The strip and bricks are connected with interface elements (CQ48I) only
on the two largest surface area of the strip. The top and bottom of the strip surface area are small
(2,5mm thickness vs 15mm width) and therefore the contribution of these areas connected to the
adhesive can be neglected. The EB FRP layer at the bottom side consists out of curved shell elements
(CQ40S) connected to the solid (brick) elements
The adhesive interface elements have a non-linear material model used to model the bond-slip
behaviour of the NSM FRP strip. Bond-slip behaviour is implemented with the TAUDIS function of
DIANA. The material model for the mortar interfaces is non-linear discrete cracking. During bending
of masonry mainly tensile strength and normal stiffness modulus of the mortar affect the behaviour
of crack initiation and propagation if the wall is loaded like in the Quake-Shield OP bend test. The
CCSC material model, as suggested in the literature study and used in the more simple FEM model
based on Dmytro Dizhur, et al research, contains a lot of parameters that do not play a significant
role in a bending load case. A more simple material model like non-linear discrete cracking is
sufficient to simulate crack opening and gives a more stable FEM model.

51
During the three point bend test the top part of the sample is compression loaded and reaches
eventually compression failure. The material model for the solid brick elements describes non-linear
elastic behaviour.
The EB FRP layer has non-linear elastic material properties and the PP-mesh and PU base layer are
homogenised into a single layer which will be explained in more detail in paragraph 4.1.3.

52
4.1.2 Load and boundary conditions
Boundary conditions are applied at the location where in the test setup the supports are located on
the sample. The boundary condition of the support is in the model a single row of nodes constrained
in the Y and Z direction located at left edge of the most right brick (Figure 53). Due to the use of
symmetry in the model also constrains have to be applied at the X-Z and X-Y mirror planes. For the
X-Z mirror plane a constrain to all nodes on the X-Z mirror plane is applied in the X-direction. For the
X-Y mirror plane the constrain is applied to all nodes at the X-Y mirror plane in the Z-direction (Figure
53 & Figure 54). With these constrains applied a simply supported beam is created.
Figure 53: Side view of model with boundary conditions indicated with the red arrows (translation constrain)
Figure 54: Front view of model with boundary conditions indicated with red (translation constrain) and blue arrows (rotation constrain)
The NSM CFRP strip also has extra constrains because in the sample it is confined by the adhesive.
Bond-slip behaviour takes place in the X-Y plane and therefore the other directions are constrained
(Figure 54).
The load is applied to one node indicated by the arrow at the corner of the model (on Y-axis) (Figure
55). Multiple nodes are linked to this single loaded node to create a distributed load over a certain
area in the model. The linked nodes are indicated with the blue lines shown in Figure 55.
In the test setup the load is applied as a distributed load induced by a beam. This beam has a length
of 430mm so it does not cover the whole width of the sample. This is visible in Figure 55 where the
linked nodes to the loaded node do not cover the whole width of the model.

53
Figure 55: Top view of model with load indicated with red arrow (left corner) and linked nodes to load indicated with blue lines

54
4.1.3 FEM model material properties
In the model the mortar is partly lumped into the solid brick elements and partly in the interface
elements. Therefore the compressive behaviour of the bricks in the model could be considered as the
compressive behaviour of masonry. Some of the material properties of the bricks and mortar are
unavailable. However the TU/e performed material tests on small masonry samples made with the
same materials and by the same mason as with the Quake-Shield OP bend test. The material
properties found for the masonry samples can be found in Table 7 and are used for the brick
elements in the model.
Table 7: Material properties of brick [45]
Material properties of:
Young’s modulus
(E-modulus)
Poisson’s ratio
Density Compressive strength
Compressive fracture energy
Compression curve
Brick 1 (solid)
7886 MPa 0,08 1786 kg/m3 14 MPa 20 N/mm Parabolic
Brick 2 (solid)
7886 MPa 0,08 1786 kg/m3 14 MPa 24,2 N/mm Parabolic
The compressive fracture energy is not available from the test performed by the TU/e and is
calculated based on the compressive strength with equation ( 2 ) from the Petersen research [24].
𝐺𝑐 = 15 + 0,43 ∙ 𝑓𝑐 − 0,0036 ∙ 𝑓𝑐2 ( 2 )
Gc = Compressive fracture energy of brick
fc = Compressive strength of brick
Two types of brick materials are used, brick 1 and brick 2 (Table 7). The only difference is the
compressive fracture energy. This is due to the fact that compressive energy is influenced by the
element size. The half brick containing the CFRP strip has on average 1,78 times smaller elements in
volume. By taking the cube root of this values gives a factor of 1,21 that need to be applied to
compressive fracture energy of the larger solid elements to give all the solid elements in the model
the same compression behaviour.
Table 8: Material properties of mortar (non-linear) [15] [45]
Material properties of:
Normal stiffness modulus (Kn)
Shear stiffness modulus (Kt)
Tensile strength (ft)
Softening criterion
Mortar non-linear (interface)
141 N/mm3 64 N/mm3 0,2 MPa Hordijk et al.
Fracture energy Mode-I unloading Mode-II shear after crack
Shear modulus after crack
0,006 N/mm Secant constant 0 N/mm3

55
Equation ( 5 ) and ( 6 ) are used to calculate Kn and Kt for the mortar interface and can be found in
Appendix A. The E-modulus of mortar and brick separately are not known. Based on literature the
E-modulus of masonry is usually somewhere in the middle between the E-modulus of the bricks and
mortar so an estimate guess is made for calculating Kn and Kt values (Table 8).
The E-modulus of mortar found during a compression test can be as much as four times higher
compared to E-modulus of the mortar found in a tensile test [15]. This is an indication that the
calculated Kn and Kt values are potentially too high and in this case needs to be corrected in the
calibration phase of the model.
Fracture energy for the mortar interface is estimated from values from the book Structural Masonry
by comparing mortars with about the same tensile strength [15].
Table 9: Material properties of adhesive (non-linear)
Material properties of:
Normal stiffness modulus (Kn)
Shear stiffness modulus (Kt)
Diagram Normal direction
Diagram Shear direction
Adhesive non-linear (interface)
1000 N/mm3 0,345 N/mm3 SIGDIS function See Figure 56
TAUDIS function see Figure 57
Kn and Kt values for the adhesive are coupled to the SIGDIS and TAUDIS diagram. The linear gradient
in SIGDIS is Kn and for TAUDIS this is Kt. For the bond-slip behaviour of the NSM CFRP strip only
TAUDIS is used. SIGDIS values are large enough to prevent the FRP strip to displace in the normal
direction. The TAUDIS curve is determined with calibration of a pull-out model based on the pull-out
test performed by the TU/e [46]. This pull-out test model and calibration is described in more detail
in paragraph 4.2.
Figure 56: SIGDIS curve

56
Figure 57: TAUDIS curve
-2.00
-1.50
-1.00
-0.50
0.00
0.50
1.00
1.50
2.00
-16 -14 -12 -10 -8 -6 -4 -2 0 2 4 6 8 10 12 14 16
She
ar t
ract
ion
[M
Pa]
Shear relative displacement [mm]
TAUDIS curve

57
Table 10: Material properties of NSM CFRP strip and EB FRP layer
Material properties of:
Young’s modulus
(E-modulus)
Poisson’s ratio
Density Yield stress
NSM CFRP strip 165000 MPa 0,3 1600 kg/m3 -
EB FRP layer 58 MPa 0,486 1000 kg/m3 11 MPa
Material properties values for the CFRP strip are from the datasheet and general values found for
CFRP strips in literature [41]. Same accounts for the EB FRP layer (PU+PP-mesh) [42]. The PP-mesh
and PU could be considered as a composite material. For the model these two materials are
homogenised into one layer. The E-modulus of PP is 1200 MPa and for PU estimated at 22 MPa. By
smearing out the PP-mesh over a uniform layer an equivalent E-modulus can be calculated for the
homogenised layer using equation ( 3 ) [47]. For this equation it is assumed that there is an iso-strain
state during loading and only PP threads in longitudinal direction are loaded.
Figure 58: Schematic side view of PU+PP-mesh layer
𝐸𝑒𝑞 = 𝐸𝑃𝑈
𝐴𝑃𝑈
𝐴𝑡𝑜𝑡+ 𝐸𝑃𝑃
𝐴𝑃𝑃
𝐴𝑡𝑜𝑡
( 3 )
𝐸𝑒𝑞 = 22
550 ∗ 10 − 54𝜋
550 ∗ 10+ 1200
54𝜋
550 ∗ 10= 58 𝑀𝑃𝑎
( 4 )
Eeq = Equivalent E-modulus
Epu = E-modulus of polyurea
Epp = E-modulus of polypropylene
Apu = Cross sectional area of polyurea
App = Cross sectional area of polypropylene
Atot = Cross sectional area of total PU+PP-mesh layer
The same principle can be used to calculate an equivalent yield stress for the homogenised layer.
With PP and PU having a yield stress of respectively 21 MPa and 11 MPA. The equivalent yield stress
is about 11 MPa. It is so close to the yield stress of PU because only about 3% of the homogenised
layer is PP. For the E-modulus this effect is larger because the difference between the E-modulus for
PP and PU are relatively large. It should be noticed that these material properties have not been
found by material tests and are only available from datasheets and literature. Therefore there is
uncertainty in these values and so these values are taken into consideration in the calibration phase.
Atot = 550*10 = 5500 mm2
App= ¼*π*22 = π mm2 (# of PP threads is 54)

58
Bond-slip
From the Quake-Shield tests and literature study (paragraph 2.4.1) it is clear that the adhesive that
bonds the FRP to the masonry plays an important role in the behaviour of the masonry wall [24].
Material tests are conducted by the TU Eindhoven (TU/e) on the adhesive (NSM FRP strip to
masonry) that is used for Quake-Shield. TU/e used a pull-out test to determine the bond-slip
behaviour of the embedded NSM CFRP strip. The manufacturer of the adhesive has limited material
properties available so these types of tests are required to get proper material properties for the
FEM models.
Slip as in bond-slip has different meaning compared to slip as in material science. In material science
slip is the movement of atoms along each other in a certain plane (slip-plane) [47]. This type of slip is
permanent deformation or could be considered plastic deformation. In the bond-slip curve the first
linear part could still be in the elastic zone of the adhesive, especially if it is a ductile adhesive. So
when slip is mentioned in this thesis it is about the bond-slip behaviour and slip is thus considered as
a relative displacement between two materials (in this case masonry and FRP strip).

59
4.2 Pull-out of NSM CFRP strip
4.2.1 Pull-out test results
Six samples with different bond-length were tested during the first series of the pull-out tests by the
TU/e. Figure 59 shows a sample with a bond length of three rows of bricks. Also full bond length
(230mm) (four rows) and two rows bonded were tested [46].
Figure 59: A sample form the pull-out tests performed by the TU/e [46]
Figure 60: Pull-out test results form 6 samples with 3 different bond lengths [46]. Bond length: OH1/2= 230mm, OH3/4= 175mm, OH5/6= 115mm [46].
The results show a linear correlation between the bond-length and pull-out force. The ratio is 50,36
between the force (in kN) and bond-length (in m).
The adhesive used with Quake-Shield is rather ductile (rubber like). Therefore it is assumed the shear
stress distribution along the length of the CFRP strip could be considered uniform. During the first
0
2
4
6
8
10
12
14
0 1 2 3 4 5 6 7 8 9 10
Kra
cht
(AD
C-0
0)
[kN
]
lvdt's (A02,A03,A04,A05 ) [mm]
F-lvdt's (gemiddeld)
OH1
OH2
OH3
OH4
OH5
OH6
top

60
series of pull-out tests by the TU/e no strain gauges where used so this assumption could not be
confirmed with this test.
In literature usually a much stiffer epoxy is used to bond the NSM FRP strips to the masonry. Strain
gauges are necessary in this case to translate the pull-out test results to a bond-slip diagram which is
required in the FEM model [24]. Figure 61 shows an example of the pull-out test results where strain
gauges where used in combination with an epoxy adhesive. It is clearly visible that there is no
uniform shear stress distribution along the CFRP strip because at a certain load the shear stresses are
not the same at every location along the strip.
Figure 61:Example of bond-slip curves fitted with a bi-linear curve to be implemented in a FEM model [24]
With the uniform shear stress distribution as assumed with the Quake-Shield adhesive a simple
translation (force divide by CFRP strip bond area) from the force-displacement curve to a shear-
displacement (slip) curve can be made. The slope of the initial linear part of the latter curve is also
the value for Kt.
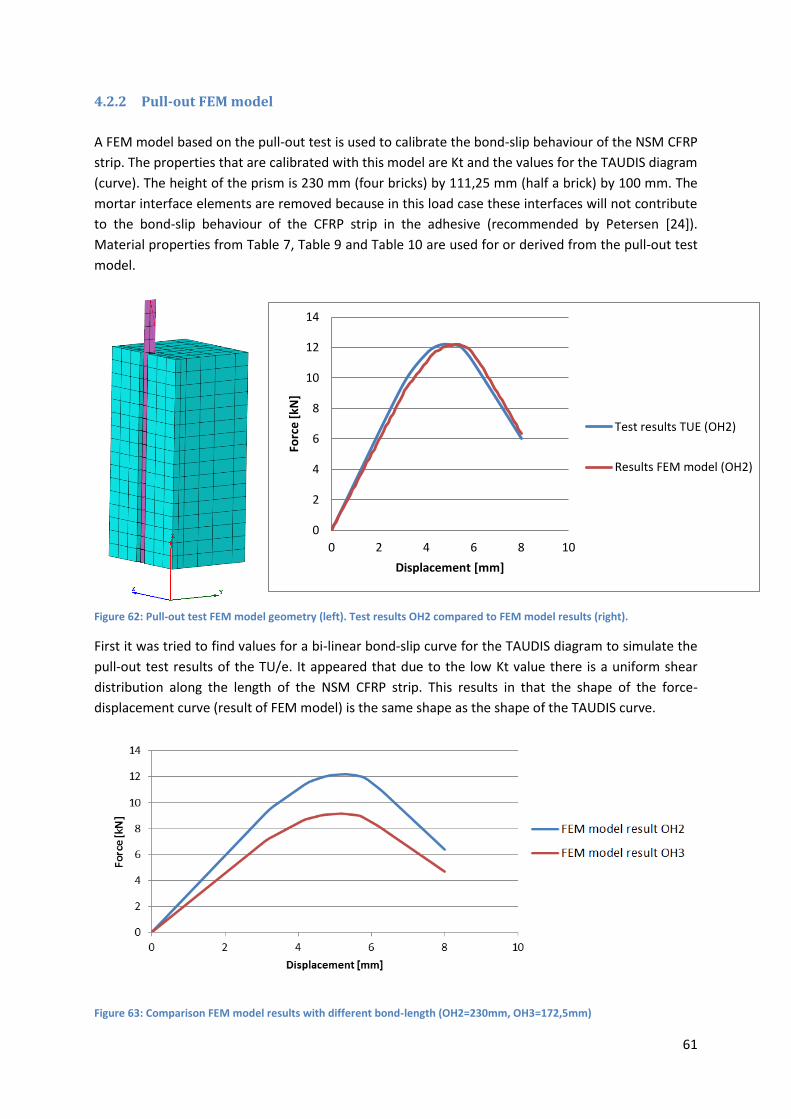
61
0
2
4
6
8
10
12
14
0 2 4 6 8 10
Forc
e [
kN]
Displacement [mm]
Test results TUE (OH2)
Results FEM model (OH2)
4.2.2 Pull-out FEM model
A FEM model based on the pull-out test is used to calibrate the bond-slip behaviour of the NSM CFRP
strip. The properties that are calibrated with this model are Kt and the values for the TAUDIS diagram
(curve). The height of the prism is 230 mm (four bricks) by 111,25 mm (half a brick) by 100 mm. The
mortar interface elements are removed because in this load case these interfaces will not contribute
to the bond-slip behaviour of the CFRP strip in the adhesive (recommended by Petersen [24]).
Material properties from Table 7, Table 9 and Table 10 are used for or derived from the pull-out test
model.
Figure 62: Pull-out test FEM model geometry (left). Test results OH2 compared to FEM model results (right).
First it was tried to find values for a bi-linear bond-slip curve for the TAUDIS diagram to simulate the
pull-out test results of the TU/e. It appeared that due to the low Kt value there is a uniform shear
distribution along the length of the NSM CFRP strip. This results in that the shape of the force-
displacement curve (result of FEM model) is the same shape as the shape of the TAUDIS curve.
Figure 63: Comparison FEM model results with different bond-length (OH2=230mm, OH3=172,5mm)

62
Test sample OH3 has a 57,5 mm shorter bond length compared to OH2 (172,5 mm vs 230 mm). The
FEM model is verified by changing the model to the geometry of the OH3 test sample bond-length.
The result of the OH3 FEM model is compared to OH2 FEM model in Figure 63. The peak load is
about 9 kN which is also the case for the test results of OH3 (Figure 60). The peak force of OH3 in the
test results is at about 4 mm displacement (Figure 60). In the FEM model results of OH3 the peak is
not shifted to the left and is around 5 mm displacement.
In the pull-out test results (Figure 60) it is visible there is a shift in displacement at peak load if the
bond length increases. Taking a linear trend line through the peaks of the six test samples it can be
assumed that with a bond length of about 800mm (length of OP bend Quake-Shield samples) the
peak force is at 43 kN (linear correlation found in the test results) and with a displacement of about
8mm.
Scaling up de Pull-out test model to a length of 800mm it appeared that the peak of the TAUDIS
curve had to be shifted 1 mm to the right. This automatically also changes the slope of the TAUDIS
curve and thus also the Kt value. The Pull-out test FEM model results show now a displacement of
8 mm at a peak load of 41kN (Figure 64).
The pull-out tests where stopped at 8 mm displacement and not tested until complete failure. How
the pull-out test curve continues after 8 mm (10 mm in the calibrated pull test model in Figure 64) is
therefore unknown at this point. The TAUDIS curve needs an extension to work properly so it is
estimated, based on how the curves of the test results where developing, to take a gradually
decreasing linear slope after 10 mm displacement. The TAUDIS curve (Figure 57) calibrated with this
model is used for the FEM model based on the Quake-Shield OP bend tests.
Figure 64: Results from FEM model with a bond length of 800mm and a shift in the TAUDIS curve of 1 mm for displacement
0
5
10
15
20
25
30
35
40
45
0 2 4 6 8 10 12 14
Forc
e [
kN]
Displacement [mm]
Pull test model (800mm)
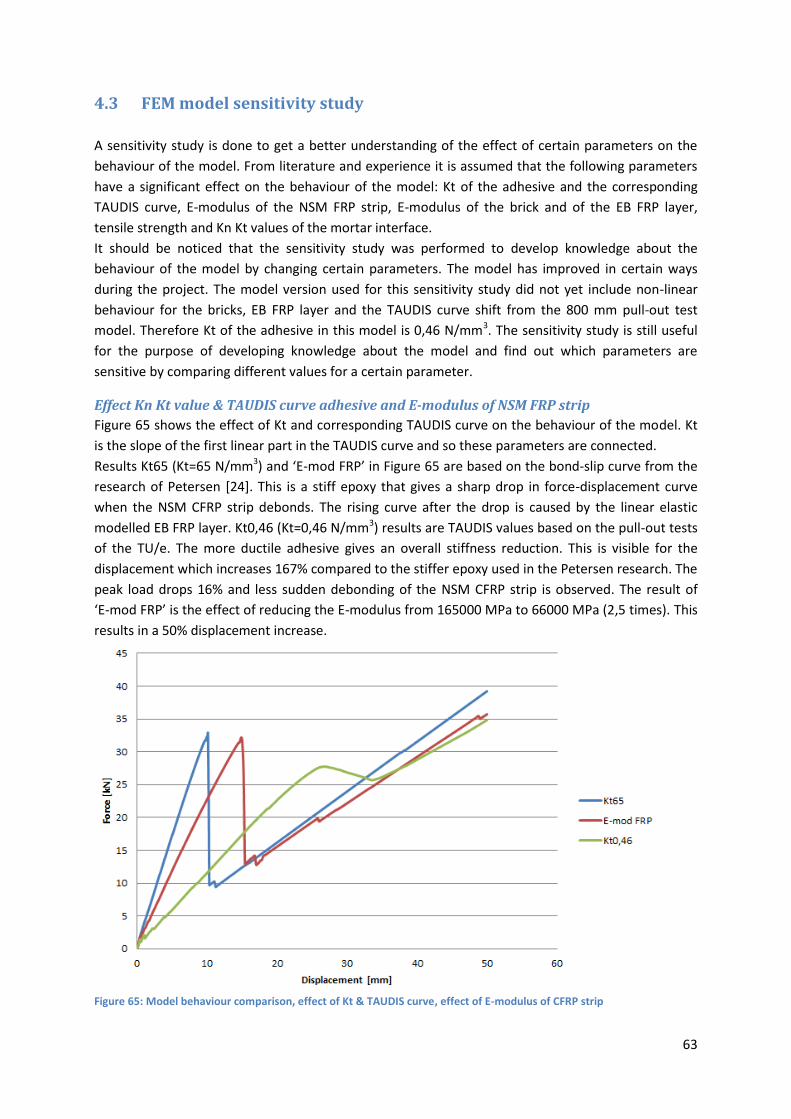
63
4.3 FEM model sensitivity study
A sensitivity study is done to get a better understanding of the effect of certain parameters on the
behaviour of the model. From literature and experience it is assumed that the following parameters
have a significant effect on the behaviour of the model: Kt of the adhesive and the corresponding
TAUDIS curve, E-modulus of the NSM FRP strip, E-modulus of the brick and of the EB FRP layer,
tensile strength and Kn Kt values of the mortar interface.
It should be noticed that the sensitivity study was performed to develop knowledge about the
behaviour of the model by changing certain parameters. The model has improved in certain ways
during the project. The model version used for this sensitivity study did not yet include non-linear
behaviour for the bricks, EB FRP layer and the TAUDIS curve shift from the 800 mm pull-out test
model. Therefore Kt of the adhesive in this model is 0,46 N/mm3. The sensitivity study is still useful
for the purpose of developing knowledge about the model and find out which parameters are
sensitive by comparing different values for a certain parameter.
Effect Kn Kt value & TAUDIS curve adhesive and E-modulus of NSM FRP strip
Figure 65 shows the effect of Kt and corresponding TAUDIS curve on the behaviour of the model. Kt
is the slope of the first linear part in the TAUDIS curve and so these parameters are connected.
Results Kt65 (Kt=65 N/mm3) and ‘E-mod FRP’ in Figure 65 are based on the bond-slip curve from the
research of Petersen [24]. This is a stiff epoxy that gives a sharp drop in force-displacement curve
when the NSM CFRP strip debonds. The rising curve after the drop is caused by the linear elastic
modelled EB FRP layer. Kt0,46 (Kt=0,46 N/mm3) results are TAUDIS values based on the pull-out tests
of the TU/e. The more ductile adhesive gives an overall stiffness reduction. This is visible for the
displacement which increases 167% compared to the stiffer epoxy used in the Petersen research. The
peak load drops 16% and less sudden debonding of the NSM CFRP strip is observed. The result of
‘E-mod FRP’ is the effect of reducing the E-modulus from 165000 MPa to 66000 MPa (2,5 times). This
results in a 50% displacement increase.
Figure 65: Model behaviour comparison, effect of Kt & TAUDIS curve, effect of E-modulus of CFRP strip

64
Effect E-modulus of brick and EB FRP layer
The sample contains 14 bricks in the length direction of the masonry sample. It is assumed that the
E-modulus of the bricks will have effect on the overall stiffness of the model. FEM model result of
‘E-mod brick’ in Figure 66 is the effect of two times higher E-modulus compared to the results of the
model ‘Kt0,46’. The peak load is increased by 13%.
Increasing the E-modulus of the EB FRP layer two times gives a significant increase in overall strength
and stiffness but also reduces the effect of the bond-slip of the CFRP strip (E-mod EB FRP, Figure 66) .
The EB FRP layer becomes in an earlier stage the primary load carrying reinforcing material and so
the drop at the peak is no longer present. The peak load cannot be determined like in the other
curves. If the peak load is estimated around 40 kN this will result in a 44% strength increase due to a
two times higher E-modulus of the EB FRP layer.
Figure 66: Model behaviour comparison, effect of E-modulus brick and EB FRP layer
Figure 67: Same force-displacement curve as Figure 66 but only the first 4 mm displacement

65
Effect of mortar tensile strength
In Figure 68 the effect of increasing the tensile strength of the mortar two times is shown. The
increase in tensile strength does not have a significant influence on the overall behaviour of the
model. Figure 69 shows the results of the first 4 mm displacement of the force-displacement curve.
During opening of the first cracks the effect of the increased mortar tensile strength is visible. The
stiffness stays about the same but the force and displacement at which the cracks initiate is
increased. The load for the first crack initiation is increased 125% and 100% for the second crack.
Because the stiffness stays about the same these percentages also apply for the displacement
increase.
Figure 68: Model behaviour comparison, effect of mortar tensile strength
Figure 69: Same force-displacement curve as Figure 68 focused on the first 4 mm displacement

66
Effect of Kn Kt value for mortar non-linear interface
During OP bending of the masonry sample the mortar is mainly loaded in tension. Therefore the Kn
value has more influence on the stiffness and crack opening of the mortar compared to Kt. Results of
the FEM model ‘Kn60’ has a Kn value of 60 N/mm3 (Figure 70). Comparing the overall behaviour of
the model if the Kn value is increased or reduced two times gives a small difference in stiffness.
Reducing Kn two times (Kn30) gives a displacement increase of 15% at peak load and increasing the
Kn value by two times (Kn90) gives a displacement decrease of 4% at peak load. The peak load is
considered to be the horizontal plateau of the curve.
Figure 71 shows the effect of Kn on the crack initiation in the first 4 mm displacement. It is also
visible that the Kn value not only has effect on the stiffness of the mortar but also on the force
required to initiate the first crack in the mortar. With a higher value for Kn the stiffness is increased
but the force required to initiate the first crack is reduced. The force required for crack initiation of
the first crack is increased by 13% for ‘Kn30’ and decreased by 22% for ‘kn90’. The initial stiffness
before crack initiation is increased by 29% for ‘Kn90’ and decreased by 43% for ‘Kn30’.
Figure 70: Model behaviour comparison, effect of Kn value if increased or reduced two times

67
Figure 71: Same force-displacement curve as Figure 70 focused on the first 4 mm displacement
From this sensitivity study it can be concluded that the ductility of the adhesive has a large influence
on the overall stiffness of the sample. By using a ductile rubber-like adhesive as used by Quake-Shield
gives a 167% displacement increase compared to the stiffer epoxy used by Petersen. Using epoxy as
adhesive and reducing the E-modulus of the FRP strip 2,5 times results in a 50% displacement
increase.
Increasing the E-modulus of the EB FRP layer two times gives an overall strength increase of 44%.
Material properties for the mortar have mainly influence on the sample behaviour in the first 4 to 5
mm displacement. It contributes to the behaviour of initiation of the cracks. Doubling the tensile
strength of the mortar will increase load at crack initiation and displacement, for the first and second
crack, by respectively 125% and 100%.
Kn and Kt of the mortar contributes to the initial stiffness of the sample before the first crack
initiates. This difference in initial stiffness affects also the load and displacement of the initiation of
the first crack. Lowering the initial stiffness 43% results in a 15% displacement increase at peak load.

68
5 FEM model calibration & results
This Chapter contains the FEM model calibration and results of the calibrated FEM Base model
compared to the test results of the Quake-Shield OP bend test.
5.1 FEM model calibration
As explained in paragraph 4.1.3 some material properties are uncertain due to unavailable or
incomplete material property data. Some of these material properties are estimated from literature
and act as reference values. In this paragraph some of these values are adjusted to get a better
model result fit compared to the sample test result.
As expected and described in paragraph 4.1.3 the Kn and Kt value for the mortar interface are too
high and therefore reduced to 35 N/mm3 and 16 N/mm3 for respectively Kn and Kt.
During the sensitivity study and the calibration process the EB FRP layer appears to have a
reasonable influence on the overall model stiffness and influence on the peak load. By homogenising
the PU and PP-mesh into a single EB FRP layer it could be that the values are overestimated both for
E-modulus and yield stress. Only 3% of the EB FRP layer is PP and it could be that the iso-strain state
assumption puts a too large contribution of PP properties into the homogenised EB FRP layer.
Therefore it could be that taking properties closer to the PU properties is more appropriate. Material
tests on the EB FRP layer could give relevant information about these material properties for
modelling. Just like the pull-out tests performed by the TU/e give better insight into the mechanical
behaviour of the adhesive.
The values for the E-modulus and yield stress are reduced to get a better fit compared to the sample
test result. The values used are 21 MPa and 4 MPa respectively for E-modulus and yield stress of the
EB FRP layer.
The E-modulus used for the EB FRP layer in the FEM model is a constant value for the first linear part.
While in general a soft polymer, like in this case PU, has a relatively high initial stiffness but levels off
when approaching yield stress as shown in Figure 72 (general soft polymer stress-strain curve [48]).
The ‘FEM EB FRP layer’ curve is calculated by homogenizing the PU and PP in a single EB FRP layer as
described in paragraph 4.1.3. To reduce the overestimation of the E-modulus of the homogenised
polymers the secant E-modulus of PU is taken. This is 8 MPa instead of 22 MPa, this reduction of
factor 2,75 is also used for the PP. Recalculating the homogenised EB FRP layer gives now an
equivalent E-modulus of 21 MPa.
The same reduction factor is used for the yield stress and goes from 11 MPa to 4 MPa. This yield
stress value gives a better fit for the onset of linear to non-linear transition in the force-displacement
curve. Table 11 shows the material properties that have been changed during the calibration process.

69
Table 11: Adjusted material properties
Material properties of:
Normal stiffness modulus (Kn)
Shear stiffness modulus (Kt)
Mortar non-linear (interface)
35 N/mm3 16 N/mm3
Material properties of:
Young’s modulus (E-modulus)
Yield stress
EB FRP layer (curved-shell)
21 MPa 4 MPa
In Figure 72 it is noticeable that the stress-strain curve in the FEM model stays at a constant yield
stress and does not show hardening like soft polymers do. The hardening of polymers happens
because of the alignment of polymer chains in the load direction. The amount of cross-links in the
polymer determines the degree of hardening. This material effect is not included in the FEM model.
Figure 72: Stress-strain curve of PU and EB FRP layer used for the FEM model. (general soft polymer curve, source: [48])

70
Figure 73: FEM model results after first calibration phase compared to test results of sample BG1-1
Figure 73 shows the result of the FEM model with the adjusted material properties from Table 11.
The overall behaviour seems to be correct when comparing FEM model result with the test result of
sample BG1-1. The peak load is 11% higher for the model compared to the test result.
The deflection from linear to non-linear behaviour at 7,2 mm displacement in the model result is the
onset of yielding of the EB FRP layer. The onset of reaching ultimate compression strength of the
masonry is less clear in the model result graph but takes place at 21 mm displacement. Yielding of
the EB FRP layer in the test sample is hard to determine with the available information however
compression failure of the masonry should initiate close to 15 mm displacement (first local peak in
test result).
The displacement at peak load in the model result is also the point when the shear traction of the
NSM CFRP strip in the adhesive reaches its maximum value which is also the peak of the TAUDIS
curve.

71
From the first calibration it can be assumed the masonry has a too high compression strength. Also
when looking closer to the initiation of the first crack it appears that the first crack in the model
initiate at 1,4 kN instead of 5 kN. Both compression strength of the masonry and tensile strength of
the mortar are adjusted. Adjusted material property values are shown in Table 12.
Table 12: Adjusted material property values for brick1 and brick2 and mortar [15]
Material properties of:
Tensile strength Fracture energy
Mortar non-linear (interface)
0,6 N/mm2 0,017 N/mm
Material properties of:
Compressive strength
Compressive fracture energy
Brick 1 10 MPa 19 MPa
Brick 2 10 MPa 23 MPa
The tensile strength is adjusted to 0,6 MPa. This results in the first crack initiation at about 4 kN. In
the book of structural masonry [15] it is indicated that a significant difference in calculated tensile
strength from a tensile test could be found if not the gross cross sectional area of the brick,
connected to the mortar, is taken but the net (real) cross sectional area. This actual bonded area
increase the calculated tensile strength from, for example a mortar with 0,26 MPa (gross), to 0,56
MPa (net) [15]. So the 0,6 MPa tensile strength compared to the measured 0,2 MPa could be
possible. Increasing the tensile strength of the mortar to 0,6 MPa results in first crack initiation at 4
kN instead of 1,4 kN.
The compressive strength of the brick is reduced until the displacement at which compressive
strength is reached is close to 15 mm displacement. This is where in the test result the onset of
compression failure is assumed to take place. Compressive facture energy is dependent of the
compressive strength and calculated with use of equation ( 2 ) which can be found in paragraph
4.1.3.
The initial value for compressive strength is from compression tests performed by the TU/e. The
samples were made at a different time and so maybe under different conditions compared to the
samples from the three point bend test. Conditions during manufacturing of the materials and
masonry itself have an effect on mechanical properties of the masonry. Therefore the variation in
masonry testing is high and so using a lower value for compressive strength for the model is possible.
With a compression strength of 10 MPa the masonry reaches this value close to 15 mm
displacement. The deviation from the graph of calibration 1 is visible at this displacement (Figure 74).
By lowering the compression strength of the masonry also the peak load reduces by 5 % compared to
the peak load of calibration 1 graph.

72
Figure 74: FEM model results of calibration 1 and calibration 2 compared with the test result
In Figure 74 the curve of FEM model calibration 2 shows a sudden upward deflection around 40 mm
displacement. At this point there is a relatively large shift noticed in the mortar interface closest to
the mid-plane of the FEM model. This shift is in the downward shear direction of the mortar
interface. Increasing Kt does not prevent this effect and it is likely this effect occurs due to the fact
the model tries to find equilibrium in both normal and shear direction. If it could not find it in the
normal direction in the interface it tries to compensate in the shear direction. Normal and shear
traction are not coupled parameters in the FEM model while in reality the load in normal direction
influences the shear capacity.
Since it is an after the peak effect it is a less critical effect in the FEM model and therefore this
sudden upward deflection should be ignored for the rest of the model results presented in this
thesis. The curve could be assumed to continue in the same decreasing slope as just before the
upward deflection. Because already activated material failure continues to progress but no new
onset of material failure is found in the model or during testing in the presented displacement range.
The FEM model that produces the result of FEM model calibration 2 is from now on the result of the
FEM Base model. The FEM Base model is used for the configuration analysis (Chapter 6). The result of
the FEM Base model is compared to the test result more elaborated in the next paragraph.

73
5.2 FEM Base model results
Figure 75 shows the FEM Base model result compared to the test result of sample BG1-1. The overall
behaviour of the model fits with the test result although there are still some points that deviate.
Figure 75: FEM model result compared with test result
The initial stiffness is about the same for the first 3,5 mm displacement. After this point the curve of
the model result starts to deviate showing a higher stiffness. The test result shows more non-linear
behaviour while the model is still in the linear elastic zone of both the EB FRP layer and masonry.
After 7,2 mm displacement the EB FRP layer starts to yield and the model starts also to show non-
linear behaviour. At 15 mm displacement the masonry reaches its ultimate compression strength.
Compared to the model result the test result shows extra loss of stiffness after 15mm displacement.
This is probably caused by the progression of compression failure of the masonry at the top side of
the sample. The loss of stiffness after 15mm displacement is more gradually developing in the model.
The peak load in the model is 8% higher compared to the peak load of the test result. At the peak
load in the model also the shear traction of the CFRP in the adhesive has reached its ultimate
strength. After this point the shear traction starts to reduce with increasing displacement resulting in
a reducing load capacity at increasing displacement. The test result does not show a distinct peak
load. The peak load is maintained (with a small 2 kN drop and then goes back to peak load) over a
wider displacement range before decline of the load capacity really sets in.

74
Crack initiation starts in the mortar interfaces around the middle of the sample where the
displacement is the highest and where also the tensile stress at the bottom of the sample is the
highest. Table 13 shows three figures how the cracks develop at three different displacements.
Table 13: Crack opening at different displacements
0,5 mm displacement: initiation of the cracks at the left and right side of the middle brick
2,4 mm displcamenet: cracks open to the left and right side of the middle three bricks
50 mm displacement: all cracks have been closed except the cracks to the left and right side of the middle brick. All the crack opening that have been formed is now relocated in these two cracks
In the model most of the mortar interfaces are opened in the first 5 mm displacement where in the
test sample the second crack in the mortar interface (counted from the middle brick) initiate around
5 mm displacement. Cracks form in the test sample mainly at the mortar interfaces connected to the
middle three bricks (Figure 76). The brick rows to the left and right side of the three middle brick
rows could be considered as undamaged masonry. From the available information it seems no cracks
have formed in the interfaces of these sections of masonry.
Figure 76: Test sample (BG1-1) at 24,1 mm displacement [43]

75
From 7,2 mm displacement the onset of yielding of the EB FRP layer takes place, shown in Figure 77.
The locations of highest stresses in the EB FRP layer are at the mortar interfaces due to crack opening
in the masonry. In Figure 77 both figures are from the location of the first and second mortar
interface counted from the middle brick. The fourth row of elements from the top shows a different
stress, this is where CFRP strip is located. This CFRP strip resists the opening of the crack locally and
therefore also reduces the stress in the EB FRP layer.
Figure 77: Von Mises stress (in MPa) in the EB FRP layer at 7,2 mm displacement (left) and 24 mm displacement (right). Both figures are from the location of the first and second mortar interface counted from the middle brick. This section is only a halve brick width and where the CFRP is located (different stress level).

76
One of the critical failure modes of the sample is the compression failure at the top of the sample.
Figure 78 and Figure 79 show the stress distribution at the top of the FEM model. The stress is mainly
concentrated at the mortar interface on the left and right side of the middle brick. Figure 80 shows
compression failure at the top of the test sample. Horizontal cracks are visible which is splitting of
the masonry caused by a too high compression load. In the test sample the compression failure is
more spread over the three middle bricks instead of the single middle brick in the model.
Figure 78: Stress distribution in top side of bricks at 14 mm displacement where the masonry reaches its ultimate compression strength (dark blue) (stress in MPa)
Figure 79: Stress distribution in top side of brick at 24 mm displacement (peak load). Stress is mainly concentrated to the left and right side of the middle brick (stress in MPa)
Figure 80: Test sample (BG1-1) at 33,4 mm displacement [43]
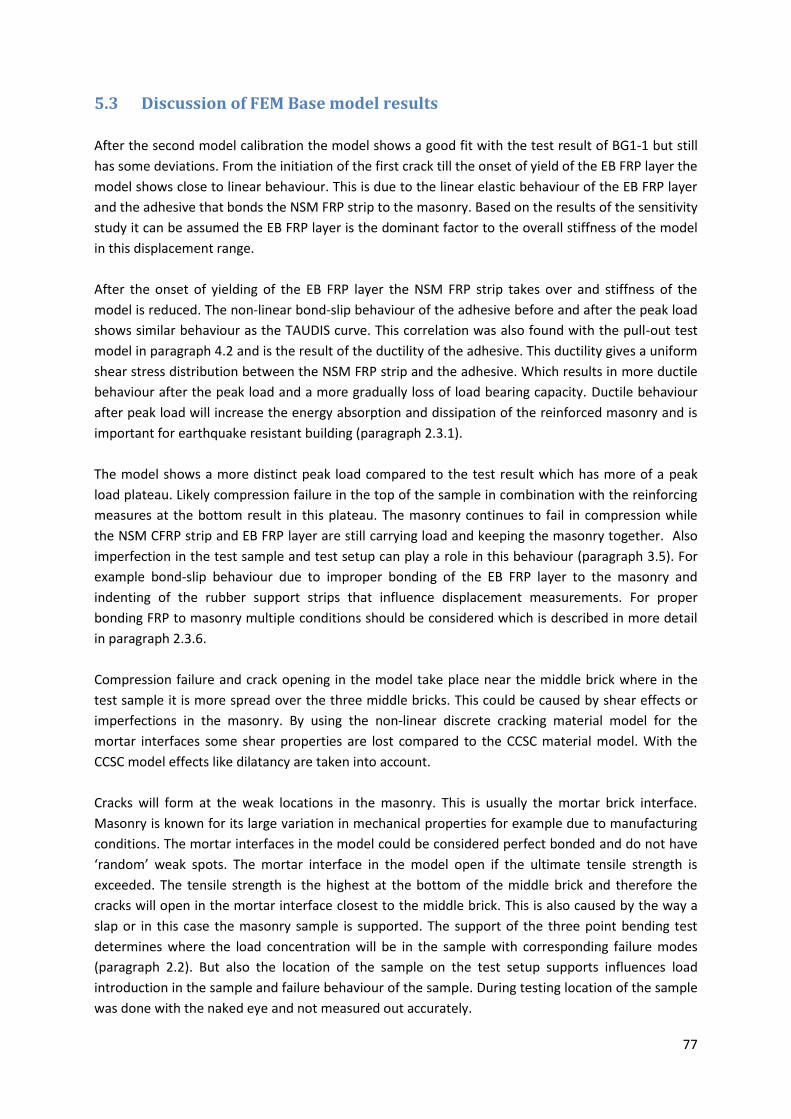
77
5.3 Discussion of FEM Base model results
After the second model calibration the model shows a good fit with the test result of BG1-1 but still
has some deviations. From the initiation of the first crack till the onset of yield of the EB FRP layer the
model shows close to linear behaviour. This is due to the linear elastic behaviour of the EB FRP layer
and the adhesive that bonds the NSM FRP strip to the masonry. Based on the results of the sensitivity
study it can be assumed the EB FRP layer is the dominant factor to the overall stiffness of the model
in this displacement range.
After the onset of yielding of the EB FRP layer the NSM FRP strip takes over and stiffness of the
model is reduced. The non-linear bond-slip behaviour of the adhesive before and after the peak load
shows similar behaviour as the TAUDIS curve. This correlation was also found with the pull-out test
model in paragraph 4.2 and is the result of the ductility of the adhesive. This ductility gives a uniform
shear stress distribution between the NSM FRP strip and the adhesive. Which results in more ductile
behaviour after the peak load and a more gradually loss of load bearing capacity. Ductile behaviour
after peak load will increase the energy absorption and dissipation of the reinforced masonry and is
important for earthquake resistant building (paragraph 2.3.1).
The model shows a more distinct peak load compared to the test result which has more of a peak
load plateau. Likely compression failure in the top of the sample in combination with the reinforcing
measures at the bottom result in this plateau. The masonry continues to fail in compression while
the NSM CFRP strip and EB FRP layer are still carrying load and keeping the masonry together. Also
imperfection in the test sample and test setup can play a role in this behaviour (paragraph 3.5). For
example bond-slip behaviour due to improper bonding of the EB FRP layer to the masonry and
indenting of the rubber support strips that influence displacement measurements. For proper
bonding FRP to masonry multiple conditions should be considered which is described in more detail
in paragraph 2.3.6.
Compression failure and crack opening in the model take place near the middle brick where in the
test sample it is more spread over the three middle bricks. This could be caused by shear effects or
imperfections in the masonry. By using the non-linear discrete cracking material model for the
mortar interfaces some shear properties are lost compared to the CCSC material model. With the
CCSC model effects like dilatancy are taken into account.
Cracks will form at the weak locations in the masonry. This is usually the mortar brick interface.
Masonry is known for its large variation in mechanical properties for example due to manufacturing
conditions. The mortar interfaces in the model could be considered perfect bonded and do not have
‘random’ weak spots. The mortar interface in the model open if the ultimate tensile strength is
exceeded. The tensile strength is the highest at the bottom of the middle brick and therefore the
cracks will open in the mortar interface closest to the middle brick. This is also caused by the way a
slap or in this case the masonry sample is supported. The support of the three point bending test
determines where the load concentration will be in the sample with corresponding failure modes
(paragraph 2.2). But also the location of the sample on the test setup supports influences load
introduction in the sample and failure behaviour of the sample. During testing location of the sample
was done with the naked eye and not measured out accurately.

78
6 Quake-Shield configuration analysis
A configuration analysis is done to get more insight in the behaviour of Quake-Shield reinforced
masonry and gain more knowledge about the FEM model. In this configuration analysis individual or
sets of parameters are changed to investigate their effect on the behaviour of the model. Results
from this configuration analysis can be used for future developing of the FEM model and Quake-
Shield reinforcing method.
The first investigated parameter variation is removing one or both of the individual reinforcing
measures from the masonry in the FEM model. Spacing between the NSM CFRP strips and
dimensions of the strips are also interesting to investigate from a building application point of view.
Quake-Shield uses an adhesive that shows good results for ductility and load bearing capacity. This
adhesive is compared to other variations and type of adhesive. Variation on the EB layer materials
are investigated as well.
6.1 URM, without NSM CFRP strip, without EB FRP layer
OP bend tests on Quake-Shield reinforced masonry show that the combination of two existing
independent reinforcing measure provides good results for increase in stiffness, strength and overall
ductility of masonry. In this paragraph the contribution of both individual reinforcing measures is
investigated with use of the FEM model. Results are shown in Figure 81. Each model result is
generated with the same FEM Base model but with each generated result one or both reinforcing
measures are removed from the model. The models with reinforcing measures show significant
improvement for load bearing capacity and ductility compared to the URM. It should be mentioned
the URM model results could not be validated with use of test results of URM samples due to
limitations of the three point bend test setup (paragraph 3.5). Therefore no realistic comparison can
be made between URM and the results of the reinforced masonry models but it should be seen as an
indication for the difference in URM and reinforced masonry in general.
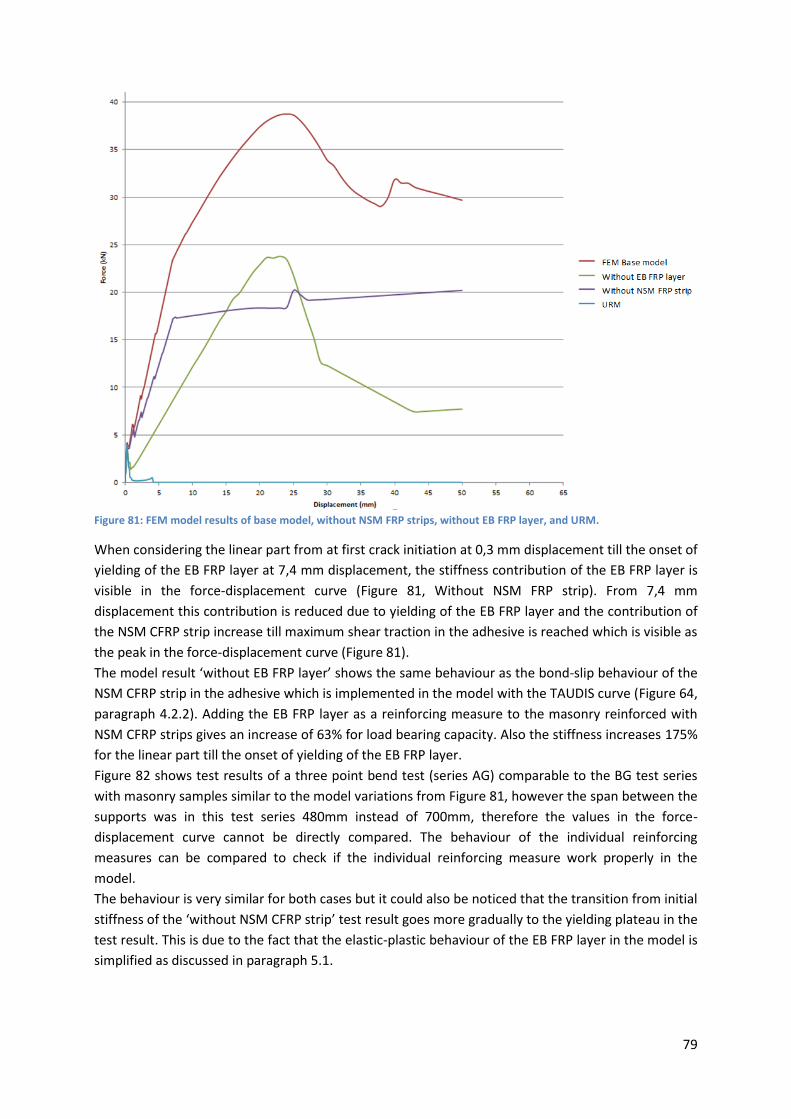
79
Figure 81: FEM model results of base model, without NSM FRP strips, without EB FRP layer, and URM.
When considering the linear part from at first crack initiation at 0,3 mm displacement till the onset of
yielding of the EB FRP layer at 7,4 mm displacement, the stiffness contribution of the EB FRP layer is
visible in the force-displacement curve (Figure 81, Without NSM FRP strip). From 7,4 mm
displacement this contribution is reduced due to yielding of the EB FRP layer and the contribution of
the NSM CFRP strip increase till maximum shear traction in the adhesive is reached which is visible as
the peak in the force-displacement curve (Figure 81).
The model result ‘without EB FRP layer’ shows the same behaviour as the bond-slip behaviour of the
NSM CFRP strip in the adhesive which is implemented in the model with the TAUDIS curve (Figure 64,
paragraph 4.2.2). Adding the EB FRP layer as a reinforcing measure to the masonry reinforced with
NSM CFRP strips gives an increase of 63% for load bearing capacity. Also the stiffness increases 175%
for the linear part till the onset of yielding of the EB FRP layer.
Figure 82 shows test results of a three point bend test (series AG) comparable to the BG test series
with masonry samples similar to the model variations from Figure 81, however the span between the
supports was in this test series 480mm instead of 700mm, therefore the values in the force-
displacement curve cannot be directly compared. The behaviour of the individual reinforcing
measures can be compared to check if the individual reinforcing measure work properly in the
model.
The behaviour is very similar for both cases but it could also be noticed that the transition from initial
stiffness of the ‘without NSM CFRP strip’ test result goes more gradually to the yielding plateau in the
test result. This is due to the fact that the elastic-plastic behaviour of the EB FRP layer in the model is
simplified as discussed in paragraph 5.1.

80
Figure 82: Test results of three point bend tests (Series-A) performed by Quake-Shield on masonry samples similar to the sample as in the BG series but without NSM CFRP strips or without the EB FRP layer.

81
6.2 Geometrical variations
6.2.1 Spacing of NSM CFRP strips
The effect of increasing strip spacing from 250 mm to 500 mm and 1000 mm is shown in Figure 83.
For this variation the model had to be scaled up to fit in one NSM CFRP strip every 1000 mm. The
scaled up model has a width of 1000 mm instead of 550 mm (Figure 84). So the strip spacing could
also be considered as number of strips per meter masonry being four strips per meter is 250 mm
spacing etc.
Figure 83: model results of scaled up model with different number of NSM CFRP strips per meter
The difference in test results when using one, two or four strips per meter is mainly visible in the load
bearing capacity. Using two strips instead of one gives a load bearing capacity increase of 31%, and
an increase of 71% when using four strips instead of one. The stiffness till the onset of yielding of the
EB FRP layer is not significantly influenced by the number of strips per meter masonry. This again
indicates the EB FRP layer is dominant in this first linear part. However the ratio EB FRP material to
NSM FRP material is different in these three variants. More NSM FRP material gives a more
distinctive peak with similar behaviour as was observed in the FEM Base model. When the portion of
EB FRP material increases the behaviour of the FEM model is more similar to the model from the
previous paragraph where only the EB FRP layer is applied.

82
Figure 84: Scaled up model with four NSM CFRP strips per meter
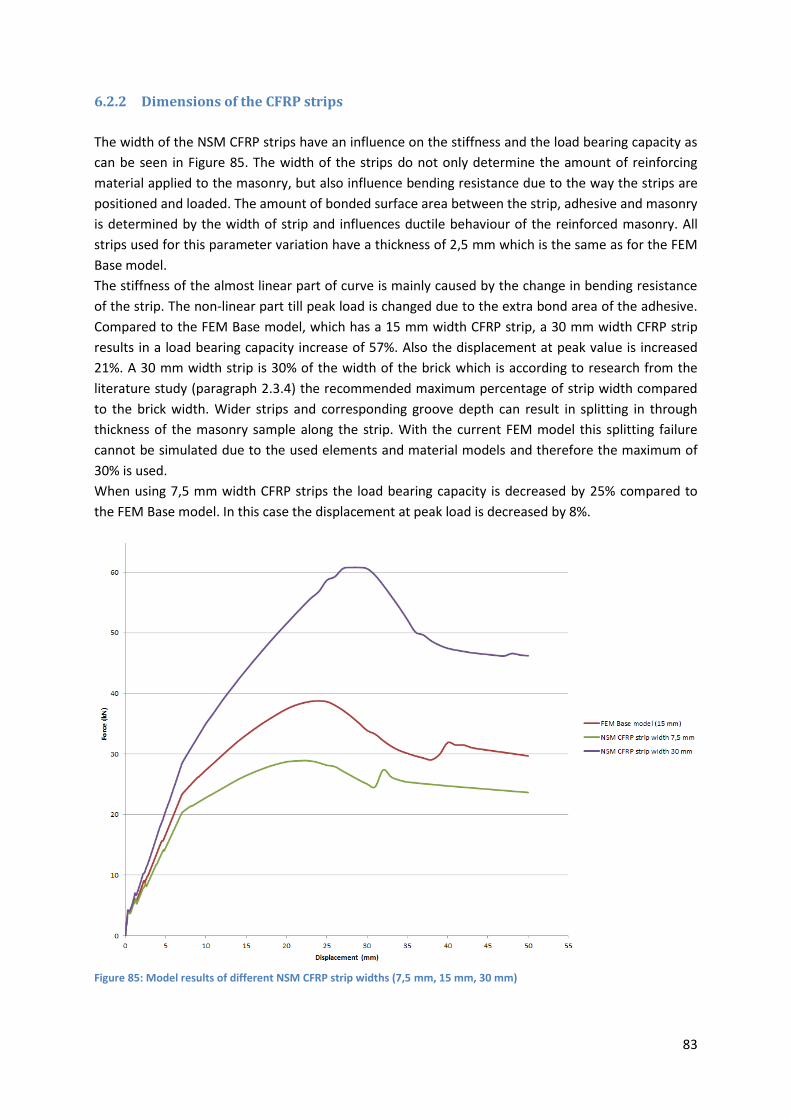
83
6.2.2 Dimensions of the CFRP strips
The width of the NSM CFRP strips have an influence on the stiffness and the load bearing capacity as
can be seen in Figure 85. The width of the strips do not only determine the amount of reinforcing
material applied to the masonry, but also influence bending resistance due to the way the strips are
positioned and loaded. The amount of bonded surface area between the strip, adhesive and masonry
is determined by the width of strip and influences ductile behaviour of the reinforced masonry. All
strips used for this parameter variation have a thickness of 2,5 mm which is the same as for the FEM
Base model.
The stiffness of the almost linear part of curve is mainly caused by the change in bending resistance
of the strip. The non-linear part till peak load is changed due to the extra bond area of the adhesive.
Compared to the FEM Base model, which has a 15 mm width CFRP strip, a 30 mm width CFRP strip
results in a load bearing capacity increase of 57%. Also the displacement at peak value is increased
21%. A 30 mm width strip is 30% of the width of the brick which is according to research from the
literature study (paragraph 2.3.4) the recommended maximum percentage of strip width compared
to the brick width. Wider strips and corresponding groove depth can result in splitting in through
thickness of the masonry sample along the strip. With the current FEM model this splitting failure
cannot be simulated due to the used elements and material models and therefore the maximum of
30% is used.
When using 7,5 mm width CFRP strips the load bearing capacity is decreased by 25% compared to
the FEM Base model. In this case the displacement at peak load is decreased by 8%.
Figure 85: Model results of different NSM CFRP strip widths (7,5 mm, 15 mm, 30 mm)

84
The minimum required thickness of the strips can be calculated using the maximum tensile stress
found in the FEM model for the NSM CFRP strip. It should be considered that the quality of the NSM
CFRP strips can deviate, therefore usually a safety factor is used. The CFRP strips used for Quake-
Shield are factory made so in this case a safety factor of 1,2 can be used [49]. The minimum thickness
of the CFRP strips with different widths can be found in Table 14. The minimum required thickness of
the CFRP strip with a width of 30 mm should be increased to 2,73 mm compared to the currently
used 2,5 mm thickness to meet the safety factor requirements.
Table 14: Maximum tensile stress in different width CFRP strips and their minimum required thickness
NSM CFRP strip width Maximum tensile stress
Percentage of ultimate tensile strength CFRP
Minimum thickness of CFRP strip
7,5 mm 1134 MPa 41% 1,23 mm
15 mm 1724 MPa 62% 1,86 mm
30 mm 2543 MPa 91% 2,73 mm

85
6.3 Material variations
6.3.1 Different types of NSM FRP reinforcing materials
CFRP is used as NSM strip material in the Quake-Shield reinforcing method. Other commonly used
reinforcement FRP materials are Glass FRP (GFRP) and Aramid FRP (AFRP). Table 15 shows the
general material properties of the commonly used FRP reinforcing material [41].
Table 15: Material properties of different FRP reinforcing materials [50] [41]
Material properties of:
Young’s modulus
(E-modulus)
Poisson’s ratio
Density Ultimate tensile
strength
Specific strength
Carbon FRP 165000 MPa 0,3 1600 kg/m3 2800 MPa 1750 kNm/kg
Glass FRP 40000 MPa 0,25 1900 kg/m3 1000 MPa 530 kNm/kg
Aramid FRP 75000 MPa 0,34 1400 kg/m3 1300 MPa 930 kNm/kg
Figure 86: Model results using different types of NSM FRP strip materials (carbon, glass, aramid)
The key material property that influences the model result is the E-modulus of the FRP material. The
three FRP materials could be ranked according their stiffness as: carbon, aramid, glass. With carbon
the one with the highest stiffness. This is also visible in the force-displacement curve in Figure 86,
where the model result with aramid is situated between carbon and glass. Related to the change in
stiffness also the peak load shifts, changing overall ductility. Displacement at peak load is increased

86
8% for aramid and 21% for glass when comparing to carbon. The load bearing capacity is not
significantly changed because for all three cases the same type of adhesive and EB FRP layer is used.

87
6.3.2 Different types of adhesive
From the sensitivity study (paragraph 4.3), the OP three point bend tests and model results it is clear
the type of adhesive to bond the NSM CFRP strip to the masonry has a large contribution to the
overall behaviour of the reinforced masonry. Some different adhesive variants are applied to the
FEM Base model to get a better understanding of its effect.
Table 16: Properties of the adhesive variants used for the FEM model
Material properties of: Shear stiffness modulus (Kt)
Diagram Shear direction
FEM Base model 0,345 N/mm3 TAUDIS function see Figure 87
2 times stronger and stiffer
0,69 N/mm3 TAUDIS function see Figure 87
2 times less strong 1,38 N/mm3 TAUDIS function see Figure 87
epoxy 65 N/mm3 TAUDIS function see Figure 87
Note: For all models the Kn and SIGDIS curve are the same as the FEM Base model
Table 16 gives the properties used for the different adhesive variants and Figure 87 shows the
TAUDIS curves used for each adhesive variant. Two variants are a modification of the bond-slip curve
used for the FEM Base model. The shear strength and initial stiffness are increased two times and for
the other variant the strength is decreased two times. The latter could be the case if the for instance
the adhesion between the adhesive and masonry has some imperfections so the ultimate shear
strength could not be reached due to premature debonding. The stiffness of the adhesive is in this
case the same till the debonding takes place and therefore the stiffness is kept the same as in the
FEM Base model. Results of these two variants can be found in Figure 89.
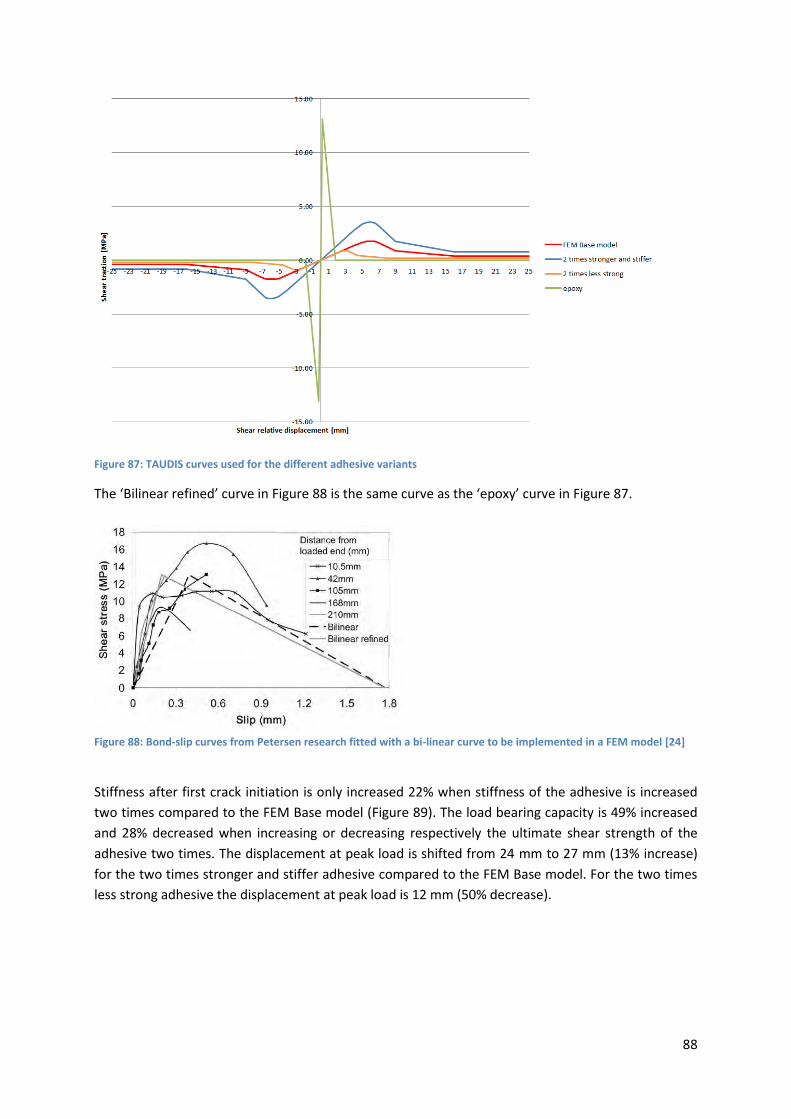
88
Figure 87: TAUDIS curves used for the different adhesive variants
The ‘Bilinear refined’ curve in Figure 88 is the same curve as the ‘epoxy’ curve in Figure 87.
Figure 88: Bond-slip curves from Petersen research fitted with a bi-linear curve to be implemented in a FEM model [24]
Stiffness after first crack initiation is only increased 22% when stiffness of the adhesive is increased
two times compared to the FEM Base model (Figure 89). The load bearing capacity is 49% increased
and 28% decreased when increasing or decreasing respectively the ultimate shear strength of the
adhesive two times. The displacement at peak load is shifted from 24 mm to 27 mm (13% increase)
for the two times stronger and stiffer adhesive compared to the FEM Base model. For the two times
less strong adhesive the displacement at peak load is 12 mm (50% decrease).
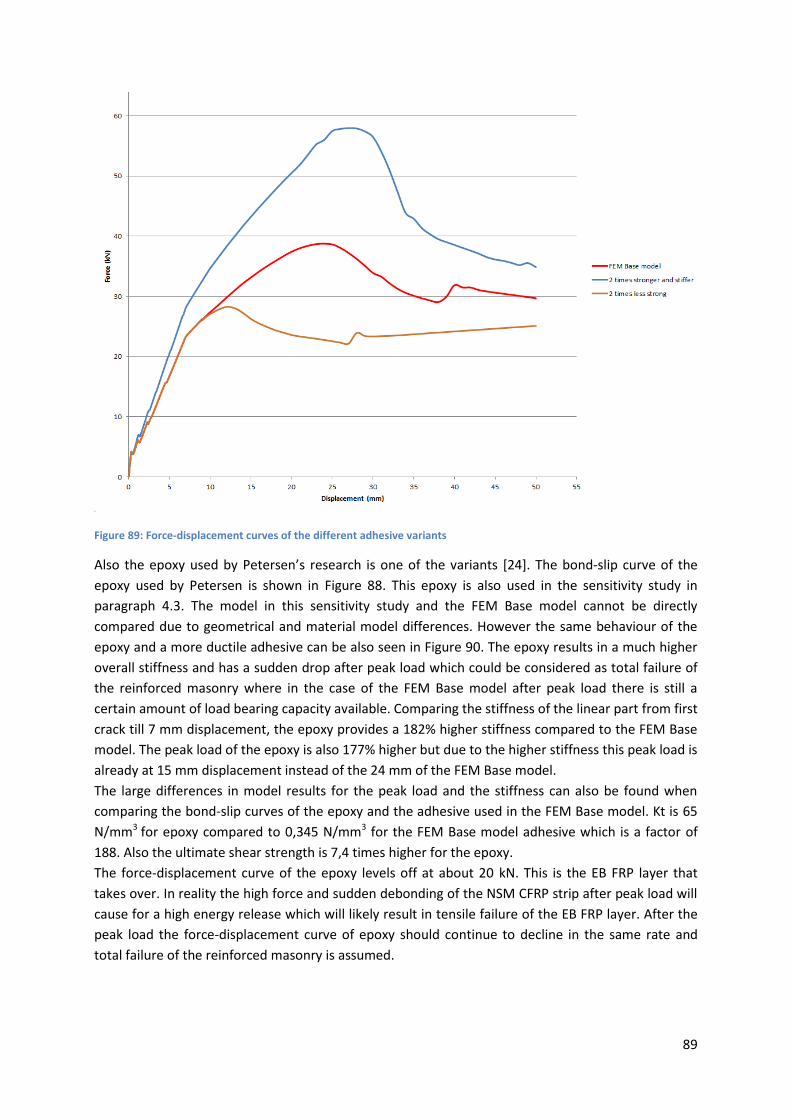
89
Figure 89: Force-displacement curves of the different adhesive variants
Also the epoxy used by Petersen’s research is one of the variants [24]. The bond-slip curve of the
epoxy used by Petersen is shown in Figure 88. This epoxy is also used in the sensitivity study in
paragraph 4.3. The model in this sensitivity study and the FEM Base model cannot be directly
compared due to geometrical and material model differences. However the same behaviour of the
epoxy and a more ductile adhesive can be also seen in Figure 90. The epoxy results in a much higher
overall stiffness and has a sudden drop after peak load which could be considered as total failure of
the reinforced masonry where in the case of the FEM Base model after peak load there is still a
certain amount of load bearing capacity available. Comparing the stiffness of the linear part from first
crack till 7 mm displacement, the epoxy provides a 182% higher stiffness compared to the FEM Base
model. The peak load of the epoxy is also 177% higher but due to the higher stiffness this peak load is
already at 15 mm displacement instead of the 24 mm of the FEM Base model.
The large differences in model results for the peak load and the stiffness can also be found when
comparing the bond-slip curves of the epoxy and the adhesive used in the FEM Base model. Kt is 65
N/mm3 for epoxy compared to 0,345 N/mm3 for the FEM Base model adhesive which is a factor of
188. Also the ultimate shear strength is 7,4 times higher for the epoxy.
The force-displacement curve of the epoxy levels off at about 20 kN. This is the EB FRP layer that
takes over. In reality the high force and sudden debonding of the NSM CFRP strip after peak load will
cause for a high energy release which will likely result in tensile failure of the EB FRP layer. After the
peak load the force-displacement curve of epoxy should continue to decline in the same rate and
total failure of the reinforced masonry is assumed.

90
Figure 90: Epoxy compared with FEM Base model
From the comparison between epoxy and the more ductile adhesive from the FEM Base model one
could assume that epoxy is a better adhesive from a stiffness and load bearing capacity point of view.
In paragraph 2.3.1 of the literature study it is explained that stiffness, strength and ductility play a
critical role in the amount of energy that can be absorbed and dissipated by the reinforced masonry.
The lack of ductility in epoxy limits this energy absorption and dissipation, i.e. limited area under the
force-displacement curve due to the sudden failure (collapse) after peak load.
Figure 91 shows a bar diagram with a comparison of taken up energy by the reinforced masonry with
different types of adhesives that are shown in the force-displacement curves of Figure 89 and
Figure 90.
The area under the force-displacement curves are calculated till 50 mm displacement. This was also
about the maximum displacement that could be measured during the OP bend test due to the
limited measuring range of the displacement measuring system. For this energy absorption
comparison it should be kept in mind that in all the models and also for the OP bend test no total
collapse is observed. It is therefore uncertain to what displacement the area under the force-
displacement curve should extent till total failure could be assumed. The available measuring data is
the range over which the area under the curve is calculated. The area for the epoxy variant is
calculated till 18mm displacement assuming the decline of this force-displacement curve continues
till zero force due to total failure.
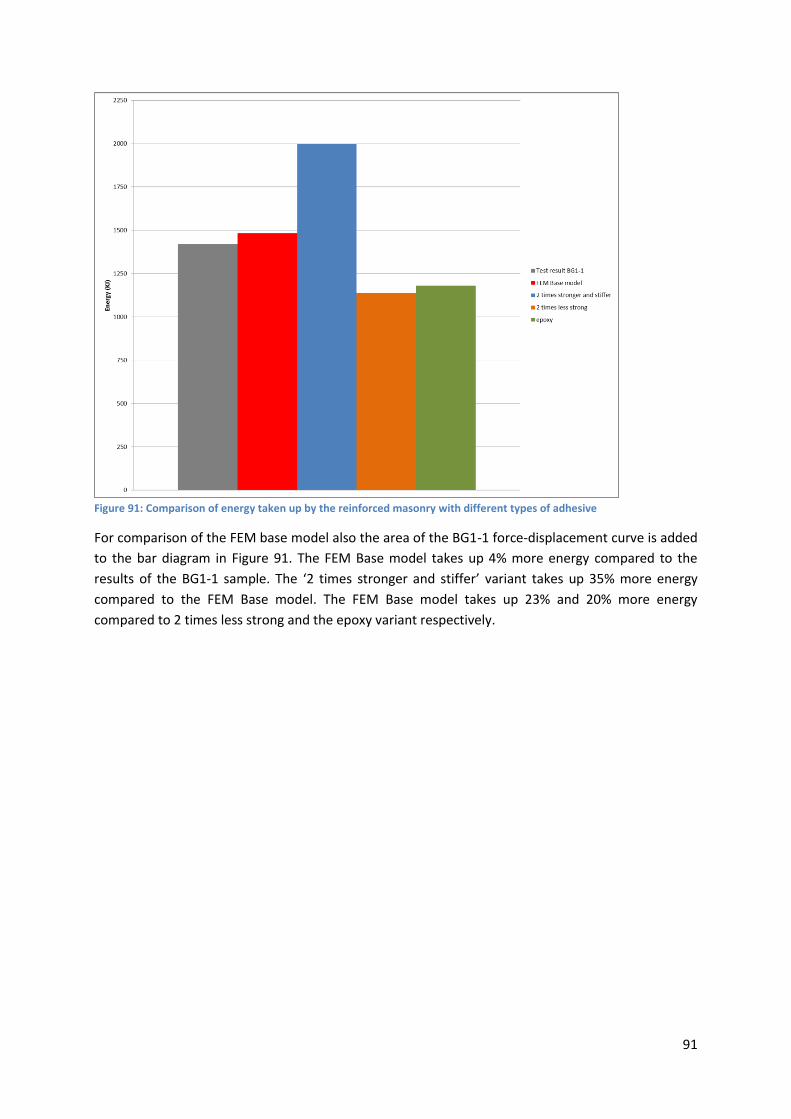
91
Figure 91: Comparison of energy taken up by the reinforced masonry with different types of adhesive
For comparison of the FEM base model also the area of the BG1-1 force-displacement curve is added
to the bar diagram in Figure 91. The FEM Base model takes up 4% more energy compared to the
results of the BG1-1 sample. The ‘2 times stronger and stiffer’ variant takes up 35% more energy
compared to the FEM Base model. The FEM Base model takes up 23% and 20% more energy
compared to 2 times less strong and the epoxy variant respectively.

92
6.3.3 Different types of EB layer
Multiple Quake-Shield reinforced masonry EB FRP layer variations are tested with the OP bend test.
Besides the PU+PP-mesh (BG1 series) used for the FEM Base model also a cementitious carbon
reinforced (AC+C-mesh) EB FRP layer is investigated. Homogenising these two very dissimilar
materials into one layer gives problems for the model. For the EB FRP layer variation in the
configuration analysis the two materials in the EB FRP layer are modelled separately. The Base
material, PU or AC, are modelled with the same curved shell elements that are also used for the
single homogenised EB FRP layer used in the FEM Base model. The PP-mesh or C-mesh is modelled
with embedded grid reinforcement elements, because the PP-mesh and C-mesh are grid like
reinforcement materials. The grid reinforcement is located at the same location as the curved shell
elements, i.e. at the mid-plane of the base layer.
Table 17 shows the four individual materials used for the EB layer variations and the corresponding
material properties used for the FEM model. For the PU and PP-mesh the same material properties
values are used as with the calculated homogenised EB FRP layer (paragraph 5.1).
Table 17: Materials used for the EB layer variations and the corresponding material properties [51] [52] [41]
Material properties of:
Young’s modulus
(E-modulus)
Poisson’s ratio
Density Yield stress
Maximum strain
Ultimate tensile
strength
PU* 8 MPa 0,486 1110 kg/m3 4 MPa 3,3 23 MPa
Armo-Crete (AC)
26000 MPa 0,2 2090 kg/m3 - 0,00021 5,5 MPa
PP-mesh (PP)* 436 MPa 0,45 920 kg/m3 8,7 MPa 6 30 MPa
C-mesh (CM) 160000 MPa 0,3 1790 kg/m3 - 0,004 650 MPa
* With the 2,75 reduction factor included from paragraph 5.1

93
First the EB layer variations with the C-mesh model results are compared with the FEM Base model
(Figure 92). The higher stiffness of AC and C-mesh are visible in the first linear part till the first crack
initiation. The load at first crack initiation is increased with 175%. This load increase in the first linear
part has an effect on the load bearing capacity for the PU+C-mesh variant, which is increased 22%
compared to the FEM Base model. For the AC+C-mesh variant the load bearing capacity is about the
same. When AC cracks its contribution to the reinforced masonry becomes almost zero. From this
point it functions mainly as bonding material for the C-mesh to the masonry. The C-mesh takes over
the load in combination with the NSM CFRP strip.
Figure 92: FEM model results of the AC+C-mesh and PU+C-mesh variant compared to the FEM Base model
In the case of PU+C-mesh the PU does not crack but starts to yield at a certain load. PU can cope with
a higher strain compared to AC due to its elastic properties. Therefore its contribution to the
reinforced masonry is much larger till yielding of the PU starts.
Figure 93 shows the first 5 mm displacement of the same force-displacement curve as shown in
Figure 92. The difference in AC and PU in the first linear part till first crack initiation is more clearly
visible. The more ductile behaviour of PU causes for a shift of the displacement at which the first
crack takes place, from 0,3 mm to 0,7 mm, a 133% increase. This means compared to the FEM Base
model with PP-mesh, the C-mesh has larger contribution to preventing cracks in the masonry to
initiate.

94
Figure 93: First 5 mm displacement of the same force-displacement curve as in Figure 92
The combination of PU+C-mesh is also tested by Oosterhof Holman with the IP tests but not yet with
an OP bend test. This combination looks promising based on the FEM model results. However the
contribution of C-mesh could be overestimated in this model. The reason for this is the material
behaviour of carbon and how it is now implemented in the FEM model.
In reality carbon in the form of a strip or thread has a linear stress-strain curve which suddenly fails
when reaching its maximum strain. From information and observations based on other OP three
point bend test performed on Quake-Shield, involving the AC+C-mesh variant, it appeared that there
is large crack opening or displacement in the C-mesh possible before total failure of the C-mesh takes
place. This could be due to slip of the C-mesh threads in the AC layer or slip of carbon strands in the
carbon threads itself. The latter one could be visible in Figure 94 which shows the threads that have
become a sort of ‘fluffy’ which indicates some strands have broken in the thread but the thread still
has some load bearing capacity. At this point the behaviour of the C-mesh in the AC or PU is not
known and should be investigated to get more accurate FEM model results when C-mesh is used.
Figure 94: An opened crack in the AC layer with CM threads visible

95
Also variants on the PU EB layer are modelled. Since the model is slightly adapted for the EB layer
variations also the PU+PP-mesh variant is compared to the homogenised single EB FRP layer of the
FEM Base model. Results are shown in Figure 95 and it is clear that the two separate layers for PU
and PP-mesh result in less stiff behaviour from the first crack initiation till 15 mm displacement.
Figure 95: FEM model results of the PU EB layer variants compared to the FEM Base model
In Figure 96 it can be seen the EB layer variations do not affect the stiffness before the first crack
initiate. This is due to the fact that the masonry stiffness is much higher compared to the PU and PP.
The relatively low stiffness of PU and PP will not have an effect on this overall stiffness behaviour.
Between the initiation of the first crack and yielding of PU the PP does have a significant contribution
to the stiffness of the EB layer. This is observed when comparing the results of the PU+PP-mesh with
the PU variant. PP starts to yield at 0,6 mm displacement. From this point the stiffness contribution
of PP to the EB layer is reduced and PU provides mainly the stiffness after this point and is therefore
comparable to the PU variant.
The load bearing capacity is not significantly different because in both cases the EB layer is yielded
and the maximum shear traction of the adhesive bonded to NSM CFRP dominant resulting in about
the same peak load. The small difference of 1 kN between the PU and PU+PP-mesh variant could be
the contribution of the PP-mesh because after yielding the PP-mesh still keeps a contribution to the
reinforced masonry
If only PU is applied as EB layer and this layer is reduced to 5 mm thickness, which is halve the
thickness used in the other variants and FEM Base model, than the load bearing capacity is
significantly reduced. Compared to the FEM Base model this is an 18% reduction in load bearing
capacity.

96
Figure 96: First 5 mm displacement of the same force-displacement curve as in Figure 95

97
6.4 Discussion of configuration analysis results
Considering the model results when only one of the two reinforcing measures is applied, the
contribution of these individual measures becomes more clear. As described in the Chapter 5 the EB
FRP layer is dominant from the first crack initiation till the onset of yielding of this layer. From this
point the NSM CFRP strip becomes dominant and the mechanical properties of the adhesive
determine in great extent the ductile behaviour of the reinforced masonry. Comparing the model
results to the AG test series similar behaviour is observed when only one of the two individual
reinforcing measures is applied.
Changing the spacing between the NSM FRP strips has a significant effect on the load bearing
capacity which is increased with 31% and 71% using two or four strips per meter masonry. More
strips per meter masonry will give a higher load bearing capacity with a more distinctive and sharper
peak. The behaviour of one of the two individual reinforcing measures becomes more dominant if
the ratio between the two reinforcing measures moves to one of the reinforcing measures. The
stiffness of the first linear part of the force-displacement curve is not significantly affected by the
ratio between the reinforcing measures. The significant increase in load bearing capacity when
applying more strips per meter masonry was also found in a research described in the literature
study (paragraph 2.3.5).
Not only strip spacing but also the dimensions of the NSM FRP strips effect the mechanical behaviour
of the masonry. Using a CFRP strip with a 30 mm width increases load bearing capacity by 57%
compared to the 15 mm wide strip used in the FEM Base model. This is because of the increase of
reinforcing material and by adding more bending resistance due to the effect of increased area
moment of inertia. The increased bonding area between adhesive, strip and masonry results in more
ductility due to the ductile material properties of the adhesive used with Quake-Shield. With a CFRP
strip that has a width of 30 mm the displacement at peak load is increased with 21% compared to the
15 mm strip.
The model can be used to calculate minimum required NSM FRP strip dimensions to prevent FRP
rupture which is an unwanted failure mode because of its sudden loss of load bearing capacity.
The type of NSM FRP strip material used results in a small difference in model behaviour. Less stiff
FRP material provides a little more ductility which is visible in a displacement increase at peak load of
21% for GFRP compared to CFRP.
Variations in adhesive properties have an effect on the TAUDIS curve in the model. Increasing
stiffness and shear strength of the adhesive two times results in a 49% increase in load bearing
capacity and a 13% increase in displacement at peak load. Comparing the ductile adhesive to a more
commonly used stiff epoxy shows clear differences. Epoxy gives a high initial stiffness and a high load
bearing capacity but has a sudden drop after the peak load has been reached. Overall ductility and
also a gradual decline in load bearing capacity after the peak load are critical when considering
reinforced masonry. The sudden drop of load bearing capacity after peak load reduces energy
absorption and can result in a sudden collapse of a building. Also stiff behaviour in the first initial part
of the force-displacement curve is not always beneficial from a dynamic point of view. If the natural

98
frequency of a building gets close to the frequency of the earthquake resonance can occur which
results in more severe loading on the building (paragraph 2.3.1).
An high peak load with very ductile behaviour after the peak is favourable because this gives a large
area under the curve which is the amount of energy that the reinforced masonry can take up during
an earthquake.
Different variations on the EB layer gives better insight in the contribution of this layer and the
effects of different types of EB FRP layer materials. Using C-mesh instead of PP-mesh gives a much
stiffer behaviour in the first initial part till first crack initiation. After cracking AC losses its
contribution to the reinforced masonry. An elastic polymer like PU keeps its contribution to the
reinforcing measure even after yielding although the contribution is reduced after this point. C-mesh
is stiffer than PP-mesh therefore crack opening will be reduced. A stiffer EB FRP layer can cause for
an increased compression zone at the top (non-reinforced) side of the masonry. This can have a
negative influence on the overall behaviour of the reinforced masonry because the masonry is
usually the weakest material compared to the reinforcing materials. By increasing the compression
zone more stress is focussed on the masonry. This could lead to lower overall mechanical properties
of the reinforced masonry although a stiffer and stronger EB FRP material is used.
For the PU+PP-mesh variant the question could be asked how large the contribution of the PP-mesh
is. An EB layer variant with only the base layer PU is used to determine the contribution of the PP-
mesh. If the two separate layers are used for the PU+PP-mesh variant the contribution is minimal
and it could be concluded that the PP-mesh could also be removed from the EB FRP layer to get
almost the same mechanical behaviour of the reinforced masonry. Compared to the FEM Base model
the PP-mesh has a contribution in the stiffness which is noticed in the displacement range from first
crack initiation till about 10 mm displacement. As explained in Chapter 5, the homogenised EB layer
with PU and PP-mesh is likely to overestimate the stiffness of this layer. Concluding from this the
PP-mesh likely has a contribution to the EB FRP layer but the dominant material is the base layer
which is in this case PU.
The thickness of the PU layer has and significant effect on the load bearing capacity. Using a 5 mm
thick EB layer instead of 10 mm reduces the load bearing capacity with 18%. This decrease is mainly
caused by a reduced contribution of the EB layer and the earlier onset of yielding of this layer. This is
because with the same load on the EB layer at a certain displacement, and half a thickness of this
layer, this means the stress will be two times higher and the yield stress is reached at a much lower
displacement.

99
7 Conclusions & Recommendations
Conclusions
In the last decade, the earthquakes in Groningen receive more attention from the government,
researchers and engineers. Research has shown that potentially heavier earthquakes with PGA
values of up to 0,42g can occur in the future. Houses build up out of single leaf masonry walls have to
be reinforced to prevent collapse if an earthquake of 0,42g takes place. Quake-Shield provides a
reinforcing method in which the combination of two independent seismic reinforcing measures are
used to make masonry earthquake resistant. Quake-Shield increases the stiffness, load bearing
capacity and ductility of the masonry. These three increased factors result in an increased energy
absorption and dissipation of the masonry wall. A FEM model is used to get more insight in the
behaviour of Quake-Shield reinforced masonry and the contribution of the two independent
reinforcing measures to the stiffness, strength and ductility of masonry.
The following conclusions can be drawn from the results found with use of the FEM model:
3D FEM modelling Quake-Shield reinforced masonry with DIANA gives good model
behaviour compared to the Quake-Shield test results.
Modelling the NSM CFRP discreetly and use the TAUDIS function (DIANA) for bond-slip
behaviour gives good model control over the bond-slip behaviour of the NSM CFRP strip in
combination with a ductile adhesive as with the Quake-Shield adhesive.
CCSC material model for the mortar interfaces cannot be combined with embedded reinforcement elements in combination with bond-slip. (DIANA) (Appendix A, Figure A - 7)
Homogenising two different types of polymers into a single layer gives a stiffness overestimation. This is also partly caused by the simplified elastic-plastic material model that is used in DIANA. (Paragraph 5.1, Figure 72).
Using embedded grid reinforcement elements for mesh type materials in combination with
shell elements for the base layer appears to work properly to simulate the EB FRP layer.
(DIANA)
Both independent seismic reinforcing measures show increased stiffness, strength and
ductility if applied separately. If combined the EB FRP layer is in the beginning dominant,
reducing the stress on the NSM FRP strip, and determines mainly the behaviour of the
reinforced masonry. After the onset of yielding of the EB FRP layer the NSM FRP strip
becomes dominant, determining the load bearing capacity and behaviour of the reinforced
masonry post peak. (Paragraph 6.1, Figure 81)
The bond-slip behaviour of the ductile adhesive to bond the NSM CFRP to the masonry
determines mainly the pre and post peak behaviour of the reinforced masonry with a
gradual decline in load bearing capacity after the peak load.
The ultimate shear strength of the adhesive determines mainly the peak load of the
reinforced masonry.
The EB FRP layer bonds the individual bricks and provides stiffness to the reinforced
masonry from the first crack initiation till yielding of the EB FRP layer.
Small imperfections in the test samples and test setup have likely influenced the test results.
The model does not contain these imperfections and therefore the model results could be
slightly overestimated.

100
Spacing and dimensions of the NSM CFRP strips have a significant influence on the maximum
load bearing capacity of the reinforced masonry. (Paragraph 6.2.1, Figure 83)
Epoxy as an adhesive for bonding NSM FRP gives a high stiffness and load bearing capacity
but a reduced ductility after peak load compared to the adhesive of Quake-Shield. Resulting
in a lower energy absorption and therefore epoxy is a less favourable earthquake reinforcing
material. (Paragraph 6.3.2, Figure 90)
A cementitious base layer like Armo-Crete only has a contribution to an increased stiffness
of the reinforced masonry till the Armo-Crete base layer cracks.
C-mesh reduces crack opening by increasing stiffness of the reinforced masonry. Combined
with the PU base layer the onset of yielding of PU is delayed and also the stress on the NSM
FRP strip is reduced resulting in a higher load bearing capacity for masonry when the
ultimate shear strength of the adhesive is reached (peak load).
Recommendations
The FEM model used for this project shows good behaviour compared to the test result of BG1-1.
However the model could still be improved or more details could be included to get even a better fit
with test results. This can also provide more insight in the smaller effects that are present in the test
sample, like deboning of FRP from masonry. Also improvements can be made for the test setup and
how the samples are tested. Experimental material tests have supported this project with critical
information like the pull-out tests performed by the TU/e. Experimental material tests could also be
done on the EB FRP layer to get better information and knowledge about the mechanical behaviour
of this layer. Below some recommendations could be listed that are interesting for future research:
Research into the adhesion and debonding of the NSM FRP strip adhesive and the EB FRP
layer to the masonry. Improper adhesion or debonding could reduce the mechanical
properties of the reinforced masonry significantly.
Use separate layers for the EB FRP layer. Using embedded grid reinforcement elements for
mesh type materials appears to work properly.
Improve masonry behaviour of the model by improving non-linear behaviour of the masonry
when compression loaded and implement more extensive shear effects in the mortar
interfaces.
It is desirable to test masonry in vertical position with an applied normal force to the sample
to get more realistic loading conditions. Also URM could be tested properly in this position
which can then be used to compare results with Quake-Shield reinforced masonry.
Gain more information about the used masonry for the Quake-Shield reinforced masonry
samples by performing small scale material tests. Like for example a compression test.
The amount of displacement or drift is limited for an OP loaded masonry wall. On the small
scale masonry wall used in this project this limit cannot be determined. Vertical loaded full
size Quake-Shield reinforced masonry wall tests and correlating FEM models are able to
determine this drift limit.
Use static-cyclic or dynamic time dependent FEM analysis to introduce more realistic
earthquake loading into the model. Hysteresis graphs give a better view of how much energy

101
is absorbed and dissipated by the reinforced masonry. The ideal initial stiffness can only be
determined when dynamic loading is used due to factors like natural frequency of the
reinforced masonry.
Improve the three point bend test setup with displacement measuring that automatically
logs test data and measure directly the displacement for example with a laser displacement
meter.
Extent measuring and loading range so samples can be tested till complete failure. Same
accounts for the pull-out tests.
Improve supports by reducing the chance of indenting the supports or incorporate this in the
model to eliminate this effect.
Place all test samples exactly in the same position in the test setup.
Use and computer controlled hydraulic pump to apply the load more gradually.
For optimization of the Quake-Shield geometry, like strip spacing, use a 2D model of a full
size masonry wall that could be scaled up to a house or building.
More research on alternative FRP materials for future improvement and more environmental
friendly masonry reinforcing solutions.

102
Bibliography
[1] “RTV Noord - Aardbevingsbestendig behang' is voor het eerst toegepast,” RTV Noord, 2016. [Online].
Available: http://www.rtvnoord.nl/nieuws/159175/Aardbevingsbestendig-behang-is-voor-het-eerst-
toegepast. [Accessed 2016].
[2] B. Dost, D. Kraaijpoel, T. v. Eck and M. Caccavale, “Seismicity induced due to gas production: Groningen
Seismic Hazard Analysis,” Bilt, 2015.
[3] “KNMI,” [Online]. Available: http://www.nlog.nl/nl/reserves/Groningen_clip_image006.png. [Accessed
August 2015].
[4] “KNMI,” [Online]. Available: http://www.knmi.nl/cms/viewimage.jsp?number=23031. [Accessed 2015].
[5] “Nederlandse praktijkrichtlijn (NPR 9998),” February 2015.
[6] “RTVNoord - Minister Kamp bezoekt Jarino-woningen,” [Online]. Available:
http://www.rtvnoord.nl/artikel/artikel.asp?p=148019. [Accessed 19 June 2015].
[7] Arup, “Arup Project Title: Groningen 2013: Implementation Study,” Arup, nov 2013.
[8] B. v. d. Broek and S. Wijte, “Analyse resultaten metselwerkproeven Oosterhof Holman (dossier 9032)
[PRIVATE CONVERSATION],” Adviesbureau Hageman B.V., Rijswijk, 2015.
[9] C. Konthesingha Muhandiramlage, “Earthquake Protection of Masonry Shear Walls Using Fibre Reinforced
Polymer Strengthening,” Newcastle, Australia, October 2012.
[10] A. Coburn, “Death Tolls in Earthquakes”.
[11] T. Inglesby, “Mixing Mortar for Properties — The Prescription Mortar Method,” [Online]. Available:
http://www.masonrymagazine.com/9-02/mixing.html. [Accessed 18 june 2015].
[12] M. A. ElGawady, P. Lestuzzi and a. M. Badoux, “Static Cyclic Response of Masonry Walls Retrofitted with
Fiber-Reinforced Polymers,” 2007.
[13] J. G. Tumialan, N. Galati and A. Nanni, “FRP Strengthening of URM Walls Subject to Out-of-Plane Loads,”
Missouri–Rolla.
[14] C. W. Dolan and J. M. Gilstrap, “Out-of-plane bending of FRP-reinforced masonry walls,” Laramie, USA,
1998.
[15] J. G. Rots, R. v. d. Pluijm, A. Vermeltfoort and H. Janssen, “Structural Masonry – An Experimental/Numerical
Basis for Practical Design Rules.,” Balkema, Rotterdam, The Netherlands, 1997.
[16] M. C. Griffith, J. Kashyap and M. M. Ali, “Flexural displacement response of NSM FRP retrofitted masonry
walls,” Adelaide, Australia, 2012.
[17] C. Willis, Q. Yang, R. Seracino and M. Griffith, “Damaged masonry walls in two-way bending retrofitted with
vertical FRP strips,” Construction and Building Materials, vol. 23, 2007.
[18] D. Dizhur et al., “Out-of-plane strengthening of unreinforced masonry walls using near surface mounted
fibre reinforced polymer strips,” Engineering Structures, pp. 330-343, 2014.
[19] “Eurocodes - EN 1998: Design of structures for earthquake resistance,” [Online]. Available:
http://eurocodes.jrc.ec.europa.eu/showpage.php?id=138. [Accessed 18 june 2015].
[20] R. Steenbergen, “Dynamica en Aardbevingen - TNO - NEN training Ontwerpen Gebouwen op
Aardbevingen,” Groningen, 2015.
[21] F. L. Mantia and M. Morreale, “Green composites: A brief review,” Italy, 2011.

103
[22] H. Patil, “Introduction to Fracture Mechanics,” [Online]. Available:
http://www.slideshare.net/HarshalPatil7/introduction-to-fracture-mechanics. [Accessed July 2015].
[23] T. Zimmermann, A. Strauss and B. Konrad, “Energy dissipation and stiffness identification of unreinforced
masonry,” Florianópolis – Brazil, 2012.
[24] R. B. Petersen, “In-plane Shear Behaviour of Unreinforced Masonry Panels Strengthened with Fibre
Reinforced Polymer Strips,” Newcastle, Australia, oct, 2009.
[25] “elitemodels,” [Online]. Available:
http://www.elitemodelsonline.co.uk/images/products/Materials/Carbon/~RelatedImageGallery/~LightBox-
Batten.jpg . [Accessed june 2015].
[26] D. Dizhur, M. Griffith and J. Ingham, “Pullout strength of NSM CFRP strips bonded to vintage clay brick
masonry,” Engineering Structures, no. 69 (2014), 2014.
[27] J. Poulis, “Adhesive Bonding AE4 ASM107 TU Delft,” Delft, 2015.
[28] C. Willis, Q. Yanga, R. Seracino and M. Griffith, “Bond behaviour of FRP-to-clay brick masonry joints,” 2009.
[29] T. Stratford, G. Pascale, O. Manfroni and B. Bonfiglioli, “Shear Strengthening Masonry Panels with Sheet
Glass-Fiber Reinforced Polymer,” 2004.
[30] “NEN-EN 1052-2 Methods of test for masonry - Part 2: Determination of flexural strength,” Nederlands
Normalisatie-instituut, Delft, maart 2016.
[31] R. B. Petersen, M. J. Masia and R. Seracino, “Bond Behavior of Near-Surface Mounted FRP Strips Bonded to
Modern Clay Brick Masonry Prisms: Influence of Strip Orientation and Compression Perpendicular to the
Strip,” June 2009.
[32] M. d. Boer, “Ontwerpen van gebouwen onder aardbevingsbelasting,” NEN, Groningen, 20 april 2015.
[33] P. Lourenço, “proefschrift: Computational Strategies for Masonry Structures,” Delft, 1996.
[34] J. Manie, “Concrete and Masonry Analysis User’s Manual release 9.6,” TNO Diana, Delft, 2014.
[35] G.Godevenos, “Preliminary analyses on strengthened masonry [PRIVATE CONVERSATION],” TU Delft, Delft,
2015.
[36] H. Köksal, O. Jafarov, B. Doran and C. Karakoç, “Modeling of the Shear Behavior of Unreinforced and
Strengthened Masonry Walls,” Turkey, 2012.
[37] L. Macorini and B. Izzuddin, “A Nonlinear Interface Element for 3D Mesoscale Analysis of Brick-Masonry
Structures,” London, 2010.
[38] J. Manie and W. P. Kikstra, “Diana User's manual Material Library release 9.6,” TNO Diana, Delft, 2014.
[39] “IHS Engineering 360,” [Online]. Available: Source: http://cr4.globalspec.com/thread/20315. [Accessed
June 2015].
[40] J. G. Rots, “Smeared and discrete representations of localized fracture,” Delft University of Technology,
Faculty of Civil Engineering, 1990.
[41] “Performance Composites - Mechanical Properties of Carbon Fibre Composite Materials,” Performance
Composites LTD, [Online]. Available: http://www.performance-
composites.com/carbonfibre/mechanicalproperties_2.asp. [Accessed sept 2015].
[42] A. V. Amirkhiz et al., “Constitutive Modeling and Experiments on Polyurea,” San Diego.
[43] Quake-Shield, “youtube - Metselwerk versterkt met Quake-Shield Poly,” Quake-Shield, [Online]. Available:
https://www.youtube.com/watch?v=PEFmqgrtfzw. [Accessed 2015].

104
[44] J. Manie and W. P. Kikstra, “DIANA – Finite Element Analysis User’s Manual release 9.6 Element Library,”
Delft, 2014.
[45] B. d. Vries, “Samenvatting Schaduwproeven,” Eindhoven (TUE), 2016.
[46] A. T. Vermeltfoort, “Uittrekproeven op koolstof strips in gleuven metselwerk,” Eindhoven (TUE), 2015.
[47] W. D. Callister, Materials science and engineering an introduction, John Wiley & Sons, inc., 2007.
[48] C. Roland, J. Twigg, Y. Vu and P. Mott, “High strain rate mechanical behavior of polyurea,” Washinton DC,
US, 2006.
[49] T. Triantafillou et.al., “Externally bonded FRP reinforcement for RC structures,” fib, July 2001.
[50] “Technische gegevens CFK-lamellen van S&P,” S&P, Aalsmeer.
[51] S&P, “S&P Armo-crete w(4),” Aalsmeer.
[52] “S&P ARMO-System FRCM Design Guidelines fiber reinforced cementitious matrix,” 2013.

105
Appendix A
OP three point bend test masonry prism model
The model described in this Appendix is based on a research by Dmytro Dizhur, et al. [18]. The results
from this research can be used to check if the FEM model produces satisfying results to be used for
the Quake-Shield reinforced masonry FEM model. If this is the case than the EB FRP layer can be
added to the model and eventually scaling up the model to the sample size of the OP bend test of
Quake-Shield reinforced masonry (described in Chapter 3).
Figure A - 1: Three point bend test on a reinforced masonry prism [18]
The model consists out of a prism of 10 bricks reinforced with a NSM CFRP strip is OP loaded with a
three point bend test (Figure A - 1). The bricks are twenty-node isoparametric solid elements (CHX60)
with isotropic linear elastic properties and a default 3×3×3 Gauss integration scheme [44]. The
mortar joints are zero-thickness interface elements (CQ48I) with a default 3x3 Newton-cotes
integration scheme. Cracking of the mortar layer in the mid-plane of the prism is most likely.
Therefore only this mortar interface has non-linear behaviour modelled with the CCSC material
model [38]. The other mortar interfaces are modelled with linear elastic material properties. For the
models that are OP loaded the extra interface at the mid-plane of the brick unit to simulate a
potential crack as recommended in literature is not included [15] [24]. This is done because crack
forming in OP loaded masonry is likely to take place in the bed joints and not in the length direction
of the masonry sample. This is also based on observations during the Quake-Shield OP tests. The
NSM CFRP strip is modelled using 1D embedded reinforcement (beam) elements (CL18B) with
isotropic material properties, bond-slip behaviour and a default 2-point Gauss integration scheme.
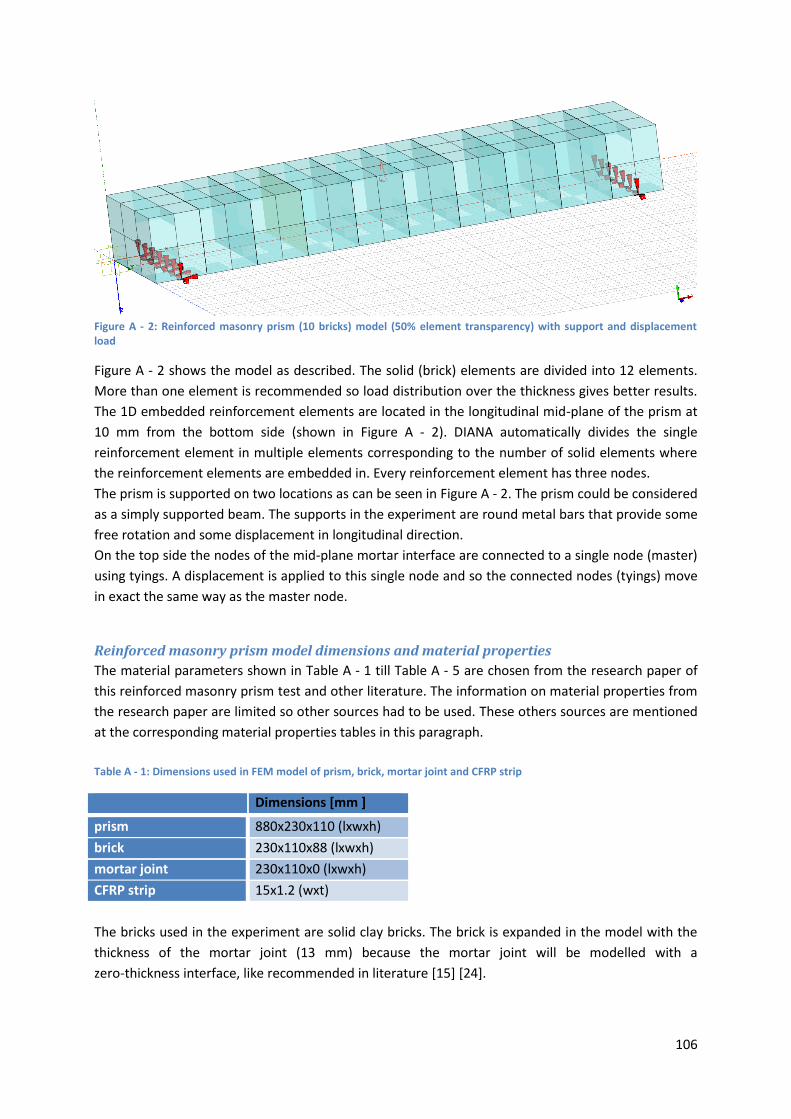
106
Figure A - 2: Reinforced masonry prism (10 bricks) model (50% element transparency) with support and displacement load
Figure A - 2 shows the model as described. The solid (brick) elements are divided into 12 elements.
More than one element is recommended so load distribution over the thickness gives better results.
The 1D embedded reinforcement elements are located in the longitudinal mid-plane of the prism at
10 mm from the bottom side (shown in Figure A - 2). DIANA automatically divides the single
reinforcement element in multiple elements corresponding to the number of solid elements where
the reinforcement elements are embedded in. Every reinforcement element has three nodes.
The prism is supported on two locations as can be seen in Figure A - 2. The prism could be considered
as a simply supported beam. The supports in the experiment are round metal bars that provide some
free rotation and some displacement in longitudinal direction.
On the top side the nodes of the mid-plane mortar interface are connected to a single node (master)
using tyings. A displacement is applied to this single node and so the connected nodes (tyings) move
in exact the same way as the master node.
Reinforced masonry prism model dimensions and material properties
The material parameters shown in Table A - 1 till Table A - 5 are chosen from the research paper of
this reinforced masonry prism test and other literature. The information on material properties from
the research paper are limited so other sources had to be used. These others sources are mentioned
at the corresponding material properties tables in this paragraph.
Table A - 1: Dimensions used in FEM model of prism, brick, mortar joint and CFRP strip
Dimensions [mm ]
prism 880x230x110 (lxwxh)
brick 230x110x88 (lxwxh)
mortar joint 230x110x0 (lxwxh)
CFRP strip 15x1.2 (wxt)
The bricks used in the experiment are solid clay bricks. The brick is expanded in the model with the
thickness of the mortar joint (13 mm) because the mortar joint will be modelled with a
zero-thickness interface, like recommended in literature [15] [24].

107
Table A - 2: Material properties of brick [15]
Material properties of:
Young’s modulus
(E-modulus)
Poisson’s ratio
Density
Brick (solid) 6050 MPa 0,2 1880 kg/m3
Brick material properties are taken from the book Structural Masonry [15]. In this book the clay brick
units with these properties are called Vijf Eiken (VE) and are likely to be similar to the bricks used in
the research but the VE bricks in the Structural Masonry book have more FEM relevant material
properties available. So these material properties are used for this model.
Table A - 3: Material properties of mortar (non-linear, CCSC material model) [23]. Values marked with * are not original values from Petersen research anymore.
Material properties of:
Normal stiffness modulus (Kn)
Shear stiffness modulus (Kt)
Cohesion (C) Internal friction angle
Mortar non-linear (interface)
*82 N/mm3 *36 N/mm3 1 MPa 420
Dilatancy angle Residual friction angle
Confining normal stress
degradation coefficient
350 420 -1.8 MPa 2,2
Tensile strength (ft) Fracture energy mode-I (Gf I)
Fracture energy mode-I (Gf I) factor (a)
Fracture energy mode-I (Gf I)
factor (b)
*1,1 MPa 0,012 N/mm 0 mm 0,34 N/mm
Compression strength (fc)
Shear traction contribution (Cs)
Compressive fracture
energy (Gfc)
Peak Equiv. plastic relative
disp. (kp)
32 MPa 9 25 N/mm 0,024 mm
Most of the parameters of the CCSC material model cannot be found in the paper of the research
where this model is based on. Therefore the Structural Masonry book and a research by Petersen are
used [15] [24]. The parameter values for the CCSC material model from the book and the research of
Petersen could be considered as reference values and some are changed during calibration of the
model as indicated in Table A - 3.

108
Kn and Kt values are also used for the zero-thickness interfaces in the FEM model that represent the
mortar joints in masonry. Equation ( 5 ) and ( 6 ) can be used to determine the Kn and Kt values for
the zero-thickness interface for the mortar joints [15].
𝑘𝑛 =
𝐸𝑢𝑛𝑖𝑡𝐸𝑗𝑜𝑖𝑛𝑡
ℎ𝑗𝑜𝑖𝑛𝑡(𝐸𝑢𝑛𝑖𝑡 − 𝐸𝑗𝑜𝑖𝑛𝑡)
( 5 )
𝑘𝑡 =
𝐺𝑢𝑛𝑖𝑡𝐺𝑗𝑜𝑖𝑛𝑡
ℎ𝑗𝑜𝑖𝑛𝑡(𝐺𝑢𝑛𝑖𝑡 − 𝐺𝑗𝑜𝑖𝑛𝑡)
( 6 )
Kn = Normal stiffness modulus
Kt = Shear stiffness modulus
Eunit = E-modulus of brick
Ejoint = E-modulus of mortar
Gunit = Shear modulus of brick
Gjoint = Shear modulus of mortar
hjoint = Height of mortar joint
In this case the shear modulus G can be calculated from the E-modulus and the Poisson ratio
(Equation ( 7 )). The same Equation applies for the joint in which case the material parameters of the
unit is substituted with the material parameters of the joint.
𝐺𝑢𝑛𝑖𝑡 =
𝐸𝑢𝑛𝑖𝑡
2(1 + 𝜈𝑢𝑛𝑖𝑡)
( 7 )
νunit = Poisson ratio of brick
Eunit = E-modulus of brick
Gunit = Shear modulus of brick
The Kt value is the relation between the shear traction and the shear relative displacement [38]. The
dimension of the Kt (and also Kn) value is N/mm3 which means it is a force per area per length (stress
per length).
Table A - 4: Material properties of mortar (linear) [15]
Material properties of:
Normal stiffness modulus (Kn)
Shear stiffness modulus (Kt)
Mortar linear (interface)
82 N/mm3 36 N/mm3
*Same value taken for Kn and Kt as in the Mortar non-linear (interface) (Table A - 3).

109
Table A - 5: Material properties of NSM CFRP strip (Beam + bond-slip interface) [41] [38]
Material properties of:
Young’s modulus
(E-modulus)
Poisson’s ratio Density Bond-slip function
NSM CFRP strip (Beam+bond-slip interface)
165000 MPa 0,3 1600 kg/m3 1
Normal stiffness
modulus (Kn)
Shear stiffness modulus (Kt)
Parameter C of bond-slip
function
Shear slip at max shear
traction
1000 N/mm3 10 N/mm3 1,1 MPa 0,06 mm
The Young’s modulus of the CFRP is from the research paper. The Poisson’s ratio and density are
general values for unidirectional carbon Fibre composites [41]. Parameter C and shear slip at max
shear traction define the Cubic bond-slip function (Figure A - 3) which is activated with number 1 for
the bond-slip function [38]. In the materials library manual of DIANA it is recommended to choose
parameter C equal to the tensile strength of the mortar (ft) which is 1,1 MPa. And take for the shear
slip at max shear traction 0,06 mm.
Figure A - 3: Cubic bond-slip function for reinforcement elements [38]

110
Results for the reinforced masonry prism model
The research paper contains a force-displacement curve of the three point bending test which will
act as a reference to model the same reinforced masonry behaviour as is shown by the force-
displacement curve (Figure A - 4).
Figure A - 4: Force-displacement curve of the three point bend test [18].
For this model the focus is only on the monotonic loading curve in Figure A - 4. From the curve origin
to about 0,5 mm mid-plane displacement (3 kN) the curve shows a linear trend indicating the
masonry is in the elastic zone and no major cracks have formed (assumed uncracked state). From this
point till the peak load, non-linear behaviour is visible (parabolic like curve development) and likely
cracks are forming in the masonry. Usually the assumption is made that the NSM CFRP strip is only
loaded when cracks start to initiate.
The NSM CFRP strip provides more ductile behaviour of the reinforced masonry and extents the
non-linear part of the curve until peak load is reached. At peak load it is likely that the adhesive
reaches its ultimate shear strength and the strip starts to debond from the masonry losing overall
stiffness and strength. Or the masonry is severely damaged in the compressive zone due to
exceeding ultimate compressive strength of the masonry, so the overall structure loses its stiffness
and strength. When comparing the model results with the experimental results, focus is only on the
simulation of the behaviour and the force-displacement values due to the large variation in masonry
and limited material properties available in the research paper.
Figure A - 6 shows results of two FEM models compared to the test results from paper of Dmytro
Dizhur, et al. [18]. Beam bend test model v1 is as described in this Appendix (Figure A - 2 &
Figure A - 5). This model showed non-linear behaviour and bond-slip of the embedded reinforcement
elements. After a large crack had developed in the mid-plane mortar interface a lot of convergence
problems occurred in the model calculations. Beam bend test model v2 is the same model with two
model alteration. The mesh is refined (two time increase of elements in all directions) and the
non-linear CCSC material at the mid-plane mortar interface is also used for all the other mortar

111
interfaces instead of using linear mortar interfaces so cracks could form at multiple mortar
interfaces.
The model is able to keep analysing after non-convergence steps although still a lot of non-
convergence steps were still present in the model result (Figure A - 6).
Figure A - 5: Beam bend test model v1
Figure A - 6: Force-displacement curves of Beam bend test model v1 & v2 compared with test results from paper of Dmytro Dizhur, et al. [18]
The problems occurring with these two models are likely to take place because of using embedded
reinforcement elements with bond-slip behaviour. The bond-slip function will add interface elements
around the reinforcement element to provide slip behaviour. The intersection between these
interface elements with the mortar interface elements gives problems (Figure A - 7). After this
finding the FEM model based on the Quake-Shield OP bend test does not have reinforcement
elements for the NSM CFRP strips but is modelled discrete with shell elements for the NSM CFRP
strip and interface elements for the adhesive. Details about this model are described in Chapter 4.
0
2000
4000
6000
8000
10000
12000
14000
16000
18000
20000
0 2 4 6 8 10
Forc
e [
N]
Displacement [mm]
test results from paper
Beam bend test model v1
Beam bend test model v2

112
Figure A - 7: Reinforcement element intersecting a mortar interface element

113
Appendix B
Reduced .DAT file of FEM Base model. Node and element numbers are removed to reduce the
number of lines of the file (indicated by dotted lines).
: Diana Datafile written by Diana 9.6
Translated from FX+ for DIANA neutral file (version 1.2.0).
'UNITS'
LENGTH MM
FORCE N
TEMPER CELSIU
'DIRECTIONS'
1 1.00000E+00 0.00000E+00 0.00000E+00
2 0.00000E+00 1.00000E+00 0.00000E+00
3 0.00000E+00 0.00000E+00 1.00000E+00
'MODEL'
GRAVDI 3
GRAVAC -9.81000E+03
'COORDINATES'
20706 2.21827E-13 7.49884E+00 1.50625E+02
……………………
44445 3.43750E+02 -3.48253E-03 2.78125E+02
'MATERI'
1 NAME "brick"
MCNAME CONCR
MATMDL TSCR
ASPECT
POISON 8.00000E-02
YOUNG 7.88600E+03
DENSIT 1.78600E-06
TOTCRK ROTATE
TENCRV ELASTI
COMCRV PARABO
CNFCRV NONE
COMSTR 1.00000E+01
GC 1.90000E+01
2 NAME "adhesive"
MCNAME INTERF
MATMDL NONLIF
ASPECT
DSTIF 1.00000E+03 3.45000E-01
SIGDIS -1.00000E+03 -1.00000E+03 -1.00000E+03 -1.00000E+00
0.00000E+00 0.00000E+00 1.00000E+03 1.00000E+00
1.00000E+03 1.00000E+03
TAUDIS -4.00000E-01 -1.00000E+03 -4.00000E-01 -1.60000E+01

114
-8.70000E-01 -9.00000E+00 -1.59000E+00 -7.00000E+00
-1.74000E+00 -6.50000E+00 -1.77000E+00 -6.00000E+00
-1.75000E+00 -5.50000E+00 -1.68000E+00 -5.00000E+00
-1.38000E+00 -4.00000E+00 0.00000E+00 0.00000E+00
1.38000E+00 4.00000E+00 1.68000E+00 5.00000E+00
1.75000E+00 5.50000E+00 1.77000E+00 6.00000E+00
1.74000E+00 6.50000E+00 1.59000E+00 7.00000E+00
8.70000E-01 9.00000E+00 4.00000E-01 1.60000E+01
4.00000E-01 1.00000E+03
3 NAME "mortar"
MCNAME INTERF
MATMDL DISCRA
ASPECT
DSTIF 3.50000E+01 1.60000E+01
DCRVAL 6.00000E-01
DISCRA 1
MODE1 2
MO1VAL 1.70000E-02
MODE2 0
UNLO1 1
4 NAME CFRP
YOUNG 1.65000E+05
POISON 3.00000E-01
DENSIT 1.60000E-06
5 NAME "poly_int"
DSTIF 1.00000E+06 1.00000E+06
6 NAME "PU_shell"
MCNAME MCSTEL
MATMDL TRESCA
ASPECT
POISON 4.86000E-01
YOUNG 2.10000E+01
DENSIT 1.00000E-06
TRESSH NONE
YIELD VMISES
YLDVAL 4.00000E+00
7 NAME "brick2"
MCNAME CONCR
MATMDL TSCR
ASPECT
POISON 8.00000E-02
YOUNG 7.88600E+03
DENSIT 1.78600E-06
TOTCRK ROTATE
TENCRV ELASTI

115
COMCRV PARABO
CNFCRV NONE
COMSTR 1.00000E+01
GC 2.30000E+01
'GEOMET'
1 NAME "mortar"
2 NAME "adhesive"
XAXIS 1.00000E+00 0.00000E+00 0.00000E+00
3 NAME "poly_int"
XAXIS 0.00000E+00 0.00000E+00 1.00000E+00
4 NAME "PU_shell"
THICK 1.00000E+01
5 NAME "frp"
THICK 2.50000E+00
6 NAME "brick"
'DATA'
1 NAME "brick"
8 NAME "brick2"
5 NAME "PU_shell"
7 NAME "frp"
2 NAME "adhesive"
3 NAME "mortar"
4 NAME "poly_int"
'ELEMENTS'
SET "brick"
CONNECT
CHX60 …………………….
MATERIAL 1
GEOMETRY 6
DATA 1
SET "mortar"
CONNECT
CQ48I………………………
MATERIAL 3
GEOMETRY 1
DATA 3
SET "adhesive"
CONNECT
CQ48I…………………….
MATERIAL 2
GEOMETRY 2
DATA 2
SET "PU int"
CONNECT
CQ48I……………………

116
MATERIAL 5
GEOMETRY 3
DATA 4
SET PU
CONNECT
CQ40S……………………………
MATERIAL 6
GEOMETRY 4
DATA 5
SET FRP
CONNECT
CQ40S……………………………
MATERIAL 4
GEOMETRY 5
DATA 7
SET "brick2"
CONNECT
CHX60 ………………………….
MATERIAL 7
GEOMETRY 6
DATA 8
SET "Element set 7"
CONNECT
CQ48I…………………………
MATERIAL 3
GEOMETRY 1
DATA 3
SET "Element set 8"
CONNECT
CQ48I…………………………..
MATERIAL 5
GEOMETRY 3
DATA 4
SET "Element set 9"
CONNECT
CQ40S……………………………
MATERIAL 6
GEOMETRY 4
DATA 5
SET "Element set 10"
CONNECT
CQ48I……………………………
MATERIAL 3
GEOMETRY 1
DATA 3
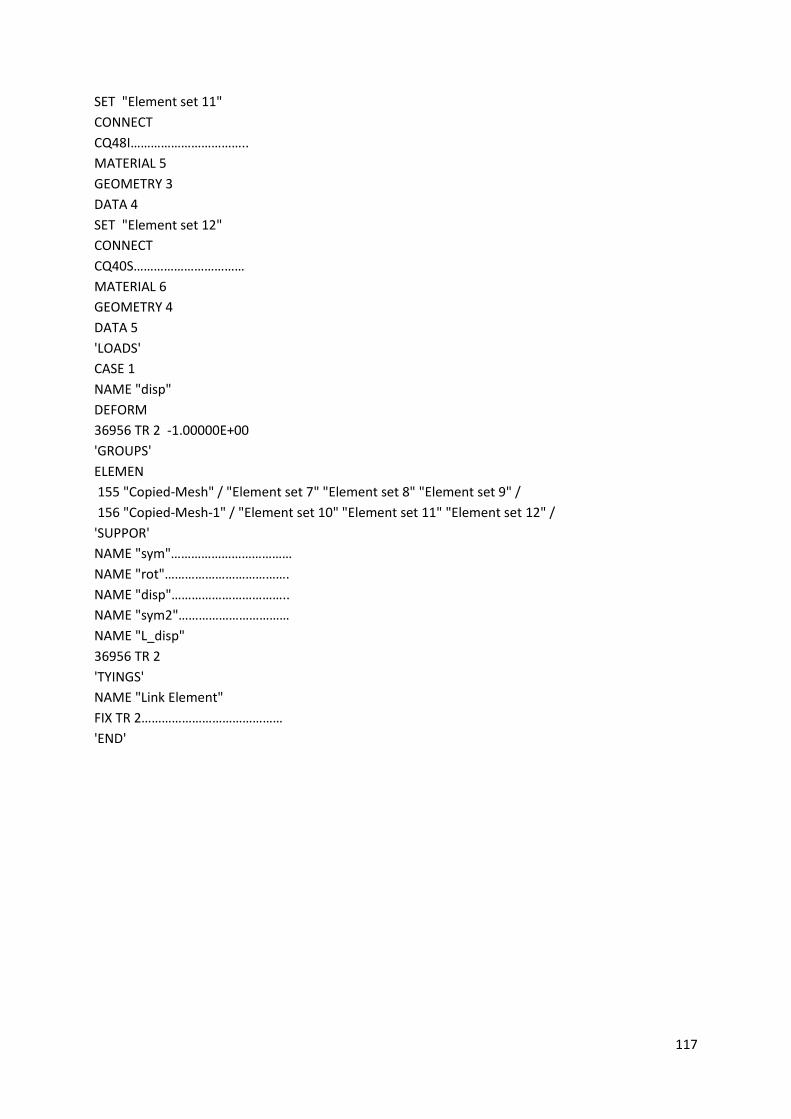
117
SET "Element set 11"
CONNECT
CQ48I……………………………..
MATERIAL 5
GEOMETRY 3
DATA 4
SET "Element set 12"
CONNECT
CQ40S……………………………
MATERIAL 6
GEOMETRY 4
DATA 5
'LOADS'
CASE 1
NAME "disp"
DEFORM
36956 TR 2 -1.00000E+00
'GROUPS'
ELEMEN
155 "Copied-Mesh" / "Element set 7" "Element set 8" "Element set 9" /
156 "Copied-Mesh-1" / "Element set 10" "Element set 11" "Element set 12" /
'SUPPOR'
NAME "sym"………………………………
NAME "rot"……………………………….
NAME "disp"……………………………..
NAME "sym2"……………………………
NAME "L_disp"
36956 TR 2
'TYINGS'
NAME "Link Element"
FIX TR 2……………………………………
'END'