Combined Three Mechanisms Models for Membrane Fouling ...H. Koonani and M. Amirinejad / Journal of...
9
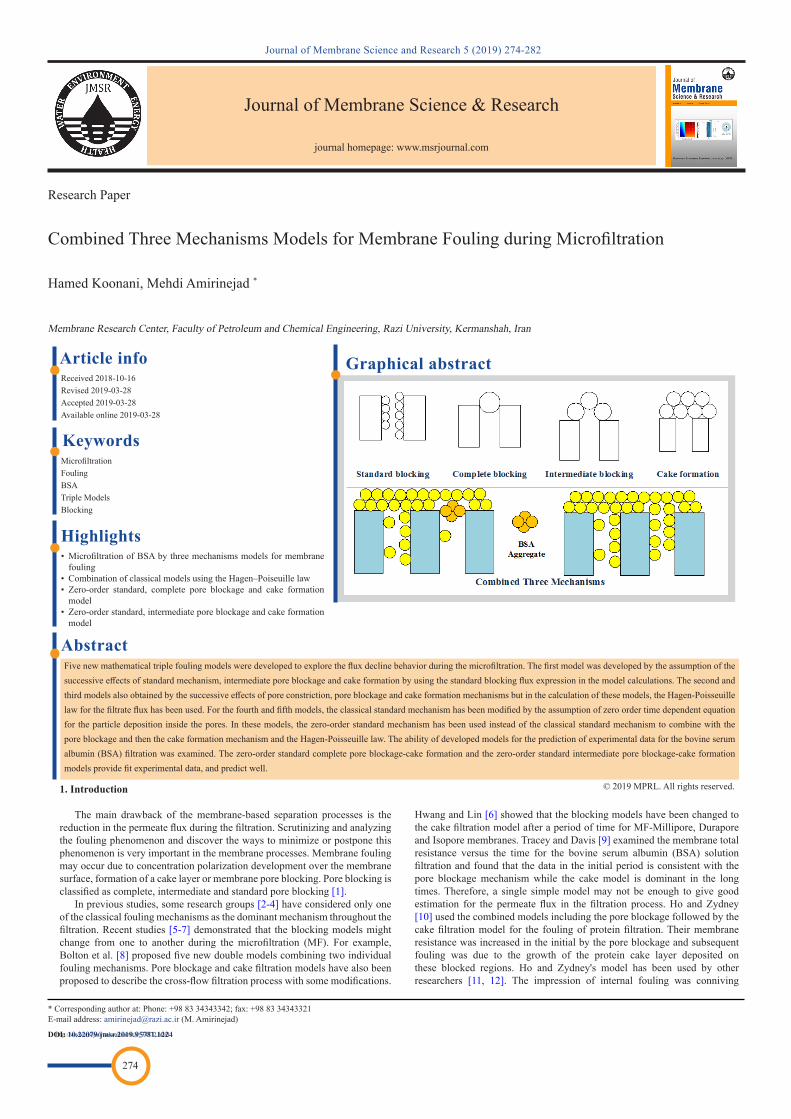
Keywords Highlights Abstract Graphical abstract 274 Research Paper Received 2018-10-16 Revised 2019-03-28 Accepted 2019-03-28 Available online 2019-03-28 Microfiltration Fouling BSA Triple Models Blocking • Microfiltration of BSA by three mechanisms models for membrane fouling • Combination of classical models using the Hagen–Poiseuille law • Zero-order standard, complete pore blockage and cake formation model • Zero-order standard, intermediate pore blockage and cake formation model Journal of Membrane Science and Research 5 (2019) 274-282 Combined Three Mechanisms Models for Membrane Fouling during Microfiltration Membrane Research Center, Faculty of Petroleum and Chemical Engineering, Razi University, Kermanshah, Iran Hamed Koonani, Mehdi Amirinejad * Article info © 2019 MPRL. All rights reserved. * Corresponding author at: Phone: +98 83 34343342; fax: +98 83 34343321 E-mail address: [email protected] (M. Amirinejad) DOI: 10.22079/jmsr.2019.95781.1224 1. Introduction The main drawback of the membrane-based separation processes is the reduction in the permeate flux during the filtration. Scrutinizing and analyzing the fouling phenomenon and discover the ways to minimize or postpone this phenomenon is very important in the membrane processes. Membrane fouling may occur due to concentration polarization development over the membrane surface, formation of a cake layer or membrane pore blocking. Pore blocking is classified as complete, intermediate and standard pore blocking [1]. In previous studies, some research groups [2-4] have considered only one of the classical fouling mechanisms as the dominant mechanism throughout the filtration. Recent studies [5-7] demonstrated that the blocking models might change from one to another during the microfiltration (MF). For example, Bolton et al. [8] proposed five new double models combining two individual fouling mechanisms. Pore blockage and cake filtration models have also been proposed to describe the cross-flow filtration process with some modifications. Hwang and Lin [6] showed that the blocking models have been changed to the cake filtration model after a period of time for MF-Millipore, Durapore and Isopore membranes. Tracey and Davis [9] examined the membrane total resistance versus the time for the bovine serum albumin (BSA) solution filtration and found that the data in the initial period is consistent with the pore blockage mechanism while the cake model is dominant in the long times. Therefore, a single simple model may not be enough to give good estimation for the permeate flux in the filtration process. Ho and Zydney [10] used the combined models including the pore blockage followed by the cake filtration model for the fouling of protein filtration. Their membrane resistance was increased in the initial by the pore blockage and subsequent fouling was due to the growth of the protein cake layer deposited on these blocked regions. Ho and Zydney's model has been used by other researchers [11, 12]. The impression of internal fouling was conniving Journal of Membrane Science & Research journal homepage: www.msrjournal.com Five new mathematical triple fouling models were developed to explore the flux decline behavior during the microfiltration. The first model was developed by the assumption of the successive effects of standard mechanism, intermediate pore blockage and cake formation by using the standard blocking flux expression in the model calculations. The second and third models also obtained by the successive effects of pore constriction, pore blockage and cake formation mechanisms but in the calculation of these models, the Hagen-Poisseuille law for the filtrate flux has been used. For the fourth and fifth models, the classical standard mechanism has been modified by the assumption of zero order time dependent equation for the particle deposition inside the pores. In these models, the zero-order standard mechanism has been used instead of the classical standard mechanism to combine with the pore blockage and then the cake formation mechanism and the Hagen-Poisseuille law. The ability of developed models for the prediction of experimental data for the bovine serum albumin (BSA) filtration was examined. The zero-order standard complete pore blockage-cake formation and the zero-order standard intermediate pore blockage-cake formation models provide fit experimental data, and predict well. http://www.msrjournal.com/article_34772.html
Transcript of Combined Three Mechanisms Models for Membrane Fouling ...H. Koonani and M. Amirinejad / Journal of...
Keywords
Highlights
Abstract
Graphical abstract
274
Research Paper
Received 2018-10-16Revised 2019-03-28Accepted 2019-03-28Available online 2019-03-28
MicrofiltrationFoulingBSATriple ModelsBlocking
• Microfiltration of BSA by three mechanisms models for membrane fouling
• Combination of classical models using the Hagen–Poiseuille law• Zero-order standard, complete pore blockage and cake formation
model • Zero-order standard, intermediate pore blockage and cake formation
model
Journal of Membrane Science and Research 5 (2019) 274-282
Combined Three Mechanisms Models for Membrane Fouling during Microfiltration
Membrane Research Center, Faculty of Petroleum and Chemical Engineering, Razi University, Kermanshah, Iran
Hamed Koonani, Mehdi Amirinejad *
Article info
© 2019 MPRL. All rights reserved.
* Corresponding author at: Phone: +98 83 34343342; fax: +98 83 34343321E-mail address: [email protected] (M. Amirinejad)
DOI: 10.22079/jmsr.2019.95781.1224
1. Introduction
The main drawback of the membrane-based separation processes is the reduction in the permeate flux during the filtration. Scrutinizing and analyzing the fouling phenomenon and discover the ways to minimize or postpone this phenomenon is very important in the membrane processes. Membrane fouling may occur due to concentration polarization development over the membrane surface, formation of a cake layer or membrane pore blocking. Pore blocking is classified as complete, intermediate and standard pore blocking [1].
In previous studies, some research groups [2-4] have considered only one of the classical fouling mechanisms as the dominant mechanism throughout the filtration. Recent studies [5-7] demonstrated that the blocking models might change from one to another during the microfiltration (MF). For example, Bolton et al. [8] proposed five new double models combining two individual fouling mechanisms. Pore blockage and cake filtration models have also been proposed to describe the cross-flow filtration process with some modifications.
Hwang and Lin [6] showed that the blocking models have been changed to the cake filtration model after a period of time for MF-Millipore, Durapore and Isopore membranes. Tracey and Davis [9] examined the membrane total resistance versus the time for the bovine serum albumin (BSA) solution filtration and found that the data in the initial period is consistent with the pore blockage mechanism while the cake model is dominant in the long times. Therefore, a single simple model may not be enough to give good estimation for the permeate flux in the filtration process. Ho and Zydney [10] used the combined models including the pore blockage followed by the cake filtration model for the fouling of protein filtration. Their membrane resistance was increased in the initial by the pore blockage and subsequent fouling was due to the growth of the protein cake layer deposited on these blocked regions. Ho and Zydney's model has been used by other researchers [11, 12]. The impression of internal fouling was conniving
Journal of Membrane Science & Research
journal homepage: www.msrjournal.com
Five new mathematical triple fouling models were developed to explore the flux decline behavior during the microfiltration. The first model was developed by the assumption of the successive effects of standard mechanism, intermediate pore blockage and cake formation by using the standard blocking flux expression in the model calculations. The second and third models also obtained by the successive effects of pore constriction, pore blockage and cake formation mechanisms but in the calculation of these models, the Hagen-Poisseuille law for the filtrate flux has been used. For the fourth and fifth models, the classical standard mechanism has been modified by the assumption of zero order time dependent equation for the particle deposition inside the pores. In these models, the zero-order standard mechanism has been used instead of the classical standard mechanism to combine with the pore blockage and then the cake formation mechanism and the Hagen-Poisseuille law. The ability of developed models for the prediction of experimental data for the bovine serum albumin (BSA) filtration was examined. The zero-order standard complete pore blockage-cake formation and the zero-order standard intermediate pore blockage-cake formation models provide fit experimental data, and predict well.
http://www.msrjournal.com/article_34772.html

H. Koonani and M. Amirinejad / Journal of Membrane Science and Research 5 (2019) 274-282
in these combined models.
Internal fouling caused by the protein adsorption in the complicated
membrane structure may be important for the cases which the feed stream has a relatively low concentration of foulant. For example, Taniguchi et al. [12]
reported some irreversible internal fouling models using low molecular
weight species. Cassano et al. [13] observed that the standard pore blocking governed the flux decline at low Reynolds number, while the complete pore
blocking was significant at the higher Reynolds number. Therefore, it is
warranted to develop combined sequential models consisting of internal and external fouling. Orsello et al. [14] proposed triple mechanism models to
describe the flux decline during stirred batch ultrafiltration of protein solution.
Nakamura and Matsumoto [15] investigated the fouling mechanism during the dead-end microfiltration of BSA with porous glass membrane.
They considered the BSA adsorption onto the pore surface of membrane
under the condition of pH 5.0 and ionic strength 0.01. They found that the adsorption rate was proportional to the feed rate of BSA and proportional
coefficient. Bowen et al. [16] studied the flux decline experimentally with the
dead-end microfiltration of BSA solutions (1 and 0.1 kg/m3) through Cyclopore track-etched polycarbonate membranes (pore sizes 0.1, 0.2, 0,4
and 1.0 μm) at pH 5 and with NaC1 0.01 M. Their experimental results are
examined by successive or simultaneous steps of the flux decline. Xiao et al. [17] investigated the combined effect of the used membrane and the foulant
hydrophobicity as well as the surface charge on adsorptive fouling during the
microfiltration. Jacob et al. [18] analyzed the structural modifications associated with the fouling kinetics and dynamical changes on the structure of
four microporous membranes when fouled by permeating a protein aqueous
solution BSA at 1 g/L under 10 kPa in a dead-end device. They obtained the structure after different fouling times by using an extended bubble point
method, and the equilibrium (BSA at both 1 and 10 g/L concentrations) and
dynamical adsorption, along with the equivalent number of layers. Ye et al. [19] carried out a dead end unstirred filtration of sodium alginate (a model of
polysaccharide) and analyzed data using classic filtration laws and the
combined pore blockage and cake formation model. They found that the cake model appears to fit the entire range of the ultrafiltration data while the
consecutive standard pore blocking model and cake model were more
applicable to microfiltration membranes (0.2 μm track-etched and 0.22 μm PVDF membranes). Hou et al. [20] proposed the steady membrane frontal
area (K) to improve the predictive accuracy of cake-complete model for
combined fouling mechanisms of complete blocking and cake filtration. Their results showed that the predictions of the proposed model had good
agreements with experimental data under different conditions for BSA
solution. The larger K value was obtained at higher concentration and lower pressure which represented less fouling caused by the complete blocking.
Recently, the membrane fouling for binary system including protein and
polysaccharides feed has been investigated [21-24]. The related examples are BSA/humic acid, BSA/dextran, BSA/lysozyme and of BSA/pepsin.
The classical models are based on the assumption that the classic
mechanism is only effective mechanism. On the other hand, the interaction of each mechanism has been ignored. For example, internal fouling has been
considered by the assumption that all particles contribute in internal fouling
and then its equation was used to develop combined models of fouling. But in real condition, some portion of particles may contribute to the internal fouling
and some else may supply to the pore blockage or cake filtration. In this study, five triple mechanism models were developed to describe
better the flux decline during BSA solutions filtration in the concentration
range from 1 to 8 g/L. In all of these models, the mechanisms occur sequentially as internal fouling followed by external fouling. For development
of the first model, the standard pore blocking, intermediate pore blocking and
cake filtration were combined according to Orsello et al. [14]. Second and third models also obtained by sequential effects of the pore constriction, pore
blockage and cake formation mechanisms similar to Orsello and co-workers,
but the Hagen-Poisseuille law was considered for calculating these two models. For development of two other models, the classical equations of
internal fouling were modified, and combined with the modified standard
pore blockage mechanism (zero order pore constriction equation) and they then combined with one of the classical pore blockage mechanisms (complete
pore blocking or intermediate pore blocking) and cake formation mechanism.
For validation of the models prediction, microfiltration of BSA was tested and the volumetric flow rate was measured versus the time. For every model, the
some square error (SSE) was measured to evaluate the consistency of the
models with the experimental data.
2. Classical models
The classical models that only consider one mechanism include standard
blocking, complete blocking, intermediate blocking and cake filtration. The
schematic representation for theses classical models is found in Figure 1-a. In
standard blocking, particles enter through the pores and pore constriction is
occurred. In cake filtration, the surface particle deposit is formed. The physical concept of the intermediate blocking is the simultaneous occurrence
of pore blocking and surface deposit. The method for obtaining the relations
for definition of these models can be found in [8]. In summary, the relations for the total filtrate volume per area (V) versus initial filtrate flux of clean
membrane (J0), their constant parameters (Ks, Kb, Ki and Kc) and the time (t)
are as follows:
(1)
(2)
(3)
(4)
Eqs. (1), (2), (3) and (4) show the total filtrate volume for the standard blocking, the complete blocking, the intermediate blocking and the cake
filtration, respectively.
Fig. 1. Schematic representation of (a) classical models, and (b) combined
mechanism models; Left: standard complete cake filtration (SCC); Right: standard
intermediate cake filtration (SIC).
3. Development of combined three mechanisms models
In this study, fouling mechanisms are considered to occur subsequently.
At first, the internal fouling, then the pore blockage and finally, followed by
the cake formation. At the initial filtration, pore constriction is the beginning mechanism until the inside radius of pores constricts and then membrane
pores incline toward blocking due to the particle aggregation until the
formation of the cake layer over the blocked regions of the membrane surface. The schematic diagram of combined three mechanism models are
presented in Figure 1-b. This figure shows two main combined mechanisms
which they are standard intermediate cake filtration (SIC) and standard complete cake filtration (SCC). The difference between SIC and SCC is that
in SCC the particle aggregates blocks some pores while in SIC, particles
enters through the pores and then pore blocking and cake filtration are happened. The five different three mechanisms, their abbreviation and final
relation equations are provided in Table 1.
For development of the first model (SIC), three steps for fouling were assumed which included standard blocking, intermediate pore blockage and
cake formation, respectively. The second and third models (Hagen–Poiseuille
SCC and Hagen–Poiseuille SIC) also obtained by the sequential effect of pore
constriction, pore blockage and cake formation mechanisms but in the basis
of calculation of these models, the Hagen-poisseuille law for the flux was
used. For development of the fourth and fifth models (zero-order SCC and zero-order SIC), the classical standard mechanism was modified by the
assumption of the zero-order time-dependent equation for the particle
275

H. Koonani and M. Amirinejad / Journal of Membrane Science and Research 5 (2019) 274-282
deposition inside the pores.
The modified standard blockage equation was obtained based on the
assumption that portion of the particles deposit inside the pores and the pore radius constricted during the filtration process. According to the obtained
results [15], the zero-order time-dependent equation was utilized for the
particles deposition rate on the internal wall of pores; therefore, a new relation for the standard blocking (internal fouling) could be derived. This modified
standard mechanism (zero-order standard) equation was employed instead of
the classical standard mechanism to combine with the pore blockage and cake formation mechanisms to deliver two new triple mechanism models namely
zero order standard-complete pore blocking-cake formation (zero-order SCC)
model and zero order standard-intermediate pore blocking-cake formation (zero-order SIC) model.
Table 1
Combined three mechanisms models, abbreviations, related equations and their fitted
parameters.
Entry Model Abbreviation Relation Fitted parameters
1 Standard blocking,
intermediate pore
blockage and cake
formation
SIC Eq. 19 α', f', R', Rc0, β
2 Standard blocking,
complete pore
blockage and cake
formation (using the
Hagen–Poiseuille
law)
Hagen–Poiseuille
SCC
Eq. 29 α, f', R', Rc0, αin
3 Standard blocking,
intermediate pore
blockage and cake
formation (using the
Hagen–Poiseuille
law)
Hagen–Poiseuille
SIC
Eq. 30 α', f', R', Rc0, αin
4 Zero order standard
blocking, complete
pore blockage, cake
formation
Zero-order SCC Eq. 36 α, f', R', Rc0, Ks0''
5 Zero order standard
blocking,
intermediate pore
blockage and cake
formation
Zero-order SIC Eq. 37 α', f', R', Rc0, Ks0''
3.1. Standard blocking, intermediate pore blockage and cake formation
The volumetric flow rate through the membrane was assumed to be expressed as the sum of the flow through the unblocked (Qopen) and blocked
pores (Qblocked):
(5)
The governing equation for classical standard mechanism is:
(6)
By integration, the normalized flux equation for the classical standard
mechanism obtained as:
(7)
The classical intermediate pore blockage expression was applied to
obtain the rate of pore blockage:
(8)
This equation (Eq. 8) is the governing equation for the complete pore
blockage mechanism. For accounting the pore constriction effects on the
external pore blockage, Eq. 7 inserted into the Eq. 8 and the area of open
pores versus the time is obtained as:
(9)
Total flow rate through the open pores can be evaluated by combining Eqs. 7 and 9 as:
(10)
The flow rate through the blocked pores (covered area) can be evaluated as:
(11)
where, Rm,in is the sum of membrane and the pore constriction resistances. Rc
is the resistance caused by the cake layer formed on the membrane surface.
Cake layer grows over the time interval tc to t, therefore the pore constriction is affected by:
(12)
The rate of cake formation over each blocked region of the membrane is
assumed to be proportional to the movement of particles in that particular
region:
(13)
(14)
where, mc is the mass of particles deposit per unit area, and f' is the fraction of
particles that contributes to the growth of the deposit, R' is the specific
resistance of the cake layer and Jblocked is the filtrate flux through each region of the membrane:
(15)
The total resistance over each region of the membrane can be obtained by
inserting Jbloched from Eq. 15 in Eq. 14 and then integration:
(16)
where, Rc0 is the initial resistance of the deposit. The open area of the membrane decreases and is proportional to its blocked area of membrane
which increases with the time; therefore, by differentiation of Eq. 9:
(17)
By substitution of Eqs. 16 and 17 into Eq. 11, the volumetric flow rate
through the blocked area is obtained as:
(18)
Finally, the total volumetric flow rate is the summation of volume flow rates
through the open and blocked pores:
276
H. Koonani and M. Amirinejad / Journal of Membrane Science and Research 5 (2019) 274-282
(19)
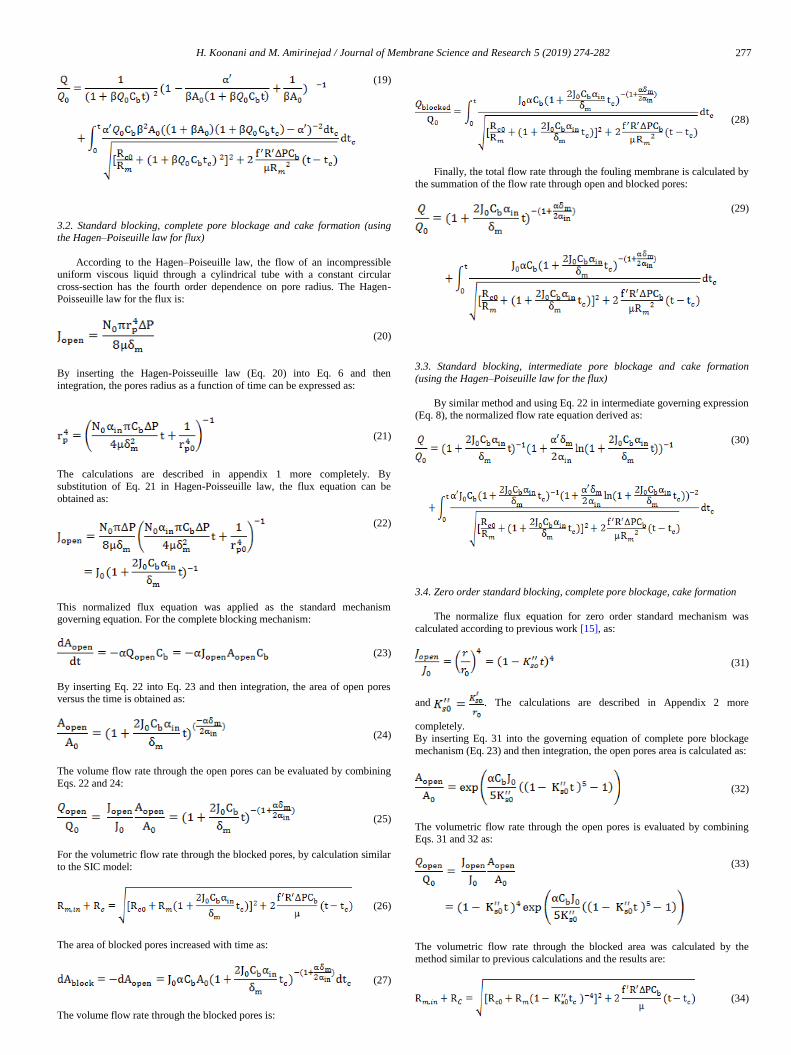
3.2. Standard blocking, complete pore blockage and cake formation (using the Hagen–Poiseuille law for flux)
According to the Hagen–Poiseuille law, the flow of an incompressible uniform viscous liquid through a cylindrical tube with a constant circular
cross-section has the fourth order dependence on pore radius. The Hagen-
Poisseuille law for the flux is:
(20)
By inserting the Hagen-Poisseuille law (Eq. 20) into Eq. 6 and then
integration, the pores radius as a function of time can be expressed as:
(21)
The calculations are described in appendix 1 more completely. By
substitution of Eq. 21 in Hagen-Poisseuille law, the flux equation can be
obtained as:
(22)
This normalized flux equation was applied as the standard mechanism governing equation. For the complete blocking mechanism:
(23)
By inserting Eq. 22 into Eq. 23 and then integration, the area of open pores versus the time is obtained as:
(24)
The volume flow rate through the open pores can be evaluated by combining
Eqs. 22 and 24:
(25)
For the volumetric flow rate through the blocked pores, by calculation similar
to the SIC model:
(26)
The area of blocked pores increased with time as:
(27)
The volume flow rate through the blocked pores is:
(28)
Finally, the total flow rate through the fouling membrane is calculated by
the summation of the flow rate through open and blocked pores:
(29)
3.3. Standard blocking, intermediate pore blockage and cake formation (using the Hagen–Poiseuille law for the flux)
By similar method and using Eq. 22 in intermediate governing expression (Eq. 8), the normalized flow rate equation derived as:
(30)
3.4. Zero order standard blocking, complete pore blockage, cake formation
The normalize flux equation for zero order standard mechanism was
calculated according to previous work [15], as:
(31)
and . The calculations are described in Appendix 2 more
completely.
By inserting Eq. 31 into the governing equation of complete pore blockage
mechanism (Eq. 23) and then integration, the open pores area is calculated as:
(32)
The volumetric flow rate through the open pores is evaluated by combining Eqs. 31 and 32 as:
(33)
The volumetric flow rate through the blocked area was calculated by the
method similar to previous calculations and the results are:
(34)
277

H. Koonani and M. Amirinejad / Journal of Membrane Science and Research 5 (2019) 274-282
The volumetric flow rate through the blocked pores becomes:
(35)
Finally, the total flow rate through the membrane is expressed as:
(36)
3.5. Zero order standard blocking, intermediate pore blockage and cake formation
By similar method and using Eq. 31 in intermediate governing expression (Eq. 8), the normalized flow rate equation is derived as:
(37)
4. Materials and methods
4.1. Materials
BSA solution as filtration liquid was prepared by dissolving the BSA
powder (Merck Millipore) in water. The BSA solutions were filtered through
the 0.2 µm hydrophilic polycarbonate track etched (PCTE) membrane (GTTP02500, Isopore Membrane Filter, Merck Millipore, 25 mm diameter).
The membrane surface area was 4×10⁻⁵ m2.
4.2. Filtration experiments
BSA solutions with concentrations of 1, 2, 4, and 8 g/L were prepared. A
constant transmembrane pressure of 14 kPa was applied for combined three mechanism experiments. The filtrations were performed without stirring. The
volumetric flow rates were measured versus the time and by using a digital
balance (Sartorious Model 1580). The flow rate was measured during the filtration for 2 hours. All experiments were performed at room temperature
(around 20 °C).
For investigation of the classical models, the total filtrate volume (m3) was measured. The BSA solution with the concentration of 2 g/L at 69 kPa
pressure was filtered and the filtrate was collected during 35 min filtration at
20 °C (±5).
4.3. Operating parameters
The proposed combined models have been driven at constant pressure.
Therefore, transmembrane pressure (TMP) was considered to be set at 69 kPa
based on the type of membrane (0.2 μm track-etched MF). The experiments were performed at room temperature (20±5 °C). The BSA concentrations
were changed from low (1 g/L) to high (8 g/L) at four levels. The pH was set
at 7; higher than the BSA isoelectric point (~5) [15].
5. Results and discussion
The best fit parameters were obtained by minimizing the sum of squared
residuals between the model and the experimental data. For the consistency of
model with the experimental data, some square error (SSE) was calculated for each model and the results are presented for comparison of the models.
5.1. Classical models
The results of modeling the experimental total filtrate volume for the BSA solution filtration in the concentration of 2 g/L for the classical models
(standard blocking, complete blocking, intermediate blocking and cake
filtration) are presented in Figure 2. Table 2 shows the fit constant parameters and their calculated SEE. At the beginning of the time, the complete, standard
and intermediate blocking models could predict the experimental data well.
This result shows that some BSA monomers or oligomers could enter the membrane pores [14], but some else may form aggregates and block some
pores of membrane [15].
The complete blocking model fits the data at moderate time, but could not predict the experimental data at longer times. This result represent that the
complicated phenomenon has been happened especially for longer times. The
cake formation mechanism could not predict the experimental especially at the beginning and moderate time. The cake formation model fitted the data
around 1400 s and demonstrated that this time the layer deposition may be
occurred [24]. The SEE for the standard blocking, complete blocking, intermediate
blocking and cake filtration are 3.77×10⁻¹, 9.11×10⁻⁵, 4.23×10⁻⁴ and 5.71×10⁻³,
respectively. The comparison between the SEE for the four classical mechanisms reveals that the standard blocking cannot predict the
experimental data at whole time. In other words, this result show that particles
could not enter the membrane frequently due to the high BSA particle aggregate [15]. Table 2 also compares the fit parameters with Bolton et al.
[8]. They have obtained the data for 2.5 g/L BSA filtered through Viresolve
180 membrane at 207 kPa. There are significant differences between Bolton and co-workers' classic fit parameters and current study, except for Kb. The
source of this difference may be due to being difference in the type of applied
membrane or TMP.
0 200 400 600 800 1000 1200 1400 1600 1800 20000
0.002
0.004
0.006
0.008
0.01
0.012
0.014
time(s)
Volu
me [
x10 m
3]
Classic standard model
Classic intermediate model
Experimental data
Classic complete model
Classic cake formation model
Fig. 2. Total filtrate volume (m3) experimental data and classical models for BSA
solution filtration with the concentration of 2 g/L at 69 kPa and 20 °C (±5).
Table 2
Fitted parameter values for the classical models. BSA solution concentration was 2 g/L at 69
kPa and 20 °C (±5).
Model Fit parameter SEE Bolton et al. [8]*
Standard
blocking Ks = 100 m-1 3.77×10⁻¹ Ks = 13.2 m-1
Complete
blocking Kb = 2.0×10⁻³ s-1 9.11×10⁻⁵ Kb = 2.61×10⁻³ s-1
Intermediate
blocking Ki = 2.6×10³ m-1 4.23×10⁻⁴ Ki = 30.5 m-1
Cake formation Kc = 6×10⁶ s/m2 5.71×10⁻³ Kc = 7.21×10⁵ s/m2
* Data for 2.5 g/L BSA filtered through Viresolve 180 membrane at 207 kPa
278

H. Koonani and M. Amirinejad / Journal of Membrane Science and Research 5 (2019) 274-282
5.2. Combined three mechanisms models
The Q0 was measured and its value for different feed concentrations was between 1.3×10⁻⁷ to 1.6×10⁻⁷ m3/s. The Rm value for the clean membrane by
measuring the flux of passing distilled water thought the membrane at 14 kPa
was 1.75 ×10¹⁰ m-1. The experimental data for the constant pressure filtration of four different
BSA solutions (concentrations varying from 1 to 8 g/L) and the model
predictions for the combined sequential effects of three different classical fouling mechanisms are shown in Figures 3-7. These figures show the
normalized volumetric flow rate (Q/Q0) as a function of the filtration time.
Solid curves represent the models calculations based on the best fit parameters.
The normalized flow rate versus the time for the experimental data and
the model predictions for the SIC (Eq. 19) is shown in Figure 3. The normalized flow rate declines more rapidly with increasing the BSA
concentration.
0 1000 2000 3000 4000 5000 6000 7000 80000.1
0.2
0.3
0.4
0.5
0.6
0.7
0.8
0.9
1
1.1
time(s)
Q/Q
o
8g/L
4g/L
2g/L
1g/L
Fig. 3. Normalized flow rate experimental data for BSA solutions filtration (14 kPa
and 20°C (±5)) and the predictions (solid curves) using combined standard
blocking-intermediate pore blockage-cake formation model at different feed
concentrations.
At the beginning of the filtration, the flux decreases rapidly, when the
pore blockage mechanism is dominant, and then it declines gradually during
the filtration, when the fouling is dominated by the cake filtration. The filtrate flow rate for higher BSA concentrations declined more rapidly. The flow rate
versus time curves at low BSA concentrations (1 and 2 g/L) are relatively
linear [24]. This behavior is likely due to the fact that fouling occurs through a combination of different fouling mechanisms. In these cases, the flow rate
diagram versus the time does not give a clear indication of the dominant
fouling mechanism. At higher concentration (8 g/L), the data shows changes
in the concave from the initial to the final of the filtration. This result
indicates that the fouling is mainly caused by pore blockage during the early
stage of filtration and dominated by cake filtration at long filtration times. R' is the specific protein layer resistance, which is assumed to be constant during
a constant pressure filtration and f' is the fraction of the proteins that cause the
buildup of the cake layer [14]. In this combined model, α', β, f'R' represent the parameters for pore blockage, pore constriction, and cake filtration, Rc0 is the
initial resistance of one single protein aggregate, respectively.
The model predictions and experimental data have rather good agreements, but there is some discrepancy between the data and the model.
The fit parameters for the SIC model are shown in Table 3. The model
parameters were calculated by curve fitting the experimental data and provided by Matlab software. This table also shows the SSE and results show
that their SSE is in the order of 10−7 for different concentrations.
The second triple-mechanism model applied to filtration of BSA solution is the Hagen–Poiseuille SCC. The normalized filtrate flow rate data and the
model predictions (Eq. 29) are shown in Figure 4. At the extended time, the
flux does not significantly change with the time and the concentration of solution. The transition between these two stages, the pore blockage and cake
filtration, is determined by the change in slope of the flux with the time [10].
Table 3
SIC fouling model parameters and the SEE for the best fit.
Cb (g/L) α ' f 'R' RC0 β SSE
1 0.972 15.11×10¹³ 29.71×10¹⁰ 200.0 3.11×10⁻⁷
2 0.975 15.16×10¹³ 29.75×10¹⁰ 198.0 6.53×10⁻⁷
4 0.980 15.19×10¹³ 29.90×10¹⁰ 197.0 7.92×10⁻⁷
8 0.999 15.23×10¹³ 30.00×10¹⁰ 195.7 8.01×10⁻⁷
0 1000 2000 3000 4000 5000 6000 7000 80000.1
0.2
0.3
0.4
0.5
0.6
0.7
0.8
0.9
1
1.1
time(s)
Q/Q
o
8g/L
4g/L
2g/L
1g/L
Fig. 4. Normalized flow rate experimental data for BSA solutions filtration (14 kPa
and 20°C (±5)) and the predictions (solid curves) using combined standard
blocking-complete pore blockage-cake formation (using the Hagen-Poisseuille law
for flux) model at different feed concentrations.
The fit parameters for the Hagen–Poiseuille SCC model and the SSE are
shown in Table 4. The SSE results for the model consistency are in the order
of 10−8 for different concentrations.
Table 4
Hagen–Poiseuille SCC fouling model parameters and the SEE for the best fit.
Cb (g/L) α f 'R' RC0 α in SEE
1 0.0637 17.25×10¹³ 17.94×10¹⁰ 2.344×10⁻⁸ 2.64×10-
8
2 0.0639 17.40×10¹³ 17.95×10¹⁰ 2.326×10⁻⁸ 3.25×10-
8
4 0.0640 17.50×10¹³ 17.97×10¹⁰ 2.312×10⁻⁸ 3.79×10-
8
8 0.0641 18.00×10¹³ 18.00×10¹⁰ 2.300×10⁻⁸ 4.11×10-
8
The third triple-mechanism model applied to the filtration of BSA solution is the Hagen–Poiseuille SIC. The normalized filtrate flow rate data
and the model predictions (Eq. 30) are shown in Figure 5. Both external
(intermediate) and internal (standard) blocking appear at the beginning of fouling, whereas internal blocking disappears for the subsequent steps of the
process [18].
Table 5 shows the fit parameters for the Hagen–Poiseuille SIC model and the SSE. The SSE results for the model consistency are in the order of 10−8
for different concentrations.
The fourth triple-mechanism model applied to the filtration of BSA solution is the zero-order SCC. Figure 6 represents the normalized filtrate
flow rate data and the model predictions (Eq. 36).
279
H. Koonani and M. Amirinejad / Journal of Membrane Science and Research 5 (2019) 274-282
0 1000 2000 3000 4000 5000 6000 7000 80000.1
0.2
0.3
0.4
0.5
0.6
0.7
0.8
0.9
1
1.1
time(s)
Q/Q
o
8g/L
4g/L
2g/L
1g/L
Fig. 5. Normalized flow rate experimental data for BSA solutions filtration (14 kPa
and 20°C (±5)) and the predictions (solid curves) using combined standard
blocking-intermediate pore blockage-cake formation (using Hagen-Poisseuille law
for flux) model at different feed concentrations.
0 1000 2000 3000 4000 5000 6000 7000 80000.1
0.2
0.3
0.4
0.5
0.6
0.7
0.8
0.9
1
1.1
time(s)
Q/Q
o
8g/L
4g/L
2g/L
1g/L
Fig. 6. Normalized flow rate experimental data for BSA solutions filtration (14 kPa
and 20°C (± 5)) and the predictions (solid curves) using zero order standard
blocking, complete pore blockage, cake formation model at different feed
concentrations.
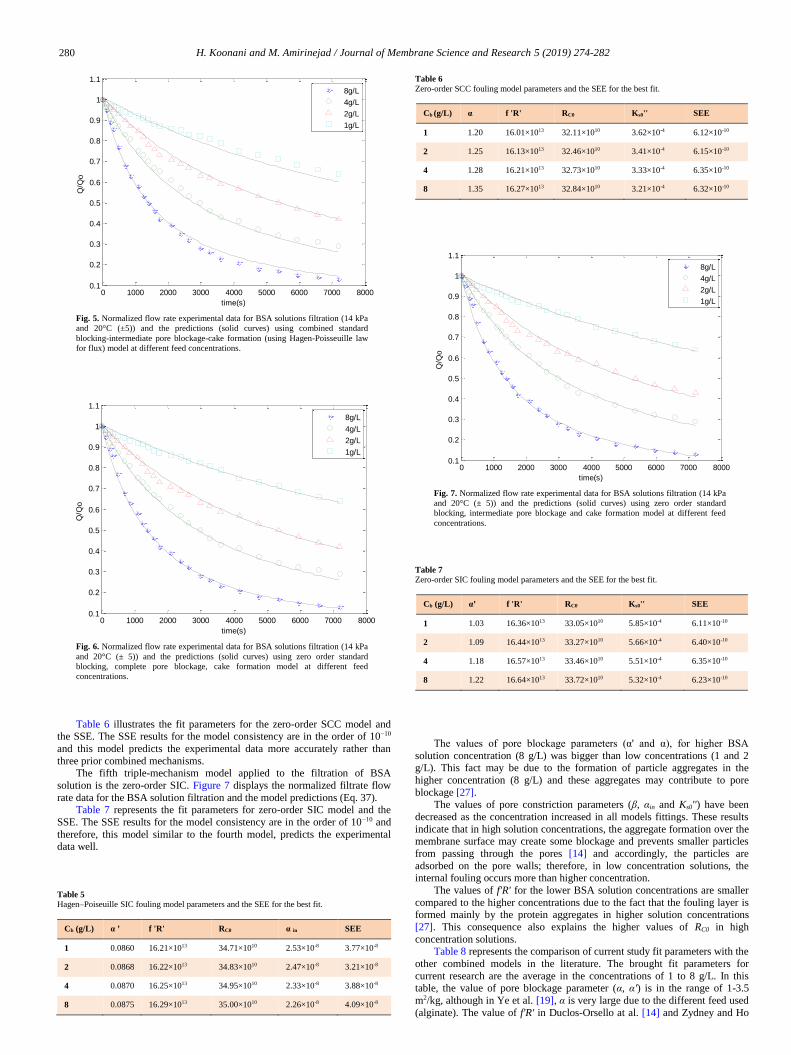
Table 6 illustrates the fit parameters for the zero-order SCC model and the SSE. The SSE results for the model consistency are in the order of 10−10
and this model predicts the experimental data more accurately rather than
three prior combined mechanisms. The fifth triple-mechanism model applied to the filtration of BSA
solution is the zero-order SIC. Figure 7 displays the normalized filtrate flow
rate data for the BSA solution filtration and the model predictions (Eq. 37). Table 7 represents the fit parameters for zero-order SIC model and the
SSE. The SSE results for the model consistency are in the order of 10−10 and
therefore, this model similar to the fourth model, predicts the experimental data well.
Table 5
Hagen–Poiseuille SIC fouling model parameters and the SEE for the best fit.
Cb (g/L) α ' f 'R' RC0 α in SEE
1 0.0860 16.21×10¹³ 34.71×10¹⁰ 2.53×10⁻⁸ 3.77×10⁻⁸
2 0.0868 16.22×10¹³ 34.83×10¹⁰ 2.47×10⁻⁸ 3.21×10⁻⁸
4 0.0870 16.25×10¹³ 34.95×10¹⁰ 2.33×10⁻⁸ 3.88×10⁻⁸
8 0.0875 16.29×10¹³ 35.00×10¹⁰ 2.26×10⁻⁸ 4.09×10⁻⁸
Table 6
Zero-order SCC fouling model parameters and the SEE for the best fit.
Cb (g/L) α f 'R' RC0 Ks0'' SEE
1 1.20 16.01×10¹³ 32.11×10¹⁰ 3.62×10⁻⁴ 6.12×10⁻¹⁰
2 1.25 16.13×10¹³ 32.46×10¹⁰ 3.41×10⁻⁴ 6.15×10⁻¹⁰
4 1.28 16.21×10¹³ 32.73×10¹⁰ 3.33×10⁻⁴ 6.35×10⁻¹⁰
8 1.35 16.27×10¹³ 32.84×10¹⁰ 3.21×10⁻⁴ 6.32×10⁻¹⁰
0 1000 2000 3000 4000 5000 6000 7000 80000.1
0.2
0.3
0.4
0.5
0.6
0.7
0.8
0.9
1
1.1
time(s)
Q/Q
o
8g/L
4g/L
2g/L
1g/L
Fig. 7. Normalized flow rate experimental data for BSA solutions filtration (14 kPa
and 20°C (± 5)) and the predictions (solid curves) using zero order standard
blocking, intermediate pore blockage and cake formation model at different feed
concentrations.
Table 7
Zero-order SIC fouling model parameters and the SEE for the best fit.
Cb (g/L) α' f 'R' RC0 Ks0'' SEE
1 1.03 16.36×10¹³ 33.05×10¹⁰ 5.85×10⁻⁴ 6.11×10⁻¹⁰
2 1.09 16.44×10¹³ 33.27×10¹⁰ 5.66×10⁻⁴ 6.40×10⁻¹⁰
4 1.18 16.57×10¹³ 33.46×10¹⁰ 5.51×10⁻⁴ 6.35×10⁻¹⁰
8 1.22 16.64×10¹³ 33.72×10¹⁰ 5.32×10⁻⁴ 6.23×10⁻¹⁰
The values of pore blockage parameters (α' and α), for higher BSA
solution concentration (8 g/L) was bigger than low concentrations (1 and 2 g/L). This fact may be due to the formation of particle aggregates in the
higher concentration (8 g/L) and these aggregates may contribute to pore
blockage [27]. The values of pore constriction parameters (β, αin and Ks0'') have been
decreased as the concentration increased in all models fittings. These results
indicate that in high solution concentrations, the aggregate formation over the membrane surface may create some blockage and prevents smaller particles
from passing through the pores [14] and accordingly, the particles are
adsorbed on the pore walls; therefore, in low concentration solutions, the internal fouling occurs more than higher concentration.
The values of f'R' for the lower BSA solution concentrations are smaller
compared to the higher concentrations due to the fact that the fouling layer is formed mainly by the protein aggregates in higher solution concentrations
[27]. This consequence also explains the higher values of RC0 in high
concentration solutions. Table 8 represents the comparison of current study fit parameters with the
other combined models in the literature. The brought fit parameters for
current research are the average in the concentrations of 1 to 8 g/L. In this table, the value of pore blockage parameter (α, α') is in the range of 1-3.5
m2/kg, although in Ye et al. [19], α is very large due to the different feed used
(alginate). The value of f'R' in Duclos-Orsello at al. [14] and Zydney and Ho
280

H. Koonani and M. Amirinejad / Journal of Membrane Science and Research 5 (2019) 274-282
[25] is in the order 1010 at 14 kPa TMP, but in Seifollahy Astaraee et al. [24]
and current research this value is in the order of 1013 at higher TMP. The
values of β and Rco are in the ranges of data reported in the literature.
6. Conclusions
In this study, BSA solutions with concentrations of 1, 2, 4, and 8 g/L
were filtered through the 0.2 µm hydrophilic polycarbonate track etched membrane and the fouling behavior was investigated and modeled. The best
fit parameters were obtained by minimizing the sum of squared residuals
between the model and the experimental data. For the consistency of the model with the experimental data, the SSE was calculated and compared for
the models.
The results showed that modeling the total filtrate volume for the BSA solution filtration in the concentration of 2 g/L by the classical models
(standard blocking, complete blocking, intermediate blocking and cake
filtration) the classical models could not predict the experimental precisely.
The SEE for the standard blocking, complete blocking, intermediate blocking
and cake filtration are 3.77×10⁻¹, 9.11×10⁻⁵, 4.23×10⁻⁴ and 5.71×10⁻³, respectively. These results show that the membrane fouling during BSA
solution microfiltration is happened by a complicated mechanism rather than
an individual mechanism. For combined three mechanisms models, the classic standard expression
has been used to describe the effect of internal fouling and then combined
with other mechanisms to deliver triple-mechanism fouling models (SIC, Hagen–Poiseuille SCC and Hagen–Poiseuille SIC models). The zero-order
SCC and zero-order SIC models have been obtained based on the
combination of modified expression for the standard blockage [26] with other classical mechanisms. As a result, the zero-order SCC and zero-order SIC
models (with the SEE in order of 10−10) compared with the SIC (SSE in the
order of 10−7), Hagen–Poiseuille SCC and Hagen–Poiseuille SIC (SSE in the order of 10−8) provide well consistency with the experimental filtrate flow
rate.
Table 8
Comparison of current study average fit parameters with the other combined models in the literature.
Feed/Concentration (g/L) Membrane type TMP (kPa) Fit parameters Ref.
BSA/1-8 0.22 μm GVHP 14
α=1.08 m2/kg
β=127.6 kg
f'R'=6.98×10¹⁰ m/kg
[14]
BSA/1-8 0.22 μm GVWP 14
α =2.88 m2/kg
β=0.864 kg
f'R'=1.89×10¹⁰ m/kg
[14]
Alginate/50 0.22 μm TE 15-25 α= 6284 m2/kg
Rc0= 1 × 10¹⁰ m-1 [19]
BSA/0.5-5 0.2 μm PCTE 40
α=3.50 m2/kg
Rc0=41.8×10¹⁰ m-1
f'R'= 5.51×10¹³ m/kg
[24]
BSA/0.4 0.2 μm PCTE 14
β=0.81 m-1
Rco=40×1010 m-1
[25]
BSA/1-8 0.2 μm PCTE 69 SIC
α'=0.982 m2/kg
f'R'=60.69 ×10¹³ m/kg
Rc0=29.84×10¹⁰ m-1
β=197.8 kg
This
study
Hagen–Poiseuille SCC
α=0.208 m2/kg
f'R'=17.54 ×10¹³ m/kg
Rc0=17.96×10¹⁰ m-1
αin=2.32×10⁻⁸ m2/kg
Hagen–Poiseuille SIC
α'=0.0868 m2/kg
f'R'=16.24 ×10¹³ m/kg
Rc0=34.87×10¹⁰ m-1
αin=2.40×10⁻⁸ m2/kg
Zero-order SCC
α=1.26 m2/kg
f'R'=16.16 ×10¹³ m/kg
Rc0=32.44×10¹⁰ m-1
Ks0''=3.39×10⁻⁴ s-1
Zero-order SIC
α'=1.13 m2/kg
f'R'=16.50 ×10¹³ m/kg
Rc0=33.38×10¹⁰ m-1
Ks0''=5.58×10⁻⁴ s-1
Nomenclatures
Area of membrane (m2) A
Area of membrane blocked by foulant (m2) Ablocked
Area of unblocked membrane (m2) Aopen
Initial area of clean membrane (m2) A0
Solute bulk concentration (g L-1) Cb
Fractional amount of total foulant contributing to deposit
growth
f'ʹ
Filtrate flux within the blocked area (m s-1) Jblocked
Filtrate flux within the unblocked area (m s-1) Jopen
Initial filtrate flux of clean membrane (m s-1) J0
Complete blocking constant (s−1) Kb
Cake filtration constant (sm-2) Kc
Intermediate blocking constant (m−1) Ki
Standard blocking constant (m−1) Ks
Adsorption blocking constant (m s-1) Ks0'
Adsorption blocking constant, (s−1) Ks0''
Cake compressibility index, dimensionless n
Number of pores per membrane unit area (m-2) N0
Total volumetric flow rate (m3 s-1) Q
Volumetric flow rate within the blocked area (m3 s-1) Qblocked
Volumetric flow rate within the unblocked area (m3 s-1) Qopen
Initial volumetric flow rate of clean membrane (m3 s-1) Q0
Radius of membrane pore (m) rp
Sum of membrane and pore constriction resistances (m−1) Rm , in
281
H. Koonani and M. Amirinejad / Journal of Membrane Science and Research 5 (2019) 274-282
Hydraulic membrane resistance (m−1) Rm
Resistance of the cake (deposit) (m−1) Rc
Initial resistance of the cake (deposit) (m−1) Rc0
Specific protein layer resistance (m kg-1) R'
Filtration time (s) t
Characteristic time for initial cake formation (s) tc
Total filtrate volume per area (m3m-2) V
Deposited foulant volume (m3) Vin
Greek symbols
Transmembrane pressure (N m-2) ∆P
Complete pore blockage parameter (m2 kg-1) α
Intermediate pore blockage parameter (m2 kg-1) α'
Internal pore blockage parameter (m2 kg-1) αin
Pore constriction parameter (kg) β
Membrane thickness (m) δm
Solution viscosity (kg m-1 s-1) µ
Abbreviations
Bovine serum albumin BSA
Polycarbonate track etched PCTE
Standard blocking, complete pore blockage and cake
formation
SCC
Standard blocking, intermediate pore blockage and cake formation
SIC
Sum square error SSE
Track etched TE
Transmembrane pressure TMP
Appendix 1
Appendix 2
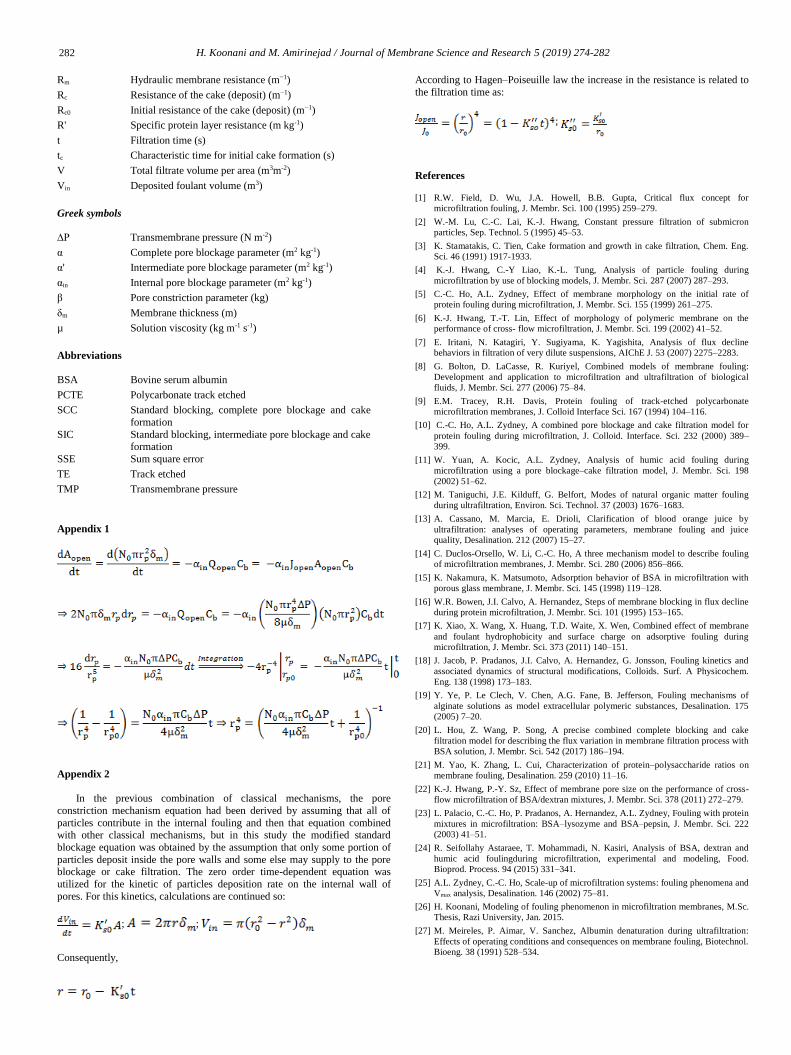
In the previous combination of classical mechanisms, the pore
constriction mechanism equation had been derived by assuming that all of
particles contribute in the internal fouling and then that equation combined with other classical mechanisms, but in this study the modified standard
blockage equation was obtained by the assumption that only some portion of
particles deposit inside the pore walls and some else may supply to the pore blockage or cake filtration. The zero order time-dependent equation was
utilized for the kinetic of particles deposition rate on the internal wall of
pores. For this kinetics, calculations are continued so:
; ;
Consequently,
According to Hagen–Poiseuille law the increase in the resistance is related to
the filtration time as:
;
References
[1] R.W. Field, D. Wu, J.A. Howell, B.B. Gupta, Critical flux concept for
microfiltration fouling, J. Membr. Sci. 100 (1995) 259–279.
[2] W.-M. Lu, C.-C. Lai, K.-J. Hwang, Constant pressure filtration of submicron
particles, Sep. Technol. 5 (1995) 45–53.
[3] K. Stamatakis, C. Tien, Cake formation and growth in cake filtration, Chem. Eng.
Sci. 46 (1991) 1917-1933.
[4] K.-J. Hwang, C.-Y Liao, K.-L. Tung, Analysis of particle fouling during
microfiltration by use of blocking models, J. Membr. Sci. 287 (2007) 287–293.
[5] C.-C. Ho, A.L. Zydney, Effect of membrane morphology on the initial rate of
protein fouling during microfiltration, J. Membr. Sci. 155 (1999) 261–275.
[6] K.-J. Hwang, T.-T. Lin, Effect of morphology of polymeric membrane on the
performance of cross- flow microfiltration, J. Membr. Sci. 199 (2002) 41–52.
[7] E. Iritani, N. Katagiri, Y. Sugiyama, K. Yagishita, Analysis of flux decline
behaviors in filtration of very dilute suspensions, AIChE J. 53 (2007) 2275–2283.
[8] G. Bolton, D. LaCasse, R. Kuriyel, Combined models of membrane fouling:
Development and application to microfiltration and ultrafiltration of biological
fluids, J. Membr. Sci. 277 (2006) 75–84.
[9] E.M. Tracey, R.H. Davis, Protein fouling of track-etched polycarbonate
microfiltration membranes, J. Colloid Interface Sci. 167 (1994) 104–116.
[10] C.-C. Ho, A.L. Zydney, A combined pore blockage and cake filtration model for
protein fouling during microfiltration, J. Colloid. Interface. Sci. 232 (2000) 389–
399.
[11] W. Yuan, A. Kocic, A.L. Zydney, Analysis of humic acid fouling during
microfiltration using a pore blockage–cake filtration model, J. Membr. Sci. 198
(2002) 51–62.
[12] M. Taniguchi, J.E. Kilduff, G. Belfort, Modes of natural organic matter fouling
during ultrafiltration, Environ. Sci. Technol. 37 (2003) 1676–1683.
[13] A. Cassano, M. Marcia, E. Drioli, Clarification of blood orange juice by
ultrafiltration: analyses of operating parameters, membrane fouling and juice
quality, Desalination. 212 (2007) 15–27.
[14] C. Duclos-Orsello, W. Li, C.-C. Ho, A three mechanism model to describe fouling
of microfiltration membranes, J. Membr. Sci. 280 (2006) 856–866.
[15] K. Nakamura, K. Matsumoto, Adsorption behavior of BSA in microfiltration with
porous glass membrane, J. Membr. Sci. 145 (1998) 119–128.
[16] W.R. Bowen, J.I. Calvo, A. Hernandez, Steps of membrane blocking in flux decline
during protein microfiltration, J. Membr. Sci. 101 (1995) 153–165.
[17] K. Xiao, X. Wang, X. Huang, T.D. Waite, X. Wen, Combined effect of membrane
and foulant hydrophobicity and surface charge on adsorptive fouling during
microfiltration, J. Membr. Sci. 373 (2011) 140–151.
[18] J. Jacob, P. Pradanos, J.I. Calvo, A. Hernandez, G. Jonsson, Fouling kinetics and
associated dynamics of structural modifications, Colloids. Surf. A Physicochem.
Eng. 138 (1998) 173–183.
[19] Y. Ye, P. Le Clech, V. Chen, A.G. Fane, B. Jefferson, Fouling mechanisms of
alginate solutions as model extracellular polymeric substances, Desalination. 175
(2005) 7–20.
[20] L. Hou, Z. Wang, P. Song, A precise combined complete blocking and cake
filtration model for describing the flux variation in membrane filtration process with
BSA solution, J. Membr. Sci. 542 (2017) 186–194.
[21] M. Yao, K. Zhang, L. Cui, Characterization of protein–polysaccharide ratios on
membrane fouling, Desalination. 259 (2010) 11–16.
[22] K.-J. Hwang, P.-Y. Sz, Effect of membrane pore size on the performance of cross-
flow microfiltration of BSA/dextran mixtures, J. Membr. Sci. 378 (2011) 272–279.
[23] L. Palacio, C.-C. Ho, P. Pradanos, A. Hernandez, A.L. Zydney, Fouling with protein
mixtures in microfiltration: BSA–lysozyme and BSA–pepsin, J. Membr. Sci. 222
(2003) 41–51.
[24] R. Seifollahy Astaraee, T. Mohammadi, N. Kasiri, Analysis of BSA, dextran and
humic acid foulingduring microfiltration, experimental and modeling, Food.
Bioprod. Process. 94 (2015) 331–341.
[25] A.L. Zydney, C.-C. Ho, Scale-up of microfiltration systems: fouling phenomena and
Vmax analysis, Desalination. 146 (2002) 75–81.
[26] H. Koonani, Modeling of fouling phenomenon in microfiltration membranes, M.Sc.
Thesis, Razi University, Jan. 2015.
[27] M. Meireles, P. Aimar, V. Sanchez, Albumin denaturation during ultrafiltration:
Effects of operating conditions and consequences on membrane fouling, Biotechnol.
Bioeng. 38 (1991) 528–534.
282