Combined Mesenchymal Stromal Cell Therapy and ECMO in …
32
Combined Mesenchymal Stromal Cell Therapy and ECMO in ARDS: A Controlled Experimental Study in Sheep Combining Extracorporeal Life Support and Cell Therapy in Critical Illness (CELTIC) investigators. (2020). Combined Mesenchymal Stromal Cell Therapy and ECMO in ARDS: A Controlled Experimental Study in Sheep. American Journal of Respiratory and Critical Care Medicine. https://doi.org/10.1164/rccm.201911-2143OC Published in: American Journal of Respiratory and Critical Care Medicine Document Version: Peer reviewed version Queen's University Belfast - Research Portal: Link to publication record in Queen's University Belfast Research Portal Publisher rights Copyright 2020 American Thoracic Society. This work is made available online in accordance with the publisher’s policies. Please refer to any applicable terms of use of the publisher. General rights Copyright for the publications made accessible via the Queen's University Belfast Research Portal is retained by the author(s) and / or other copyright owners and it is a condition of accessing these publications that users recognise and abide by the legal requirements associated with these rights. Take down policy The Research Portal is Queen's institutional repository that provides access to Queen's research output. Every effort has been made to ensure that content in the Research Portal does not infringe any person's rights, or applicable UK laws. If you discover content in the Research Portal that you believe breaches copyright or violates any law, please contact [email protected]. Download date:24. Nov. 2021
Transcript of Combined Mesenchymal Stromal Cell Therapy and ECMO in …

Combined Mesenchymal Stromal Cell Therapy and ECMO in ARDS:A Controlled Experimental Study in Sheep
Combining Extracorporeal Life Support and Cell Therapy in Critical Illness (CELTIC) investigators. (2020).Combined Mesenchymal Stromal Cell Therapy and ECMO in ARDS: A Controlled Experimental Study in Sheep.American Journal of Respiratory and Critical Care Medicine. https://doi.org/10.1164/rccm.201911-2143OC
Published in:American Journal of Respiratory and Critical Care Medicine
Document Version:Peer reviewed version
Queen's University Belfast - Research Portal:Link to publication record in Queen's University Belfast Research Portal
Publisher rightsCopyright 2020 American Thoracic Society. This work is made available online in accordance with the publisher’s policies. Please refer toany applicable terms of use of the publisher.
General rightsCopyright for the publications made accessible via the Queen's University Belfast Research Portal is retained by the author(s) and / or othercopyright owners and it is a condition of accessing these publications that users recognise and abide by the legal requirements associatedwith these rights.
Take down policyThe Research Portal is Queen's institutional repository that provides access to Queen's research output. Every effort has been made toensure that content in the Research Portal does not infringe any person's rights, or applicable UK laws. If you discover content in theResearch Portal that you believe breaches copyright or violates any law, please contact [email protected].
Download date:24. Nov. 2021

Combined mesenchymal stromal cell therapy and extracorporeal membrane oxygenation
in Acute Respiratory Distress Syndrome: A controlled experimental study in sheep
Jonathan E Millar, Nicole Bartnikowski, Margaret R Passmore, Nchafatso G Obonyo,
Maximillian V Malfertheiner, Viktor von Bahr, Meredith A Redd, Louise See Hoe, Katrina K
Ki, Sanne Pedersen, Andrew J Boyle, J Kenneth Baillie, Kiran Shekar, Nathan J Palpant, Jacky
Y Suen, Michael A Matthay, Daniel F McAuley, John F Fraser on behalf of the CELTIC
investigators
Online Supplement
Contents
A. Sheep preparation
B. Supportive care protocol
C. Model of experimental ARDS
D. Veno-venous ECMO
E. Human mesenchymal stromal cells
F. Clinical measurements
G. Blood and bronchoalveolar lavage fluid analyses
H. Histological analyses and lung tissue gene expression
I. Analyses of membrane oxygenators
J. Sample size calculation
K. Results supplement
L. Supplement references

Online supplement – Combined MSC therapy and ECMO in experimental ARDS JE Millar et. al.
S2
A. Sheep preparation
Female sheep (Ovis aries, Border Leicester Cross), aged 1-3 years, were selected at random
from a flock of healthy farm reared animals. Sheep were transferred to the animal research
facility at least two weeks before use. They could graze freely in an outdoor enclosure and
underwent veterinary inspection, including testing for common ovine pathogens (e.g. Q fever).
On the day before experimentation, animals were housed in an indoor pen with free access to
water and were denied solid feed for 12 hours. On the morning of experimentation, sheep were
transported to the operating theatre in a specially modified sling.
Under local anesthesia (5-10 mL 2% lignocaine, Pfizer, Sydney, NSW, Australia), a quad-
lumen central venous catheter (Arrow, Teleflex Medical Australia, Mascot, NSW, Australia)
was inserted into the left external jugular vein (EJV), after which baseline blood samples were
obtained. An 8 Fr percutaneous introducer sheath (Arrow, Teleflex Medical Australia, Mascot,
NSW, Australia) was inserted cephalad to the central venous catheter in the left EJV. Two 8 Fr
percutaneous introducer sheaths were then inserted, approximately 8 cm apart, in the right EJV.
All lines were secured with 1-0 silk sutures. Once vascular access was secured, animals were
pre-oxygenated for 3 minutes using a facemask and a Mapleson C anesthetic circuit set to
deliver 15 L O2 min-1. General anesthesia was then induced as described below. Animals were
transferred to an operating table and positioned supine. A surgical tracheostomy was
performed, by midline longitudinal incision exposing the space between the 2nd/3rd tracheal
rings. A size 9.0 Portex tracheostomy tube (Smith’s Medical Australia, Sydney, NSW,
Australia) was inserted, and positioning was confirmed using a flexible video bronchoscope
(aScope™, Ambu, Ballerup, Denmark). Thereafter, the tracheostomy was suctioned hourly
using an in-line suction catheter.

Online supplement – Combined MSC therapy and ECMO in experimental ARDS JE Millar et. al.
S3
B. Supportive care protocol
Experienced medical and nursing staff, with training in the prevision of critical care and
ECMO, were present for the duration of each experiment. Expert large animal veterinarian
advice was available upon request.
Anesthesia/analgesia
General anesthesia was induced by intravenous injection of midazolam (0.5 mg/Kg,
Pfizer, Sydney, NSW, Australia) and ketamine (5 mg/kg, Troy Laboratories, Sydney, NSW,
Australia). Animals were orotracheally intubated (size 9.0-10.0 ID Portex endotracheal tube,
Smith’s Medical Australia, Sydney, NSW, Australia) and connected to a mechanical ventilator.
Maintenance of anesthesia/analgesia was achieved by intravenous infusion of midazolam (0.5-
0.8 mg/kg/hr, Pfizer, Sydney, NSW, Australia), ketamine (5-7.5 mg/kg/hr, Troy Laboratories,
Sydney, NSW, Australia), and fentanyl (5-10 mcg/kg/hr, Hameln Pharmaceuticals, Hameln,
Germany). Depth of anesthesia was assessed prior to neuromuscular blockade by abolition of
the eyelash reflex, after which attention was paid to clinical indicators such as heart rate and
salivation. Total intravenous anesthesia was maintained until euthanasia.
Once maintenance anesthesia was established, animals were paralysed with an
intravenous bolus of vecuronium (50 mcg/kg, Pfizer, Sydney, NSW, Australia). Adequacy of
neuromuscular blockade (NMB) was assessed using the train of four (TOF) response to
peripheral nerve stimulation. NMB was maintained through the course of the experiment by an
intravenous infusion of vecuronium (50 mcg/kg/hr, Pfizer, Sydney, NSW, Australia).
Mechanical ventilation
In the period between induction of anesthesia and the commencement of VV-ECMO,
animals were ventilated according to a protocolized lung-protective strategy (Table A). In a
volume-controlled mode, the ventilator was initially set to achieve a tidal volume (Vt) of 6

Online supplement – Combined MSC therapy and ECMO in experimental ARDS JE Millar et. al.
S4
mL/kg actual body weight (ABW). One of, a Hamilton Galileo (Hamilton Medical, Bonaduz,
Switzerland) or a Puritan Bennett 840 (Puritan Bennett, Medtronic, Dublin, Ireland) ventilator
was used for the full course of each study.
Parameter Value
Mode Volume controlled
Tidal Volume (Vt) 4 - 6 mL/kg
Respiratory Rate ≤ 35 breaths per minutea
FiO2 Lowest required for SpO2 88-93%b
PEEP Adjusted to maintain Pplat 28-30 cmH2Oc
Plateau Pressure (Pplat) ≤ 30 cmH2O
I:E Ratio 1:1 to 1:3
Table A. Pre-ECMO ventilatory strategy.
a Adjusted to maintain pH 7.30-7.45. Permissive hypercapnia was tolerated to a minimum pH of 7.15.
b PaO2 55 – 80 mmHg. If despite an FiO2 of 1.0 oxygenation targets were not met, PEEP was
increased, maintaining Pplat ≤ 32 cmH2O.
c Total PEEP (extrinsic PEEP + intrinsic PEEP) did not exceed 20 cmH2O. PEEP was permitted to be
reduced to 5 cmH2O to maintain Pplat ≤ 30 cmH2O. If despite a PEEP of 5 cmH2O, Pplat > 30 cmH2O,
Vt was reduced in 1 mL/kg steps until set at 4 mL/kg.
FiO2 – Fraction of inspired oxygen, SpO2 – Peripheral oxygen saturation, PEEP – Positive end-
expiratory pressure, Pplat – Airway plateau pressure, I:E Ratio – Inspiratory to expiratory ratio
Fluid and electrolyte management
After the induction of general anesthesia, a maintenance infusion of crystalloid (1-2
mL/kg/hr, compound sodium lactate, Baxter, Sydney, NSW, Australia) was commenced for

Online supplement – Combined MSC therapy and ECMO in experimental ARDS JE Millar et. al.
S5
the duration of the study. Fluid therapy was indicated at other times to support hemodynamics
or ECMO flows, in this case 100 mL boluses of compound sodium lactate were titrated to
effect.
Electrolyte levels were assessed 4-hourly. Serum potassium levels were maintained >
3.5 mmol/L by i.v. infusion of 10-20 mmol potassium chloride (AstraZeneca, Sydney, NSW,
Australia). In the event of hyperkalemia (K+ > 5.5 mmol/L), supplemental potassium
administration was ceased and 10 mL 10% calcium gluconate (B. Braun Melsungen AG,
Melsungen, Germany) was given by i.v. bolus injection. Hyperchloremia (Cl- >103) was
avoided. All large volume gastric losses were returned via the orogastric tube. Blood glucose
levels were measured hourly and maintained > 1.5 mmol/L by infusion of 50% glucose (Baxter,
Sydney, NSW, Australia).
Monitoring and hemodynamic management
All animals were monitored according to the ‘Recommendations for standards of
monitoring during anaesthesia and recovery 2015: Association of Anaesthetists of Great
Britain and Ireland’, including; pulse oximetry, 3-lead electrocardiogram, and continuous
waveform capnography. In addition, the central venous catheter (CVC) was transduced as a
measure of central venous pressure.
Following induction of general anesthesia and repositioning to the operating table,
invasive arterial blood pressure monitoring was established by cannulation of the left facial
artery (20G Leadercath arterial, Vygon, Écouen, France). Using the 8 Fr percutaneous sheath
introducer positioned in the left EJV, a pulmonary artery catheter (PAC) was inserted (7.5 Fr
Swan-Ganz CCOmbo, Edwards Life Sciences, Irvine, CA, USA). The catheter was inserted to
a depth of 15 cm after which the flotation balloon was inflated. The catheter was directed to
the pulmonary artery, the balloon was deflated, and the catheter secured. Positioning was
Online supplement – Combined MSC therapy and ECMO in experimental ARDS JE Millar et. al.
S6
confirmed by obtaining a satisfactory waveform. Continuous cardiac output monitoring
(Vigilance monitor, Edwards Lifesciences, Irvine, CA, USA) was instituted, with cardiac index
estimated by; cardiac output/BSA [weight (kg)0.67 x 0.0842]. Continuous measurements of core
body temperature were also obtained from the PAC.
A 14 Fr urinary catheter (Gildana Healthcare, Oakleigh, VIC, Australia) was inserted
and connected to an hourly urometer to allow for accurate quantification of urine output. A 16
Fr orogastric tube (ConvaTec, Glen Waverley, VIC, Australia) was inserted and left on free
drainage.
A mean arterial pressure ≥ 65 mmHg was targeted. In the face of sustained hypotension,
repeated 100 mL boluses of compound sodium lactate (Baxter, Sydney, NSW, Australia) were
given until; CVP ≥ 8 mmHg and/or the animal was no longer fluid responsive (failure to
increase stroke volume > 10% by PAC). Thereafter, noradrenaline (80 mcg/mL in 5% dextrose,
Hospira, Lake Forrest, IL, USA) was commenced at 80 mcg/min and the dose titrated at 5-
minute intervals. If noradrenaline requirements reached 2400 mcg/min, vasopressin (PPC,
Richmond Hill, Canada) was commenced at 0.8 units/hr and increased to a maximum of 1.8
units/hr.
Euthanasia
At the end of each study, animals were euthanised by i.v. injection of phenobarbitone
(142.5 mg/kg, Aspen Pharma, Dandenong, NSW, Australia). After death was confirmed
(absence of cardiac electrical activity, blood pressure, and cardiac output monitoring), organs
were retrieved surgically. Animal carcasses were stored and subsequently disposed of by
incineration.

Online supplement – Combined MSC therapy and ECMO in experimental ARDS JE Millar et. al.
S7
C. Model of experimental ARDS
After instrumentation, in a supine position, animals were injured using a combination of
intravenous oleic acid (OA) and endobronchial E. coli lipopolysaccharide (LPS).
Oleic acid preparation
A total dose of 0.06 ml/kg OA was used to induce injury. Firstly, 0.03 mL/kg OA
(O1008, Sigma-Aldrich, Castle Hill, NSW, Australia) was suspended in 20 mL arterial blood
and 150 IU porcine heparin (Pfizer, Sydney, NSW, Australia). This mixture was administered
via the distal port of the right EJV central venous catheter, followed by a flush of 50 mL 0.9%
sodium chloride (Baxter, Sydney, NSW, Australia). The animal could recover and after 15
minutes this procedure was repeated. When 15 minutes elapsed from the second dose, arterial
blood gas analysis, at an FiO2 of 1.0 and a PEEP of 10 cmH2O, was used to confirm a PaO2/FiO2
ratio <100 mmHg.
E. coli lipopolysaccharide preparation
Immediately after a PaO2/FiO2 ratio <100 mmHg was confirmed, 50 mcg E. coli LPS
(O55:B5, Sigma-Aldrich, Castle Hill, NSW, Australia), diluted in 10 mL 0.9% sodium chloride
(Baxter, Sydney, NSW, Australia), was administered, via a designated video bronchoscope, to
each main bronchus.

Online supplement – Combined MSC therapy and ECMO in experimental ARDS JE Millar et. al.
S8
D. Veno-venous ECMO
Equipment
ECMO was performed using a Maquet ROTAFLOW centrifugal pump (Maquet,
Getinge Group, Rastatt, Germany) along with a Maquet Permanent Life Support (PLS) set
(Maquet, Getinge Group, Rastatt, Germany). Circuits were primed in a sterile fashion (prime
volume ~ 585 mL) with compound sodium lactate (Baxter, Sydney, NSW, Australia).
Cannulation
Cannulation attempts were commenced after injury was confirmed (T0). Two 19 Fr
Bio-medicus single-stage venous catheters (Medtronic, Dublin, Ireland) were used in a right
sided VEJ – VEJ configuration. The access cannula was inserted by first re-wiring the proximal
right EJV percutaneous sheath and was then positioned in the inferior vena cava at the level of
the diaphragm. The return cannula was inserted by first re-wiring the distal right EJV
percutaneous sheath and was then positioned with the tip at the cavo-atrial junction. Cannula
insertion and positioning were guided by fluoroscopy and real-time intra-cardiac and intra-
cannular echocardiography. Cannulae were flushed with heparinised 0.9% sodium chloride (10
IU/mL porcine heparin, Pfizer, NSW, Australia). Cannulae were secured by suturing to the
skin. Animals were then placed in sternal recumbency for the remaining duration of the study.
Management
Once cannulation was successfully completed and positioning was confirmed, VV-
ECMO was commenced (T1). Pump speeds were slowly increased to 1000 rpm before clamp
release. Pump speeds were then adjusted to achieve flow rates of ~2/3 CO (typically between
60-90 mL/kg). Fresh gas flow (FGF) was initially set at 80% of pump flow and adjusted based
on arterial blood gas analysis. The FGF blender was set to deliver 100% O2 at all times. During
ECMO, PaO2 will be maintained ≥ 65 mmHg and PaCO2 ≤ 45 mmHg. Hyperoxia (PaO2 > 150

Online supplement – Combined MSC therapy and ECMO in experimental ARDS JE Millar et. al.
S9
mmHg) will be avoided. A water heater-cooler unit was connected to the membrane
oxygenator and set to 38° C for the duration of the ECMO run.
At the beginning of VV-ECMO, animals received a bolus dose of unfractionated
heparin (20 IU/kg porcine heparin, Pfizer, Sydney, NSW, Australia), when the activated
clotting time (ACT) fell below 160 s an infusion was commenced at 4 IU/kg/hr. An ACT of
180 s-210 s was targeted. ACT was measured prior to ECMO, at 1 hour, 2 hours, and every 2
hours thereafter. The unfractionated heparin infusion was titrated as per a pre-defined protocol
(Table B).
ACT Response
< 130 Bolus 10 IU/kg and increase infusion by 1.5 IU/kg/hr
130 - 150 Increase infusion by 1 IU/kg/hr
150 - 180 Increase infusion by 0.5 IU/kg/hr
180 - 210 No change
210 – 250 Decrease infusion by 1 IU/kg/hr
> 250 Cease infusion for 1 hr and recheck ACT, restart when ACT < 210 AND
decrease infusion by 1.5 IU/kg/hr
Table B. ECMO anti-coagulation titration protocol.
Mechanical ventilation during ECMO
Once VV-ECMO was established, mechanical ventilation was adjusted to target an
ultra-protective ventilatory strategy, consistent with that described in the EOLIA trial (1).
Neuromuscular blockade was maintained throughout. Ventilator settings and targets are
detailed further in Table C.

Online supplement – Combined MSC therapy and ECMO in experimental ARDS JE Millar et. al.
S10
Termination and return to pre-ECMO mechanical ventilation
VV-ECMO was halted 23 hours after injury (T23). Pump speeds were gradually
reduced to zero and both cannulae were clamped. Pump blood was returned by unclamping the
return cannula and gently flushing the circuit with Compound Sodium Lactate (~585 mL blood
returned). Clamped cannulae were left in situ until termination of the study. Immediately before
cessation of VV-ECMO, a standardised recruitment manoeuvre was performed. The
recruitment manoeuvre involved a 40 s breath hold at an airway pressure of 40 cmH20, in a
pressure-controlled mode, with an FiO2 of 1.0. After which animals were returned to
standardised pre-ECMO ventilator settings (with an FiO2 of 1.0) for 60 minutes at which time
the trial was terminated.
Parameter Value
Mode Volume controlled
Tidal Volume ≤ 4 ml/kg
Respiratory Rate 8 breaths per minute
FiO2 0.30
PEEP ≥ 10 cmH2O
Pplat ≤ 25 cmH2O
I:E Ratio 1:1 to 1:3
Table C. ECMO ventilatory strategy.

Online supplement – Combined MSC therapy and ECMO in experimental ARDS JE Millar et. al.
S11
E. Human mesenchymal stromal cells
Induced pluripotent stem cell (iPSC) derived human mesenchymal stromal cells
(hMSCs) were obtained from Cynata Therapeutics Ltd. (CYP-001; Cynata Therapeutics Ltd.,
Melbourne, VIC, Australia). Cells were manufactured under Good Manufacturing Practices
(GMP) conditions and were > 99% positive for CD-73, CD-90, and CD-105, but negative for
CD-31 and CD-45. iPSC-derived hMSCs were between passage 3 and 5. iPSC derived hMSCs
were presented in discrete batches of 1 x 10⁸ cells, suspended in 20 mL of a carrier vehicle
(57.5% Plasmalyte-A, 40% Flexbumin 25%, 2.5% Dimethyl sulfoxide). Cells were shipped to
our laboratory stored in the vapour phase of liquid nitrogen at -80°C where this was maintained
until use.
Cell preparation
Two hours before administration, cryopreserved cells in their carrier vehicle were thawed in a
water bath at 37.5°C, agitated to prevent clumping, and decanted into a sterile container.
Batches were sampled and assessed for viability (> 95%) prior to use.
Cell administration
Animals allocated to the treatment group received a fixed endobronchial dose of 3 x
108 cells (suspended in 60 mL of carrier vehicle), via a flexible video bronchoscope (aScope™,
Ambu, Ballerup, Denmark). Those allocated to the control group, received an equal volume of
cell-free carrier vehicle, administered in an identical fashion. Common to both groups, 25 mL
of solution was administered to the left diaphragmatic lobar bronchus and 5 mL to the left
apico-cardiac lobar bronchus, with a further 25 mL administered via the right diaphragmatic
lobar bronchus and 5 mL via the right cardiac lobar bronchus. The right apical lobar bronchus,
which arises in sheep directly from the trachea at approximately the level of the third rib (2),

Online supplement – Combined MSC therapy and ECMO in experimental ARDS JE Millar et. al.
S12
was untreated. After each instance of cell delivery, the channel of the bronchoscope was
flushed with 5 mL of 0.9% sodium chloride (Baxter, Sydney, NSW, Australia).

Online supplement – Combined MSC therapy and ECMO in experimental ARDS JE Millar et. al.
S13
F. Clinical measurements
Hemodynamic and ventilatory data (including data derived from the PAC) were
continuously monitored and automatically recorded at 5-minute intervals using a data
monitoring system (Solar 8000, GE Healthcare, Waukesha, WI, USA) coupled with custom
software. Pressure readings across the membrane oxygenator were made using a silicone-based
pressure transducer (Omega Engineering, Norwalk, CT, USA), these data were recorded
continuously using LabVIEW software (National Instruments, Austin, TX, USA). ECMO flow
readings and pump revolutions were read and recorded on an hourly basis from the
ROTAFLOW console (Maquet, Getinge Group, Rastatt, Germany). Urine and oro-gastric
outputs were recorded on a pre-piloted observation chart on an hourly basis, while continuous
temperature data were taken from the PAC.

Online supplement – Combined MSC therapy and ECMO in experimental ARDS JE Millar et. al.
S14
G. Blood and bronchoalveolar lavage fluid analyses
Blood
Whole blood was sampled from the facial artery catheter. Arterial blood gas analysis
was undertaken on at least an hourly basis (ABL800 FLEX, Radiometer, Copenhagen,
Denmark). At baseline, T-1, T0, T1-4, T6, T14, T23, and T24, blood was sampled for routine
laboratory hematological and biochemical testing. These tests were undertaken in a blinded
fashion by an accredited veterinary pathology laboratory (IDEXX Laboratories Pty. Ltd.,
Brisbane, QLD, Australia). At baseline, T-1, T0, T1-4, T6, T14, T23, and T24, blood was sampled
for plasma cytokine measurements. The concentration of IL-6, IL-1β, IL-8 and IL-10 in plasma
and bronchoalveolar lavage (BAL) fluid was quantified by in-house ELISAs using methods
published previously (3-5). Positive internal controls were used to ensure that inter- and intra-
plate variability was < 10% and confirm the precision and accuracy of all ELISA assays.
Bronchoalveolar lavage fluid
BAL was undertaken by an experienced bronchoscopist using a video bronchoscope
(aScope™, Ambu, Ballerup, Denmark). At each examination the right and left middle and
lower lobes were sampled. Each lobe was injected with 20 mL sterile 0.9% sodium chloride
(Baxter, Sydney, NSW, Australia) and gentle suction was applied. The lavage fluid was
collected in a sterile universal container. BAL fluid was centrifuged, and the supernatant
collected for ELISA analysis. Aliquots were also cytospun onto slides for inflammatory cell
counts.

Online supplement – Combined MSC therapy and ECMO in experimental ARDS JE Millar et. al.
S15
H. Histological analyses and lung tissue gene expression
After the confirmation of death, the heart and lungs were retrieved enbloc via a midline
sternotomy. Lung tissue was set on ice and portions of left and right lower and upper lobe lung
tissue were fixed in 10% buffered formalin for at least 24 hours, processed and embedded in
paraffin. All sections (5 µm) were stained with haematoxylin and eosin. Sections were
examined by an independent, blinded, veterinary pathologist and scored for features of lung
injury (6).
Total RNA was isolated from lung tissue using the Invitrogen PureLink® RNA Mini Kit
(Thermo Fisher Scientific, VIC, Australia). All samples were DNase treated (Invitrogen DNA-
free™ DNA Removal kit; Thermo Fisher Scientific) and the concentration of RNA determined
using a NanoDrop ND-1000 spectrophotometer (NanoDrop Technologies, DE, USA). First
strand cDNA was synthesized from 1μg of RNA (iScript™ Select cDNA Synthesis kit; Bio-
Rad, NSW, Australia).
A non-exhaustive panel of genes associated with epithelial, endothelial, and coagulative
function were analysed. These genes have been associated with dysfunction in ARDS. In
addition, a panel of matrix metalloproteinase genes and their regulators were analysed. Real-
time Quantitative PCR was performed using primers for MMP1, MMP2, MMP7, TIMP1,
TIMP2, AGER, VEGFA, ANGPT2, F3, vWF and SFTPD (PrimerDesign, Southampton, UK)
with PrecisionFAST qPCR SYBR Green Master Mix with low ROX (Primer Design).
Reactions consisted of 10 μL SYBR Green Master Mix, 1 μL mixed primers (300 nM), and 5
μL of cDNA (equivalent to 50 ng) and nuclease free water to a final volume of 20 μL. The
cycling conditions were as follows: cDNA was denatured at 95°C for 2 min, followed by 40
cycles of 95°C for 5 s and 60°C for 20 s. Melt curve analysis was programmed at the end of
the run, 60–90°C with increments rising by 0.5°C each step and a 5 s hold at each degree to

Online supplement – Combined MSC therapy and ECMO in experimental ARDS JE Millar et. al.
S16
determine reaction specificity and the absence of contamination, mispriming and primer dimer.
A no-template control was included for each primer set. An ovine specific SYBR Green
reference gene assay (Primer Design) was used to evaluate the stability of six candidate
normalization genes (GAPDH, RPL19, β-2M, ACTB, RPS26, YWHAZ) using real-time
quantitative PCR. The Qbase PLUS program was used to identify the most stably expressed
housekeeping genes and all data was subsequently normalized to geomean of GAPDH and
RPL19.
Gene
Symbol
Gene Name Forward primer
(5'→3')
Reverse
primer (5'→3')
Amplicon
size (bp)
PCR
Efficiencya
MMP1 Matrix
metallopeptidase 1
CGTGACTCAGT
TTGTTCTTACTC
C
GTGTGACATT
GCTCCAGAGT
TG
149
1.99
MMP2 Matrix
metallopeptidase 2
ACAAATTCTGG
AGATACAATGA
GGT
CAGGTCCACC
ACAGCATCC
113 1.95
MMP7 Matrix
metallopeptidase 7
TCCCAACCAGA
ATTAAAGAACA
CTG
GGAGACGCAT
AGATGAGTAA
GACA
147
1.99
TIMP1 Tissue inhibitor of
metallopeptidase 1
GCCTTATACCA
GCGTTATGAGA
T
GCAGGGGTGT
AGATGAATCG
98
1.96
TIMP2 Tissue inhibitor of
metallopeptidase 2
GGACTCTGGCA
ACGACATCTA
CTGGTCAGGT
CCCTTGAACA
T
88
1.99
AGER Advanced
glycosylation end-
product specific
receptor
CCAGCCCAGTT
CTCCTCTGTA
GGCAGGTGTT
TACTCATCAC
TTTC
98
2.00
VEGFA Vascular endothelial
growth factor A
TCACCAGGAAA
GACTGACACAG
CTGGATTCAG
GATTGTTCTGT
CG
93
1.94
ANGPT2 Angiopoietin 2 GCACATAGTTC
AACTTCGGTCA
A
TGCTGCTTTTG
GAGAACTGAA
TTA
141
1.91

Online supplement – Combined MSC therapy and ECMO in experimental ARDS JE Millar et. al.
S17
Gene
Symbol
Gene Name Forward primer
(5'→3')
Reverse
primer (5'→3')
Amplicon
size (bp)
PCR
Efficiencya
F3 Coagulation factor
III, tissue factor
AAGCCAGATTA
TCTAAGGAAAG
ACAAA
AGTCCACCCA
GTTTCACCTTA
C
125
1.93
vWF von Willebrand
factor
GGAGGTGAAG
CACAGTGGC
CCAGGTAAGG
GACAGAGACC
A
89
2.11
SFTPD Surfactant protein D CCTCCATGTCT
ACCAACCATCG
CTGAGCAGCC
AGGAAGATAA
GAA
109
2.08
Table D. Primers used in qPCR analysis.
a PCR efficiencies were determined using the formula 10-1/slope

Online supplement – Combined MSC therapy and ECMO in experimental ARDS JE Millar et. al.
S18
I. Analyses of membrane oxygenators
At the cessation of VV-ECMO (T23) the circuit was disassembled and the membrane
oxygenator (MO) was recovered. The MO was rinsed with 0.9% sodium chloride (Baxter,
Sydney, NSW, Australia) until the effluent was observed to be clear, after which the MO was
infused with 500 mL formaldehyde and then sealed. MOs were stored at 5° C overnight and
then opened using a commercially available band saw. The fiber bundle was extracted, and
approximate 5 cm x 5 cm sections were taken from the heat and gas exchange sections. These
were stored in sterile containers in Phosphate Buffered Saline (PBS) until they were analyzed.
For immunohistochemical detection of MSCs, approximately 1 cm x 1 cm fiber sections
were blocked for 3 hours in 2% HISS (heat inactivated sheep serum) and 0.5% triton X-100 in
PBS. The samples were washed 3 times in PBS for 5 minutes each, followed by overnight
incubation with primary antibodies at 4°C. After primary incubation, the fiber sections were
washed 3 times in PBS for 5 minutes each, incubated in secondary antibody solution for 1 hour
at room temperature, and then washed an additional 3 times in PBS for 5 minutes each. Primary
antibodies: mouse Ab to CD105-FITC (ab18278, 1:10), rabbit Ab to CD73 (ab175396, 1:50),
goat Ab to CD90 (ab189367, 1:100). Secondary antibodies: donkey anti-mouse 488
(Invitrogen, 1:100), donkey anti-rabbit 647 (Invitrogen, 1:100), donkey anti-goat 568
(Invitrogen, 1:100). Nuclei were counterstained with 1 µg/mL DAPI (4′,6-diamidino-2-
phenylindole, Sigma-Aldrich, NSW, Australia) during secondary incubation. All antibodies
were diluted in blocking solution during primary and secondary incubations. A widefield Nikon
deconvolution microscope was used to acquire images using both 4X and 20X objectives. Final
images were processed with ImageJ software.

Online supplement – Combined MSC therapy and ECMO in experimental ARDS JE Millar et. al.
S19
J. Sample size calculation
Prior to the study commencing, a sample size calculation was undertaken based on a primary
outcome of improvement in PaO2/FiO2 ratio. Using data from two previous trials of MSCs in
ovine models of ARDS (7, 8), we calculated that 7 animals per group were required to detect a
100 mmHg difference in PaO2/FiO2 ratio (alpha 0.05, power 0.9, outcome SD 42 mmHg, paired
test).

S20
J. Results supplement
Overall (n=14)
Carrier vehicle (n=7)
hMSCs (n=7)
At time of injury (T0)
Haemoglobin (g/L) 106.7 ± 8.3 112.6 ± 7.1 100.9 ± 4.3
Haematocrit 0.322 ± 0.030 0.339 ± 0.032 0.306 ± 0.010
White cell count (x10^9/L) 1.8 (1.0-2.3) 1.6 (1.0-2.1) 2.0 (1.1-3.0)
Neutrophil count (x10^9/L) 0.4 (0.2-0.9) 0.3 (0.2-0.4) 0.9 (0.2-1.4)
Lymphocyte count (x10^9/L) 1.1 (0.9-1.4) 1.1 (0.8-1.3) 1.0 (0.9-1.5)
Monocyte count (x10^9/L) 0.1 (0-0.2) 0.2 (0.1-0.3) 0.1 (0-0.1)
Prothrombin time (s) 15.3 ± 1.6 16.3 ± 1.3 14.5 ± 1.3
Activated partial thromboplastin
time (s) 24.6 ± 2.5 24.0 ± 3.0 25.2 ± 2.0
Sodium (mmol/L) 139 ± 3 140 ± 2 137 ± 3
Potassium (mmol/L) 3.6 (3.3-3.9) 3.6 (3.3-4.0) 3.5 (3.4-3.8)
Chloride (mmol/L) 106 (105-106) 106 (105-107) 105 (103-106)
Urea (mmol/L) 5.7 ± 1.1 5.9 ± 1.0 5.5 ± 1.3
Creatinine (mmol/L) 0.07 (0.06-0.07) 0.07 (0.06-0.07) 0.06 (0.06-0.07)
Albumin (g/L) 26 ± 2 26 ± 2 27 ± 2
Bilirubin (µmol/L) 3 (1-4) 3 (3-5) 1 (1-3)
Alkaline phosphatase (IU/L) 102 ± 26 89 ± 22 114 ± 23
Aspartate aminotransferase (IU/L) 83 (72-97) 82 (72-95) 84 (73-103)
Creatinine kinase (IU/L) 205 (205-242) 242 (200-299) 191 (162-255)
Supplementary Table E1. Baseline hematological and biochemical characteristics.
S21
Overall (n=14)
Carrier vehicle (n=7)
hMSCs (n=7)
P value*
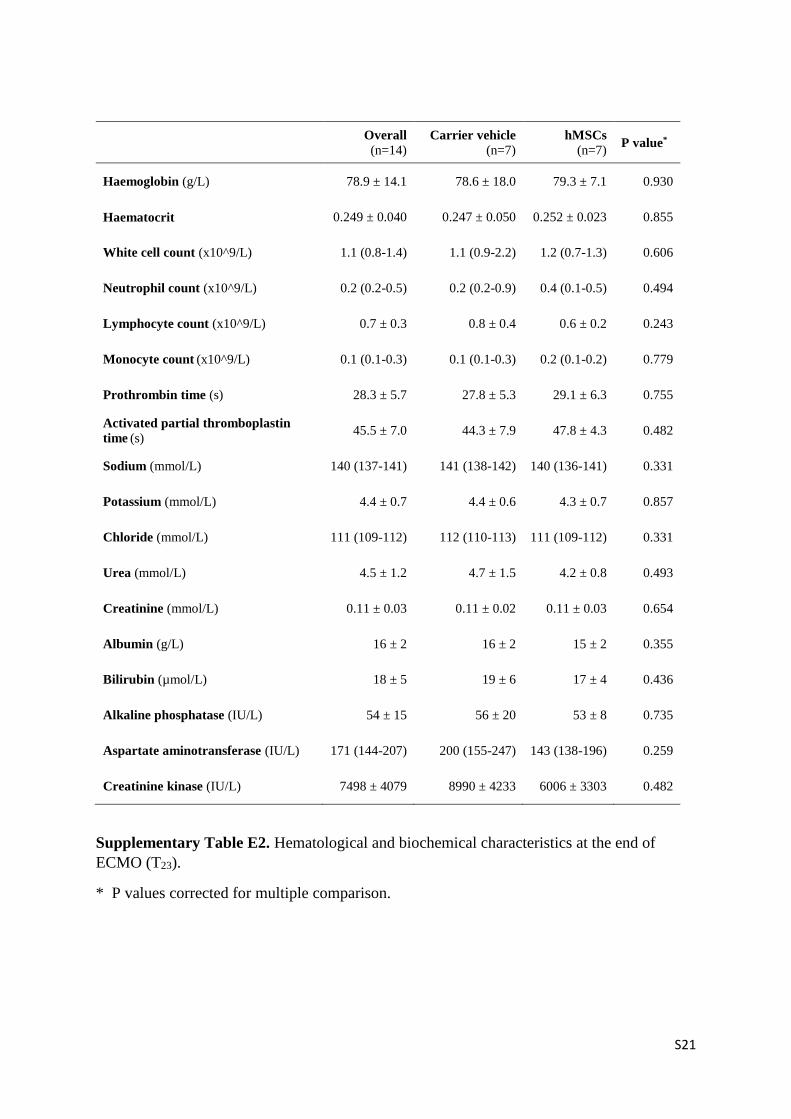
Haemoglobin (g/L) 78.9 ± 14.1 78.6 ± 18.0 79.3 ± 7.1 0.930
Haematocrit 0.249 ± 0.040 0.247 ± 0.050 0.252 ± 0.023 0.855
White cell count (x10^9/L) 1.1 (0.8-1.4) 1.1 (0.9-2.2) 1.2 (0.7-1.3) 0.606
Neutrophil count (x10^9/L) 0.2 (0.2-0.5) 0.2 (0.2-0.9) 0.4 (0.1-0.5) 0.494
Lymphocyte count (x10^9/L) 0.7 ± 0.3 0.8 ± 0.4 0.6 ± 0.2 0.243
Monocyte count (x10^9/L) 0.1 (0.1-0.3) 0.1 (0.1-0.3) 0.2 (0.1-0.2) 0.779
Prothrombin time (s) 28.3 ± 5.7 27.8 ± 5.3 29.1 ± 6.3 0.755
Activated partial thromboplastin
time (s) 45.5 ± 7.0 44.3 ± 7.9 47.8 ± 4.3 0.482
Sodium (mmol/L) 140 (137-141) 141 (138-142) 140 (136-141) 0.331
Potassium (mmol/L) 4.4 ± 0.7 4.4 ± 0.6 4.3 ± 0.7 0.857
Chloride (mmol/L) 111 (109-112) 112 (110-113) 111 (109-112) 0.331
Urea (mmol/L) 4.5 ± 1.2 4.7 ± 1.5 4.2 ± 0.8 0.493
Creatinine (mmol/L) 0.11 ± 0.03 0.11 ± 0.02 0.11 ± 0.03 0.654
Albumin (g/L) 16 ± 2 16 ± 2 15 ± 2 0.355
Bilirubin (µmol/L) 18 ± 5 19 ± 6 17 ± 4 0.436
Alkaline phosphatase (IU/L) 54 ± 15 56 ± 20 53 ± 8 0.735
Aspartate aminotransferase (IU/L) 171 (144-207) 200 (155-247) 143 (138-196) 0.259
Creatinine kinase (IU/L) 7498 ± 4079 8990 ± 4233 6006 ± 3303 0.482
Supplementary Table E2. Hematological and biochemical characteristics at the end of
ECMO (T23).
* P values corrected for multiple comparison.

S22
Supplementary Table E3. Hematological and biochemical characteristics at T24.
* P values corrected for multiple comparison.
Overall (n=14)
Carrier vehicle (n=7)
hMSCs (n=7)
P value*
Haemoglobin (g/L) 87.5 ± 13.6 86.0 ± 12.8 89.0 ± 14.2 0.733
Haematocrit 0.268 ± 0.040 0.265 ± 0.039 0.270 ± 0.041 0.846
White cell count (x10^9/L) 1.2 (1.0-1.6) 1.6 (1.1-2.0) 1.2 (0.9-1.3) 0.266
Neutrophil count (x10^9/L) 0.4 (0.1-0.6) 0.4 (0.2-0.8) 0.4 (0.1-0.6) 0.381
Lymphocyte count (x10^9/L) 0.7 (0.7-1.0) 1.0 (0.8-1.1) 0.7 (0.6-0.7) 0.047
Monocyte count (x10^9/L) 0.1 (0.1-0.1) 0.2 (0-0.3) 0.1 (0.1-0.1) 0.433
Prothrombin time (s) 29.5 ± 5.0 31.5 ± 5.9 27.9 ± 3.3 0.346
Activated partial thromboplastin
time (s) 47.3 ± 4.5 47.7 ± 3.3 47.0 ± 5.2 0.831
Sodium (mmol/L) 139 (138-141) 140 (138-142) 139 (135-140) 0.139
Potassium (mmol/L) 4.4 ± 0.5 4.5 ± 0.5 4.4 ± 0.6 0.886
Chloride (mmol/L) 111 ± 4 112 ± 5 110 ± 2 0.392
Urea (mmol/L) 4.3 ± 1.0 4.4 ± 1.2 4.2 ± 0.8 0.839
Creatinine (mmol/L) 0.11 ± 0.03 0.11 ± 0.02 0.11 ± 0.03 0.656
Albumin (g/L) 17 ± 2 17 ± 2 17 ± 1 0.896
Bilirubin (µmol/L) 19 ± 8 19 ± 9 18 ± 7 0.960
Alkaline phosphatase (IU/L) 57 ± 18 53 ± 24 58 ± 10 0.992
Aspartate aminotransferase
(IU/L) 190 (162-222) 185 (164-217) 191 (161-221) 0.931
Creatinine kinase (IU/L) 8008 ± 3351 8858 ± 2734 7157 ± 3679 0.415

S23
Supplementary Table E4. Bronchoalveolar lavage fluid cell counts.
Pooled BAL from right and left lower lobes. Two hundred cells per count. * P values
presented for mixed model group:time interaction.
Carrier vehicle (n=7)
hMSCs (n=7)
P value*
BAL Monocytes/macrophages (n/200 cells ± SD)
T-1 194 ± 4 193 ± 5 0.005
T0 189 ± 8 186 ± 10
T2 148 ± 37 163 ± 13
T3 100 ± 54 118 ± 36
T4 38 ± 28 74 ± 52
T6 33 ± 26 37 ± 28
T14 37 ± 38 14 ± 13
T23 21 ± 10 11 ± 12
BAL Neutrophils (n/200 cells ± SD)
T-1 4 ± 4 6 ± 5 0.008
T0 9 ± 6 12 ± 9
T2 51 ± 37 36 ± 9
T3 96 ± 54 80 ± 34
T4 156 ± 29 123 ± 51
T6 162 ± 26 158 ± 28
T14 160 ± 37 184 ± 13
T23 178 ± 11 186 ± 13
BAL Lymphocytes (n/200 cells ± SD)
T-1 2 ± 2 1 ± 1 0.169
T0 2 ± 6 2 ± 3
T2 1 ± 1 1 ± 1
T3 2 ± 3 0 ± 1
T4 2 ± 2 1 ± 1
T6 2 ± 3 0 ± 1
T14 1 ± 1 1 ± 1
T23 0 ± 1 2 ± 2
BAL Eosinophils (n/200 cells ± SD)
T-1 0 ± 0 0 ± 0 0.295
T0 0 ± 1 0 ± 1
T2 1 ± 1 1 ± 2
T3 2 ± 3 2 ± 2
T4 4 ± 4 2 ± 2
T6 3 ± 4 1 ± 2
T14 3 ± 3 1 ± 1
T23 2 ± 2 1 ± 1

S30
Supplementary figure E1. Bronchoscopic hMSC delivery
Volumes of carrier fluid instilled and location of delivery within the ovine pulmonary tree.

Online supplement – Combined MSC therapy and ECMO in experimental ARDS JE Millar et. al.
S25
Figure E2. ECMO management
a. ECMO system variables and gas exchange on ECMO. Points represent individual
observations. Dashed lines represent lower (PaO2) and upper (PaCO2) targets. b.
Anticoagulation during ECMO. Activated partial thromboplastin time (APTT) ratio and
heparin dose are presented as mean (± 95% confidence interval).

Online supplement – Combined MSC therapy and ECMO in experimental ARDS JE Millar et. al.
S26
Figure E3. Lung tissue qPCR
a. Matrix metalloproteinases (MMPs) and inhibitors (TIMPS). b. Tissue factor (F3). c.
Epithelial markers. AGER – receptor for advanced glycation endpoints, SPFTD – surfactant
protein D. d. Endothelial markers. ANGPT2 – angiopoietin-2, VEGFA – vascular endothelial
growth factor A, vWF – von Willebrand factor. Results are presented as mean (± 95%
confidence interval).

Online supplement – Combined MSC therapy and ECMO in experimental ARDS JE Millar et. al.
S27
Figure E4. Bronchoalveolar lavage fluid cytokines
Data presented as mean (± 95% confidence interval). Where error bars intersect the x axis the
95% CI includes zero. * - p <0.05.

Online supplement – Combined MSC therapy and ECMO in experimental ARDS JE Millar et. al.
S28
Figure E5. Plasma cytokines and leukocytes

Online supplement – Combined MSC therapy and ECMO in experimental ARDS JE Millar et. al.
S29
a. Plasma cytokine concentrations. b. Leukocyte counts in whole blood. Data presented as
mean (± 95% confidence interval). Where error bars intersect the x axis the 95% CI includes
zero. . * - p <0.05.

Online supplement – Combined MSC therapy and ECMO in experimental ARDS JE Millar et. al.
S30
Figure E6. Immunofluorescence of explanted oxygenator fibers.
DAPI - 4′,6-diamidino-2-phenylindole.
K. Supplement references
E1. Combes A, Hajage D, Capellier G, Demoule A, Lavoue S, Guervilly C, Da Silva D,
Zafrani L, Tirot P, Veber B, Maury E, Levy B, Cohen Y, Richard C, Kalfon P,
Bouadma L, Mehdaoui H, Beduneau G, Lebreton G, Brochard L, Ferguson ND, Fan
E, Slutsky AS, Brodie D, Mercat A. Extracorporeal Membrane Oxygenation for
Severe Acute Respiratory Distress Syndrome. N Engl J Med 2018; 378: 1965-1975.
2. Hare WC. The broncho-pulmonary segments in the sheep. J Anat 1955; 89: 387-402.
3. Dooley LM, Abdalmula A, Washington EA, Kaufman C, Tudor EM, Ghosh P, Itescu S,
Kimpton WG, Bailey SR. Effect of mesenchymal precursor cells on the systemic
inflammatory response and endothelial dysfunction in an ovine model of collagen-
induced arthritis. PloS one 2015; 10: e0124144.
4. Herndon CN, Foreyt WJ, Srikumaran S. Differential expression of interleukin-8 by
polymorphonuclear leukocytes of two closely related species, Ovis canadensis and
Ovis aries, in response to Mannheimia haemolytica infection. Infect Immun 2010; 78:
3578-3584.
5. Karisnan K, Bakker AJ, Song Y, Noble PB, Pillow JJ, Pinniger GJ. Interleukin-1 receptor
antagonist protects against lipopolysaccharide induced diaphragm weakness in
preterm lambs. PloS one 2015; 10: e0124390.
6. Matute-Bello G, Downey G, Moore BB, Groshong SD, Matthay MA, Slutsky AS, Kuebler
WM. An official American Thoracic Society workshop report: features and

Online supplement – Combined MSC therapy and ECMO in experimental ARDS JE Millar et. al.
S31
measurements of experimental acute lung injury in animals. Am J Resp Cell Mol
2011; 44: 725-738.
7. Asmussen S, Ito H, Traber DL, Lee JW, Cox RA, Hawkins HK, McAuley DF, McKenna
DH, Traber LD, Zhuo H, Wilson J, Herndon DN, Prough DS, Liu KD, Matthay MA,
Enkhbaatar P. Human mesenchymal stem cells reduce the severity of acute lung
injury in a sheep model of bacterial pneumonia. Thorax 2014; 69: 819-825.
8. Rojas M, Cardenes N, Kocyildirim E, Tedrow JR, Caceres E, Deans R, Ting A, Bermudez
C. Human adult bone marrow-derived stem cells decrease severity of
lipopolysaccharide-induced acute respiratory distress syndrome in sheep. Stem Cell
Res Ther 2014; 5: 42.