
Combined effects of diffuse phase transition and microstructure on the electrocaloric effect in...
5
Combined effects of diffuse phase transition and microstructure on the electrocaloric effect in Ba1xSrxTiO3 ceramics Yang Bai, Xi Han, Kai Ding, and Li-Jie Qiao Citation: Applied Physics Letters 103, 162902 (2013); doi: 10.1063/1.4825266 View online: http://dx.doi.org/10.1063/1.4825266 View Table of Contents: http://scitation.aip.org/content/aip/journal/apl/103/16?ver=pdfcov Published by the AIP Publishing This article is copyrighted as indicated in the article. Reuse of AIP content is subject to the terms at: http://scitation.aip.org/termsconditions. Downloaded to IP: 93.180.53.211 On: Tue, 18 Feb 2014 11:38:00
Transcript of Combined effects of diffuse phase transition and microstructure on the electrocaloric effect in...

Combined effects of diffuse phase transition and microstructure on the electrocaloriceffect in Ba1xSrxTiO3 ceramicsYang Bai, Xi Han, Kai Ding, and Li-Jie Qiao Citation: Applied Physics Letters 103, 162902 (2013); doi: 10.1063/1.4825266 View online: http://dx.doi.org/10.1063/1.4825266 View Table of Contents: http://scitation.aip.org/content/aip/journal/apl/103/16?ver=pdfcov Published by the AIP Publishing
This article is copyrighted as indicated in the article. Reuse of AIP content is subject to the terms at: http://scitation.aip.org/termsconditions. Downloaded to IP:
93.180.53.211 On: Tue, 18 Feb 2014 11:38:00

Combined effects of diffuse phase transition and microstructureon the electrocaloric effect in Ba12xSrxTiO3 ceramics
Yang Bai (白洋),a) Xi Han (韩茜), Kai Ding (丁凯), and Li-Jie Qiao (乔利杰)Key Laboratory of Environmental Fracture (Ministry of Education), University of Science and Technology Beijing,Beijing 100083, China
(Received 9 August 2013; accepted 28 September 2013; published online 16 October 2013)
This paper demonstrates the combined effects of diffuse phase transition and microstructure on the
electrocaloric effect (ECE) in Ba1�xSrxTiO3 (x¼ 0.2–0.4) ferroelectric ceramics. The ECE was
characterized by direct heat flow measurement and an indirect thermodynamic method, which both
provided consistent results. With increasing amount of Sr, the phase transition diffused and the
grains grew larger. Since larger grains favor a high DTmax while a diffuse phase transition does not,
the combination of these two effects induced nonmonotonic variation of the ECE. The x¼ 0.35
sample showed the best performance, with an ECE strength of 0.23K�m/MV near room
temperature.VC 2013 AIP Publishing LLC. [http://dx.doi.org/10.1063/1.4825266]
Recently, the electrocaloric effect (ECE) of ferroelec-
trics has attracted a lot of interest, because of its potential
applications in solid-state refrigeration. The ECE is regarded
as the best solution for cooling microelectronic devices-it is
easy to miniaturize, highly efficient, and low cost. Since
the observation of a giant ECE, DTmax¼ 12K, in
PbZr0.95Ti0.05O3 thin films in 2006,1 giant ECEs have been
reported for various ferroelectric ceramic and polymer
films.2–11
The ECE is only significant in the near vicinity of a
phase transition, so it is thought to be closely related to the
features of the phase transition.12 Our previous work
revealed that the ECE near first order phase transitions
(FOPT) was dominated by the energy change of the lattice
structure, rather than the entropy change from polarization
ordering.13 Moya reported that the ECE strength (jDT/DEj)is determined by the sharpness of a transition.14 It has also
been shown, both theoretically and experimentally, that
when a transition is diffuse, the peak value of the ECE may
be reduced, and the peak may be widened.15,16 Besides the
intrinsic nature of the material, the ECE of ferroelectric
ceramics is sensitive to the microstructure, as are many other
ferroelectric properties. However, the combined effect of the
nature of the phase transition and the microstructure of sin-
tered ceramics has not previously been considered and is the
subject of this paper. We selected Ba1�xSrxTiO3 ceramics
for investigation, because the substitution of Sr for Ba can
gradually make the typical FOPT of BaTiO3 diffuse, and
modify the microstructure at the same time.
Ba1�xSrxTiO3 (x¼ 0.2� 0.4) ceramics were prepared
from analytical reagent grade BaCO3, SrCO3, and TiO2 by a
conventional ceramic method. After calcining at 1000 �C, apure perovskite phase was obtained. The resulting powders
were dry-pressed and sintered at 1350 �C.Scanning electron microscopy images of the microstruc-
tures of the sintered samples are shown in Fig. 1. All samples
exhibited dense microstructures with the measured density
over 95% of the theoretical density. With increasing amount
of Sr, the grains became larger. At x¼ 0.25, the grain size
was 1� 2 lm, and it became >20 lm at x¼ 0.4. When Ba2þ
is partly substituted by Sr2þ (which has a smaller radius), the
lattice deficiencies can promote grain growth during the sin-
tering process; the effects of this become more obvious
when the proportions of the two ions are similar.
The thermal characteristics of the tetragonal-cubic (T-C)
phase transition were measured with a differential scanning
calorimeter (DSC, TA Instruments Q2000) and are shown in
Fig. 2. With increasing x, the endothermic peak shifts to lower
temperature and becomes less sharp, indicating that the phase
transition has gradually become diffuse. The phase transition
temperature and the latent heat are plotted in the inset of
Fig. 2. Both show linear decreases: T1¼�339xþ 130 (�C)and H¼�1.67xþ 0.87 (J/g). The phase transition temperature
is taken here as T1 in the Landau-Devonshire theory, i.e., the
highest temperature where the low-temperature phase exists in
a metastable state under zero-field. The intercepts of 130 �Cand 0.87 J/g in the linear fits agree well with the transition tem-
perature and latent heat of pure BaTiO3. This implies that the
substitution of Sr for Ba diffuses the phase transition, and
reduces the latent heat.
FIG. 1. The microstructure of the samples sintered at 1350 �C.
a)Author to whom correspondence should be addressed. Electronic mail:
[email protected]. Fax: þ86-10-62332345.
0003-6951/2013/103(16)/162902/4/$30.00 VC 2013 AIP Publishing LLC103, 162902-1
APPLIED PHYSICS LETTERS 103, 162902 (2013)
This article is copyrighted as indicated in the article. Reuse of AIP content is subject to the terms at: http://scitation.aip.org/termsconditions. Downloaded to IP:
93.180.53.211 On: Tue, 18 Feb 2014 11:38:00
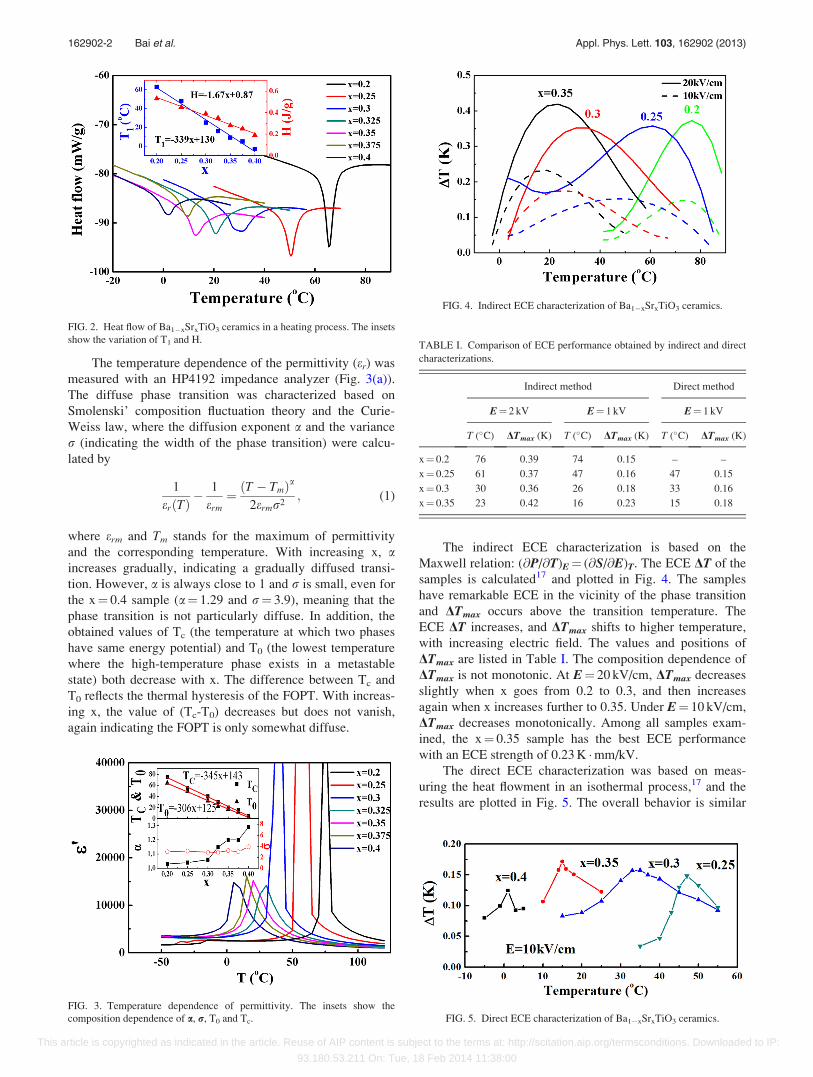
The temperature dependence of the permittivity (er) wasmeasured with an HP4192 impedance analyzer (Fig. 3(a)).
The diffuse phase transition was characterized based on
Smolenski’ composition fluctuation theory and the Curie-
Weiss law, where the diffusion exponent a and the variance
r (indicating the width of the phase transition) were calcu-
lated by
1
erðTÞ �1
erm¼ ðT � TmÞa
2ermr2; (1)
where erm and Tm stands for the maximum of permittivity
and the corresponding temperature. With increasing x, aincreases gradually, indicating a gradually diffused transi-
tion. However, a is always close to 1 and r is small, even for
the x¼ 0.4 sample (a¼ 1.29 and r¼ 3.9), meaning that the
phase transition is not particularly diffuse. In addition, the
obtained values of Tc (the temperature at which two phases
have same energy potential) and T0 (the lowest temperature
where the high-temperature phase exists in a metastable
state) both decrease with x. The difference between Tc and
T0 reflects the thermal hysteresis of the FOPT. With increas-
ing x, the value of (Tc-T0) decreases but does not vanish,
again indicating the FOPT is only somewhat diffuse.
The indirect ECE characterization is based on the
Maxwell relation: (@P/@T)E¼ (@S/@E)T. The ECE DT of the
samples is calculated17 and plotted in Fig. 4. The samples
have remarkable ECE in the vicinity of the phase transition
and DTmax occurs above the transition temperature. The
ECE DT increases, and DTmax shifts to higher temperature,
with increasing electric field. The values and positions of
DTmax are listed in Table I. The composition dependence of
DTmax is not monotonic. At E¼ 20 kV/cm, DTmax decreases
slightly when x goes from 0.2 to 0.3, and then increases
again when x increases further to 0.35. Under E¼ 10 kV/cm,
DTmax decreases monotonically. Among all samples exam-
ined, the x¼ 0.35 sample has the best ECE performance
with an ECE strength of 0.23K �mm/kV.
The direct ECE characterization was based on meas-
uring the heat flowment in an isothermal process,17 and the
results are plotted in Fig. 5. The overall behavior is similar
FIG. 2. Heat flow of Ba1�xSrxTiO3 ceramics in a heating process. The insets
show the variation of T1 and H.
FIG. 3. Temperature dependence of permittivity. The insets show the
composition dependence of a, r, T0 and Tc.
FIG. 4. Indirect ECE characterization of Ba1�xSrxTiO3 ceramics.
TABLE I. Comparison of ECE performance obtained by indirect and direct
characterizations.
Indirect method Direct method
E¼ 2 kV E¼ 1 kV E¼ 1 kV
T (�C) DTmax (K) T (�C) DTmax (K) T (�C) DTmax (K)
x¼ 0.2 76 0.39 74 0.15 – –
x¼ 0.25 61 0.37 47 0.16 47 0.15
x¼ 0.3 30 0.36 26 0.18 33 0.16
x¼ 0.35 23 0.42 16 0.23 15 0.18
FIG. 5. Direct ECE characterization of Ba1�xSrxTiO3 ceramics.
162902-2 Bai et al. Appl. Phys. Lett. 103, 162902 (2013)
This article is copyrighted as indicated in the article. Reuse of AIP content is subject to the terms at: http://scitation.aip.org/termsconditions. Downloaded to IP:
93.180.53.211 On: Tue, 18 Feb 2014 11:38:00

to that found in the indirect measurement, i.e., a significant
peak occurs just above the phase transition temperature. The
good agreement between the results of the direct and indirect
measurements confirms their validity.
The ECE depends on the change of ordering entropy,
lattice energy, and electric polarization energy during the
application or removal of the field. Previous reports indicated
that the ECE near a FOPT is dominated by the energy
change associated with the change of the lattice structure,
which can be two orders of magnitude higher than the en-
tropy change of dipolar order.13 The energy change associ-
ated with the diffused transition will be spread over a range
of temperatures, and result in a lower DTmax.15,16 The typical
FOPT of pure BaTiO3 tends to be diffused by Sr substitution,
and this diffusion is expected to lower DTmax. However, the
ECE of ferroelectric ceramics is also affected by microstruc-
ture. It has been shown theoretically that larger grain sizes
should promote the ECE, because the grain boundaries have
weaker ferroelectricity than that of the grains.18,19 Taking an
extreme example, a BaTiO3 single crystal has a much larger
ECE than that of polycrystalline BaTiO3 ceramics, although
both materials have the same composition and even similar
density. In our previous work, a BaTiO3 single crystal
showed an ECE of DTmax¼ 4.8K under 10 kV/cm, while
that of the corresponding ceramic was only 0.5K. The ECE
of the Ba1�xSrxTiO3 ceramics has a complicated composi-
tion dependence, because of the combined effects of the
diffuse phase transition and the microstructure.
Among the Ba1�xSrxTiO3 samples, the x¼ 0.35 sample
has the largest ECE, with an ECE strength of 0.23K �mm/kV
at 16 �C near room temperature (RT). Previously reported
ECEs in ferroelectric ceramics were always at high tempera-
tures, >100 �C, but there is an urgent need for RT microre-
frigerator for microelectronic devices. The operating
temperature near RT will facilitate RT applications. Among
the ECE materials with operating temperatures near RT,20–26
the Ba0.65Sr0.35TiO3 in this work has a fairly high DTmax, as
shown in Table II; its ECE strength is higher than those of
most ceramics, and is only slightly lower than that of the
PMN-PT single crystal. Recently, Liu reported the ECE of
spark-plasma-sintered Ba0.65Sr0.35TiO3 ceramics, and found
an ECE strength similar to that found on our work.26
The ECE of Ba1�xSrxTiO3 ceramics was investigated by
direct heat flow measurement and an indirect thermodynamic
method. The ECE performance was determined by the fea-
tures of the phase transition and the microstructure of the
ceramics. In Ba1�xSrxTiO3 ceramics, a greater amount of Sr
led to a more diffuse phase transition (which lowers DTmax)
and induced larger grains (which increases DTmax), so the
variation of the ECE with Sr content for our samples was
complicated. Of the samples examined, Ba0.65Sr0.35TiO3 had
the best performance, with an ECE strength of 0.23K�mm/kV
near RT. This material may potentially be applied in RT re-
frigeration for microelectronic devices.
This work was supported by Grants from the National
Science Foundation of China (51172020, 51072021, and
51372018), the Program for New Century Excellent Talents
in University (NCET-12-0780), the Fundamental Research
Funds for the Central Universities (FRF-TP-09-028A), and
the Program for Changjiang Scholars and Innovative
Research Team in University (IRT1207).
1S. Mischenko, Q. Zhang, J. F. Scott, R. W. Whatmore, and N. D. Mathur,
Science 311, 1270 (2006).2A. S. Mischenko, Q. Zhang, R. W. Whatmore, J. F. Scott, and N. D.
Mathur, Appl. Phys. Lett. 89, 242912 (2006).3B. Neese, B. Chu, S. G. Lu, Y. Wang, E. Furman, and Q. M. Zhang,
Science 321, 821 (2008).4S. G. Lu, B. Rozic, Q. M. Zhang, Z. Kutnjak, X. Li, E. Furman, L. J.
Gorny, M. Lin, B. Malic, M. Kosec, R. Blinc, and R. Pirc, Appl. Phys.
Lett. 97, 162904 (2010).5H. Chen, T. Ren, X. Wu, Y. Yang, and L. Liu, Appl. Phys. Lett. 94,182902 (2009).
6T. M. Correia, J. S. Young, R. W. Whatmore, J. F. Scott, N. D. Mathur,
and Q. Zhang, Appl. Phys. Lett. 95, 182904 (2009).7T. M. Correia, S. Kar-Narayan, J. S. Young, J. F. Scott, N. D. Mathur,
R. W. Whatmore, and Q. Zhang, J. Phys. D: Appl. Phys. 44, 165407
(2011).8Y. Bai, G. P. Zheng, and S. Q. Shi, Appl. Phys. Lett. 96, 192902 (2010).9Y. Bai, G. P. Zheng, K. Ding, L. J. Qiao, S. Q. Shi, and D. Guo, J. Appl.
Phys. 110, 094103 (2011).10Z. Feng, D. Shi, and S. Dou, Solid State Commun. 151, 123 (2011).11R. Chukka, J. Cheah, Z. Chen, P. Yang, S. Shannigrahi, J. Wang, and L.
Chen, Appl. Phys. Lett. 98, 242902 (2011).12Y. Bai, K. Ding, G. P. Zheng, S. Q. Shi, and L. Qiao, Phys. Status Solidi A
209, 941 (2012).13Y. Bai, K. Ding, G. P. Zheng, S. Q. Shi, J. L. Cao, and L. J. Qiao, AIP
Adv. 2, 022162 (2012).14X. Moya, E. Stern-Taulats, S. Crossley, D. Gonzalez-Alonso, S. Kar-
Narayan, A. Planes, L. Manosa, and N. D. Mathur, Adv. Mater. 25, 1360(2013).
15Y. Bai, X. Han, and L. J. Qiao, Appl. Phys. Lett. 102, 252904 (2013).16B. Li, W. J. Ren, X. W. Wang, H. Meng, X. G. Liu, Z. J. Wang, and Z. D.
Zhang, Appl. Phys. Lett. 96, 102903 (2010).17See supplementary material at http://dx.doi.org/10.1063/1.4825266 for the
experimental details.18J. H. Qiu and Q. Jiang, J. Appl. Phys. 105, 034110 (2009).
TABLE II. Comparison of ferroelectric ceramics with operating temperature near RT.
Material T ( �C) DTmax (K) E (kV/cm) DT/DE (K�mm/kV) Ref.
Ba0.65Sr0.35TiO3 ceramics 16 0.23 10 0.23 This work
Ba0.65Sr0.35TiO3 ceramics 23 0.42 20 0.21 This work
Ba0.65Sr0.35TiO3 ceramics 30 2.1 90 0.23 26
(Pb0.97�xLa0.02Bax)(Zr0.72Sn0.22Ti0.06)O3 ceramics 30 0.25 22 0.11 22
PZT-5 ceramics 30 0.15 28 0.05 21
Ba0.91Ca0.09Zr0.14Ti0.86O3 ceramics 60 0.3 20 0.15 15
0.9Pb(Mg1/3Nb2/3)O3-0.1PbTiO3 ceramics 50 0.45 29.1 0.15 23
0.9Pb(Mg1/3Nb2/3)O3-0.1PbTiO3 single crystal 50 1 40 0.25 25
Ba0.98Ca0.02Zr0.085Ti0.915O3 ceramics 85 0.6 40 0.15 20
162902-3 Bai et al. Appl. Phys. Lett. 103, 162902 (2013)
This article is copyrighted as indicated in the article. Reuse of AIP content is subject to the terms at: http://scitation.aip.org/termsconditions. Downloaded to IP:
93.180.53.211 On: Tue, 18 Feb 2014 11:38:00

19C. Fang, D. X. Zhou, and S. P. Gong, Physica B 406, 1317 (2011).20J. F. Wang, T. Q. Yang, S. C. Chen, G. Li, Q. F. Zhang, and X. Yao,
J. Alloys Compd. 550, 561 (2013).21J. F. Wang, T. Q. Yang, K. Wei, and X. Yao, Appl. Phys. Lett. 102,152907 (2013).
22J. F. Wang, T. Q. Yang, S. C. Chen, G. Li, and X. Yao, J. Alloys Compd.
539, 280 (2012).
23L. Shebanovs, K. Borman, W. N. Lawless, and A. Kalvane, Ferroelectrics
273, 137 (2002).24V. V. Shvartsman and E. D. Politova, Ferroelectrics 257, 75 (2001).25L. H. Luo, H. B. Chen, Y. J. Zhu, W. P. Li, H. S. Luo, and Y. P. Zhang,
J. Alloys Compd. 509, 8149 (2011).26X. Q. Liu, T. T. Chen, Y. J. Wu, and X. M. Chen, J. Am. Ceram. Soc. 96,1021 (2013).
162902-4 Bai et al. Appl. Phys. Lett. 103, 162902 (2013)
This article is copyrighted as indicated in the article. Reuse of AIP content is subject to the terms at: http://scitation.aip.org/termsconditions. Downloaded to IP:
93.180.53.211 On: Tue, 18 Feb 2014 11:38:00