Structures of Escherichia coli DNA adenine methyltransferase

Chromatin, Epigenetics, and RNA Regulation
Combined AURKA and H3K9 MethyltransferaseTargeting Inhibits Cell Growth By InducingMitoticCatastropheAngela Mathison1,2, Ann Salmonson1,2, Mckenna Missfeldt1,2, Jennifer Bintz3,Monique Williams1,4, Sarah Kossak1,2, Asha Nair5, Thiago M. de Assuncao1,Trace Christensen4, Navtej Buttar1, Juan Iovanna3, Robert Huebert1,6, andGwen Lomberk1,2,6,7
Abstract
The current integrative pathobiologic hypothesis states thatpancreatic cancer (PDAC) develops and progresses in responseto an interaction between known oncogenes and downstreamepigenomic regulators. Congruently, this study tests a new com-binatorial therapy based on the inhibition of the Aurora kinase A(AURKA) oncogene and one of its targets, theH3K9methylation–based epigenetic pathway. This therapeutic combination is effec-tive at inhibiting the in vitro growth of PDAC cells both, inmonolayer culture systems, and in three-dimensional spheroidsandorganoids. The combination also reduces the growthof PDACxenografts in vivo. Mechanistically, it was found that inhibitingmethyltransferases of the H3K9 pathway in cells, which arearrested in G2–M after targeting AURKA, decreases H3K9 meth-ylation at centromeres, induces mitotic aberrations, triggers anaberrant mitotic check point response, and ultimately leads to
mitotic catastrophe. Combined, these data describe for the firsttime a hypothesis-driven design of an efficient combinatorialtreatment that targets a dual oncogenic–epigenomic pathway toinhibit PDAC cell growth via a cytotoxic mechanism that involvesperturbation of normal mitotic progression to end in mitoticcatastrophe. Therefore, this new knowledge has significant mech-anistic value as it relates to the development of new therapies aswell as biomedical relevance.
Implications: These results outline a model for the com-bined inhibition of a genetic-to-epigenetic pathway toinhibit cell growth and suggest an important and provoc-ative consideration for harnessing the capacity of cell-cycleinhibitors to enhance the future use of epigenetic inhibitors.Mol Cancer Res; 15(8); 984–97. �2017 AACR.
IntroductionPancreatic cancer is the fourth leading cause of cancer-related
deaths in the United States, with a median survival of 6 months(1). PDAC presents with aggressive biology, rapid dissemination,and late diagnosis, leading to an incurable stage for which therapyis a challenge. Surgery remains the only curative modality, but is
only applicable to 10% of patients, with 5-year survival barely20% (2). Notably, PDAC is highly resistant to chemoradiation(3). Thus, there remains a crucial need for the development andevaluation of novel targeted therapies.
Current evidence suggests that PDAC results from a crosstalkbetween oncogenes and epigenetic regulators, which together areresponsible of the malignant phenotype. Thus, combinatorialtherapies targeting both components may provide a usefulapproach to ameliorate PDAC initiation and progression. Regard-ing pharmacologically targetable oncogenes, recent studies haveexamined the effects of inhibiting Aurora kinase A (AURKA) inPDAC (4, 5). AURKA is a G2–M kinase that plays crucial roles incell division (6). AURKA expression is aberrant in many malig-nancies, including PDAC (7). Altered AURKA activity contributesto tumor progression by inducing abnormal G2–M transition,centrosome amplification, and chromosome instability (8). Bothgenetic and pharmaceutical AURKA inhibition has cytostaticeffects through G2–M arrest (9, 10) and senescence (10). As thesecombined cellular effects lead to growth inhibition in PDAC cellsand xenografts (9), AURKA has become a molecular target forPDAC treatment.MLN8237 (alisertib) selectively inhibits AURKA(11) and is currently under phase I and II clinical trials for solidtumors and hematologic malignancies. However, its underlyingmechanisms are not fully understood deserving further investiga-tions into combinatorial therapies that may improve its effects.
Interestingly, AURKA phosphorylates proteins associated withmitotic regulation through spatially and temporally controlled
1Division of Gastroenterology and Hepatology, Mayo Clinic and Foundation,Rochester, Minnesota. 2Laboratory of Epigenetics and Chromatin Dynamics,Gastroenterology Research Unit, Department of Medicine, Mayo Clinic, Roche-ster, Minnesota. 3Centre de Recherche en Canc�erologie de Marseille (CRCM),INSERM U1068, CNRS UMR 7258, Aix-Marseille Universit�e and Institut Paoli-Calmettes, Parc Scientifique et Technologique de Luminy, Marseille, France.4Department of Biochemistry and Molecular Biology, Mayo Clinic, Rochester,Minnesota. 5Department of Health Science Research, Mayo Clinic, Rochester,Minnesota. 6Center for Cell Signaling in Gastroenterology, Mayo Clinic andFoundation, Rochester, Minnesota. 7Department of Molecular Pharmacologyand Experimental Therapeutics, Mayo Clinic, Rochester, Minnesota.
Note: Supplementary data for this article are available at Molecular CancerResearch Online (http://mcr.aacrjournals.org/).
Corresponding Author: Gwen Lomberk, Division of Gastroenterology andHepatology, Department of Medicine, Mayo Clinic, 200 First Street SW, Gug-genheim 10-42B, Rochester, MN 55905. Phone: 507-538-5636; Fax: 507-255-6318; E-mail: [email protected]
doi: 10.1158/1541-7786.MCR-17-0063
�2017 American Association for Cancer Research.
MolecularCancerResearch
Mol Cancer Res; 15(8) August 2017984
on May 14, 2018. © 2017 American Association for Cancer Research. mcr.aacrjournals.org Downloaded from
Published OnlineFirst April 25, 2017; DOI: 10.1158/1541-7786.MCR-17-0063

mechanisms (6), which include epigenetic regulators. We haveshown that amember of themethyl lysine 9 histone 3 (H3K9me)pathway, HP1g (CBX3), is phosphorylated by AURKA to supportnormal mitotic progression (12). The K9H3me histone mark towhich HP1 binds is established by the H3K9 histone methyl-transferases (HMT) G9a, GLP, SUV39H1, and SUV39H2. HP1, inconjunction with these proteins, forms a multimeric complexthat, in a timely manner, deposits and reads the H3K9me mark,genome-wide. Here, we investigate the effect of targeting both theAURKAandH3K9mepathways onPDACgrowth.Wefind that thetreatment of PDAC cells with individual drugs against AURKA orH3K9me HMTs inhibits cell growth. However, the combinationof these agents has an improved effect of reducing cell growththrough a cytotoxic effect. Enhanced inhibition of cell growthwith the combination is also observed in spheroid and organoidmodels. In vivo treatment of PDAC orthotopic xenografts with theH3K9me HMT inhibitor alone reduces PDAC growth, andincreased efficacy in PDAC growth reduction is observed incombination with the AURKA inhibitor over individual treat-ments. Confocal and electron microscopy, along with cell-cycleanalysis, demonstrate that the cytotoxic effect of this combinationis due to the induction of mitotic cell death. The cellular responseto combined treatment was also observed at the RNA-seq level,reflected by expression changes of genes involved in drug metab-olism, mitotic chromosome–associated noncoding regulatoryRNAs (mCAR), and genes associated with chromosome structure.Moreover, we observed a dramatic reduction in centromericH3K9 methylation in combination compared with individualinhibitors. Biochemical alterations of centromeres are known toactivate cell-cycle checkpoints and induce chromosomal instabil-ity (13). Congruently, at the molecular level, we find that whileAURKA inhibition alone triggers a Chk1-Cdc25c-Cdk1–depen-dent G2–M arrest, the combination with H3K9me HMT inhibi-tion regulates checkpoint proteins in a manner that allows thebypass of this G2–M arrest with downregulation of Chk1–p53pathway to ultimately culminate in mitotic catastrophe. There-fore, our data demonstrate that combined targetingofAURKAandthe epigenetic H3K9me HMT pathway decreases cytostatic effectsto increase their cytotoxicity. Furthermore, our experimentsunravel cellular and molecular mechanisms on how this combi-natorial therapy works to bring about mitotic catastrophe, whichis a desirable therapeutic outcome.
Materials and MethodsCell lines and reagents
Human PDAC cell lines were obtained from the ATCC andmaintained according to their recommendations. L3.6, originallyisolated byBruns and colleagues (14),was cultured in appropriatemedia. The mouse PDAC cell line Pan02, syngeneic to C57BL/6,was obtained from DTP, DCTD Tumor Repository (NationalCancer Institute, Bethesda, MD) and maintained according tothe manufacturer's recommendations. All cell lines were culturedat 37�C in a humidified incubator supplemented with 5% CO2
and passaged a maximum of 30 times prior to restarting culturesfrom cryogenically preserved stocks. Cell lines tested negative formycoplasma within the last 6 months, and due to low passage,were not authenticated by our laboratory. For orthotopic tumors,Pan02 cells were incubated for 72 hours with lentivirus to inducestable expression of luciferase. For in vitro studies, compoundswere dissolved in DMSO and stored as 100 mmol/L aliquots at
�80�C(MLN8237, SelleckChemicals, ApexBio) or�20�C(Chae-tocin, Sigma-Aldrich).
Cell growth and synergy assaysCell lines were treated with various concentrations of
MLN8237 or chaetocin, as indicated. Relative cell viability wasdetermined by colorimetric MTS assay (CellTiter 96 AQueousOne Solution Cell Proliferation Assay, Promega) according tothe manufacturer's suggestions. For drug combinations, cellswere treated with eight independent concentrations at a fixedratio (1:2) or five independent concentrations at fixed ratios(1:3 or 1:5) of chaetocin:MLN8237. The fraction affected (Fa)was calculated on the basis of MTS measurements of treatedsamples normalized to untreated controls and the maximumbiological effect of each cell line. A combination index (CI) wascalculated by the median–drug effect analysis method devel-oped by Chou and Talalay (15) using the CompuSyn software(ComboSyn, Inc), where CI < 1, 1, or > 1 indicates synergistic,additive, and antagonistic effect, respectively.
Clonogenic assaysPDAC cells were plated on 60-mm dishes at 10% confluence
(1.5 � 104). After drug exposure, cells were fixed for 10 minuteswith 10% methanol/10% acetic acid and subsequently stainedwith 0.1% crystal violet (Sigma-Aldrich). Cell density was quan-tified by ImageJ (16).
Spheroid and organoid assaysPANC-1 cells were allowed to form spheroids in a three-
dimensional (3D) methylcellulose matrix (17). After 4 days,media were replaced and drugs added. After 72 hours of treat-ment, viability was measured by APH assay (17) on the Bio-RadiMark Microplate reader at 415 nm. Organoid cultures wereestablished following previously published protocol (18).Briefly, male Ela-Kras mice (19) were euthanized, pancreas asep-tically removed, digested, and ducts were isolated and grown inMatrigel (Corning) domes. One day prior to treatment, organoidswere split into 96-well plates with Matrigel. Viability was assess-ed with the CellTiter-Glo 3D assay (G9682, Promega) on thePromega's GloMax. Bright-field images were captured by a CanonEOS Rebel Xsi camera mounted on a Nikon Eclipse TS100microscope at 10� magnification.
Orthotopic xenograftsAnimal experiments were reviewed by Mayo Clinic and fol-
lowed the guidelines outlined in the Guide for Care and Use ofLaboratory Animals (NIH) under IACUC-approved protocol(A24815-15). C57Bl/6 mice (The Jackson Laboratory, aged 6–8 weeks) were anesthetized, subjected to a small incision toexpose the tail of the pancreas, and injected with 5� 105 Pan02þ luciferase cells in 25% Matrigel (BD Biosciences). Mice wereobserved daily and recovered 1 week before treatment initia-tion. MLN8237 was resuspended in 10% 2-hydroxypropyl-b-cyclodextrin (2OHpbCD; Sigma-Aldrich)/1% sodium bicar-bonate solution at 3 mg/mL. Chaetocin was resuspended at1 mmol/L in DMSO and diluted to 100 mmol/L in saline. Micewere randomly divided into four groups and treated daily withvehicle, MLN8237 (30 mg/kg, gavage), chaetocin (0.279 mg/kg,intraperiotenally), or combination (n ¼ 5/group). For tumormonitoring, mice were anesthetized with 0.5% inhaled iso-flourane, injected with D-luciferin (112.5 mg/kg), and total
Genetic-to-epigenetic Therapy for Pancreatic Cancer
www.aacrjournals.org Mol Cancer Res; 15(8) August 2017 985
on May 14, 2018. © 2017 American Association for Cancer Research. mcr.aacrjournals.org Downloaded from
Published OnlineFirst April 25, 2017; DOI: 10.1158/1541-7786.MCR-17-0063

flux (p/s) was quantified by Xenogen's IVIS-200 luminescenceimaging system. Animals were euthanized after 10 treatments andpancreatic tissues were formalin-fixed and paraffin-embedded forhistology.
Cell viability, apoptosis, and cell-cycle FACS analysisCells were plated at 5� 103 cells/well, treated, and cell viability
and apoptosis were measured with the ApoTox-Glo Triplex Assay(G6321, Promega) on Promega's GloMax at indicated times. ForFACS, cells were prepared as described previously (20). DNAcontent was analyzed on a Becton Dickinson LSR II FACS instru-ment at the Mayo Flow Cytometry Core Facility. Events (2–4 �104) were collected and analyzed with appropriate gating inFlowJo software (FlowJo).
Immunofluorescence and confocal microscopyImmunofluorescence and confocal microscopy were per-
formed as described previously (21). For mitotic aberrations,cells were stained with a/g-tubulin primary antibodies (Supple-mentary Table S1) and counterstained with 40,6-diamidino-2-phenylindole (DAPI) mounting media (Vector Laboratories).Images were obtained on a Zeiss AxioObserver LSM780 withobjective alpha plan-apochromat 100�/1.46 oil iris.
Electron microscopyPANC-1 cells were treated and harvested for fixation in Trump
solution (4% formaldehydeþ 1% glutaraldehyde in 0.1 mol/Lphosphate buffer) overnight at room temperature. Subsequently,cells were fixed in 1% osmium tetroxide and 1% aqueous uranylacetate, dehydrated in a graded series of ethanol, and embeddedin Embed 812/Araldite (EMS). Thin sections (0.1 mm) werecollected on copper grids andpoststainedwith lead citrate. Imageswere acquired in the Mayo Clinic Microscopy and Cell AnalysisCore facility using a JEOL1400 TEM operating at 80 kV (Jeol USA,Inc) equipped with a Gatan Orius832 camera (Gatan Inc.).
IHCIHCwasperformedonpancreatic tissue as described previously
(22). Slides were incubated overnight with primary antibody(Supplementary Table S1) and developed with Nova Red (VectorLaboratories) and hematoxylin counterstain. Five random fields(40� NA 0.65 A-Plan objective using Mikroscan D2 Digital SlideScanner with Q-Skan) per pancreas were imaged and counted(23). Each field contained at least 1,000 cells.
RNA-sequencing and real-time qPCRRNA was isolated using RNeasy mini kit with optional on-
column DNA digestion (Qiagen). Libraries were prepared (Illu-mina TruSeq mRNA v2) and run on the Illumina High Seq-2000(101-bp paired end reads) in the Mayo Clinic Sequencing Core.RNA-Seq data were analyzed using MAP-RSeq v.1.2.1 (24). MAP-RSeq consists of alignment with TopHat 2.0.6 (25) againstthe hg19 genome build and gene counts with the HTSeq software0.5.3p9 (http://htseq.readthedocs.io/en/release_0.9.1/) usinggene annotation files obtained from Illumina (http://cole-trapnell-lab.github.io/cufflinks/announcements/igenomes-released/).Principal component analysis and unsupervised hierarchicalclustering were performed on the samples using Partek Geno-mics Suite software (version 6.6; 2016, Partek Inc.). Normali-zation and differential expression analysis were performed using
edgeR2.6.2 (26). Data are available through the GEO repositoryunder accession number GSE97215. Real-time qPCR was per-formed using RT2 SYBR Green qPCR Mastermix (Qiagen) andRT2 qPCR Primers (Qiagen) on the Bio-Rad CFX96 system. Foldchanges (DDCt) and P values were calculated using Bio-Rad CFXmanager and SABioscience's RT2 Profiler PCR Array Data Anal-ysis software. Treatment samples were compared with vehicleand normalized to a panel of housekeeping genes.
Western blot analysisWestern blots were performed as described previously (12).
Membranes were blocked in 3% BSA/TBST and incubated over-night at 4�C with primary antibody (Supplementary Table S1).Blots were developed by Pierce ECL Chemiluminescence Sub-strate (Thermo Scientific).
ResultsSimilar to the Aurora A inhibitor, MLN8237, the pan-H3K9me-HMT inhibitor, chaetocin, is effective at reducing PDAC cellgrowth in vitro
Although MLN8237 has been actively tested for controllingPDAC growth with initial promising results (27, 28), its efficacyremains to be improved. Thus, we searched for novel pathwaysto serve as additional targets that could potentially enhance theeffects ofMLN8237. TheH3K9memark is critical formaintainingthe proper structure and function of centromeres (29), which, ifdisrupted, causes several types of mitotic stress. We hypothesizedthat chaetocin, an inhibitor of all known H3K9me HMTs (30),would generate an added stress to mitotically arrested cells byMLN8237 and improve its beneficial effects. As an initial steptoward defining the consequences of this combination, we firsttested the effects of both drugs alone in PDAC cell lines. Fig. 1Ashows that MLN8237 (200 nmol/L) reduced cell viability in 5different human PDAC cells after 72 hours of treatment: BxPC-3(76.0% � 2.4% of control), Capan-2 (63.0% � 4.6%), L3.6(70.6% � 1.6%), MIA PaCa-2 (78.9% � 3.0%), and PANC-1(89.5% � 2.0%), as well as the mouse-derived PDAC line Pan02(77.2% � 4.5%). Similarly, treatment with the H3K9me HMTinhibitor, chaetocin, demonstrated a dose-dependent inhibitionof cell growth in the same cell lines (Fig. 1B–G). At 48 hours, thepercentage of viability compared with no treatment control cellswith 25, 50, 75, and 100 nmol/L chaetocin was 89.1% � 5.0%,65.6% � 8.3%, 55.0% � 9.2%, and 37.2% � 5.7%, respectively,for BxPC-3 (of control); 88.3%� 4.0%, 71.7%� 3.5%, 60.0%�2.4%, and 58.2%� 1.2%, for Capan-2; 118.5%� 6.5%, 92.5%�4.0%, 91.1% � 10.5%, and 47.2% � 2.2%, for L3.6; 81.7% �5.5%, 59.2%� 4.9%, 54.4%� 3.6%, and 42.5%� 2.6%, forMIAPaCa-2; 124.5% � 6.1%, 114.1% � 6.4%, 81.9% � 6.7%, and68.0% � 4.2%, for PANC-1; and 99.1% � 6.8%, 61.9% � 4.3%,49.1% � 7.7%, and 27.3% � 2.9%, for Pan02. Combined, theseresults demonstrate, for the first time, inhibition of PDAC cellgrowth in response to treatment with the pan-H3K9me HMTinhibitor, chaetocin, and also confirm that the AURKA inhibitor issimilarly effective in this process. These baseline experimentsguided the subsequent combination of these two inhibitors.
Chaetocin enhances the inhibitory effects of MLN8237 onPDAC cell growth in culture and in vivo
We combined MLN8237 and chaetocin at various concentra-tions to determine their combination index (CI), using Compu-Syn software, which is based on the theory of Chou–Talalay
Mathison et al.
Mol Cancer Res; 15(8) August 2017 Molecular Cancer Research986
on May 14, 2018. © 2017 American Association for Cancer Research. mcr.aacrjournals.org Downloaded from
Published OnlineFirst April 25, 2017; DOI: 10.1158/1541-7786.MCR-17-0063

Method to define additive effect (CI ¼ 1), synergism (CI < 1), orantagonism (CI > 1) in drug combinations (15). We performed a8 � 8 matrix format using MTS assays, which investigated con-centration ranges of 60–320 nmol/L of MLN8237 and 5–50nmol/L of chaetocin on the same mouse (Pan02) and human(BxPC-3, Capan-2, L3.6, MIA PaCa-2, and PANC-1) PDAC cellstestedwith individual drugs.On the basis of initial concentrations(Fig. 1), MLN8237 or chaetocin were added to cells in an expand-edmatrix format to determine IC50 values of each drug alone. For
MLN8237, the IC50 values ranged between 81 and 144 nmol/L,and for chaetocin, values varied from 22 to 66 nmol/L (Supple-mentary Table S2). Subsequently, the drugs were combined at afixed concentration ratio of chaetocin:MLN8237 at 1:2 based ontheir average IC50 values (48 nmol/L and 110 nmol/L, respec-tively), as well as in a 5 � 5 matrix format at fixed ratios of 1:3and 1:5. The CI values, which provide a quantitative measureof the degree of drug interaction, were calculated at Fa values of0.50, 0.75, 0.90, and 0.95 after 72 hours of combined
Figure 1.
MLN8237 and chaetocin (CH)demonstrate a dose-dependentinhibition of PDAC cell growth. A,PDAC cell lines (5 � 104 per well of96 well) were plated and treated withMLN8237 for 72 hours at a dose of200 nmol/L. Treatment of BxPC-3 (B),Capan-2 (C), L3.6 (D), MIA PaCa-2 (E),PANC-1 (F), and Pan02 (G) PDAC celllines with escalating doses ofchaetocin (25, 50, 75, and 100 nmol/L)for 48 hours, demonstrated a dose-dependent inhibition of cell growth.Cell viability was measured by MTS,normalized to a vehicle control, anddata (technical triplicate withbiological n ¼ 3) are represented asmean � SEM. For MLN8237, treatedcells were compared with control byStudent t test. For chaetocin-treatedcell lines, statistical significance wascalculated by one-way ANOVA withmultiple comparisons. � , P�0.05; ��, P� 0.005; ��� , P � 0.0005.
Genetic-to-epigenetic Therapy for Pancreatic Cancer
www.aacrjournals.org Mol Cancer Res; 15(8) August 2017 987
on May 14, 2018. © 2017 American Association for Cancer Research. mcr.aacrjournals.org Downloaded from
Published OnlineFirst April 25, 2017; DOI: 10.1158/1541-7786.MCR-17-0063

treatment. Figure 2A–G shows that the majority of PDAC cellsevaluated with combination treatment had CIs < 1, indicating asynergism between these two inhibitors. Each individual cell lineis shown with its corresponding CI values at Fa50, 75, 90, and 95from each of the fixed ratios, 1:2, 1:3, and 1:5. Overall, the 1:3fixed ratio resulted in the most effective inhibition with thecombination, having mean CI values among all tested cell linesof 0.725, 0.565, 0.504, 0.482 at Fa50, 75, 90, and 95, respectively(Fig. 2A). With the exception of MIA Paca-2 (Fig. 2E), CI valuesimproved from Fa50 to Fa95 at the 1:3 ratio, with the strongest CIsat higher Fa values. This bears relevance as CI values at higher Favalues are more appropriate than the lower Fa when consideringcancer therapy (15). At a ratio of 1:2, mean CI values were 0.881(Fa50), 0.683 (Fa75), 0.557 (Fa90), and 0.493 (Fa95; Fig. 2A), withenhanced CI values from Fa50 to Fa95 in all cell lines (Fig. 2B–G).Mean CI values for the 1:5 ratio were 0.835 (Fa50), 0.604 (Fa75),
0.486 (Fa90), and 0.429 (Fa95) with better CIs at higher Fa values(Fig. 2A). In summary, the Fa–CI plots demonstrate that theMLN8237–chaetocin combination exhibited the highest synergyat high Fa values for the tested ratios.
We performed clonogenic survival assays on L3.6, as oneof the cell lines that displayed a strong synergistic effect withbetter CIs at higher Fa values (Fig. 2D). Cells were exposedto concentration ranges of 22.5–90 nmol/L for MLN8237 and7.5–30 nmol/L for chaetocin or a combination at a fixed ratio ofchaetocin:MLN8237 at 1:3 for 7 days. MLN8237 alone did notsubstantially reduce surviving colonies, whereas the pan-H3K9me HMT inhibitor, chaetocin, induced a moderate reduc-tion in clonogenic survival. However, as shown in Fig. 2H–I, inparticular, the combination of MLN8237 at a concentration of67.5 nmol/L and chaetocin at 22.5 nmol/L significantly reducedclonogenic survival with over 85% inhibition (86.1% � 6.3%)
Figure 2.
Dual targeting of pan-H3K9 HMTs and AURKA synergizes to inhibit PDAC cell growth. The CI of chaetocin andMLN8237 was calculated for 1:2, 1:3, and 1:5 ratios as anaverage (A) and in the individual human BxPC-3 (B), Capan-2 (C), L3.6 (D), MIA PaCa-2 (E), PANC-1 (F), and mouse Pan02 PDAC cell lines (G). The CIs fromat least three independent experiments were averaged to determine CI values at Fa 0.50, 0.75, 0.90, and 0.95 for each cell line. H, L3.6 cells were plated for aclonogenic cell survival assay and stained for cell density after 7 days of treatment with chaetocin or MLN8237 alone or in combination (dose 1: 7.5 nmol/L chaetocin,22.5 nmol/L MLN8237; dose 2: 15 nmol/L chaetocin, 45 nmol/L MLN8237; dose 3: 22.5 nmol/L chaetocin, 67.5 nmol/L MLN8237; dose 4: 30 nmol/L chaetocin, 90nmol/L MLN8237). Representative images of clonogenic staining for the vehicle (DMSO)-treated cells and dose escalation (left to right) are presented. I, Averagedensity of the clonogenic assay (mean� SEM, n¼ 3), normalized to vehicle for each treatment, and statistical significance calculated by Student t tests for each dosecompared with vehicle (� , P� 0.05; �� , P� 0.005; ��� , P� 0.0005). J, The CI for the clonogenic assay indicated that the drugs act synergistically at high Fa values.
Mathison et al.
Mol Cancer Res; 15(8) August 2017 Molecular Cancer Research988
on May 14, 2018. © 2017 American Association for Cancer Research. mcr.aacrjournals.org Downloaded from
Published OnlineFirst April 25, 2017; DOI: 10.1158/1541-7786.MCR-17-0063
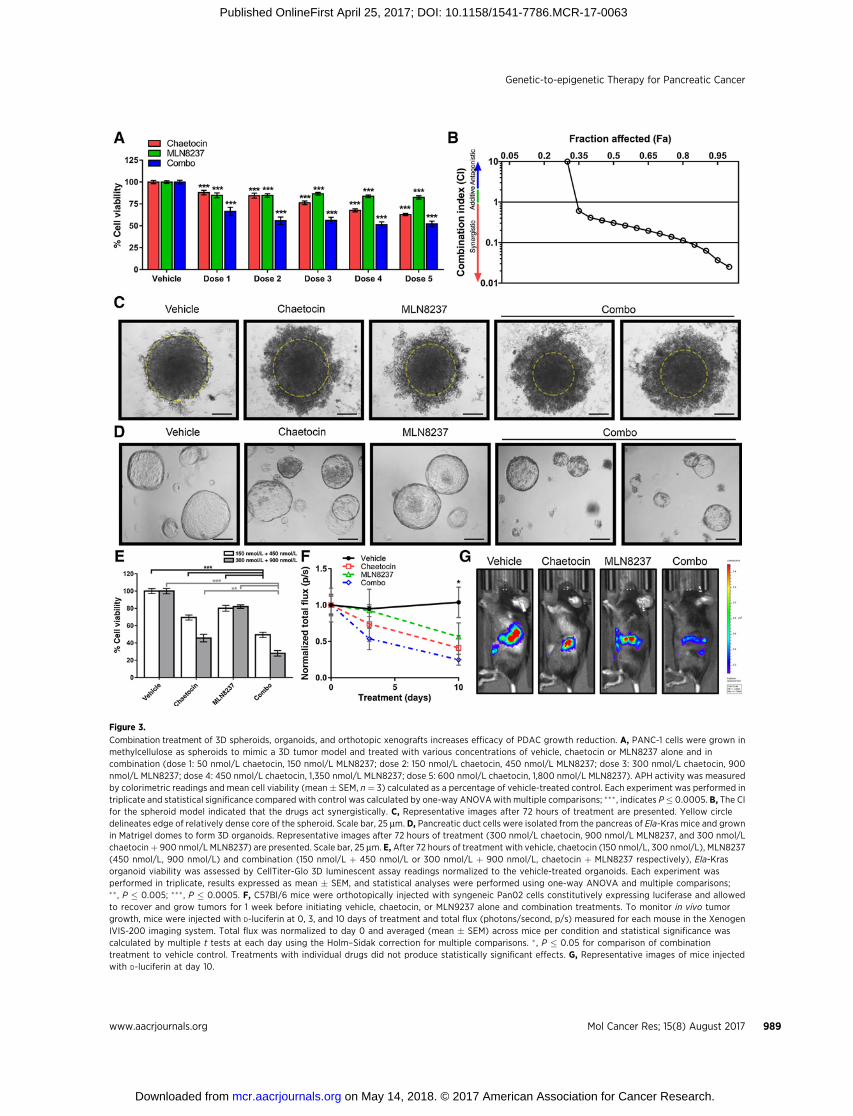
Figure 3.
Combination treatment of 3D spheroids, organoids, and orthotopic xenografts increases efficacy of PDAC growth reduction. A, PANC-1 cells were grown inmethylcellulose as spheroids to mimic a 3D tumor model and treated with various concentrations of vehicle, chaetocin or MLN8237 alone and incombination (dose 1: 50 nmol/L chaetocin, 150 nmol/L MLN8237; dose 2: 150 nmol/L chaetocin, 450 nmol/L MLN8237; dose 3: 300 nmol/L chaetocin, 900nmol/L MLN8237; dose 4: 450 nmol/L chaetocin, 1,350 nmol/L MLN8237; dose 5: 600 nmol/L chaetocin, 1,800 nmol/L MLN8237). APH activity was measuredby colorimetric readings and mean cell viability (mean� SEM, n ¼ 3) calculated as a percentage of vehicle-treated control. Each experiment was performed intriplicate and statistical significance compared with control was calculated by one-way ANOVA with multiple comparisons; ��� , indicates P� 0.0005. B, The CIfor the spheroid model indicated that the drugs act synergistically. C, Representative images after 72 hours of treatment are presented. Yellow circledelineates edge of relatively dense core of the spheroid. Scale bar, 25 mm. D, Pancreatic duct cells were isolated from the pancreas of Ela-Kras mice and grownin Matrigel domes to form 3D organoids. Representative images after 72 hours of treatment (300 nmol/L chaetocin, 900 nmol/L MLN8237, and 300 nmol/Lchaetocinþ 900 nmol/L MLN8237) are presented. Scale bar, 25 mm. E, After 72 hours of treatment with vehicle, chaetocin (150 nmol/L, 300 nmol/L), MLN8237(450 nmol/L, 900 nmol/L) and combination (150 nmol/L þ 450 nmol/L or 300 nmol/L þ 900 nmol/L, chaetocin þ MLN8237 respectively), Ela-Krasorganoid viability was assessed by CellTiter-Glo 3D luminescent assay readings normalized to the vehicle-treated organoids. Each experiment wasperformed in triplicate, results expressed as mean � SEM, and statistical analyses were performed using one-way ANOVA and multiple comparisons;�� , P � 0.005; ��� , P � 0.0005. F, C57Bl/6 mice were orthotopically injected with syngeneic Pan02 cells constitutively expressing luciferase and allowedto recover and grow tumors for 1 week before initiating vehicle, chaetocin, or MLN9237 alone and combination treatments. To monitor in vivo tumorgrowth, mice were injected with D-luciferin at 0, 3, and 10 days of treatment and total flux (photons/second, p/s) measured for each mouse in the XenogenIVIS-200 imaging system. Total flux was normalized to day 0 and averaged (mean � SEM) across mice per condition and statistical significance wascalculated by multiple t tests at each day using the Holm–Sidak correction for multiple comparisons. � , P � 0.05 for comparison of combinationtreatment to vehicle control. Treatments with individual drugs did not produce statistically significant effects. G, Representative images of mice injectedwith D-luciferin at day 10.
Genetic-to-epigenetic Therapy for Pancreatic Cancer
www.aacrjournals.org Mol Cancer Res; 15(8) August 2017 989
on May 14, 2018. © 2017 American Association for Cancer Research. mcr.aacrjournals.org Downloaded from
Published OnlineFirst April 25, 2017; DOI: 10.1158/1541-7786.MCR-17-0063

Mathison et al.
Mol Cancer Res; 15(8) August 2017 Molecular Cancer Research990
on May 14, 2018. © 2017 American Association for Cancer Research. mcr.aacrjournals.org Downloaded from
Published OnlineFirst April 25, 2017; DOI: 10.1158/1541-7786.MCR-17-0063

compared with MLN8237 alone (28.4% � 5.2%; 67.5 nmol/L)and 67.1%� 5.2% inhibition with chaetocin alone (22.5 nmol/L). The CI values at Fa75, 90, and 95 were 0.695, 0.510, and0.421, respectively (Fig. 2J). Similar experiments were per-formed with PANC-1 cells (Supplementary Fig. S1A–S1C),which demonstrated CI values Fa75, 90, and 95 at 1.016,0.944, and 0.912. Therefore, the combination of MLN8237with chaetocin demonstrated synergy for reduction of clono-genic survival.
3D culturesmore closely simulate in vivo conditions and oftendemonstrate increased resistance to drug treatments. Therefore,we repeated treatments on PDAC cell lines grown as spheroids,which are solid, 3D aggregates of cancer cells (17). Formedspheroids were grown for 4 days before adding chaetocin,MLN8237, or their combination (Fig. 3A–C). Similar to 2Dcultures, the drug combination significantly reduced growth ofPANC-1 spheroids than either drug alone as measured by acidicphosphatase (APH) assay (Fig. 3A; 41.9% � 2.4% reduction ofgrowth with combination treatment versus 15.9% � 1.6% with900 nmol/LMLN8237 alone or 25.2%� 1.5%with 300 nmol/Lchaetocin alone). Images of the 3D spheroids confirm that thedense core of cells was reduced following combination treat-ment (yellow circles, Fig. 3C). Performing a 5 � 5 matrix dosecurve, spheroids were exposed to concentration ranges of 150–1,800 nmol/L for MLN8237 and 50–600 nmol/L for chaetocinor a combination at a fixed concentration ratio of chaetocin:MLN8237 at 1:3. Thus, the combination is more effective thanindividual treatments (Fig. 3B; CI values of 0.307, 0.139,0.0632, and 0.0369 for Fa50, 75, 90, and 95, respectively) for3D cultures, which are increasingly favored for drug testing (17).
We also evaluated these drugs in a more relevant 3D culturemodel (18), namely organoids. Pancreatic ducts were isolatedfrom Ela-Kras mice (19) and propagated in Matrigel to formorganoid structures. Organoids derived from these murine mod-els of PDAC can generate lesions that resemble pancreatic intrae-pithelial neoplasias (PanIN) and progress to invasive PDAC,thereby offering a useful tool for evaluating therapeuticapproaches (18). Organoids were treated with 150 or 300nmol/L chaetocin, 450 or 900 nmol/L MLN8237, or their com-bination (150 þ 450nmol/L; 300 þ 900 nmol/L) for 72 hours,and viability of cells was evaluated by CellTiter-Glo assay (Fig. 3Dand E). With 150 nmol/L chaetocin and 450 nmol/L MLN8237,the combination showed a significant reduction in viability
(50.5% � 3.0% compared with vehicle) in contrast to MLN8237(19.8%� 3.4% reduction compared with vehicle) and chaetocinalone (30.6% � 2.9% reduction compared with vehicle;Fig. 3E). Similarly, 300 nmol/L chaetocin and 900 nmol/LMLN8237 significantly reduced viability (69.2% � 3.5% com-pared with vehicle) in comparison with MLN8237 (16.3% �3.3% reduction compared with vehicle) and chaetocin alone(54.3% � 4.4% reduction compared with vehicle; Fig. 3E).Representative images of the organoids demonstrate appreciablereduction in size and disruption of the 3D structure in the com-bination treatment (Fig. 3D).
Finally, we evaluated the effect of the AURKA and pan-H3K9me HMT inhibitors using orthotopic xenografts. Pan02cells stably expressing luciferase were injected into the pancreasof C57BL/6mice. These cells allow accurate monitoring of time-dependent in vivo growth of xenografts. Xenografts were treatedwith vehicle control, chaetocin alone, MLN8237 alone, or theircombination (n ¼ 5/group) and monitored by biolumines-cence. Mean bioluminescence values are shown at 0, 3, and10 days of treatment (Fig. 3F). While individual treatments didnot result in a statistically significant reduction in tumor growth(normalized total flux compared with start of treatment 1.04 �0.21 p/s for control animals versus 0.41� 0.17 p/s for chaetocinalone, P > 0.05; or 0.57 � 0.19 p/s for MLN8237 alone, P >0.05), the group receiving the combination displayed signifi-cant reduction of tumor growth (0.25� 0.08 p/s, P < 0.05) after10 days of treatment (representative images, Fig. 3G). Therefore,the MLN8237–chaetocin combination is more effective thaneach of the drugs alone for inhibiting cell growth both, in vitroand in vivo.
The MLN8237–chaetocin combination inhibits PDAC growthvia a cellular mechanism involving mitotic catastrophe
As the AURKA and HP1–HMT pathways are both involved inthe regulation of cell division, we examined the mechanismsby which antagonizing these pathways leads to PDAC cellgrowth inhibition. Using fluorescence-based measurement oflive-cell protease activity and luminogenic-based substrate todetect caspase-3/7 activation, we confirmed reduction of cellviability along with a corresponding increase of apoptoticindicators in PANC-1 cells treated with vehicle, 30 nmol/Lchaetocin, 90 nmol/L MLN8237, or their combination. After72 hours, relative cell viability (Fig. 4A) of combination-treated
Figure 4.Chaetocin–MLN8237 combination synergizes to trigger a G2–M shift and significant mitotic catastrophe. PANC-1 cells were plated and treated for 0, 24, 48, and 72hourswith vehicle, chaetocin (CH; 30nmol/L),MLN8237 (90nmol/L), or combination (30þ90nmol/L, chaetocinþMLN8237 respectively). Levels of cell viability (A)and apoptosis (B) were observed by protease and caspase-3/7 cleavage of fluorescent and luminescent substrates, respectively. Valueswere normalized to 0 hoursvehicle for each treatment and statistical significance calculated by two-way ANOVA with Tukey multiple comparisons test. � , P � 0.05; ��� , P � 0.0005. C, FACSanalysis of PANC-1 cells treated for 48 hours with chaetocin, MLN8237, and combination treatments resulted in slightly increased G2–M arrest for single treatmentsand nearly complete G2–Marrest and cell death (sub-G1 events shown in light green) for the combination treatment. Representative FACS cell-cycle graphs illustratethe significant shift and average percentage (n ¼ 2) of events in each phase of cell cycle, G1, S, or G2–M are graphed with relative percentages indicated in eachsegment (D). E, L3.6 cells were treated with vehicle, chaetocin, MLN8237, or combination for 48 hours, fixed, and stained antibodies to g-tubulin (green), a-tubulin(red), and DNA stained with DAPI (blue) to consider mitotic progression. Over 150 mitotic cells were observed and quantified as normal, aberration, or catastropheand resultant graph indicates the percentage of the total number of cells counted. F, Representative images of cells counted as normal mitosis (vehicle),multiple spindle poles (chaetocin andMLN8237 alone), and total disruption of the spindle apparatus inmitotic catastrophe during combination treatment. Scale bar,2,000nm.G,Electronmicroscopy imagesof PANC-1 cells after 72 hours of treatment demonstratedmultinucleated cells (black arrows).Normalmitoses are indicatedby (�). Evidence of mitotic cell death/mitotic catastrophe is shown in the combination treatment (red arrow). Scale bar, 10 mm. H, PANC-1 lysates after 48 hours oftreatment indicate that the relative levels of P-S10 H3 and P-S139 H2A.X (indicators of mitotic catastrophe) are increased in the combination treatment by Westernblot analysis, with H2B as loading control. Pancreatic tissue from orthotopic xenografts was stained by IHC for P-S139 H2A.X as a measure of mitoticcatastrophe invivo. I,Quantification of averagepositive staining cells perfield aregraphed�SEMwith 5field viewsper sample. Statistical significancewasperformedusing a Student t test to compare combination treatment to all other conditions, ��� ,P�0.0005. J,Representative fields illustrate the increased number of positivelystained cells (black arrows) in the combination-treated animals as compared with vehicle, chaetocin, or MLN8237 alone. Scale bar, 0.1 mm.
Genetic-to-epigenetic Therapy for Pancreatic Cancer
www.aacrjournals.org Mol Cancer Res; 15(8) August 2017 991
on May 14, 2018. © 2017 American Association for Cancer Research. mcr.aacrjournals.org Downloaded from
Published OnlineFirst April 25, 2017; DOI: 10.1158/1541-7786.MCR-17-0063

cells (1.53 � 0.20) was significantly reduced compared withvehicle (2.65 � 0.06, P � 0.0005), chaetocin alone (2.03 �0.08, P � 0.05), or MLN8237 alone (2.41 � 0.07, P � 0.0005),while relative caspase-3/7 activation (Fig. 4B) was significantlyincreased in combination-treated cells (7.74 � 0.34) comparedwith vehicle (3.17� 0.21, P� 0.0005), chaetocin alone (6.08�0.25, P � 0.0005), or MLN8237 alone (4.53 � 0.43, P �0.0005). Similar observations were made with L3.6 cells (Sup-plementary Fig. S1D and S1E). Subsequently, we measuredhow these inhibitors impact the cell cycle using fluorescence-activated cell sorting (FACS). We found that while chaetocinand MLN8237 alone caused modest accumulation of cells withG2–M DNA content (35.6% � 0.04% and 22.0% � 3.3%,respectively, versus 17.6% � 0.03% in vehicle control–treatedcells), their combination induced a substantial shift of the cellsto G2–M (67.2% � 1.4%) with an increase in sub-G1 popula-tion (Fig. 4C and D). Interestingly, confocal and electronmicroscopy demonstrated that the effect of the combinationwas due to chromosomal instability, mitotic aberrations, andultimately induction of mitotic cell death (Fig. 4E–G). Forinstance, immunofluorescence with anti-a-tubulin for spindlepoles and anti-g-tubulin for centrosomes showed that cellstreated with either drug exhibited mitotic aberrations, includ-ing multipolar spindles, centrosome disruption or lagging,unorganized chromosomes (Fig. 4E and F). While cells withvehicle treatment displayed mitotic abnormalities in only15.9% of the mitotic population (n ¼ 208), 31.6% of chaeto-cin-treated (n ¼ 171), and 42.6% of MLN8237-treated (n ¼169) cells in mitosis had these types of aberrations. Cells withcomplete disruption of the mitotic spindle and chromosome
alignment were categorized as undergoing mitotic catastrophe.None of the vehicle-treated cells exhibited this level of mitoticdisturbance. However, 9.4% of chaetocin-treated cells and33.1% of MLN8237-treated cells showed mitotic catastrophe.Interestingly, the combination of chaetocin and MLN8237demonstrated a significant portion of cells in mitotic catastro-phe rather than mitotic aberrations (81.8% mitotic catastropheversus 11.8% mitotic aberrations; n ¼ 187; Fig. 4E). Similarly,PANC-1 cells treated by the combination show increasedmitotic catastrophe (29.9% mitotic catastrophe, n ¼ 147,Supplementary Fig. S1F). Scanning electron microscopy con-firmed that while chaetocin and MLN8237 individually causedmultinucleated cells (Fig. 4G, black arrows), their combinationresulted in multiple nuclei per cell and a significant proportionof cells that had died in mitosis, as evidenced by a highlydisorganized cytoplasm, altered vesicular organelles, and pres-ence of electron dense condensed chromosomes (Fig. 4G,red arrow). Biochemically, the combined treatment withMLN8237 and chaetocin resulted in increased levels of P-S10-H3 and P-S139-H2A.X, as measured by Western blot anal-ysis (Fig. 4H). The coinciding increase of both histone marks ischaracteristic of mitotic catastrophe (31), further confirmingthis phenomenon. Notably, we also checked tissue from ourtreatment of orthotopic xenografts for P-S139-H2A.X–positivecells by IHC to confirm this observation in vivo. Congruently,we found that orthotopic xenografts from mice receiving thecombination displayed a higher number of P-S139-H2A.X–positive cells (Fig. 4I and J; 8.4 � 0.51 positive cells/field)compared with control (1.8 � 0.37 positive cells/field; P ¼0.0001), chaetocin alone (3.4 � 0.6 positive cells/field; P ¼
Figure 5.
RNA-seq definesmolecular markers ofthe MLN8237–chaetocin response.RNA-seq was performed on PANC-1cells that were treated for 24 hourswith vehicle, chaetocin (CH;30 nmol/L), MLN8237 (90 nmol/L) orcombination (30 þ 90 nmol/L,chaetocin þ MLN8237, respectively).A, Hierarchical clustering of all genesidentified across the four conditionsindicates large clusters of genesincreased after cells were treated withthe combination of drugs. B, A Venndiagram of the two conditions thatinduced differential gene expression,chaetocin alone and combination,illustrates 548 unique genes thatchanged expression only in thecombination therapy. C, Separation ofthe 548 DEG by ontological functiondemonstrates that genes include alarge number of noncoding RNAs andtranscriptional, chromatin, epigeneticelements. Red and green bars depictupregulated and downregulatedgenes in each category, respectively.
Mathison et al.
Mol Cancer Res; 15(8) August 2017 Molecular Cancer Research992
on May 14, 2018. © 2017 American Association for Cancer Research. mcr.aacrjournals.org Downloaded from
Published OnlineFirst April 25, 2017; DOI: 10.1158/1541-7786.MCR-17-0063

0.0002), or MLN8237 alone (1.4 � 0.24 positive cells/field; P <0.0001), confirming that the combination had the expectedeffect in vivo. Collectively, our data demonstrate that thecellular mechanism underlying PDAC growth inhibitionobserved with combined MLN8237 and chaetocin treatmentis through induction of mitotic catastrophe. Thus, these resultsprompted the search for molecular mechanisms to explain thiseffect by focusing on how these drugs modify the transcrip-tional response by RNA-sequencing (RNA-seq), as well as cell-cycle checkpoint pathways that are activated by chromosomalinstability.
RNA-seq defines molecular markers of the MLN8237–chaetocin response
We utilized RNA-Seq to define molecular markers for the effectof the MLN8237–chaetocin combination. PDAC cells were trea-ted with individual drugs or their combination and comparedwith vehicle. Treatment was limited to 24 hours to extract RNAbefore significant mitotic catastrophe occurred to capture thetranscriptional effect. Figure 5A shows the heatmap from triplicateexperiments. Supplementary Table S3 lists the specific values forexpression of differentially expressed genes (DEG) found inresponse to treatment. A Venn diagram (Fig. 5B) compared theDEG in chaetocin alone and the combination treatment. Here,548 genes are indicated as changed specifically as the result of thecombination and not found to be changing in the chaetocin alonetreatment. Furthermore, MLN8237 alone did not result in anysignificant DEG at the dose used for all experiments, with theexceptionof twopseudogenes.Notably, themajority (83%)of the548 DEG in response to the combination were upregulated,consistent with inhibition of the repressive H3K9me pathway,which represents one arm of the treatment and is expected toderepress gene expression. A bar graph with genes grouped byontological function and number of DEG activated or repressedby combination treatment, colored red and green, respectively, isshown in Fig. 5C. We also found that the treatment regulatesgenes, which promoters contain xenobiotic response elementsinvolved in drug metabolism, including CYP1A1, CYP1B1,CYP2B7P, CYP7B1, CYP4F12, CYP2E1, and CYP2C8, servingas an internal positive control for drug exposure. Interestingly,36% (199/548) of DEG are noncoding RNAs, constitutinganoverrepresentation beyond the expected number. Among thesetranscripts, 77% of them belong to the group of the recentlyreported noncoding regulatory RNAs, known as mCARs,which appear to be critical structural components of chromo-somes (32). In the similar functional category, the entire histone 1cluster (HIST1H4I, HIST1H4H, HIST1H4E, HIST1H3J,HIST1H3D, HIST1H3C, HIST1H2BO, HIST1H2BN, HIST1H2BJ,HIST1H2BG, HIST1H2AM, HIST1H2AG, and HIST1H2AD) wasalso represented. The percentage of DEG associated to chromo-some structure in response to the drug combination was higherthan expected for a nonspecific effect and may likely reflect acellular response to alterations in these organelles, which areobserved duringmitotic catastrophe. In addition to chromosomalmarkers, the remaining DEGs participate in chromatin organiza-tion, transcription, and epigenetics, cell adhesion and extracellu-larmatrix, cell signaling, cytoskeleton,metabolism,mitochondriahomeostasis, membrane proteins, cytoskeleton, channels andtransporters, as well as cell cycle, senescence, and apoptosis (Fig.5C).Whether the changes in gene expression result from effects ofabnormal gene regulation in response to the drugs or reflect a role
in mitotic catastrophe is less clear. Nevertheless, these experi-ments provide a number of potential markers, which can serve tomonitor the effectiveness of this combination.
Mitotic catastrophe induced by combinedMLN8237–chaetocintreatment is characterized by aberrant mitotic checkpointsignaling and decreased centromeric H3K9 methylation
To unravel molecular mechanisms that may explain howsynergism of the MLN8237–chaetocin combination triggersmitotic death, we investigated the integrity of G2–M checkpointpathways. ATM (ataxia telangiectasia mutated) and ATR (ATMand Rad3-related) are part of a unique family of serine–threoninekinases functioning as transducers of DNA signals (33). Wehypothesized that, in the combination treatment, these pathwaysmay be affected due to the observed centromere changes, mitoticinstability, prolonged cell-cycle arrest, and ultimately, mitoticcatastrophe. Testing this hypothesis followed the rationale thatthese kinases orchestrate a network of cellular processes thatmaintains genomic integrity by signaling to downstream kinases,such as Chk1. Chk1 functions in survival and cell-cycle check-points, in particular cell-cycle arrest before mitosis in response toDNA damage (34). Activated Chk1 phosphorylates the dualspecificity phosphatase Cdc25C on Ser216, which sequesters thisphosphatase in a complex within the cytoplasm, thereby prevent-ing Cdc25C from activating Cdk1 through removal of the inhib-itory phosphorylation. As a result, the Cdk1/Cdc2–cyclin B com-plex is maintained in an inactive state to block entry into mitosis.InMLN8237-treated cells, ATM and ATR along with P-S345 Chk1were present, presumably leading tohigh levels of P-S216Cdc25c,its inactive form (Fig. 6A). Cdk1 was also inactive, as reflectedby high levels of P-Y15 Cdk1/cdc2. High levels of Wee1, whichphosphorylates Y15-Cdk1/cdc2 leading to its inactivation,likely, reinforced this effect (Fig. 6A). Therefore, treatment withMLN8237 leads to signals that are known to render the Cdk1–Cyclin B complex unable to mediate cell division, accompaniedby G2–M arrest (Fig. 6B; ref. 31). Chaetocin treatment alone hadATM and ATR levels similar to control andMLN8237-treated cells(Fig. 6A). There were slight decreases in the amounts of P-S345Chk1 and P-S216 Cdc25c in comparison with control andMLN8237, although not to the extent observed in the combina-tion. However, the slight decrease in inactive P-S216 Cdc25c didnot result in the presence of active P-T48 Cdc25c (Fig. 6A). Thepresence of inactive P-Y15 Cdk1/cdc2 remained, while a low levelof active P-T161 Cdk1/cdc2 was also detected. Levels of cyclin Bstayed constant. Overall, the molecular response to chaetocinalone was not markedly distinct from control-treated cells in keymitotic checkpoints. However, chaetocin with MLN8237 trig-gered an aborted response to bypass this G2–M arrest, whichultimately resulted in mitotic catastrophe and death. At themolecular level, lysates from the MLN8237–chaetocin combina-tion demonstrated Chk1 inactivation by decreased levels of both,total and phosphorylated form of this protein (Fig. 6A). Chk1inactivation was also evidenced by a decrease in P-S216 Cdc25c(inactive)with a corresponding increase in P-T48Cdc25c (active).This Cdc25c activation led to Cdk1/cdc2 dephosphorylation(Y15), allowing activation of the Cdk1/cdc2–Cyclin B complex,as observed by increased P-T161 Cdk1/cdc2 (Fig. 6A). Concor-dantly, low levels of Wee1 likely strengthened this effect alongwith increased Cyclin B (Fig. 6A). Central to these G2–M arrestpathways is p53 (35), which levels were significantly ablated bythe combination (Fig. 6A), a phenomenon that has been
Genetic-to-epigenetic Therapy for Pancreatic Cancer
www.aacrjournals.org Mol Cancer Res; 15(8) August 2017 993
on May 14, 2018. © 2017 American Association for Cancer Research. mcr.aacrjournals.org Downloaded from
Published OnlineFirst April 25, 2017; DOI: 10.1158/1541-7786.MCR-17-0063

implicated in mitotic catastrophe (36, 37). Notably, p53 down-regulation occurs at the protein level without changes at thetranscript level (Supplementary Table S4) in real-time PCR,whichyielded a fold change for p53: chaetocin, 1.130; MLN8237, 1.039;combination,�1.219 each compared with vehicle, or in RNA-seq(log fold change: chaetocin, �0.169; MLN8237, �0.156; combi-nation, �0.415 each compared with vehicle). Similarly, none ofthe othermitotic checkpoint proteinswere altered at the transcriptlevel (Supplementary Table S4), indicating that these changes are
posttranscriptional events. As a consequence, combination treat-ment results in a signal for inducingmitotic progression (Fig. 6B),but as both the AURKA andH3K9me pathways are inhibited, thisresponse appears to abort with cells ultimately entering mitoticcatastrophe and cell death due to the structural disorder andchromosomal instability (Fig. 4C–G). As chaetocin is an inhibitorof all known H3K9me HMTs, we checked the levels of thedimethyl (H3K9me2) and trimethyl (H3K9me3) posttranslation-al marks of K9H3. As expected, levels of both, H3K9me2 and
Figure 6.
Combined AURKA and pan-H3K9-HMT inhibition triggers uncoordinated checkpoint responses and reduces the centromeric H3K9me mark. A, Combination ofchaetocin and MLN8237 treatments triggered dysregulation of a variety of proteins involved in cellular checkpoint response. Protein levels were observedby Western blot analysis with a-tubulin illustrating equal loading of samples across all treatments. B, Pathway diagram illustrates the ATM/ATR–Chk1–p53pathway for G2–M cell arrest. Increases and decreases in nodes affected by the combination treatment are marked with red and green stars, respectively.C, Treatments synergize to reduce the H3K9me mark in cells. Total levels of H3K9me2 and H3K9me3 are indicated by Western blots of the vehicle,chaetocin, MLN8237, and combination treatments of PDAC cells with total H3 levels shown as loading control. D, Representative images of H3K9me3immunofluorescence staining in L3.6 cells demonstrated a global decrease of H3K9me3 upon treatment with the combination of drugs. Scale bar, 2,000 nm.
Mathison et al.
Mol Cancer Res; 15(8) August 2017 Molecular Cancer Research994
on May 14, 2018. © 2017 American Association for Cancer Research. mcr.aacrjournals.org Downloaded from
Published OnlineFirst April 25, 2017; DOI: 10.1158/1541-7786.MCR-17-0063

H3K9me3 decreased with chaetocin alone, as observed by West-ern blot analysis (Fig. 6C). Interestingly, levels of H3K9me2were also reduced with MLN8237, and both of these posttrans-lational modifications were reduced even more in the combina-tion compared with either of the individual drugs (Fig. 6C). Inmitotic cells, the H3K9me3 mark colocalizes with pericentro-meric heterochromatin (29). Using immunofluorescence, weobserved a decrease in pericentromeric H3K9me3 in mitoticcells treated with chaetocin or MLN8237 alone compared withcontrol, which was almost completely absent in cells treated withtheir combination (Fig. 6D; Supplementary Fig. S1G), congruentwith our Western blot findings. In summary, the molecularsignature in the combination treatment reflects one of cell-cycleprogression combined with signals indicative of mitotic catastro-phe, namely the concurring increase of both P-S10-H3 and P-S139-H2A.X histone marks (Fig. 4H), and decreased centromericH3K9 methylation (Fig. 6D), suggesting that mitotic cell deathresults from aberrant checkpoint signaling along with severechromatin–DNA damage.
DiscussionEpigenomic-based pharmacology has the potential to serve as a
robust tool to improve the future treatment of PDAC. The resultsof the current study significantly contribute to the field of exper-imental therapeutics by demonstrating how to inhibit PDACgrowth through combined targeting of an oncogene and epige-netic regulator (genetic-to-epigenetic crosstalk). We tested theefficiency of this approach by jointly targeting AURKA and oneof its epigenetic targets, the H3K9me pathway. We also dissectedcellular and molecular mechanisms by which this combinationleads to a cytotoxic effect. Thus, it is important to consider howour evidence supports a model by which these types of therapiesmay work and how similar approaches can be translated to othergenetic-to-epigenetic pathways controlling cancer growth.
Antitumor agents have the possible cellular outcomes of cyto-toxicity by cell death or cytostasis through cell-cycle arrest and/orsenescence (38). While senescent cells have the benefit of sup-pressing tumorigenesis, unfortunately, they leave cells metabol-ically active that can potentially contribute to progression andtherapy resistance. MLN8237 (alisertib), a MLN8054 derivative,works as highly specific ATP-competitive drug that binds AURKAand inhibits T288 phosphorylation (39). As a result of AURKAinhibition, MLN8237 blocks G2–M cell-cycle progression,induces polyploidy, and results in senescence (40). As AURKAis overexpressed inmany cancers, including PDAC, it continues tobe a feasible target for therapy. While several AURKA inhibitorshave been developed,MLN8237 remains themost promising dueto minor to moderate side effects. There are numerous ongoingphase I and II trials with MLN8237 as a single agent or incombinationwith other drugs in advanced solid and hematologicmalignancies (41). Combination of MLN8237 with cytotoxicdrugs, including taxanes, cisplatin, vincristine, and gemcitabineamong others, potentiates anticancer activity. However, eventhough phase I and II studies have offered encouraging results,the first phase III study with MLN8237 was discontinued due tounsatisfactory efficacy, leaving someyet unansweredquestions forMLN8237 use in clinical settings. Therefore, although MLN8237holds promise as a therapeutic agent, there remains much spec-ulation that this drug will ultimately better serve in combinationwith other agents if it is to gain clinical approval. In particular, the
optimal endpoint of such therapy, rather than senescence, wouldbe to effectively eliminate malignant cells through cell death.
Our data demonstrate that the combined inhibition of AURKA,and the H3K9me pathway is synergistic (Figs. 2 and 3). Anenhanced effect of the combination to inhibit PDAC growth isalso observed with 3D spheroid and organoid cultures, as well asxenografts in vivo (Fig. 3). This is consistent with the fact that thesetargets are in the same biological pathway that aids to the propercompletion of mitosis (12). Upon cell-cycle arrest caused byAURKA inhibition, the mitotic machinery is exposed longer totargeting by theH3K9mepathway,whichduringmitosis regulatescentromere structure. Histones associated with centromeric het-erochromatin are typically hypoacetylated (42) and methylatedon H3K9 (29). H3K9me levels rapidly increase upon mitoticentry, reaching maximum in metaphase (13). Congruent withprevious reports (13), disruption of this H3K9me-mediated cen-tromeric pathway in mitosis (Fig. 6C and D; Supplementary Fig.S1G), which in the current study is achieved through the com-bined use of a pan-H3K9me HMT and an AURKA inhibitor, leadsto mitotic aberrations (Fig. 4E and F; Supplementary Fig. S1F),abnormalmitotic checkpoint responses (Fig. 6A-B), and cell deathby mitotic catastrophe. Furthermore, the cellular response to thedrug combination is marked by expression changes of genesinvolved in drug metabolism, mCARs, as well as genes associatedto chromosome structure, as observed by RNA-seq (Fig. 5). Thus,inhibition of the H3K9me epigenetic pathway, specifically inmitosis, offers a unique therapeutic approach not characteristi-cally considered when utilizing epigenetic agents, which havemore commonly been tested for modulating gene expressionduring interphase.
Mitotic catastrophe is an oncosuppressive mechanism definedas a mode of cell death resulting from aberrant mitosis (43).Several drugs, including spindle assembly inhibitors, DNA-dam-aging agents, and radiation, induce mitotic catastrophe. Micro-tubule-hyperpolymerizing agents, such as paclitaxel and doce-taxel, and depolymerizing agents of the Vinca-alkaloid type(vinblastine, vincristine, and vindesine) are mitotic inhibitorsthat influence microtubule dynamics by binding to tubulindimers, leading to spindle disturbances (44). There are otherinducers of mitotic catastrophe that are undergoing evaluationin preclinical and clinical settings, including inhibitors of check-point kinases (CHK), polo-like kinases (PLK), PARP, and survivin.Mitotic catastrophe ensues from a combination of dysfunctionalcell-cycle checkpoints, particularly those related to DNA structureand spindle assembly, along with cellular damage (45). Here, wefind that the combination of AURKA and H3K9me-HMT inhibi-tion elicits an aberrant response of checkpoint proteins, bypassingthe Chk1–Cdc25c–Cdk1–dependent G2–M arrest observed withMLN8237 alone (Fig. 6A and B), in the presence of DNA damagemarked by high P-S139-H2A.X levels (Fig. 4H–J) to culminate inmitotic catastrophe. The phenomenon of mitotic catastrophe is adesirable outcome in cancer therapy, and thus, the current study,which achieves this effect by targeting a genetic-to-epigeneticpathway, provides amodel for effective combinatorial therapeuticapproaches for PDAC, and likely other cancers.
In lieu of these findings, it is tempting to speculate howinhibition of other genetic-to-epigenetic pathways may exertsimilar effects. For instance, another well-known repressive meth-yl-histonemark, H3K27Me, mediated by the Polycomb complex,is also retained throughmitosis and required for proper cell-cycleprogression (46, 47). Similarly, the H4K20me1 demethylase,
Genetic-to-epigenetic Therapy for Pancreatic Cancer
www.aacrjournals.org Mol Cancer Res; 15(8) August 2017 995
on May 14, 2018. © 2017 American Association for Cancer Research. mcr.aacrjournals.org Downloaded from
Published OnlineFirst April 25, 2017; DOI: 10.1158/1541-7786.MCR-17-0063

PHF8, influences G2–M transition and its loss leads to highlydefective mitosis (48). Brd4, a member of the BET bromodomainfamily that has elicited significant attention as cancer targets,localizes to chromosomes during mitosis and plays an essentialrole inmitotic spindle assembly (49). Interestingly, a recent studyfound that the combination of the BET bromodomain inhibitorJQ1 and vincristine, an anti-microtubule drug that arrests cells atmitosis, synergistically induces the formation of aberrant mitoticspindles, cell cycle arrest at G2–M and death in neuroblastomacells (50). Thus, inhibition of various epigenetic pathways has thepossibility to be exploited for the efficient development of ther-apeutic modalities in the future.
In summary, the current study advances our understanding ofhow epigenetic inhibitors can be utilized in novel therapeuticapproaches.Our results outline amodel for combined targeting ofa genetic-to-epigenetic pathway to inhibit PDAC cell growth via acytotoxic mechanism that involves perturbation of normal mitot-ic progression to end inmitotic catastrophe, an attractive outcomein oncology. Furthermore, it suggests an important and provoc-ative consideration for harnessing the capacity of cell-cycle inhi-bitors in efforts to enhance the future use of epigenetic inhibitors.
Disclosure of Potential Conflicts of InterestJ.L. Iovanna is a consultant/advisory board member for Dynabio SA. No
potential conflicts of interest were disclosed by the other authors.
Authors' ContributionsConception and design: A. Mathison, J. Bintz, N.S. Buttar, J.L. Iovanna,G. Lomberk
Development of methodology: A. Mathison, A. Salmonson, M. Missfeldt,J. Bintz, S. KossakAcquisition of data (provided animals, acquired and managed patients,provided facilities, etc.): A. Mathison, A. Salmonson, M. Missfeldt, J. Bintz,M. Williams, T.M. de Assuncao, T.A. Christensen, N.S. Buttar, R. Huebert,G. LomberkAnalysis and interpretation of data (e.g., statistical analysis, biostatistics,computational analysis): A. Mathison, M. Missfeldt, J. Bintz, A. Nair,N.S. Buttar, J.L. Iovanna, G. LomberkWriting, review, and/or revision of the manuscript: A. Mathison, A. Salmonson,T.M. de Assuncao, J.L. Iovanna, R. Huebert, G. LomberkAdministrative, technical, or material support (i.e., reporting or organizingdata, constructing databases): N.S. Buttar, J.L. IovannaStudy supervision: J.L. Iovanna, G. Lomberk
AcknowledgmentsThe authors want to express our sincere gratitude to Dr. Raul Urrutia for
critical insight and valuable scientific discussions and Kristin Mantz from theMayo Clinic Microscopy and Cell Analysis Core facility for her assistance withthe Mikroscan Slide Scanner.
Grant SupportThis work was supported by funding from the NIH (grant R01 CA178627, to
G. Lomberk), the Mayo Clinic Division of Gastroenterology and Hepatology,Department of Medicine, as well as the Mayo Clinic Center for Cell Signaling inGastroenterology (P30DK084567) and the Mayo Clinic SPORE in PancreaticCancer (P50 CA102701).
The costs of publication of this articlewere defrayed inpart by the payment ofpage charges. This article must therefore be hereby marked advertisement inaccordance with 18 U.S.C. Section 1734 solely to indicate this fact.
Received February 3, 2017; revised March 31, 2017; accepted April 20, 2017;published OnlineFirst April 25, 2017.
References1. Iovanna J, Mallmann MC, Goncalves A, Turrini O, Dagorn JC. Current
knowledge on pancreatic cancer. Front Oncol 2012;2:6.2. Sharma C, Eltawil KM, Renfrew PD, Walsh MJ, Molinari M. Advances in
diagnosis, treatment and palliation of pancreatic carcinoma: 1990-2010.World J Gastroenterol 2011;17:867–97.
3. Yu X, Zhang Y, Chen C, Yao Q, Li M. Targeted drug delivery in pancreaticcancer. Biochim Biophys Acta 2010;1805:97–104.
4. Wang F, Li H, Yan XG, Zhou ZW, Yi ZG, He ZX, et al. Alisertib induces cellcycle arrest and autophagy and suppresses epithelial-to-mesenchymaltransition involving PI3K/Akt/mTOR and sirtuin 1-mediated signalingpathways in human pancreatic cancer cells. Drug Des Devel Ther2015;9:575–601.
5. Neel NF, Stratford JK, Shinde V, Ecsedy JA, Martin TD, Der CJ, et al.Response to MLN8237 in pancreatic cancer is not dependent on RalAphosphorylation. Mol Cancer Ther 2014;13:122–33.
6. Marumoto T, Zhang D, Saya H. Aurora-A - a guardian of poles. Nat RevCancer 2005;5:42–50.
7. Li D, Zhu J, Firozi PF, Abbruzzese JL, Evans DB, Cleary K, Friess H, et al.Overexpression of oncogenic STK15/BTAK/Aurora A kinase in humanpancreatic cancer. Clin Cancer Res 2003;9:991–7.
8. Zhu J, Abbruzzese JL, Izzo J, Hittelman WN, Li D. AURKA amplification,chromosome instability, and centrosome abnormality in human pancre-atic carcinoma cells. Cancer Genet Cytogenet 2005;159:10–7.
9. Hata T, Furukawa T, SunamuraM, Egawa S, Motoi F, Ohmura N, et al. RNAinterference targeting aurora kinase a suppresses tumor growth andenhances the taxane chemosensitivity in human pancreatic cancer cells.Cancer Res 2005;65:2899–905.
10. Gorgun G, Calabrese E, Hideshima T, Ecsedy J, Perrone G, Mani M, et al. Anovel Aurora-A kinase inhibitor MLN8237 induces cytotoxicity and cell-cycle arrest in multiple myeloma. Blood 2010;115:5202–13.
11. Manfredi MG, Ecsedy JA, Chakravarty A, Silverman L, Zhang M, Hoar KM,et al. Characterization of Alisertib (MLN8237), an investigational small-molecule inhibitor of aurora A kinase using novel in vivo pharmacody-namic assays. Clin Cancer Res 2011;17:7614–24.
12. Grzenda A, Leonard P, Seo S, Mathison AJ, Urrutia G, Calvo E, et al.Functional impact of Aurora A-mediated phosphorylation of HP1gammaat serine83during cell cycleprogression.EpigeneticsChromatin2013;6:21.
13. McManus KJ, Biron VL, Heit R, Underhill DA, Hendzel MJ. Dynamicchanges in histone H3 lysine 9 methylations: identification of a mitosis-specific function for dynamic methylation in chromosome congressionand segregation. J Biol Chem 2006;281:8888–97.
14. Bruns CJ, Harbison MT, Kuniyasu H, Eue I, Fidler IJ. In vivo selection andcharacterization of metastatic variants from human pancreatic adenocar-cinoma by using orthotopic implantation in nude mice. Neoplasia1999;1:50–62.
15. Chou TC, Talalay P. Quantitative analysis of dose-effect relationships: thecombined effects of multiple drugs or enzyme inhibitors. Adv EnzymeRegul 1984;22:27–55.
16. Schneider CA, Rasband WS, Eliceiri KW. NIH Image to ImageJ: 25 years ofimage analysis. Nat Methods 2012;9:671–75.
17. Longati P, Jia X, Eimer J, Wagman A, Witt MR, Rehnmark S, et al. 3Dpancreatic carcinoma spheroids induce a matrix-rich, chemoresistantphenotype offering a better model for drug testing. BMC Cancer 2013;13:95.
18. Boj SF, Hwang CI, Baker LA, Chio II, Engle DD, Corbo V, et al. Organoidmodels of human and mouse ductal pancreatic cancer. Cell 2015;160:324–38.
19. Grippo PJ, Nowlin PS, Demeure MJ, Longnecker DS, Sandgren EP.Preinvasive pancreatic neoplasia of ductal phenotype induced by acinarcell targeting of mutant Kras in transgenic mice. Cancer Res 2003;63:2016–19.
20. Fernandez-Zapico ME, Lomberk GA, Tsuji S, DeMars CJ, Bardsley MR, LinYH, et al. A functional family-wide screening of SP/KLF proteins identifies asubset of suppressors of KRAS-mediated cell growth. Biochem J2011;435:529–37.
21. Gebelein B, Urrutia R. Sequence-Specific Transcriptional Repression byKS1, amultiple-zinc-finger-kruppel-associated box protein. Molecular andCellular Biology 2001;21:928–39.
Mathison et al.
Mol Cancer Res; 15(8) August 2017 Molecular Cancer Research996
on May 14, 2018. © 2017 American Association for Cancer Research. mcr.aacrjournals.org Downloaded from
Published OnlineFirst April 25, 2017; DOI: 10.1158/1541-7786.MCR-17-0063

22. MathisonA,GrzendaA, LomberkG, VelezG,ButtarN, Tietz P, et al. Role forKruppel-like transcription factor 11 in mesenchymal cell function andfibrosis. PLoS One 2013;8:e75311.
23. Dowsett M, Nielsen TO, A'Hern R, Bartlett J, Coombes RC, Cuzick J, et al.Assessment of Ki67 in breast cancer: recommendations from the Interna-tional Ki67 in Breast Cancer working group. J Natl Cancer Inst 2011;103:1656–64.
24. Kalari KR, Nair AA, Bhavsar JD, O'Brien DR, Davila JI, Bockol MA, et al.MAP-RSeq: mayo analysis pipeline for RNA sequencing. BMC Bioinfor-matics 2014;15:224.
25. Kim D, Pertea G, Trapnell C, Pimentel H, Kelley R, Salzberg SL. TopHat2:accurate alignment of transcriptomes in the presence of insertions, dele-tions and gene fusions. Genome Biol 2013;14:R36.
26. RobinsonMD,McCarthyDJ, SmythGK. edgeR: a Bioconductor package fordifferential expression analysis of digital gene expression data. Bioinfor-matics 2010;26:139–40.
27. Harrington E, Bebbington D, Moore J, Rasmussen R, Ajose-Adeogun A,Nakayama T, et al. VX-680, a potent and selective small-molecule inhibitorof the Aurora kinases, suppresses tumor growth in vivo. Nat Med 2004;10:262–7.
28. Xie L, Kassner M, Munoz R, Que Q, Kiefer J, Zhao Y, et al. Kinome-widesiRNA screening identifies molecular targets mediating the sensitivity ofpancreatic cancer cells to Aurora kinase inhibitors. Biochem Pharmacol2012;83:452–61.
29. Saksouk N, Simboeck E, Dejardin J. Constitutive heterochromatin forma-tion and transcription in mammals. Epigenetics Chromatin 2015;8:3.
30. Iwasa E, Hamashima Y, Fujishiro S, Higuchi E, Ito A, YoshidaM, et al. Totalsynthesis of (þ)-chaetocin and its analogues: their histonemethyltransfer-ase G9a inhibitory activity. J Am Chem Soc 2010;132:4078–9.
31. OnKF, Chen Y, TangMaH,Chow JPH, PoonRYC.Determinants ofmitoticcatastrophe on abrogation of the G2DNAdamage checkpoint byUCN-01.Mol Cancer Ther 2011;10:784–94.
32. Meng Y, Yi X, Li X, Hu C, Wang J, Bai L, et al. The non-coding RNAcomposition of the mitotic chromosome by 5'-tag sequencing. NucleicAcids Res 2016;44:4934–46.
33. Marechal A, Zou L.DNAdamage sensing by theATMandATRkinases. ColdSpring Harb Perspect Biol 2013;5:pii:a012716.
34. Sanchez Y,Wong C, Thoma RS, Richman R,Wu Z, Piwnica-WormsH, et al.Conservation of the Chk1 checkpoint pathway in mammals: linkage ofDNA damage to Cdk regulation through Cdc25. Science 1997;277:1497–501.
35. Taylor WR, Stark GR. Regulation of the G2/M transition by p53. Oncogene2001;20:1803–15.
36. Huang X, Tran T, Zhang L, Hatcher R, Zhang P. DNA damage-inducedmitotic catastrophe is mediated by the Chk1-dependent mitotic exit DNAdamage checkpoint. Proc Natl Acad Sci U S A 2005;102:1065–70.
37. Jurvansuu J, Fragkos M, Ingemarsdotter C, Beard P. Chk1 Instability iscoupled to mitotic cell death of p53-deficient cells in response to virus-induced DNA damage signaling. J Mol Biol 2007;372:397–406.
38. Lee M, Lee JS. Exploiting tumor cell senescence in anticancer therapy. BMBRep 2014;47:51–9.
39. Katsha A, Belkhiri A, Goff L, El-Rifai W. Aurora kinase A in gastrointestinalcancers: time to target. Mol Cancer 2015;14:106.
40. Liu Y, Hawkins OE, Su Y, Vilgelm AE, Sobolik T, Thu Y-M, et al. Targetingaurora kinases limits tumour growth through DNA damage-mediatedsenescence and blockade of NF-kB impairs this drug-induced senescence.EMBO Mol Med 2013;5:149–66.
41. Durlacher CT, Li ZL, Chen XW, He ZX, Zhou SF. An update on thepharmacokinetics and pharmacodynamics of alisertib, a selectiveAurora kinase A inhibitor. Clin Exp Pharmacol Physiol 2016;43:585–601.
42. Jeppesen P, Mitchell A, Turner B, Perry P. Antibodies to defined histoneepitopes reveal variations in chromatin conformation and underacetyla-tion of centric heterochromatin in human metaphase chromosomes.Chromosoma 1992;101:322–32.
43. Galluzzi L, Vitale I, Abrams JM, Alnemri ES, Baehrecke EH, BlagosklonnyMV, et al. Molecular definitions of cell death subroutines: recommenda-tions of the nomenclature committee on cell death 2012. Cell Death Differ2012;19:107–20.
44. Denisenko TV, Sorokina IV, Gogvadze V, Zhivotovsky B. Mitotic catastro-phe and cancer drug resistance: a link that must to be broken. Drug ResistUpdat 2016;24:1–12.
45. Castedo M, Perfettini JL, Roumier T, Andreau K, Medema R, Kroemer G.Cell death by mitotic catastrophe: a molecular definition. Oncogene2004;23:2825–37.
46. Zaret KS.Genome reactivation after the silence in mitosis: recapitulatingmechanisms of development? Dev Cell 2014;29:132–4.
47. Aoto T, Saitoh N, Sakamoto Y, Watanabe S, Nakao M. Polycombgroup protein-associated chromatin is reproduced in post-mitotic G1phase and is required for S phase progression. J Biol Chem 2008;283:18905–15.
48. Lim HJ, Dimova NV, Tan MK, Sigoillot FD, King RW, Shi Y. The G2/Mregulator histone demethylase PHF8 is targeted for degradation by theanaphase-promoting complex containing CDC20. Mol Cell Biol 2013;33:4166–80.
49. Dey A, Nishiyama A, Karpova T, McNally J, Ozato K. Brd4 marks selectgenes onmitotic chromatin and directs postmitotic transcription. Mol BiolCell 2009;20:4899–909.
50. Liu PY, SokolowskiN, Guo ST, Siddiqi F, Atmadibrata B, Telfer TJ, et al. TheBET bromodomain inhibitor exerts the most potent synergistic anticancereffects with quinone-containing compounds and anti-microtubule drugs.Oncotarget 2016;7:79217–32.
www.aacrjournals.org Mol Cancer Res; 15(8) August 2017 997
Genetic-to-epigenetic Therapy for Pancreatic Cancer
on May 14, 2018. © 2017 American Association for Cancer Research. mcr.aacrjournals.org Downloaded from
Published OnlineFirst April 25, 2017; DOI: 10.1158/1541-7786.MCR-17-0063

2017;15:984-997. Published OnlineFirst April 25, 2017.Mol Cancer Res Angela Mathison, Ann Salmonson, Mckenna Missfeldt, et al. Cell Growth By Inducing Mitotic CatastropheCombined AURKA and H3K9 Methyltransferase Targeting Inhibits
Updated version
10.1158/1541-7786.MCR-17-0063doi:
Access the most recent version of this article at:
Material
Supplementary
http://mcr.aacrjournals.org/content/suppl/2017/07/12/1541-7786.MCR-17-0063.DC1
Access the most recent supplemental material at:
Cited articles
http://mcr.aacrjournals.org/content/15/8/984.full#ref-list-1
This article cites 50 articles, 17 of which you can access for free at:
E-mail alerts related to this article or journal.Sign up to receive free email-alerts
Subscriptions
Reprints and
To order reprints of this article or to subscribe to the journal, contact the AACR Publications Department at
Permissions
Rightslink site. Click on "Request Permissions" which will take you to the Copyright Clearance Center's (CCC)
.http://mcr.aacrjournals.org/content/15/8/984To request permission to re-use all or part of this article, use this link
on May 14, 2018. © 2017 American Association for Cancer Research. mcr.aacrjournals.org Downloaded from
Published OnlineFirst April 25, 2017; DOI: 10.1158/1541-7786.MCR-17-0063