
Combating overheating: mixed-mode conditioning for ...
20
Full Terms & Conditions of access and use can be found at http://www.tandfonline.com/action/journalInformation?journalCode=rbri20 Download by: [University of Technology Sydney] Date: 30 November 2016, At: 15:58 Building Research & Information ISSN: 0961-3218 (Print) 1466-4321 (Online) Journal homepage: http://www.tandfonline.com/loi/rbri20 Combating overheating: mixed-mode conditioning for workplace comfort Leena E. Thomas To cite this article: Leena E. Thomas (2017) Combating overheating: mixed-mode conditioning for workplace comfort, Building Research & Information, 45:1-2, 176-194, DOI: 10.1080/09613218.2017.1252617 To link to this article: http://dx.doi.org/10.1080/09613218.2017.1252617 © 2016 The Author(s). Published by Informa UK Limited, trading as Taylor & Francis Group Published online: 30 Nov 2016. Submit your article to this journal View related articles View Crossmark data
Transcript of Combating overheating: mixed-mode conditioning for ...

Full Terms & Conditions of access and use can be found athttp://www.tandfonline.com/action/journalInformation?journalCode=rbri20
Download by: [University of Technology Sydney] Date: 30 November 2016, At: 15:58
Building Research & Information
ISSN: 0961-3218 (Print) 1466-4321 (Online) Journal homepage: http://www.tandfonline.com/loi/rbri20
Combating overheating: mixed-mode conditioningfor workplace comfort
Leena E. Thomas
To cite this article: Leena E. Thomas (2017) Combating overheating: mixed-modeconditioning for workplace comfort, Building Research & Information, 45:1-2, 176-194, DOI:10.1080/09613218.2017.1252617
To link to this article: http://dx.doi.org/10.1080/09613218.2017.1252617
© 2016 The Author(s). Published by InformaUK Limited, trading as Taylor & FrancisGroup
Published online: 30 Nov 2016.
Submit your article to this journal
View related articles
View Crossmark data

RESEARCH PAPER
Combating overheating: mixed-mode conditioning for workplace comfort
Leena E. Thomas
School of Architecture, Faculty of Design Architecture and Building, University of Technology Sydney, Sydney, NSW, Australia
ABSTRACTUsing post-occupancy evaluations of seven mixed-mode buildings – three in Australia and four inIndia – this paper demonstrates that effective mixed-mode conditioning (instead of year-round air-conditioning) can deliver comfortable workspaces. Occupant feedback reinforces strongassociations between overheating, thermal comfort, overall comfort and perceived productivity.However, differing levels of thermal acceptability within and between the Australian and Indiancontexts are evident. Occupants in the Indian buildings were found to tolerate a wider range oftemperatures when compared with Western contexts where lower temperature limits entrenchan energy demand through a greater reliance on air-conditioning. The outcomes from the studysuggest that the perception of overheating and consequent risk to building performance can beintensified when occupants perceive limited adaptive opportunity or problems are not rectifiedquickly, whereas perceived control is less important where building systems are user responsive.Occupants in three of the study buildings also perceived higher-than-anticipated comfort whichcould be attributable to well-liked attributes, such as break-out spaces, daylight and fresh airincluded in these buildings. The findings challenge designers and clients to develop user-responsive climate interactive workplaces that capitalize on spatial and mixed-modeenvironmental control to tackle the question of overheating.
KEYWORDSagency; mixed mode;occupant satisfaction; offices;overheating; post-occupancyevaluation (POE); thermalcomfort; workplace design;Australia; India
Introduction
Thermal comfort as experienced by occupants is widelyaccepted to play a critical role in influencing overall com-fort. Discomfort from overheating in buildings has a det-rimental effect on occupants’ wellbeing and productivity(Candido, Kim, de Dear, & Thomas, 2016; Leaman &Bordass, 1999; Vischer, 2007; Wyon, 2004). From abuilding energy perspective, the notion of overheatingis typically understood using a ‘universal’ heat balancemodel for thermal comfort (Fanger, 1970) where theexceedance of temperatures above a prescribed limitcauses discomfort. To mitigate this discomfort, thesource of overheating can be eliminated/reduced orenergy can be expended on cooling to offset it. Nonethe-less, this standardized management of thermal con-ditions is questioned by others who recognize thermalcomfort to be a ‘socio-cultural achievement’ (Chappells& Shove, 2005; Cole, Robinson, Brown, & O’Shea,2008) based on ideas of thermal delight (Heschong,1979) and adaptation (de Dear & Brager, 1998; Hum-phreys, 1978; Nicol, Raja, Allaudin, & Jamy, 1999).
Adaptive models of comfort (de Dear & Brager, 1998;Nicol & Humphreys, 2010) in standards such as ASH-RAE-55 2013 and EN 15251 (CEN, 2012) define a widerrange of comfort temperatures for naturally ventilatedbuildings that are more compatible with the outdoor con-ditions. However, year round air-conditioning (AC), oftenjustified by Fanger’s predicted mean vote (PMV) model, isfast becoming entrenched as the primary means to combatoverheating in workspaces across the world (Ackermann,2002; Cox, 2012; Ürge-Vorsatz, Cabeza, Serrano, Barre-neche, & Petrichenko, 2015). This use of AC continueseven when the risk of overheating is only restricted to apart of the year. Leasing agreements and rating toolsfurther reinforce this practice due to the framing ofmost criteria and guidelines that support and reward thetraditional heating, ventilation and air-conditioning(HVAC) perspective (Thomas & Thomas, 2010).
The consequences of this approach in developingcountries like India are significant. Unrestrained develop-ment of commercial workspaces (Kumar, Kapoor, Desh-mukh, Kamath, & Manu, 2010), coupled with anincreasing uptake of premium-grade buildings designed
© 2016 The Author(s). Published by Informa UK Limited, trading as Taylor & Francis GroupThis is an Open Access article distributed under the terms of the Creative Commons Attribution-NonCommercial-NoDerivatives License (http://creativecommons.org/licenses/by-nc-nd/4.0/), which permits non-commercial re-use, distribution, and reproduction in any medium, provided the original work is properly cited, and is not altered, transformed, or built upon inany way.
CONTACT Leena E. Thomas [email protected]
BUILDING RESEARCH & INFORMATION2017, VOL. 45, NOS. 1–2, 176–194http://dx.doi.org/10.1080/09613218.2017.1252617

to deliver a homogenous thermal environment 22.5 ± 1.5°C AC all year round (Cox, 2012) has the potential to takeIndia to a tipping point in terms of unbridled energy con-sumption (Sivak, 2009; Ürge-Vorsatz et al., 2015).
Mixed-mode buildings use AC only when the indoorconditions are outside the acceptable comfort range.These buildings are a hybrid of fully AC and natural ven-tilation. Although studies suggest these buildings improvecomfort, productivity and air quality (Brager, 2006; Lea-man & Bordass, 2001) and save energy when comparedwith conventional AC buildings (Brager, 2000; CIBSE,2000; Rowe, 2003), mixed-mode operation is poorlyunderstood and its uptake remains low. For example, sti-pulation of the PMV model for the AC (active) mode, asseen in ASHRAE-55, has meant that in practice the extentto which a building can operate in the naturally ventilated(passive) mode is typically governed by AC thermostatsettings rather than any wider band of operative tempera-tures that might have been permissible under the adaptivemodel. This in turn reduces the viability of designing abuilding that might operate in two modes – already per-ceived to be a challenge.
A recent field study (India Model of Adaptive ThermalComfort – IMAC) (Manu, Shukla, Rawal, Thomas, & deDear, 2016) found Indian occupants to be even moreadaptive than predicted by the adaptive models for natu-rally ventilated buildings within ASHRAE-55, 2013 andEN 1525, reinforcing the socio-cultural notion of thermalcomfort. Significantly, the IMAC study also established asingle model of comfort for mixed-mode buildings that isstatistically valid for both AC and naturally ventilatedmodes. The model, applicable for 30-day outdoor runningmean air temperatures ranging from 13.0 to 38.5°C, showsneutral operative temperature varies from 21.5 to 28.7°C,and affords a ± 3.5°C range for 90% acceptability.
This paper investigates the context-specific opportu-nities and constraints for pursuing mixed-mode build-ings as a means to combat overheating. It draws onfeedback from mixed-mode buildings subject to arange of thermal comfort regimes and environmentalcontrol systems of different types from Australia andIndia. In particular, it seeks to identify why some build-ings work well and others do not, what lessons can beapplied more broadly towards alternate approaches tocomfort in the workplace across both contexts.
Methods
The paper develops a rich narrative of building perform-ance for seven mixed-mode buildings – three in Austra-lia and four in India – using a post-occupancy evaluation(POE) framework (Bordass, Leaman, & Ruyssevelt, 2001;
Vischer, 2007) to interrogate building design, operationand user feedback. The research presented emphasizesthe interrelationships between approaches to environ-mental control, designed attributes and outcomes forthe occupants in the two contexts.
The Australian buildings (Aus1 in Sydney; Aus2 andAus3 in Melbourne) are located in a temperature climatecharacterized by warm/hot summer and cool winters.The four Indian buildings are located in relativelymore challenging conditions – Ind1 and Ind2 in thecomposite climate of the National Capital Region(Delhi) characterized by long, hot summers, a humidmonsoon and dry, cool winters; while Ind3 and Ind4are located in the hot, dry climate of Ahmedabad (Bansal& Minke, 1995). The buildings selected for analysisinclude a range of mixed-mode systems (see Table 1and detailed descriptions below) that are adopted forcontemporary workplaces in those countries. Six of theseven buildings (except Ind4) were designed with anexplicit intent to include environmentally sustainabledesign features and principles, as detailed below. TheIndian study buildings were part of the India Modelfor Adaptive Thermal Comfort (IMAC) (Manu et al.,2016) dataset and in all cases included active systemsfor cooling. Given the emphasis on combating overheat-ing in this paper, some of the mixed-mode buildings inthe IMAC study are not included here because theyused active systems only for winter heating.
The study approach included a review of projectinformation, site visits and interviews with key stake-holders (owner/developer, design team and buildingmanager) to gain an understanding of the individualbuildings, their environmental control systems and per-formance in use. Building occupants in all seven build-ings were surveyed using the Building Use Studies(BUS) Workplace Questionnaire (paper based) to gaintheir feedback on the long-term use of building.Additional feedback on issues that occupants raised inthe BUS surveys was also elicited using focus groupsfor Aus2 and Aus3. The BUS surveys were administeredafter a minimum of one year of occupancy in six cases,but nine months of occupancy in the case of Ind2.This ensured that occupants had experienced the fullrange of seasonal variation in the building, while over-coming any ‘Hawthorne effect’ (Landsberger, 1958).The BUS survey elicits feedback on over 44 benchmarkedvariables ranging from thermal comfort in summer andwinter to design and perceived productivity (Leaman &Bordass, 2007). With the Indian monsoon considered adistinct season with potential overheating implications,additional questions regarding thermal comfort and airquality in the monsoon were included for the Indianstudy buildings. The BUS variables discussed in this
BUILDING RESEARCH & INFORMATION 177
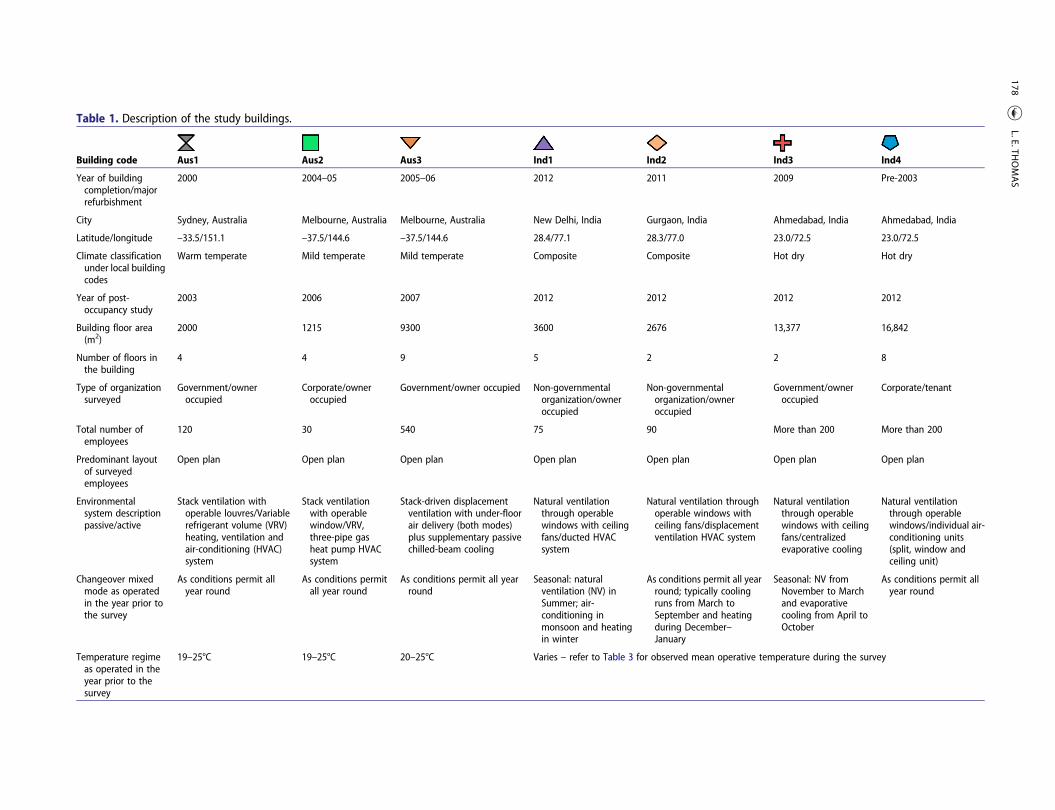
Table 1. Description of the study buildings.
Building code Aus1 Aus2 Aus3 Ind1 Ind2 Ind3 Ind4
Year of buildingcompletion/majorrefurbishment
2000 2004–05 2005–06 2012 2011 2009 Pre-2003
City Sydney, Australia Melbourne, Australia Melbourne, Australia New Delhi, India Gurgaon, India Ahmedabad, India Ahmedabad, India
Latitude/longitude –33.5/151.1 –37.5/144.6 –37.5/144.6 28.4/77.1 28.3/77.0 23.0/72.5 23.0/72.5
Climate classificationunder local buildingcodes
Warm temperate Mild temperate Mild temperate Composite Composite Hot dry Hot dry
Year of post-occupancy study
2003 2006 2007 2012 2012 2012 2012
Building floor area(m2)
2000 1215 9300 3600 2676 13,377 16,842
Number of floors inthe building
4 4 9 5 2 2 8
Type of organizationsurveyed
Government/owneroccupied
Corporate/owneroccupied
Government/owner occupied Non-governmentalorganization/owneroccupied
Non-governmentalorganization/owneroccupied
Government/owneroccupied
Corporate/tenant
Total number ofemployees
120 30 540 75 90 More than 200 More than 200
Predominant layoutof surveyedemployees
Open plan Open plan Open plan Open plan Open plan Open plan Open plan
Environmentalsystem descriptionpassive/active
Stack ventilation withoperable louvres/Variablerefrigerant volume (VRV)heating, ventilation andair-conditioning (HVAC)system
Stack ventilationwith operablewindow/VRV,three-pipe gasheat pump HVACsystem
Stack-driven displacementventilation with under-floorair delivery (both modes)plus supplementary passivechilled-beam cooling
Natural ventilationthrough operablewindows with ceilingfans/ducted HVACsystem
Natural ventilation throughoperable windows withceiling fans/displacementventilation HVAC system
Natural ventilationthrough operablewindows with ceilingfans/centralizedevaporative cooling
Natural ventilationthrough operablewindows/individual air-conditioning units(split, window andceiling unit)
Changeover mixedmode as operatedin the year prior tothe survey
As conditions permit allyear round
As conditions permitall year round
As conditions permit all yearround
Seasonal: naturalventilation (NV) inSummer; air-conditioning inmonsoon and heatingin winter
As conditions permit all yearround; typically coolingruns from March toSeptember and heatingduring December–January
Seasonal: NV fromNovember to Marchand evaporativecooling from April toOctober
As conditions permit allyear round
Temperature regimeas operated in theyear prior to thesurvey
19–25°C 19–25°C 20–25°C Varies – refer to Table 3 for observed mean operative temperature during the survey
178L.E.TH
OMAS

paper are summarized in Table 2. Whereas overheatingis typically characterized with respect to monitoredtemperature data assessed against predetermined ther-mal comfort criteria, this paper foregrounds occupantfeedback as the primary indicator of overheating – inparticular their overall satisfaction with respect to ther-mal comfort rated on a seven-point A-type scale(where 1 is worst, 7 is best, and dissatisfaction is com-puted as those rating as 1, 2 or 3), and whether they per-ceive conditions in each of the seasons as being too hot ortoo cold (4 is best, 1 = too hot; 7 = too cold).
Occupant feedback with respect to questions of over-all comfort, control over cooling and effectiveness ofresponse to requests for change is investigated in relationto the feedback for thermal comfort – while consistentlyrecognizing the particular contexts of the individualbuildings in terms of designed attributes, environmentalcontrol strategies and ongoing operation. Occupant rat-ings of satisfaction with thermal comfort and overallcomfort are also compared against perceived pro-ductivity and health in order to gauge if environmentalconditions pose impediments to getting work done effec-tively or impact occupants perception of health. Occu-pant perception of productivity and health have beenargued to provide appropriate and practical indicatorswhich are consistent for all respondents in a buildingand also enables comparison across buildings (Leaman& Bordass, 1999; Sullivan, Baird & Donn, 2013) in con-trast to the use of indicators such as ‘sick days off’ or ‘keyboard strokes’ which are becoming less relevant for con-temporary workforces across the globe.
As a point of comparison, in the case of the Indianbuildings, this paper also draws on thermal comfortfield study (TCS) data for the four Indian buildings com-prising a ‘right here right now’ survey and physicalmeasurements. These data were originally collated to dis-til the adaptive models for naturally ventilated andmixed-mode buildings in the IMAC study (Manuet al., 2016) using the field methods and data analysesprotocols of the ASHRAE RP-884 precedent (de Dear& Brager, 1998). The ‘right here right now’ survey wasadministered to occupants at each workplace, once perseason – summer, winter and monsoon, with responsessought for thermal sensation, temperature preferenceand thermal acceptability, air movement preference,clothing insulation level and metabolic activity. Indoorclimatic parameters experienced by each respondentwere simultaneously logged, including air temperature,globe temperature, relative humidity and air velocity.Methods and instrumentation are further detailed inManu et al. (2016).
The approach of examining TCS data against long-term feedback enables a better understanding of the
extent that occupants in the subcontinent adapt to thecomposite and hot, dry climates in which they arelocated, and where opportunities and caveats lie. Rel-evant metrics are mean thermal sensation, percentageof respondents rating thermal conditions as unaccepta-ble, coincident indoor operative temperatures as well ascalculated neutral operative temperatures and infor-mation on the extent of the use of fans. These aspectsand associated notes are summarized in Table 3.
Although equivalent ‘right here right now’ surveyand physical measurements were not elicited at thetime of the Australian POE studies, all three buildingswere operated within predetermined temperature cri-teria monitored by the building management system(BMS) on a zone-by-zone basis within these buildings.Given that temperature modulation in the occupiedzones is controlled by the BMS sensors, it can be arguedthat space temperatures would generally stay within thestipulated temperature ranges set within the BMS. Atthe outset it is worth noting that all three Australianbuildings were originally operated to a 25°C coolingset-point to govern the shift to passive cooling.Although less stringent than the typical 24°C limit inAC buildings, the limit is more conservative thanwould be permitted for the passive mode under theASHRAE-55 adaptive comfort model for in summer.For 90% acceptability the limits for Sydney and Mel-bourne would be 26.5 and 25.8°C respectively, andlimits for 80% acceptability would be 28.2 and 26.8°Crespectively.1
The three Australian buildings were monitored foractual energy performance (total energy) using theNABERS energy rating protocol (National AustralianBuilding Environmental Rating Scheme)2 at a timewhen the top performance level of 5 Stars (176 kgCO2/m2a for Sydney and 181 kgCO2/m
2a for Melbourne) rep-resented a 47% improvement over the 2.5-Star industryaverage. Consistent energy monitoring was not con-ducted as part of the original study of the Indian build-ings. Consequently, as a secondary point of reference,parametric building energy simulation (using Energy-Plus) of a five-zone building model under different set-points is used to generate potential energy savingsfrom cooling when capitalizing on the greater toleranceof temperature in Sydney, Melbourne, Delhi andAhmedabad.
A brief description of the seven buildings is summar-ized in Table 1. Sectional drawings of these buildings areprovided in Figure 1, and relevant BUS and TCS resultsare summarized in Tables 2 and 3 respectively. The per-tinent outcomes for each building are discussed below inrelation to design approach, building attributes andenvironmental control strategies. Broader lessons for
BUILDING RESEARCH & INFORMATION 179

Table 2. Summary of BUS study results.
Building code Aus1 Aus2 Aus3 Ind1 Ind2 Ind3 Ind4
City Sydney Melbourne Melbourne New Delhi Gurgaon Ahmedabad Ahmedabad
Number of responses 59.0 26.0 260.0 44.0 58.0 180.0 157.0
Benchmark datasetused for comparison
Australian Australian Australian International International International International
Year of survey 2003 2006 2007 2013 2013 2013 2013
Variable Score%
Dissatisfied Result Score%
Dissatisfied Result Score%
Dissatisfied Result Score%
Dissatisfied Result Score%
Dissatisfied Result Score%
Dissatisfied Result Score%
Dissatisfied Result
Temperature insummer – overall
3.2 58% Worse 5.4 10% Better 4.5 31% Better 3.1 64% Worse 5.4 12% Better 2.5 76% Worse 4.9 16% Better
Temperature insummer – hot/cold
3.2 40% 3.7 5% 3.3 23% 2.8 49% 4.5 25% 2.0 69% 4.1 17%
% Rating too hot 33% 5% 21% 45% 2% 69% 9%
Air in summer –overall
3.1 66% Worse 5.6 11% Better 4.5 28% Better 3.9 39% Nodifference
5.4 7% Better 3.2 55% Worse 4.7 19% Better
Temperature in themonsoon – overall
4.8 20% 5.4 4% 4.7 16% 4.9 8%
Temperature in themonsoon – hot/cold
4.2 13% 4.3 9% 4.1 7% 4.4 12%
% Rating too hot 5% 2% 5% 1%
Air in the monsoon –overall
4.7 12% 5.3 0% 4.5 15% 4.9 8%
Temperature inwinter – overall
3.4 55% Worse 4.4 31% Better 4.7 26% Better 4.3 15% Nodifference
6.0 1% Better 5.8 4% Better 5.4 8% Better
Temperature inwinter – hot/cold
4.8 47% 5.1 38% 4.1 28% 5.5 48% 4.2 3% 4.4 9% 4.6 17%
% Rating too hot 9% 0% 12% 0% 2% 1% 1%
Air in winter overall 3.4 60% Worse 4.4 40% Nodifference
4.7 25% Better 4.8 16% Nodifference
5.7 5% Better 5.3 6% Better 5.1 5% Better
Lighting – overall 5.1 14% Nodifference
6.0 8% Better 4.2 37% Nodifference
6.0 0% Better 6.2 0% Better 5.8 5% Better 5.5 10% Better
Noise – overall 3.4 60% Worse 5.1 15% Better 4.2 38% Nodifference
5.2 11% Better 5.6 9% Better 5.0 21% Better 4.7 24% Better
Comfort overall 3.6 46% Worse 5.7 12% Better 4.9 22% Better 5.1 7% Nodifference
5.6 1% Better 4.7 16% Nodifference
4.7 13% Nodifference
Control over cooling 1.8 90% Worse 2.4 73% Nodifference
1.5 93% Worse 2.6 65% Worse 2.7 62% Nodifference
2.5 73% Worse 4.2 30% Nodifference
% Rating control over coolingas important
46% 23% 13% 27% 34% 34% 22%
Control over heating 1.8 91% Worse 2.4 73% Nodifference
1.5 92% Worse 2.5 67% Worse 2.5 66% Worse 1.1 97% Worse 3.5 46% Nodifference
180L.E.TH
OMAS

% Rating control over heatingas important
46% 19% 12% 23% 19% 8% 12%
Control overventilation
2.0 86% Worse 2.0 81% Worse 1.9 83% Worse 4.9 20% Better 3.3 54% Nodifference
3.9 41% Nodifference
3.2 55% Nodifference
% Rating control overventilation as important
42% 15% 16% 34% 17% 12% 16%
Control over lighting 1.7 90% Worse 4.0 42% Nodifference
2.8 65% Worse 5.8 5% Better 4.4 31% Better 4.6 28% Better 4.0 33% Nodifference
% Rating control over lightingas important
37% 15% 21% 41% 22% 2% 15%
Control over noise 1.9 89% Worse 2.6 65% Nodifference
1.9 85% Worse 3.9 33% Nodifference
3.4 47% Nodifference
2.1 81% Worse 3.0 60% Nodifference
% Rating control over noise asimportant
34% 31% 17% 32% 26% 5% 15%
Effectiveness of response to requests for changes 4.8 27% 4.9 25% Better 4.6 31% Better 2.9 60% Worse 4.5 24% Better
Design 3.7 46% Worse 6.3 4% Better 5.5 7% Better 5.8 2% Better 6.4 0% Better 4.4 29% Nodifference
4.4 19% Nodifference
Do facilities meetneeds?
4.2 37% Nodifference
5.9 8% Better 5.2 10% Nodifference
5.5 4% Better 6.0 1% Better 4.8 18% Nodifference
5.1 9% Nodifference
Health (perceived) 3.1 56% Worse 4.7 4% Better 4.6 21% Better 4.7 6% Better 5.1 2% Better 4.7 13% Better 4.6 14% Better
Productivity(perceived)
–13.5 46% Worse 6.0 4% Better 5.5 11% Better 2.8 36% Nodifference
11.7 14% Better 1.4 23% Nodifference
8.5 19% Better
Forgiveness 1.0 1.1 1.1 1.1 1.0 1.0 0.9
Each variable above is rated on a 7-point A type scale (1 is worst, 7 is best) with the exception of perceived productivity rated on a 9-point scale and Temperature Hot/Cold (4 is best, 1=Too Hot; 7=Too Cold).% dissat refers to percentage of dissatisfied respondents. For variables on an A Type scale this refers to those rating as 1, 2 or 3 on the 7-point scale and for B type scale this refers to those rating 1, 2 or 6, 7. For the Temperature Hot/Cold variable, additionalinformation as to only those voting 1, 2 (too hot) is also provided
Result indicates if the mean building score is significantly Better or Worse or No diff (No different) to the mean of the corresponding benchmark dataset for the year of study.Forgiveness is a measure of tolerance and is calculated as Comfort Score/Average of scores for Temperature, Air, Noise, and Lighting. If this ratio is greater than 1, it means occupants are forgiving.
BUILD
INGRESEA
RCH&INFO
RMATIO
N181

Table 3. Selected thermal comfort field study (TCS) survey results for Indian study buildings.Building information Field measurements and derived parameters Field survey Calculated indices Adaptive measures
Surveymonth in2012
Respondentmode
Numberof votes
Mean indoorair
temperature(°C), avg_ta
Mean indoorradiant
temperature(°C), avg_tr
Meanindoorrelativehumidity
(%),avg_rh
Meanindoorairspeed(m/s),
avg_vel_a
Meanmetabolicactivity(met),
avg_met
Meaninsulationchair +clothing(clo),
avg_insul
30-Dayoutdoorrunningmean, tâ
(°C)
7-Dayoutdoorrunningmean (°C), out7day_ta
Mean indooroperative
temperature(°C), avg_top
MeanASHRAEthermalsensationvote (+3hot; –3cold),
avg_ash
Thermalacceptability;% rating
unacceptable,tsa_dissat%
Meanofficecomfortscore/(1,7),
avg_comf
PMV (+3hot; –3cold),
avg_pmv
PPD(%),
avg_ppd
Indicativeresults forneutraloperative
temperature(°C), Topneut
(LR)
% Usingceiling orpedestalfans
%Openingwindows(partiallyor fullyopen)
Ind1Summer June NV 66 36.2 36.3 43% 0.5 1.2 0.8 38.8 40.6 36.2 1.7 65% 4.3 3.0 100% 100% 39%Monsoon August AC 45 26.9 27.3 62% 0.2 1.3 0.8 34.2 32.3 27.1 –0.1 4% 5.6 1.1 39% 28.2 53% 0%Winter December AC 52 17.9 17.7 52% 0.1 1.2 2.2 20.2 18.4 17.8 –1.0 54% 5.0 0.5 12% 0% 0%
Ind2Summer June AC 55 26.1 26.4 43% 0.2 1.2 0.8 38.9 39.9 26.2 –0.1 13% 6.4 0.6 19% 27.4 69% 11%Monsoon August AC 62 25.2 25.6 60% 0.2 1.2 0.8 33.9 31.3 25.4 –0.1 5% 6.1 0.6 20% 26.1 37% 0%Winter February NV 64 24.1 23.6 38% 0.1 1.3 1.5 15.3 15.7 23.9 0.1 5% 6.0 0.9 24% 22.4 0% 8%
Ind3Summer May AC 194 33.5 33.6 48% 0.5 1.1 1.0 35.5 32.9 33.6 1.6 65% 4.2 2.7 94% 27.9 98% 34%Monsoon August AC 170 29.8 29.7 74% 0.5 1.2 0.8 31.2 28.5 29.7 0.3 24% 4.9 1.7 64% 26.3 98% 62%Winter Jane NV 186 24.4 24.1 31% 0.1 1.2 1.1 22.0 21.8 24.3 –0.2 9% 5.2 0.5 14% 26.3 0% 23%
Ind4
Summer May AC 180 25.3 26.0 47% 0.1 1.2 1.1 35.6 32.9 25.6 –0.2 20% 5.6 0.9 24% 26.3 0% 0%Monsoon July NV 46 24.8 25.4 56% 0.1 1.3 0.8 31.7 28.9 25.1 –0.4 4% 5.3 0.7 17% 0% 0%Monsoon July AC 131 24.5 25.2 54% 0.1 1.2 0.8 31.7 28.9 24.8 –0.4 12% 5.4 0.5 14% 29.5 1% 0%Winter January NV 112 25.6 25.6 49% 0.1 1.2 1.1 22.1 21.0 25.6 –0.1 12% 4.9 0.9 25% 26.4 1% 0%Winter January AC 57 25.2 25.2 47% 0.1 1.2 0.9 22.1 21.0 25.2 –0.4 11% 5.3 0.6 18% 26.7 0% 0%
Note: AC = air-conditioning; NV = natural ventilation.– Office occupants’ response to thermal sensation avg_ash is recorded on a seven point ASHRAE thermal sensation scale (+3 hot; -3 cold)– tsa_dissat% is the percentage of occupants rating ‘unacceptable’ for thermal acceptability on a binary scale (1 = unacceptable, 2 = acceptable)– Office comfort (right here, right now) is rated on a 7-point A type scale (1 = uncomfortable to 7 = comfortable)– The 7 day outdoor running mean air temperature out7day_ta and the 30-day outdoor running mean air temperature out30day_ta are derived from weather station data.– The average Predicted Mean Vote avg_pmv and predicted percent dissatisfied avg_ppd for each cohort are calculated from field measurements.– Neutral Operative Temperature Topneut (LR) is derived using linear regression on observed thermal sensation controlling for extrapolation outside observed range.
182L.E.TH
OMAS

combating overheating in workplaces from these studiesin relation to the literature and the author’s experience ofother buildings in both countries/contexts are discussedbelow.
POE studies of seven mixed-mode buildings
Building Aus1, Sydney
This building has been noted (Thomas & Hall, 2004) forits integrated environmental design process whereby cli-ent commitment and tangible environmental criteria atproject inception enabled a strong energy performance(4.5-Star NABERS, 176 kgCO2/m
2a). Air is drawnthrough operable louvres on the south facade acrossthe narrow 15-m floor plate and out through solar chim-neys on the north which are integrated in the spacebetween twin-blade structural columns. Other elementsfor environmental control include external slattedscreens which provide shading and security to the oper-able high-performance glass facade, exposed thermal
mass in the ceiling for night cooling, and a BMS thatcontrols the change over from passive mode to sup-plementary AC via a variable refrigerant volume system,based on a 19–25°C criterion.
Notwithstanding the energy-efficient performance,occupant feedback regarding the building was disap-pointing (Table 2). Occupants rated the building as toohot (33% in Table 1), consistent with poor scores for sat-isfaction with temperature (3.2) and air in summer (3.1).Interviews with the building manager revealed that theproblem of overheating was traced to an erratic tempera-ture and ventilation control system driving the louvers,and to uncontrolled overheating on the top-floor spacesthat were not linked to the solar chimney. Followingcomplaints the set-points across the building were nar-rowed to 20–24°C. Further to occupant perception ofexcessively hot temperatures and unsatisfactory temp-erature conditions, the survey also shows a low percep-tion of control over heating, cooling, noise andventilation as well as low satisfaction rates for noise,overall comfort, design, and perceived productivity and
Figure 1. Cross-sectional views of the study buildings.
BUILDING RESEARCH & INFORMATION 183

health (Table 2). Site visits also suggested that the noiseconcerns within the open-plan office layout were furtheraggravated by the acoustically reflective surfaces of theexposed concrete ceilings. It would appear that the lowsatisfaction with indoor environmental parameterscoupled with a low perception of control with theseaspects serve to exacerbate occupants’ overalldissatisfaction
Building Aus2, Melbourne
Aus2 was fully refurbished to achieve the top 6-StarGreen Star Office Design rating (GBCA, 2014). Thebuilding, detailed in Thomas and Vandenberg (2007),is located in a constrained 10 × 55 m site with operablewindows only possible on its shorter edges. An existingstair alongside one party wall was reinstated as themain circulation route and remodelled as both a light-well and thermal stack. Temperature, humidity, daylightand lighting levels, air quality and occupation are mon-itored by a BMS in order to control the changeoverfrom natural ventilation to cooling by fan coil units,maintain space temperatures between 19 and 25°C, man-age a night-purge strategy to ‘pre-cool’ the exposed con-crete ceilings, and regulate lighting and ventilation inoccupied zones.
As seen in Table 2, the occupants rated the buildinghighly for temperature, air and overall comfort withscores significantly better than both scale midpointsand BUS benchmarks. The occupants also rated thebuilding highly for its design, facilities, formal and infor-mal meeting spaces, space utilization, and perceivedhealth and productivity. Site visits, interviews andfocus groups revealed that proactive building manage-ment enabled early problems to be rectified quickly,such as incorrect set-points in winter and a night-purge system which was operating regardless of outsidetemperature. The building has consistently achieved a5 Star NABERS Energy rating (181 kg CO2/m2a) for itsactual energy consumption.
Building Aus3, Melbourne
Aus3 was developed as a workplace for a local govern-ment body with ground-floor retail spaces and under-ground parking. Designed as a demonstration projectfor bioclimatic low energy architecture, the buildingincorporates both active and passive modes of environ-mental control. It integrates a 100% outside air-displace-ment system, substantive passive cooling (nightventilation of its thermal mass in the concrete-vaultedceiling), and a back-up system for cooling via chilled-beam ceilings. Space temperatures are regulated by the
BMS to stay within the 20–25°C range, and users areable to exercise individual control of fresh air ventsand a task-lighting system. The building includes manyother high-performance features and was expected toconsume significantly less energy than the thresholdfor a 5-Star energy rating (Tan, 2007). However, a recentreview of the energy performance found that the buildinghad been performing at 4.0 Stars (245 kg CO2/m
2a) ‘wellbelow its potential due to the state of the HVAC controls’and ‘complexity associated with the building’s web ofrelatively unfamiliar sub-systems’ (Hoogland & Bannis-ter, 2014, p. 50).
Although overall temperature and ventilation in sum-mer and winter at Aus3 was rated better than the bench-mark and scale midpoint; survey and focus groupparticipants raised some concerns about unexplainedvariations in temperatures between floors and acrossfloor plates and in particular the tendency to be hot insummer afternoons (21% rated building as too hot insummer). Concerns were raised as to inadequate naturallight compounded by a gloomy interior ambience fromthe dark concrete ceilings leading to the space being ret-rofitted with additional electric lighting in the ceiling.The open-plan layout, which was critical to unimpededairflow, was also noted to raise concerns of noise. Not-withstanding the concerns with lighting and noise, over-all comfort was rated more positively than might beexpected. Break-out spaces with greenery located offthe stairwell and in the form of balconies on everyfloor were positively received and occupants alsoreturned positive ratings for design, needs as well as per-ceived productivity.
Building Ind1, New Delhi
Ind1 was designed in close consultation with the owner-occupant client to achieve a LEED Platinum rating(LEED, n.d.). The building detailed elsewhere (Lall,Kapoor, & Shetty, 2010) incorporates naturally venti-lated office floor plates protected by a series of uncondi-tioned ‘break-out’ spaces around a sheltered courtyard,low-embodied energy materials and local constructionmethods designed to stabilize internal temperaturesand minimize operational energy. Occupants are ableto exercise a high degree of control over sun shading,daylight, natural ventilation, electric lighting and ceilingfans via a range of fenestration treatments and switchingcontrols. The building was designed to operate in a pas-sive mode from September to early March and envisagedan innovative two-stage hybrid AC system (Lall, 2010)with a combination of direct and indirect evaporativecooling over the dry summer (March–June), and asecond stage of cooling using mechanical refrigeration
184 L. E. THOMAS
for the humid monsoon months (July–August). Thishybrid system was not installed due to unforeseen logis-tics and funding barriers and the building remainedwithout AC over the first summer even after the clientorganization had moved into the building. A conven-tional AC system (capable of providing both heatingand cooling) was then installed at the start of the mon-soon season.
Unsurprisingly, the absence of active cooling in sum-mer resulted in high internal temperatures and the worstresults for overall temperature satisfaction in summer(64% dissatisfied; 45% rated conditions too hot; Table2). The TCS surveys (Table 3) reinforce this experience(avg_ash = +1.7; avg_top = 36.2°C, 65% rate conditionsas unacceptable) in a week when the seven-day runningmean was 40.6°C. Although discomfort from overheat-ing drops predictably once AC is installed in the mon-soon (4%), tolerance for higher temperatures (avg_ash= –0.1; avg_top = 27.1°C), assisted by adaptive measuressuch as the use of ceiling fans (53% of had fans switchedon during the TCS) is evident.
The TCS survey measurements provide a glimpse ofthe moderating influence of the building envelope inextreme summer. With no supplementary coolingon the day, indoor operative temperatures (avg_top =36.2°C) remain around 7°K less than the maximum out-door temperature of 43°C and in line with minimumtemperature of 36°C.
Building Ind2, Gurgaon
This LEED Platinum-rated building houses multipletenants, with a research institution as its primaryowner occupant. The low energy design incorporatesnarrow floor plates, sheltered courtyards, appropriatefenestration and insulation to the building envelope tominimize unwanted heat gains and enable natural venti-lation and access to glare-free daylight. Airflow throughoperable windows is aided by the stack effect within acentral light well. The AC system is only operated inthe periods between March and September (cooling),and December–January (heating). A carefully detaileddisplacement ventilation system, integrated with thestructural columns and office partitions, ensures airflowpaths are not impeded and concrete ceilings remainexposed to the internal space. Although changeoverbetween modes is linked to a BMS, a highly experiencedbuilding manager onsite plays a proactive role in moder-ating the temperature set-points and hours of chilleroperation. Arising from a detailed understanding of thebuilding performance and user needs and behaviour,the approach takes into account opportunities for com-fort that can be provided by ceiling fans (not tracked
by the BMS) given time of day and season.3 The BUSresults validate efforts for integrated design and comfort.Occupants reported a high satisfaction across all indoorenvironmental quality variables (temperature air noiseand lighting) as well as design, perceived productivityand health (Table 2). The TCS survey campaigns in sum-mer and monsoon occurred when the AC system wastypically in operation. The results (Table 3) corroboratethe BUS scores to indicate a strong level of acceptance ofthermal conditions (avg_ash ranged from –0.1 to 0.1;5–13% rated conditions as unacceptable). Althoughperceived control over ventilation was rated no differentto the BUS benchmark, occupants clearly made full useof ceiling fans. For example, over two-thirds of occu-pants had ceiling fans switched on concurrently withAC at the time of the TCS summer survey. However,on-site interviews indicated the occupants were lessenthusiastic about opening windows to their officeeven in the mild season, citing dust and noise.
Building Ind3, Ahmedabad
This two-storey building accommodates over 200 gov-ernment employees in an open-plan layout in additionto an auditorium, conference room and other functionalspaces. Designed to minimize heat loads from the facadein this hot, dry climate, the thermally massive building isorganized as three compact blocks to one side of a linearcirculation spine. Adjoining blocks are separated by deepself-shaded light courts which offer year-round solarprotection to the openable windows on these facades.Almost all occupants worked in open-plan officeswhere a seasonal changeover mode of operation isadopted. The spaces remain naturally ventilated forNovember–March, while cooling is provided via aducted, centralized evaporative cooling system that isoperated in the summer and monsoon seasons.
As seen in the BUS results (Table 2), the buildingrecorded a high level of user dissatisfaction for summerconditions. Unlike mechanical refrigeration which canallow cooling to any supply air temperature, the coolingeffectiveness of evaporative cooled systems is con-strained by the humidity in the air. Consequently, theaverage indoor operative temperature during the TCSsummer campaign remains 8°K below the maximumoutdoor temperature (42°C) – at around 33.6°C. TheTCS result indicating 65% of occupants were dissatisfied(Table 3) was consistent across the summer season asevident in the BUS results (69% rated ‘too hot’; Table2). At this time, almost all users employed ceiling fansto improve their comfort and there is evidence of someusers opening windows, although conditions were hotteroutdoors than indoors. In contrast, occupants returned
BUILDING RESEARCH & INFORMATION 185

positive ratings for temperature and air in winter, light-ing, noise and overall comfort, and on average registeredno negative impact to perceived productivity.
Building Ind4, Ahmedabad
This eight-storey office building is typical of conven-tional buildings in Ahmedabad with some cognisanceof the need to limit and shade glazing on all facades.The layout is designed to ensure all workstations in theopen plan lie within 6–8 m from openable windowsalong the perimeter. Occupants are able to operate andregulate individual AC units (split, window and ceilingunit), allowing for localized changeover from AC tonatural ventilation all year round.
The TCS responses show AC was being operated for100% of occupants in summer, 74% in the monsoonand 34% in winter, and windows were not opened onthe survey days. During these periods the average oper-ative temperature was remarkably consistent rangingfrom 24.8 to 25.6°C with the mean ASHRAE thermalsensation votes slightly below neutral (avg_ash: –0.1 to–0.4; Table 3) and consistent with BUS ratings wheremore occupants rated conditions as too cold than toohot. As seen in Table 2, the building is rated betterthan benchmark for temperature and air across all sea-sons, lighting, noise, facilities meeting needs, perceivedhealth and perceived productivity. Of the seven buildingsstudied, Ind4 recorded the highest rating for control overcooling and gained positive ratings for effectiveness ofresponse to requests for change.
Discussion
The real-world studies of building performance pre-sented here recognize the importance of contextdependency within individual buildings (Leaman, Ste-venson, & Bordass, 2010) given the vast number ofinterdependencies between factors affecting perform-ance. Such factors range from building design and con-struction, environmental control systems, climaticlocation, the extent to which design intent is achieved,how a building is used its occupants, facilities manage-ment, and occupant expectations, to organizationalwork practices and management. At one level, theseven separate cases in this paper provide a rich setof narratives of building performance to highlightopportunities and barriers to effective mixed-modeconditioning. However, the value of case studies(Flyvbjerg, 2006) is in the context-dependent knowl-edge it provides the discipline which is crucial fortransferring knowledge to practical applications (Kir-keby, 2011). The discussion below presents insights
from the individual exemplars in relation to theseven buildings and where applicable situates these ina wider context to observe similarities, trends orexplain anomalies.
Overheating versus adaptation: expectations
Figure 2 shows the BUS ratings for occupant perceptionsof temperature too hot/too cold in relation to the ratingfor overall temperature in summer. As would beexpected, the extent to which occupants perceive dis-comfort (scores for too hot/too cold and percentage rat-ing too hot) has a strong bearing on their overall rating ofthermal comfort in summer. However, a key point ofinterest is the actual range of temperatures at whichpeople in these buildings experience overheating. Thediversity in the comfort scores, as well as percentage ofoccupants experiencing overheating in each buildingdespite the same cooling set-point of 25°C, is noteworthy– of these three buildings, Aus1 performs the worst,while Aus2 registers the least discomfort. Admittedlythere is no monitored evidence to show to what extenttemperatures were riding about the intended limit inAus1. However, the strategy first to tighten the set-pointsto 20–24°C is telling especially as other operational faultshighlighted above could have been addressed first. Thisresponse highlights the manner in which preference forstable temperatures is continually reinforced (Chappells& Shove, 2005), especially in the light of research (Arens,Humphreys, de Dear, & Zhang, 2010) showing no per-ceptible benefits to comfort despite the increasedenergy to maintain temperatures within prescribedlimits.
A second point of interest is the divergent level ofacceptability of thermal conditions between Australianand Indian context. As noted above, the indoor
Figure 2. Scatter plot showing BUS ratings for ‘temperature insummer hot/cold’ versus ‘temperature in summer overall’.
186 L. E. THOMAS

temperatures in the Australian study buildings weremodulated to a cooling set-point that is more conserva-tive (lower) than would have been permissible under theASHRAE adaptive model. Nevertheless as seen in Figure2 and Table 2, these Australian buildings register similaror higher levels of dissatisfaction (scores for temperaturein summer overall) and discomfort (percentage of occu-pants who are ‘too hot’) when compared with Indianstudy buildings which operated at higher temperatures.
Surveyed occupants in the Indian study buildingswho undertake professional, administrative and techni-cal work in contemporary and well-appointed work-places are consistently found to tolerate well over 27°C in these buildings. This is evident in the neutraltemperature calculations (Table 3), and the adaptivethermal comfort models for mixed-mode buildingsreported elsewhere (Manu et al., 2016). Furthermore,a greater tolerance of warmer temperatures is evidenteven when conditions are deemed unacceptable.Table 3 shows that the ratings of the actual thermalsensation (avg_ash) are consistently reported as coolerthan would have been predicted using the PMV-PPD(predicted percentage dissatisfied) model (avg_pmv).
Ind1–Ind3 are three cases that include a seasonalchangeover mode where the AC system is intentionallyswitched off in the mild season to defy the aforemen-tioned trend to develop workplaces with year-roundAC (Cox, 2012; Ürge-Vorsatz et al., 2015). It is note-worthy that both building operators and occupantstacitly accept that some level of discomfort could occurfrom overheating during the mild season when the ACis not employed. However, although this works well inInd2, the study also demonstrates that a consistentoccurrence of temperatures outside their comfort expec-tations is not accepted by occupants. The overheating, asseen in the summer outcomes for Ind1 and Ind3, high-lights problems that will arise from a failure to realizeproperly the cooling strategy. For Ind1 this was a conse-quence of budgetary constraints, and for Ind3 this wasthe inability of the evaporative cooling system to main-tain temperatures within an acceptable range duringthe extreme summer months.
The comfort expectations of the users and thermalset-points play a key role in influencing the extent towhich the building operates in either active or passivemode. It would appear that a preference for lowertemperatures, which is well entrenched in fully ACbuildings in the Western context, serves to influencethe fairly conservative set-points in the Australianstudy buildings. However, if occupants were to acceptthe warmer conditions, then from a technical perspec-tive this would require effective thermal comfort cri-teria to govern a seamless changeover between modes
for naturally ventilated and AC modes. This wouldalso entail a carefully designed environmental controlstrategy comprising either simple robust controls thatusers can operate or a carefully integrated BMS withadded opportunity for personalized control of airflowand temperature. Furthermore, it is necessary to recog-nize where opportunities and barriers to integratingadaptive opportunities and managing buildings lie.This is discussed below.
Cost of comfort: energy
The possibility of users tolerating an alternate tempera-ture range beyond the stipulation of 22.5 ± 1.5°C for pre-mium-grade buildings in both Australia and India bringspotential energy savings when running the AC modeunder different temperature regimes. Figure 3 showssimulation results (using EnergyPlus) for a five-zonebuilding model under different set-points in Sydney,Melbourne, Delhi and Ahmedabad. The building envel-ope and internal load schedules are set to comply withlocal building energy codes, namely Energy ConservationBuilding Code – ECBC (Bureau of Energy Efficiency –India, 2009) and Building Code of Australia (AustralianBuilding Codes Board, 2016). For simplicity, heatingand cooling set-points were held constant throughoutthe year. Cooling set-points were tested from 22 to 28°C in 1°C increments. Given the emphasis on overheatingin this paper, the discussion below focuses on the impactof varying the cooling set-point on an equator-facingperimeter mid-level zone.
The results show the amount of energy for coolingdecreases by roughly 10–15% for every degree rise inthe set-point temperature in the Australian cities and6–8% in Indian cities studied. The shift from the widely
Figure 3. Predicted cooling energy at different cooling set-pointsfor Sydney and Melbourne (north) and Delhi and Ahmedabad(south).
BUILDING RESEARCH & INFORMATION 187

accepted baseline of 24°C for Sydney andMelbourne and26°C for Delhi and Ahmedabad is worth noting. In thecase of Melbourne, it clearly shows savings of 15% and27% of the cooling energy at 24°C if the set-point wasraised to 25 and 26°C. The results for Ahmedabadshow a 15% reduction in energy if the set-point wasraised from 26 to 28°C. More importantly, if the set-point was lowered to match Western workplaces at 24or even 23°C in Ahmedabad, cooling energy wouldincrease by around 15–23% with reference to the energyat 26°C. The magnitude of such a shift is a considerableconcern, given that the cooling energy for an office inAhmedabad is at least three times the energy for an officein a benign climate such as Melbourne. In this respect,the results highlight the stark choice that building devel-opment in India faces between year-round AC operatedunder a 22.5 ± 1°C regime and a mixed mode of oper-ation governed by the adaptive model of thermalcomfort.
Control and effectiveness of response to requestsfor change
Figure 4(a) explores the relationship between ratings forcontrol over cooling and temperature in summer overall,while Figure 4(b) explores how effectiveness of responseto requests for change might impact the rating for temp-erature in summer overall. Although there is no cleartrend across the buildings in the BUS 2012 Internationalbenchmark dataset, the context-specific stories of theindividual POEs helps to situate an understanding ofwhere this matters.
Low scores for perceived control as seen in Aus1 areconsistent with poor performance and low ratings forthermal comfort in Figure 4. On the other hand, a highperception of control over cooling and satisfaction witheffectiveness of response to requests for change at Ind4(Figure 4(a, b)) appears to reinforce the positive scoresfor thermal comfort in summer in this building. Theseresults suggest a potential risk to occupant satisfactionwhen occupants perceive very little control or adaptiveopportunity especially when problems are not rectifiedquickly. However, it is vital to note that the question ofuser control becomes less important when things workwell. As seen in Aus2 and Ind2, thermal comfort scoresdo not seem to be affected by the limited user controlover cooling in this building (Figure 4(a)). On theother hand, a proactive and user-responsive approachto building management is seen in both buildings. Thisapproach is corroborated in the high occupant ratingsfor effectiveness of responses to requests for changeand can be argued to play an important role in deliveringuser satisfaction for thermal comfort (Figure 4(b)).
While all the study buildings can be defined as mixed-mode buildings, they exhibit a range of approaches inrelation to the question of control and strategies for com-bating overheating. The ‘passive building–active occu-pant’ framework (Cole et al., 2008) is evident to someextent at the Indian study buildings where occupantswere able to open windows and use ceiling fans (Ind1–Ind3), or personally initiate the use of localized ACunits to combat overheating (Ind4). The Australianbuildings operate largely at the other end of the spectrumin an ‘active building–passive occupant’ framework
Figure 4. Scatterplots showing the relationship between ratings for (a) perceived control over cooling and (b) effectiveness of responsewith ratings for temperature in summer overall.
188 L. E. THOMAS

(Cole et al., 2008) and rely on the active forms of controlvia a BMS to control the dynamic changeover from pas-sive to active mode, and vice versa. As seen in thesebuildings, it is important to note that occupants are likelyto perceive limited control. This can, in turn, alter theirexpectations and tolerance of discomfort as evident inAus1. In this context Aus2 and Aus3 highlight modelsof user-responsive building management that mustaccompany such buildings. Ind2 lies midway betweenthe two approaches discussed above with active systemsmodulating temperature conditions for most of the sum-mer and monsoon coupled with free-running passiveoperation in winter and the mild season, a high level ofadaptive opportunities afforded to occupants and aproactive onsite user manager. Significantly, its designand operation already incorporate aspects recognizedto enhance thermal experiences such as a shift to per-sonal control, adequate air movement and user respon-sive design (Brager, Zhang, & Arens, 2015; Leaman &Bordass, 1999). As seen in Aus2 and Ind2, the best out-comes for thermal comfort are achieved when buildingdesigns and environmental control systems are robustenough to manage overheating and deliver comfort,cope with some errors in operation or includes occu-pants who are willing to play a proactive role and under-stand the design intent.
Forgiveness, overall comfort and perceivedproductivity
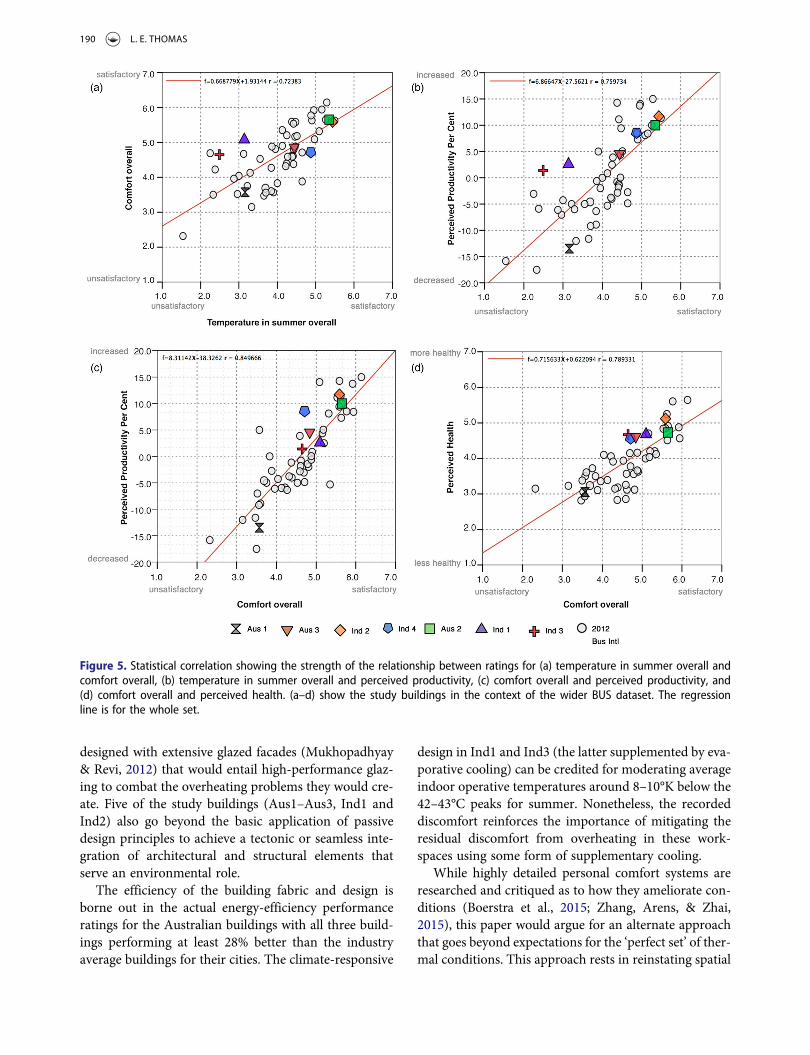
The scatterplots in Figure 5 situate the study buildings inthe context of the buildings in the BUS Internationaldataset (and including the seven study buildings).Figure 5(a, b) (comprising all the buildings in the BUS2012 International benchmark dataset) illustrates therole thermal comfort in summer plays in ratings foroverall comfort and perceived productivity. Theregressions for the whole set indicate a significantrelationship between occupant responses for tempera-ture in summer and comfort overall (r = 0.72); and temp-erature in summer and perceived productivity (r = 0.75),confirming the strong associations between these aspectsin other studies (Kim & de Dear, 2012; Leaman, Thomas,& Vandenberg, 2007). Although the poor ratings forthermal comfort in summer in Ind1 and Ind3 couldhave been expected to negatively impact ratings for over-all comfort and perceived productivity, this is not thecase in Figure 5(a, b). Interestingly, they appear furthestfrom the trend line and are discussed further below.
Ind1 is one of the three buildings that demonstrate alevel of forgiveness or tolerance (1.1 in Table 2) wherethe rating of overall comfort is greater that what wouldhave been predicted from their separate scores for
temperature, air, lighting and noise. The high occupantsatisfaction with lighting, daylight, noise, control overlighting and ventilation, design, and work facilities asseen in Table 2 suggest that a number of positive featuresin the overall design attributes such as access to daylightand transitional ‘break-out’ spaces, a high degree of per-sonal control, and a layout that facilitates work are wellreceived by occupants. Furthermore, it could be arguedthat their positive experience of these aspects seems tooutweigh their low rating for temperature as seen inthe ratings for overall comfort, design perceived pro-ductivity and perceived health.
At Ind3, the BUS ratings for lighting, noise, and airand temperature in winter are better than benchmarks(Table 2). Satisfaction with these aspects seems to buoyoccupant ratings for overall comfort and perceived pro-ductivity. Additionally, in the case of Aus2 and Aus3, thepositive outcomes for overall comfort despite poor scoresfor temperatures in winter (Aus2) and lighting and noise(Aus 3) also support the notion of forgiveness, that‘although they [users] may have detailed criticismsabout some of the conditions, they are prepared to over-look them’ (Leaman et al., 2007, p.28).
The scatterplots in Figure 5(c, d) comprising all thebuildings in the BUS 2012 International benchmarkdataset (and including the seven study buildings) depictthe strong associations between overall comfort and per-ceived productivity (r = 0.85); and overall comfort andperceived health (r = 0.78). As seen, there is a close proxi-mity of almost all the study buildings to the line of bestfit. The two buildings at the top end (Aus2 and Ind2) forcomfort and perceived productivity clearly demonstratean almost ‘textbook’ performance by gaining high satis-faction scores for nearly all other variables. Users inAus2, Aus3, Ind1 and Ind2 register strong satisfactionwith design, and how well the building meets onesneeds. These results reiterate the fundamental require-ment for a building to satisfy its functional role, as wellas the likelihood that a number of desirable attributes(such as interesting spaces, daylight, access to fresh airand views) will reinforce one another in a virtuous circlein a well-designed building.
Integrated environmental design and operation
A climate-responsive approach to building design, sup-ported by committed clients and a skilled design team,is a critical first step to ensuring low-energy outcomes.The Indian study buildings demonstrate sensitivity toheat gain from the facade through shading and low win-dow-to-wall ratios, while also emphasizing localmaterials and skills. This is in stark contrast to anotherrecent trend in the subcontinent where buildings are
BUILDING RESEARCH & INFORMATION 189
designed with extensive glazed facades (Mukhopadhyay& Revi, 2012) that would entail high-performance glaz-ing to combat the overheating problems they would cre-ate. Five of the study buildings (Aus1–Aus3, Ind1 andInd2) also go beyond the basic application of passivedesign principles to achieve a tectonic or seamless inte-gration of architectural and structural elements thatserve an environmental role.
The efficiency of the building fabric and design isborne out in the actual energy-efficiency performanceratings for the Australian buildings with all three build-ings performing at least 28% better than the industryaverage buildings for their cities. The climate-responsive
design in Ind1 and Ind3 (the latter supplemented by eva-porative cooling) can be credited for moderating averageindoor operative temperatures around 8–10°K below the42–43°C peaks for summer. Nonetheless, the recordeddiscomfort reinforces the importance of mitigating theresidual discomfort from overheating in these work-spaces using some form of supplementary cooling.
While highly detailed personal comfort systems areresearched and critiqued as to how they ameliorate con-ditions (Boerstra et al., 2015; Zhang, Arens, & Zhai,2015), this paper would argue for an alternate approachthat goes beyond expectations for the ‘perfect set’ of ther-mal conditions. This approach rests in reinstating spatial
Figure 5. Statistical correlation showing the strength of the relationship between ratings for (a) temperature in summer overall andcomfort overall, (b) temperature in summer overall and perceived productivity, (c) comfort overall and perceived productivity, and(d) comfort overall and perceived health. (a–d) show the study buildings in the context of the wider BUS dataset. The regressionline is for the whole set.
190 L. E. THOMAS

and temporal diversity in buildings (Hawkes, McDonald& Steemers, 2001; Heschong, 1979) through the pursuit(and good design) of more climate-interactive spaces asopposed to climate-rejecting ones. Aus3 and Ind1point to some interesting opportunities. Figures 6 and7 highlight zones of environmental control in the layoutplans in these buildings. Aus3 (Figure 6) is indicative ofthe beginning of a new trend (Drake, de Dear, Alessi, &Deuble, 2010) where a small percentage of the floor areais devoted to break-out spaces that can be isolated fromthe central AC. A much more nuanced spatial hierarchyfor climate control is evident in Ind1 (Figure 7) whichchallenges the traditional approach of maintaining stan-dardized conditions across all areas of the floor plate atall times. Naturally ventilated corridors are temperedwith ‘spill air’ when the offices are conditioned to enablea gradual transition to other naturally ventilated break-out spaces and meeting areas that can separately relyon supplementary cooling when the need arises. Asnew forms of ‘activity-based working’ are promoted, ahigher percentage of the floor area is being devoted tobreak-out café-style work environments and flexiblezones. It can be argued that many of these new functionalspaces have less stringent environmental requirements,and would benefit from fresh air, enhanced air speed, day-light and connection to the outdoors, thereby lendingthemselves to a climate-interactive, mixed mode of oper-ation. In these types of workspaces where occupants arealso encouraged to change location based on their activi-ties, the potential for behavioural adaptation can also beincreased.
Conclusions
This paper emphasizes the context specificity of a build-ing and its environment as experienced by its users to
offer a nuanced understanding of overheating. Itreinforces the strong associations between thermal com-fort, overall comfort and perceived productivity in theworkspace. The comparative examination of the sevenmixed-mode buildings in India and Australia demon-strates that while overheating can detrimentally affectoccupant satisfaction for thermal comfort, it is possibleto deliver thermally efficient workspaces that satisfy therequirements of comfort using effective mixed-modeconditioning. This climate-interactive approach is incontrast to an energy-intensive approach that ignoresthe climate and relies upon the use of AC throughoutthe year. Of the mixed-mode buildings studied, thoseusing effective AC only when and where necessaryyielded thermal conditions that led to the highest com-fort assessments and greater perceived productivity.
The success of mixed-mode buildings is contingent ona number of factors. First, the study emphasizes theimportance of an integrated approach to the design,development and operation of the building fabric andsystems to ensure the design intent is realized and over-heating is mitigated. Second, it calls for a proactive user-responsive approach to the operation of the buildingwhere users understand design intent, and monitoringand feedback loops exist to rectify problems. This is par-ticularly critical in active controlled buildings whereusers exercise little control or perceive limited adaptiveopportunities. On the other hand, the findings fromthree of the buildings in this study suggest occupantscan be more forgiving of some discomfort from over-heating in situations where other aspects ‘work well’and they enjoy an adaptive environment which includesclimate-interactive features such as daylight andincreased airflow.
The study also revealed a divergent level of acceptabil-ity of thermal conditions between the Australian and
Figure 6. Layout plan showing zones of environmental control for Aus3.Source: City of Melbourne, drawing © DesignInc.
BUILDING RESEARCH & INFORMATION 191

Indian contexts. The Australian mixed-mode buildingswere operated within temperature limits more conserva-tive (lower) than would have been permissible under theASHRAE-55 adaptive model of thermal comfort. How-ever, occupants in these buildings registered dissatisfac-tion with thermal conditions especially where theyperceived the lack of user responsive management ofthe thermal environment.
Preference for a narrow band of temperatures as wellas a lack of information on the risks this creates for per-formance can serve to constrain the uptake of mixed-mode buildings. In this context, encouraging occupantsand developers out of the highly controlled and hom-ogenous thermal environment they have come to expectwill require a multipronged approach beyond merely sti-pulating mixed-mode conditioning. As discussed, thiscould include adoption of appropriate comfort criteriaand a user-responsive approach to manage the change-over between modes as well as a climate-interactiveapproach to spatial and temporal diversity.
Occupants in the Indian study buildings toleratedwarmer temperatures, consistent with an adaptablemodel of comfort (Manu et al., 2016) that was previouslyshown to be more adaptive than predicted under ASH-RAE-55. Significantly, the potential for effectivelydesigned mixed-mode conditioning to deliver comfortas seen in this study, coupled with the tolerance of highertemperatures, question the pursuit of a climate-rejectingyear-long AC approach. Addressing this issue is urgent,
given that workplaces conditioned to lower temperaturetogether with the projected increase of built floor spacewill only exacerbate the dependence on fossil-basedenergy in these warmer climatic locations.
Notes
1. Neutral temperature is based on the ASHRAE-55 adapt-able model = 0.31*outdoor temperature + 17.8, whereneutral temperature is the indoor operative temperature(°C), and outdoor temperature is the 30-day outdoorrunning mean air temperature (°C), with a ± 2.5°Crange for 90% acceptability and ± 3.5°K for 80%. Neutraltemperature for summer was computed assuming a22.3°C outdoor temperature for Sydney and 20.2°C forMelbourne based on statistics from the Bureau ofMeteorology for January. For 90% acceptability, thelimits for Sydney and Melbourne would be 26.5 and25.8°C respectively, and for 80% acceptability theywould be 28.2 and 26.8°C respectively.
2. The National Australian Building Environmental RatingScheme (NABERS, 2014) energy rating system (for-merly ABGR – Australian Building Greenhouse Rating)is a protocol for benchmarking actual energy perform-ance and CO2-equivalent emissions post-occupancy.Since it was introduced in 1999, buildings have beenbenchmarked on a scale of 0 to 5 Stars, with 5.5- and6-Star rating bands introduced in 2012. A whole build-ing rating at a 5-Star NABERS level for office buildingsindicates a 47% CO2 reduction in comparison with theindustry average at 2.5 Stars, while 4.5- and 4-Star rat-ings deliver 37% and 28% respectively. The whole build-ing energy rating is based on the total energy consumed
Figure 7. Layout plan showing zones of environmental control for Ind1.Source: Ashok B Lall Architects.
192 L. E. THOMAS
in the office building. In 2002, no building as large asAus1 had realized the top 5-Star rating achievable atthe time.
3. For example, the site visit revealed that the buildingmanager typically operated the chiller between 09:30and 16:00 hours in summer, whereas the office hoursran from 08:30 to 17:30 hours. This approach tookinto account the relatively cooler hours of the morningand the coolth within the building at the end of theday when the ceiling fans could be employed by theoccupants as needed.
Acknowledgments
The collation of data for the detailed analysis of the sevenbuildings presented in this paper would not have been poss-ible without the generous support of a number of individualsand organizations. The support received from key personnelin each of the buildings to facilitate the study as well as thegenerous participation by individual owners, designers, own-ers, facilities management staff and occupants at each build-ing is gratefully acknowledged. Each of the POE studiesused the BUS questionnaire under licence from BuildingUse Studies, UK. The assistance from Adrian Leaman ofBuilding Use Studies during these studies and in generatingthe scatterplots for Figures 4 and 5 to include the buildingsin the BUS international benchmark dataset is acknowledged.The author would like to acknowledge fellow investigators,namely Monica Vandenberg (Aus2 and Aus 3) and AdrianLeaman (Aus 3), for their permission to use data collated toevaluate design performance in the Australian buildings.The author acknowledges IMAC collaborators SanyogitaManu, Yash Shukla, Rajan Rawal and Richard de Dear fortheir permission to use the data collated towards the IMACstudy for the Indian buildings in this paper (Ind1–Ind4).Thanks are also due to the team of CEPT University researchassistants who assisted with survey administration in theseIndian buildings.
Disclosure statement
As acknowledged, the paper draws on IMAC study data.
Funding
Funding for the IMAC study was received from the Ministry ofNew and Renewable Energy, Government of India [Grant no.15/35/2010-11/ST] and Shakti Sustainable Energy Foundation –Climate Works Foundation [Grant no. 11-0314].
ORCID
Leena E. Thomas http://orcid.org/0000-0003-0707-9260
References
Ackermann, M. E. (2002). Cool comfort: America’s romancewith air conditioning. Washington, DC: SmithsonianInstitution Press.
ANSI/ASHRAE. (2013). Standard 55–2013: Thermal environ-mental conditions for human occupancy. Atlanta, GA:
American Society of Heating, Refrigerating, and Air-Conditioning Engineers, Inc.
Arens, E., Humphreys, M., de Dear, R., & Zhang, H. (2010).Are ‘Class A’ temperature requirements realistic or desir-able? Building and Environment, 45, 4–10. doi:10.1016/j.buildenv.2009.03.014
Australian Building Codes Board [ABCB]. (2016). Section J:Energy efficiency. In Building code of Australia 2016 (Vol. 1,pp. 387–485). Canberra: Australian Building Codes Board.
Bansal, N. K., & Minke, G. (Eds.). (1995). Climatic zones andrural housing in India. Jülich: Forschungszentrum JülichGmbH, Zentralbibliothek.
Boerstra, A. C., te Kulve, M., Toftum, J., Loomans, M. G. L. C.,Olesen, B. W., & Hensen, J. L. M. (2015). Comfort and per-formance impact of personal control over thermal environ-ment in summer: Results from a laboratory study. Buildingand Environment, 87, 315–326. doi:10.1016/j.buildenv.2014.12.022
Bordass, W., Leaman, A., & Ruyssevelt, P. (2001). Assessingbuilding performance in use 5: Conclusions and impli-cations. Building Research & Information, 29(2), 144–157.doi:10.1080/09613210010008054
Brager, G. S. (2000). Mixed mode ventilation: HVAC meetsmother nature. Engineered Systems, 17(5), 60–70.
Brager, G. S. (2006). Mixed mode cooling. ASHRAE Journal,48(8), 30–37.
Brager, G. S., Zhang, H., & Arens, E. (2015). Evolving oppor-tunities for providing thermal comfort. Building Research &Information, 43(3), 274–287. doi:10.1080/09613218.2015.993536
Bureau of Energy Efficiency – India. (2009). Energy conserva-tion building code user guide. New Delhi: Government ofIndia.
Candido, C., Kim, J., de Dear, R., & Thomas, L. (2016). BOSSA:A multidimensional post-occupancy evaluation tool.Building Research & Information, 44(2), 214–228. doi:10.1080/09613218.2015.1072298
Chappells, H., & Shove, E. (2005). Debating the futureof comfort: Environmental sustainability, energyconsumption and the indoor environment. BuildingResearch & Information, 33(1), 32–40. doi:10.1080/0961321042000322762
Chartered Institution of Building Services Engineers (CIBSE).(2000). Guide A: Environmental design (7th ed.). London:CIBSE.
Cole, R. J., Robinson, J., Brown, Z., & O’Shea, M. (2008). Re-con-textualizing the notion of comfort. Building Research &Information, 36(4), 323–336. doi:10.1080/09613210802076328
CEN (Comité Européen de Normalisation). (2012). EN 15251:Indoor environmental input parameters for design andassessment of energy performance of buildings – addressingindoor air quality, thermal environment, lighting andacoustics. Brussels: CEN.
Cox S. (2012). Losing our cool – Uncomfortable truths aboutour air-conditioned world. New York: New Press.
de Dear, R., & Brager, G. (1998). Developing an adaptivemodel of thermal comfort and preference. ASHRAETransactions, 104(1), 27–49.
Drake, S., de Dear, R., Alessi, A., & Deuble, M. (2010).Occupant comfort in naturally ventilated and mixed-mode spaces within air-conditioned offices. ArchitecturalScience Review, 53(3), 297–306. doi:10.3763/asre.2010.0021
BUILDING RESEARCH & INFORMATION 193
EnergyPlus (8.4.0) [Computer software]. Golden, CO: NREL.Fanger, P. O. (1970). Thermal comfort. Copenhagen: Danish
Technical Press.Flyvbjerg, B. (2006). Five misunderstandings about case-study
research. Qualitative Inquiry, 12(2), 219–245.GBCA (Green Building Council of Australia). (2014). Green
Star Rating Tools. Retrieved June 7, 2014, from http://www.gbca.org.au/green-star/green-star-design-as-built/
Hawkes, D., McDonald, J., & Steemers, K. (2001). The selectiveenvironment. London: Taylor & Francis.
Heschong, L. (1979). Thermal delight in architecture,Cambridge, MA: MIT Press.
Hoogland, M., & Bannister, P. (2014). Council house 2 (CH2)in review. EcoLibrium(R), 13(10), 44–50.
Humphreys, M. A. (1978). Outdoor temperatures and comfortindoors. Building Research and Practice, 6(2), 92–105.
Kim, J., & de Dear, R. (2012). Nonlinear relationships betweenindividual IEQ factors and overall workspace satisfaction.Building and Environment, 49, 33–40. doi:10.1016/j.buildenv.2011.09.022
Kirkeby, I. M. (2011). Transferable knowledge: An interviewwith Bent Flyvbjerg. Architectural Research Quarterly, 15(1), 9–14. doi:10.1017/S1359135511000315
Kumar, S., Kapoor, R., Deshmukh, A., Kamath, M., & Manu, S.(2010). Total commercial floor space estimates for India, NewDelhi. Retrieved from http://www.eco3.org/total-commercial-floor-space-estimates-for-india-report-no-1030/.
Lall, A. B., Kapoor, N., & Shetty, S. (2010).Analyzing design issuesfor hybrid system buildings for India. Proceedings of confer-ence: 2010 Windsor Conference: Adapting to Change: NewThinking on Comfort, Windsor, UK, 9–11 April.
Landsberger, H. A. (1958). Hawthorne revisited. Ithaca, NY:Cornell University.
Leaman, A., & Bordass, W. (1999). Productivity in buildings:The ‘killer’ variables. Building Research & Information, 27(1), 4–19. doi:10.1080/096132199369615
Leaman, A., & Bordass, W. (2001). Assessing building per-formance in use for the PROBE occupant surveys andtheir implications. Building Research & Information, 92,129–143. doi:10.1080/09613210010008045
Leaman, A., & Bordass, W. (2007) Are users more tolerant of‘green’ buildings? Building Research & Information, 35,662–673. doi:10.1080/09613210701529518
Leaman, A., Stevenson, F., & Bordass, B. (2010). Buildingevaluation: Practice and principles. Building Research &Information, 38(5), 564–577. doi:10.1080/09613218.2010.495217
Leaman, A., Thomas, L. E., & Vandenberg, M. (2007). ‘Green’buildings: What Australian users are saying. EcoLibrium(R), 6(10), 22–30.
LEED. (n.d.). The Leadership in Energy and EnvironmentalDesign Green Building Rating System™. Retrievedfrom http://www.usgbc.org/DisplayPage.aspx?CategoryID=19
Manu, S., Shukla, Y., Rawal, R., Thomas, L. E., & de Dear, R.(2016). Field studies of thermal comfort across multiple cli-mate zones for the subcontinent: India model for adaptivecomfort (IMAC). Building and Environment, 98(March),55–70. doi:10.1016/j.buildenv.2015.12.019
Mukhopadhyay, P., & Revi, A. (2012). Climate change andurbanisation in India. In N. K. Dubash (Ed.), Handbookof climate change and India: Development, politics, andgovernance (pp. 303–316). Abingdon: Earthscan.
National Australian Building Environmental RatingScheme [NABERS] Office. (2014). NABERS. Retrievedfrom http://www.nabers.gov.au/
Nicol, J. F., & Humphreys, M. A. (2010). Derivation of theadaptive equations for thermal comfort in free-runningbuildings in European standard EN15251. Building andEnvironment, 45, 11–17. doi:10.1016/j.buildenv.2008.12.013
Nicol, J. F., Raja, I. A., Allaudin, A., & Jamy, G. N. (1999).Climatic variations in comfortable temperatures: ThePakistan projects. Energy and Buildings, 30, 261–279.doi:10.1016/S0378-7788(99)00011-0
Rowe, D. (2003). Study of a mixed mode environment in 25cellular offices at the University of Sydney. InternationalJournal of Ventilation, 1(4), 53–64. doi:10.1080/14733315.2003.11683644
Sivak, M. (2009). Potential energy demand for cooling in the50 largest metropolitan areas of the world: Implicationsfor developing countries. Energy Policy, 37, 1382–1384.doi:10.1016/j.enpol.2008.11.031
Sullivan, J., Baird, G., & Donn, M. (2013). Measuring pro-ductivity in the office workplace. Final report. Centre forBuilding Performance Research, Victoria University ofWellington, New Zealand. Retrieved from https://www.msd.govt.nz/documents/about-msd-and-our-work/about-msd/structure/pmcoe/publications/measuring-productivity-in-the-office-workplace.docx
Tan, S.-F. (2007). Practice. Architecture Australia, 91(1).Retrieved from http://architectureau.com/articles/practice-15/
Thomas, L. E., & Hall, M. R. (2004). Implementing ESD inarchitectural practice – an investigation of effective designstrategies and environmental outcomes. Passive and lowenergy architecture (PLEA) annual international conference– 2014, 415–420. Eindhoven: Technische UniversiteitEindhoven.
Thomas, L. E., & Thomas, P. (2010). Unravelling the mix –Towards effective simulation, implementation and operationof mixed mode buildings. Proceedings of conference:Adapting to change: New thinking on comfort, 1–16.Windsor, UK: Windsor Conference on Thermal Comfort,Network for Comfort and Energy Use in Buildings(NCEUB).
Thomas, L. E., & Vandenberg, M. (2007). 40 Albert Road,South Melbourne: Designing for sustainable outcomes – Areview of design strategies, building performance andusers’ perspectives. BEDP Environment Design Guide, 13(3), CAS45, 1–12.
Ürge-Vorsatz, D., Cabeza, L. F., Serrano, S., Barreneche, C., &Petrichenko, K. (2015). Heating and cooling energy trendsand drivers in buildings. Renewable and SustainableEnergy Reviews, 41, 85–98. doi:10.1016/j.rser.2014.08.039
Vischer, J. C. (2007). The effects of the physical environment onjob performance: Towards a theoretical model of workspacestress. Stress and Health, 23(3), 175–184. doi:10.1002/smi.1134
Wyon, D. P. (2004). The effects of indoor air quality on per-formance and productivity. Indoor Air, 14(7), 92–101.doi:10.1111/j.1600-0668.2004.00278.x
Zhang, H., Arens, E., & Zhai, Y. (2015). A review of the correc-tive power of personal comfort systems in non-neutralambient environments. Building and Environment, 91,15–41. doi:10.1016/j.buildenv.2015.03.013
194 L. E. THOMAS


![Combating Trademark Counterfeiting on the Internetmedia.straffordpub.com/products/combating-trademark... · 2009. 9. 2. · August 19, 2009 [ 5 ] Combating Trademark Counterfeiting](https://static.fdocuments.in/doc/165x107/6041e9a9167fff75267182f4/combating-trademark-counterfeiting-on-the-2009-9-2-august-19-2009-5-combating.jpg)