COMAL COUNTY, TEXAS - cceo.org COUNTY, TEXAS AND INCORPORATED AREAS VOLUME 1 OF 3 Community ... The...
86
COMAL COUNTY, TEXAS AND INCORPORATED AREAS VOLUME 1 OF 3 Community Name Community Number Bulverde, City of 481681 Comal County, Unincorporated Areas 485463 Fair Oaks Ranch, City of 481644 Garden Ridge, City of 480148 New Braunfels, City of 485493 Schertz, City of 480269 Selma, City of 480046 Effective: September 2, 2009 Federal Emergency Management Agency FLOOD INSURANCE STUDY NUMBER 48091CV001A
Transcript of COMAL COUNTY, TEXAS - cceo.org COUNTY, TEXAS AND INCORPORATED AREAS VOLUME 1 OF 3 Community ... The...

COMAL COUNTY, TEXAS AND INCORPORATED AREAS VOLUME 1 OF 3
Community Name
Community Number
Bulverde, City of 481681 Comal County, Unincorporated Areas 485463 Fair Oaks Ranch, City of 481644 Garden Ridge, City of 480148 New Braunfels, City of 485493 Schertz, City of 480269 Selma, City of 480046
Effective: September 2, 2009
Federal Emergency Management Agency FLOOD INSURANCE STUDY NUMBER
48091CV001A

NOTICE TO FLOOD INSURANCE STUDY USERS
Communities participating in the National Flood Insurance Program have established repositories of flood hazard data for floodplain management and flood insurance purposes. This Flood Insurance Study may not contain all data available within the repository. It is advisable to contact the community repository for any additional data. Selected Flood Insurance Rate Map panels for the community contain information that was previously shown separately on the corresponding Flood Boundary and Floodway Map panels (e.g., floodways, cross sections). In addition, former flood hazard zone designations have been changed as follows:
Old Zone New Zone A1 through A30 AE V1 through V30 VE B X C X
Part or all of this Flood Insurance Study may be revised and republished at any time. In addition, part of this Flood Insurance Study may be revised by the Letter of Map Revision process, which does not involve republication or redistribution of the Flood Insurance Study. It is, therefore, the responsibility of the user to consult with community officials and to check the community repository to obtain the most current Flood Insurance Study components.

i
TABLE OF CONTENTS
VOLUME 1 Page 1.0 INTRODUCTION.......................................................................................................................... 1 1.1 Purpose of Study................................................................................................................. 1 1.2 Authority and Acknowledgments ....................................................................................... 1 1.3 Coordination ....................................................................................................................... 4 2.0 AREA STUDIED ........................................................................................................................... 4 2.1 Scope of Study .................................................................................................................... 4 2.2 Community Description...................................................................................................... 9 2.3 Principal Flood Problems.................................................................................................. 10 2.4 Flood Protection Measures ............................................................................................... 13 3.0 ENGINEERING METHODS ..................................................................................................... 14 3.1 Hydrologic Analyses......................................................................................................... 15 3.1.1 New/Revised Detailed Study Streams .............................................................................. 15 3.1.2 Unrevised (Digitally Converted) Detailed Study Streams................................................ 26 3.1.3 Redelineated Detailed Study Streams............................................................................... 28 3.1.4 Enhanced Approximate Study Streams ............................................................................ 28 3.2 Hydraulic Analyses........................................................................................................... 28 3.2.1 New/Revised Detailed Study Streams .............................................................................. 30 3.2.2 Unrevised (Digitally Converted) Detailed Study Streams................................................ 33 3.2.3 Redelineated Detailed Study Streams............................................................................... 34 3.2.4 Enhanced Approximate Study Streams ............................................................................ 35 3.3 Vertical Datum.................................................................................................................. 37 4.0 FLOODPLAIN MANAGEMENT APPLICATIONS............................................................... 38 4.1 Floodplain Boundaries...................................................................................................... 38 4.2 Floodways......................................................................................................................... 40 5.0 INSURANCE APPLICATIONS................................................................................................. 76 6.0 FLOOD INSURANCE RATE MAP........................................................................................... 76 7.0 OTHER STUDIES ....................................................................................................................... 78 8.0 LOCATION OF DATA ............................................................................................................... 78 9.0 BIBLIOGRAPHY AND REFERENCES................................................................................... 79

ii
TABLE OF CONTENTS (Cont’d)
VOLUME 1 Page FIGURES Figure 1 – Floodway Schematic .................................................................................................................40 TABLES Table 1 – Scope of Study .............................................................................................................................. 5 Table 2 – Stream Name Changes .................................................................................................................. 8 Table 3 – Letters of Map Change.................................................................................................................. 8 Table 4 – Summary of Discharges.............................................................................................................. 15 Table 5 – Summary of Reservoir Stillwater Elevations.............................................................................. 27 Table 6 – Summary of Roughness Coefficients.......................................................................................... 29 Table 7 – Hydraulic Methods ..................................................................................................................... 35 Table 8 – Topographic Mapping................................................................................................................. 39 Table 9 – Floodway Data............................................................................................................................ 42 Table 10 – Community Map History .......................................................................................................... 77
VOLUME 2
EXHIBITS
Exhibit 1 – Flood Profiles
Alligator Creek Panels 01P-07P Alligator Creek Tributary No. 6 Panels 08P-10P Bear Creek Panels 11P-14P Bracken Tributary Panels 15P-18P Cibolo Creek Panels 19P-37P Cibolo-Kelley Creek Overflow Panels 38P-40P Cibolo Tributary Panels 41P-42P Comal River / Dry Comal Creek Panel 43P
Dry Comal Creek Panels 44P-54P Comal Springs / Blieders Creek Panel 55P
Blieders Creek Panels 56P-63P Cypress Creek Panel 64P Elm Creek Panels 65P-71P Elm Creek 1 Panels 72P-75P Garden Ridge Tributary Panels 76P-79P

iii
TABLE OF CONTENTS (Cont’d)
VOLUME 3
EXHIBITS
Guadalupe River (Lower Reach) Panels 80P-91P Guadalupe River (Upper Reach) Panels 92P-111P Hanz Creek Panels 112P-113P Indian Creek Panels 114P-117P Indian Creek Tributary A Panel 118P Indian Creek Tributary B Panels 119P-120P Kelley Creek Panels 121P-124P Lewis Creek Panel 125P New Channel Comal River Panel 126P North Guadalupe Tributary Panels 127P-129P Old Channel Comal River Panels 130P-131P Postoak Creek Panels 132P-133P Rebecca Creek Panels 134P-145P Sattler Tributary Panels 146P-151P South Guadalupe Tributary Panels 152P-154P Swine Creek Panel 155P Tributary No. 1 to Swine Creek Panel 156P Tributary No. 2 to Swine Creek Panels 157P-158P Tributary No. 3 to Swine Creek Panel 159P Unnamed Tributary to Cibolo Creek Panel 160P Unnamed Tributary No. 1 to Upper Dry Comal Creek Panel 161P Unnamed Tributary No. 2 to Upper Dry Comal Creek Panel 162P Unnamed Tributary to Tributary No. 1 to Swine Creek Panel 163P Upper Dry Comal Creek Panels 164P-166P West Fork Dry Comal Creek Panels 167P-169P West Fork Tributary Panels 170P-171P York Creek Panel 172P-176P Exhibit 2 – Flood Insurance Rate Map Index Flood Insurance Rate Maps

1
FLOOD INSURANCE STUDY COMAL COUNTY AND INCORPORATED AREAS 1.0 INTRODUCTION
1.1 Purpose of Study
This Flood Insurance Study (FIS) revises and updates information on the existence and severity of flood hazards in the geographic area of Comal County, including the Cities of Bulverde, Fair Oaks Ranch, Garden Ridge, New Braunfels, Schertz and Selma, and the unincorporated areas of Comal County (referred to collectively herein as Comal County), and aids in the administration of the National Flood Insurance Act of 1968 and the Flood Disaster Protection Act of 1973. This study has developed flood-risk data for various areas of the community that will be used to establish actuarial flood insurance rates and to assist the community in its efforts to promote sound floodplain management. Minimum floodplain management requirements for participation in the National Flood Insurance Program (NFIP) are set forth in the Code of Federal Regulations at 44 CFR, 60.3. Please note that the City of Fair Oaks Ranch is geographically located in Bexar, Comal and Kendall Counties. The flood-hazard information for the City of Fair Oaks Ranch that is available in the Comal County FIS does not cover those areas located in Bexar and Kendall Counties. See separately published Bexar and Kendall Counties FIS reports and Flood Insurance Rate Maps (FIRMs). Please note that the City of New Braunfels is geographically located in Comal and Guadalupe Counties. The flood-hazard information for the City of New Braunfels that is available in the Comal County FIS does not cover those areas located in Guadalupe County. See separately published Guadalupe County FIS report and FIRMs. Please note that the Cities of Schertz and Selma are geographically located in Bexar, Comal and Guadalupe Counties. The flood-hazard information for those Cities that is available in the Comal County FIS does not cover those areas located in Bexar or Guadalupe Counties. See separately published Bexar and Guadalupe Counties FIS reports and FIRMs. In some States or communities, floodplain management criteria or regulations may exist that are more restrictive or comprehensive than the minimum Federal requirements. In such cases, the more restrictive criteria take precedence, and the State (or other jurisdictional agency) will be able to explain them.
1.2 Authority and Acknowledgments
The sources of authority for this FIS report are the National Flood Insurance Act of 1968 and the Flood Disaster Protection Act of 1973.
Comal County: The original hydrologic and hydraulic analyses for Comal County were performed for the Federal Emergency Management Agency (FEMA). The hydrologic and hydraulic analyses were updated by K. M. Ng & Associates, Inc., for FEMA. This work was completed in August 1983.

2
An update of the hydrologic and hydraulic analyses for portions of Cibolo Creek and Postoak Creek were prepared by C. A. Bolner and Associates, Inc. Cibolo Creek was revised from Ralph Fair Road to the county boundary to incorporate updated information and topographic data, and Postoak Creek was studied by detailed methods. This work was completed in July 1986. An update of the hydraulic analyses for portions of the Guadalupe River (Upper Reach) was prepared by James Miertschin & Associates. In this update, the Guadalupe River (Upper Reach) from U.S. Route 281 to a point approximately 6,000 feet upstream was revised to incorporate a more up-to-date hydraulic analyses. This work was completed in May 1987. Cibolo Creek, Cibolo-Kelley Creek Overflow, and Kelley Creek were studied by detailed methods as part of the Flood Insurance Studies for Bexar, Comal, and Guadalupe Counties, Texas. The hydrologic analyses for Cibolo Creek and Kelley Creek were performed by Dewberry & Davis. The hydraulic analyses for Cibolo Creek, Cibolo-Kelley Creek Overflow, and Kelley Creek were performed by the U.S. Army Corps of Engineers (USACE), Fort Worth District, for FEMA, under Interagency Agreement No. EMW-90-E-3263, Project Order No. 3. This work was completed in January 1993 (Reference 1). The Comal County study was then revised on July 17, 1995, to update floodplain information for Cibolo Creek, to show more detailed hydrologic and hydraulic information along Kelley Creek and Cibolo-Kelley Creek Overflow that affects Comal County, Texas, and to reflect updated county limits.
The hydrologic and hydraulic analyses for Alligator Creek, Bracken Tributary, a segment of Dry Comal Creek (starting approximately 10.2 miles upstream of its confluence with the Comal River), Garden Ridge Tributary, the Guadalupe River Lower Reach from just upstream of the New Braunfels extra territorial jurisdictional limits to Canyon Lake Dam, Upper Dry Comal Creek and the West Fork were updated by Halff Associates, Inc., for FEMA under Contract No. EMT-2002-CO-0051. This study was completed in November 2005. The study also involved updates to approximate study streams throughout the County, and the creation of new hydrologic and hydraulic analyses for Alligator Tributary No. 6 and Bear Creek. The hydrologic and hydraulic analyses for Cibolo Creek from the Comal/Guadalupe County line to the Kendall/Comal County line are based on preliminary models prepared by the USACE Fort Worth District, in support of an ongoing Planning Study for the San Antonio River Authority, the Guadalupe Blanco River Authority and the San Antonio Water System. The USACE study was not complete at the time of this FIS report preparation and both the hydrology and hydraulics modeling are subject to revisions. The USACE modeling represents the best available data for this reach of Cibolo Creek at that time. Floodways for this reach of Cibolo Creek were computed by Halff Associates, Inc., for FEMA under Contract No. EMT-2002-CO-0051. This floodway computation was completed in November 2005. City of Bulverde: The City of Bulverde is a newly incorporated community that merged the cities of Bulverde East (Community number 481681), Bulverde North (Community number 481683), and Bulverde South (Community number 481682). The City had no prior FIS reports or maps.

3
All FIS information was previously included on the Comal County FIRMs and FBFW maps, and the Comal County FIS report. City of Fair Oaks Ranch: The City of Fair Oaks Ranch did not have a separate previously printed FIS report. Effective data was included in the Bexar County FIS report and maps. City of Garden Ridge: The hydrologic and hydraulic analyses for the City of Garden Ridge FIS were performed by K. M. Ng & Associates, Inc., during the course of the Flood Insurance Study for Comal County, Texas. The Comal County study was completed in August 1983 (Reference 2). City of New Braunfels: The original hydrologic and hydraulic analyses for the City of New Braunfels FIS were performed by K. M. Ng & Associates, Inc., for FEMA. The work for that study was completed in August 1983. The hydrologic and hydraulic analyses for the May 15, 1991, FIS report for New Braunfels, Comal and Guadalupe Counties, Texas, were performed by various contractors for FEMA. The hydrologic analyses for North and South Guadalupe Tributaries were performed by Freese and Nichols, Inc., Consulting Engineers; the hydraulic analyses for those streams were performed by Black & Veatch, Engineers-Architects, and Dewberry & Davis. The hydrologic and hydraulic analyses for Dry Comal Creek were performed by Dewberry & Davis. The work for the May 15, 1991, revision was completed in November 1989. A revision to the hydrologic and hydraulic analyses was provided to FEMA by the City of New Braunfels, in accordance with the Cooperating Technical Partner Memorandum of Agreement dated May 31, 2001, between the City of New Braunfels, Comal County, and FEMA. The actual hydrologic and hydraulic analyses were performed by CH2M Hill for the City of New Braunfels. This work was completed on August 22, 2003 (Reference 3). City of Schertz: The initial City of Schertz FIS became effective on September 15, 1977. The City of Schertz hydrologic and hydraulic analyses were revised by Black & Veatch, Consulting Engineers for FEMA under Contract No. H-3814. The hydrologic and hydraulic analyses in this revision were prepared by Black & Veatch, Consulting Engineers during the preparation of the original study. The work for that revision was completed in February 1989. Dewberry & Davis also prepared updated hydraulic modeling for East Branch Dietz Creek, under the direction of FEMA. That work was completed in September 1991 (Reference 4). City of Selma: The hydrologic and hydraulic analyses for the City of Selma FIS dated January 1980 and the FIRM dated July 2, 1980, were prepared by the U.S. Geological Survey (USGS), Water Resources Division, Austin, Texas, for the Flood Insurance Administration (FIA), under Interagency Agreement No. IAA-H-17-75, Project Order No. 4. That work was completed in

4
July 1978 (Reference 5). The City of Selma is located in three counties, and each applicable area is to be shown in its respective county.
1.3 Coordination
The initial Consultation Coordination Officer (CCO) meeting was held on July 31, 2003, and attended by representatives of FEMA and Michael Baker Jr., Inc., Officials of the Cities of Bulverde, New Braunfels, Comal County, representatives of the Texas Water Development Board (TWDB), Carter and Burgess, Inc., CH2M Hill, The New Braunfels Herald-Zeitung, The Schultz Group, Inc., Watershed Concepts, and Halff Associates, Inc. The results of the study were reviewed at the final CCO meeting held on October 13, 2004, and attended by representatives of Cities of Bulverde, New Braunfels, Comal County and Halff Associates, Inc.. All problems raised at that meeting have been addressed in this study.
2.0 AREA STUDIED
2.1 Scope of Study
This FIS report covers the geographic area of Comal County, Texas, including the incorporated communities listed in Section 1.1. The areas studied by detailed methods were selected with priority given to all known flood hazards and areas of projected development or proposed construction through July 2003. Approximate analyses were used to study those areas having a low development potential or minimal flood hazards. The scope and methods of study were proposed to, and agreed upon, by FEMA and community officials. The flooding sources studied by Detailed and Enhanced Approximate riverine methods along with the limits of study are shown in Table 1 “Scope of Study”. Portions of the following sources and numerous unnamed streams were studied by (non-enhanced) approximate methods: Ahern Creek, Alligator Creek, Bear Creek (Bear Creek Watershed), Bear Creek (Lower Dry Comal Watershed), Blieders Creek Tributary 12, Caney Creek, Carpers Creek, Cherry Creek, Cypress Creek, Deep Creek, Devils Hollow, Dripping Springs Creek, Dry Bear Creek, Dutch Creek, Elm Creek, Four Mile Creek, a segment of the Guadalupe River just upstream of Canyon Lake, Hanz Creek, HID Trib 1 of Cibolo Creek, Honey Creek, Indian Creek, Indian Creek Tributary A, Isaac Creek, Jacobs Creek, Jentsch Creek, Kelley Creek, Lewis Creek, Little Bear Creek, Little Blanco River, Miller Creek, Mountain Hollow Creek, Museback Creek, Pleasant Valley Creek, Potter Creek, Puter Creek, Rebecca Creek, Rocky Creek, Schultz Creek, Sorrel Creek, Spring Branch, Swine Creek, Tom Creek, Turkey Creek, Water Hole Creek, West Fork Tributary, and York Creek. The Canyon Lake Reservoir was also studied by detailed methods for its entire shoreline within the County. Part of Lewis Creek was originally studied by detailed methods in the Flood Insurance Study for Comal County, Texas, dated May 14, 1976; the detailed study was redelineated against updated topography and is once again incorporated into the FIS report.

5
Table 1 – Scope of Study Stream Reaches Studied by Detailed Methods
Stream Name Downstream Limit Upstream Limit Length
(mi)
New/Revised Detailed Study Streams
Alligator Creek Comal County Limit Approximately 220 feet
upstream of Hoffman Lane 6.4
Alligator Creek Tributary No. 6 Confluence with Alligator Creek
Approximately 150 feet upstream of FM 306
2.3
Bear Creek (Dry Comal Watershed)
Confluence with Dry Comal Creek
Approximately 3.3 miles upstream
3.3
Blieders Creek (New Braunfels ETJ reach)
New Braunfels Corporate limits located approximately 2,160 feet upstream of River Road
New Braunfels Corporate Limits located approximately 700 feet downstream of State Highway 46
--
Blieders Creek (Upper Reach) New Braunfels Corporate Limits located approximately 700 feet downstream of State Highway 46
New Braunfels Corporate Limits located approximately 2,800 feet upstream of Horseshoe Trail
--
Blieders Creek (New Braunfels ETJ reach upstream of Upper Reach)
New Braunfels Corporate Limits located approximately 2,800 feet upstream of Horseshoe Trail
Approximately 700 feet downstream of FM 1863
--
Bracken Tributary Confluence with Cibolo Creek
2074 feet upstream of Garden North Drive
3.81
Cibolo Creek Guadalupe County Boundary Kendall County Boundary 46.16 Comal River/Dry Comal Creek
Confluence with the Guadalupe River
Approximately 600 feet upstream of Krueger Canyon Road
--
Comal Springs/Blieders Creek
Convergence with Old Channel Comal River and New Channel Comal River
New Braunfels Corporate Limits located approximately 2,160 feet upstream of River Road
--
Dry Comal Creek (New Braunfels ETJ reach)
New Braunfels Corporate Limits approximately 600 feet upstream of Krueger Canyon Road
Approximately 10.2 miles upstream of its confluence with the Comal River
--
Dry Comal Creek Approximately 10.2 miles upstream of its confluence with the Comal River
Confluence of the West Fork and Upper Dry Comal streams
5.6
Garden Ridge Tributary Confluence with Garden Ridge Tributary
152 feet upstream of Schoenthal Road
3.32
Guadalupe River Lower Reach, in New Braunfels
Approximately 9,900 feet downstream of U.S. Interstate 35
Approximately 300 feet upstream of Missouri Kansas Texas Railroad
--

6
Table 1 – Scope of Study Stream Reaches Studied by Detailed Methods
Stream Name Downstream Limit Upstream Limit Length
(mi)
New/Revised
Detailed Study Streams
Guadalupe River Lower Reach, in New Braunfels ETJ
Approximately 300 feet upstream of Missouri Kansas Texas Railroad
Approximately 800 feet upstream of Elm Creek Road
--
Guadalupe River Lower Reach downstream of Canyon Lake Dam
Approximately 800 feet upstream of Elm Creek Road
Outlet from the Canyon Lake dam
14.5
New Channel Comal River Convergence with Dry Comal Creek
Divergence from Old Channel Comal River and Comal Springs/Blieders Creek
--
North Guadalupe Tributary Confluence with Guadalupe River
Approximately 120 feet upstream of FM 1044
--
Old Channel Comal River Confluence Divergence from Comal Springs and New Channel Comal Road
--
South Guadalupe Tributary Confluence with North Guadalupe Tributary
Approximately 100 feet upstream of FM 1044
--
Upper Dry Comal Creek Confluence with Dry Comal Creek
Schuetz Dam (SCS Dam 2) 1.1
West Fork Confluence with Dry Comal Creek
Krause Dam (SCS Dam 1) 2.8
Redelineation Detailed Study
Streams
Lewis Creek FM 1863 Approximately 4,800 feet
upstream 0.91
Unrevised (Digital Conversion)
Detailed Study Streams
Cibolo-Kelley Creek Overflow Confluence with Kelley
Creek Confluence with Cibolo Creek
--
Cibolo Tributary Confluence with Cibolo Creek
Approximately 0.2 mile upstream of Ralph Fair Road
--
Cypress Creek Confluence with the Guadalupe River (Upper Reach)
Approximately 4,800 feet upstream
1.14
Elm Creek A point approximately 0.4 mile upstream of its confluence with the Guadalupe River
A point approximately 0.9 mile upstream of the Access Road Ford low water crossing
--

7
Table 1 – Scope of Study Stream Reaches Studied by Detailed Methods
Stream Name Downstream Limit Upstream Limit Length
(mi)
Guadalupe River (Upper Reach) Just upstream of Canyon Lake
County boundary --
Digital Conversion Detailed Study Streams
Indian Creek Confluence with Cibolo
Creek Approximately 3.0 miles upstream
--
Indian Creek Tributary A Confluence with Indian Creek Approximately 0.6 mile upstream
--
Indian Creek Tributary B Confluence with Indian Creek Approximately 1.8 miles upstream
--
Kelley Creek Confluence with Cibolo Creek
Approximately 8,510 feet upstream of confluence with Cibolo Creek
1.6
Postoak Creek Confluence with Cibolo Creek
Kendall County boundary --
Rebecca Creek A point approximately 0.9 mile upstream of its confluence with the Guadalupe River
A point approximately 6.7 miles upstream of its confluence with the Guadalupe River
--
Sattler Tributary Confluence with the Guadalupe River
Approximately 1.4 miles upstream
--
Unnamed Tributary No. 1 to Upper Dry Comal Creek
Confluence with Upper Dry Comal Creek
Approximately 860 feet upstream of State Highway 46
0.25
Unnamed Tributary No. 2 to Upper Dry Comal Creek
Confluence with Upper Dry Comal Creek
Approximately 640 feet upstream of State Highway 46
0.29
Unnamed Tributary to Cibolo Creek
Approximately 20 feet upstream of US 281
Approximately 2,250 feet upstream of US 281
0.42
Upper Dry Comal Creek Approximately 8,000 feet downstream of State Highway 46
Approximately 2,250 feet downstream of State Highway 46
1.0
West Fork Tributary Confluence with Dry Comal Creek
A point approximately 1.1 miles upstream
--
York Creek Hays County boundary A point approximately 0.9 mile upstream of the confluence of Bullhead Hollow
--
Stream Reaches Studied by Enhanced Approximate Methods Type II
Dry Comal Tributary No. 13 Schuetz Dam Approximately 4.7 miles
upstream 4.7
Upper Dry Comal Creek Confluence with Dry Comal Creek
Approximately 19 miles upstream of the dam
19.0

8
Table 1 – Scope of Study Stream Reaches Studied by Detailed Methods
Stream Name Downstream Limit Upstream Limit Length
(mi)
West Fork Krause Dam Approximately 13.6 miles upstream of the dam
13.6
Table 2, “Stream Name Changes” lists those streams whose name has changed or differs from that published in the previous FIS for Comal County or any of the communities within.
Table 2 - Stream Name Changes
Community Old Name New Name
City of Garden Ridge Apple Run Garden Ridge Tributary The countywide FIS incorporates the determination of Letters of Map Revision for the projects listed by community in Table 3, “Letters of Map Change”.
Table 3 - Letters of Map Change
Project Stream Date
COMAL COUNTY UNINCORPORATED AREAS
Lewis Ranch Road Subdivision (LOMR 98-06-448P)
Bear Creek Unnamed Tributaries August 5, 1999
US Highway 281 H&H Analysis (LOMR 99-06-850P)
Cibolo Creek Unnamed Tributary April 1, 1999
US Highway 281 H&H Analysis (LOMR 99-06-1314P)
Cibolo Creek Unnamed Tributary June 23, 1999
Bulverde Commercial Subdivision Unit 2 (LOMR 03-06-418P)
Cibolo Creek Unnamed Tributary April 7, 2003
Flood Study, Unnamed Tributary to the Bear Creek, Comal County, Texas (LOMR 00-06-1800P)
Bear Creek Unnamed Tributaries June 5, 2001
Villareal Flood Study (LOMR 01-06-949P)
Cypress Creek February 22, 2002
Lantana Ridge Subdivision (LOMR 03-06-1394P)
Swine Creek, Tributary No.1 to Swine Creek, Tributary No.2 to Swine Creek, Tributary No.3 to Swine Creek, Unnamed Tributary to Tributary No.1 to Swine Creek
August 4, 2004

9
Table 3 - Letters of Map Change
Project Stream Date
Upper Dry Comal Creek at Herbelin Road (LOMR 04-06-127P)
Upper Dry Comal Creek Unnamed Tributaries
June 4, 2004
Rockwall Ranch Subdivision (LOMR 04-06-A199P)
West Fork Tributary January 14, 2005
The Woods of Bracken (LOMR 04-06-A135P)
Unnamed Tributary to Garden Ridge Tributary
April 28, 2005
River Crossing Subdivision ( LOMR 06-06-BB92P)
Elm Creek 1, Hanz Creek May 24, 2007
Rockwall Ranch Subdivision (LOMR 06-06-B357P)
Unnamed Tributary to West Fork April 27, 2006
CITY OF BULVERDE US Highway 281 H&H Analysis (LOMR 99-06-850P)
Cibolo Creek Unnamed Tributary April 1, 1999
US Highway 281 H&H Analysis (LOMR 99-06-1314P)
Cibolo Creek Unnamed Tributary June 23, 1999
Bulverde Commercial Subdivision Unit 2 (LOMR 03-06-418P)
Cibolo Creek Unnamed Tributary April 7, 2003
CITY OF SCHERTZ FM 3009 Channelization (LOMR 98-06-1251P)
Dry Comal Creek Unnamed Tributary
August 13, 1998
2.2 Community Description Comal County is located in south-central Texas, approximately 7 miles northeast of the City of San Antonio. It is bordered by Bexar County and the City of Selma to the southwest, Kendall and Blanco Counties to the northwest, Hays County to the northeast, and Guadalupe County and the City of Schertz to the southeast. The City of New Braunfels lies mostly contained within the county boundary. According to the U.S. Bureau of the Census, the population of Comal County was 78,021 in 2000 (Reference 6). New Braunfels, the largest city within Comal County, had a population of 36,494 in 2000 (Reference 7). Comal County was created and organized from parts of Bexar, Gonzales, and Travis Counties in 1846. The county is named for the Comal River, a spring-fed stream. The Guadalupe River and Cibolo Creek originate outside the County, as do the Cibolo Tributary, Postoak Creek and Rebecca Creek. All runoff from the County drains into two major basins: the San Antonio River Basin and the Guadalupe River Basin. The floodplains in the county are devoted mainly to agriculture, with the exception of the population centers. Most of the towns are characterized by residential development. New Braunfels, which is the county seat, has tourist centers and industries such as textile, furniture, and metal products. The terrain varies from steep limestone outcroppings to broad, flat blackland soil cover. Most of the county is situated on the Texas Edwards Plateau, which is underlain by Edwards

10
Limestone strata with soil cover of the Tarrant, Brackett, Denton, and Crawford series. The southern portion of Comal County is located on the Blackland Prairies, underlain by Anacacho Limestone and Taylor Marl and clay with soil cover of the Austin, Heiden, Houston Black, Krum, Trinity, Stephe, Eddy, and Lewisville series. Between the Texas Edwards Plateau and the Blackland prairies is the Balcones Fault and Escarpment, which is usually accepted as the boundary between the lowlands and highlands of Texas. Above the Balcones Fault and Escarpment, the surface is characteristically eroded. All the streams in the county flow from the Texas Edward Plateau to the Black1and Prairies. The mean annual precipitation for the county is 27.54 inches with an extreme of 7.28 inches within a 24-hour period recorded in September 1973. The wettest month is September with an average rainfall of 3.71 inches; the driest month is December with an average rainfall of 1.46 inches. The average annual temperature is 69 degrees Fahrenheit (F). The hottest months are July and August with an average temperature of 96° F; the coldest month is January with an average temperature of 51° F (Reference 1).
2.3 Principal Flood Problems
The history of flooding on the streams within Comal County indicates that flooding usually occurs during the spring tornado season and from occasional fall hurricanes (References 8, 9, 10, 11 and 12). Heavy rains in the general geographic region produce higher flooding; however, intense local thunderstorms can also produce severe flooding. Heavy flood damage was sustained in May 1972, particularly along the Guadalupe River below Canyon Lake (Reference 13). Other major flood damage occurred in August 1978 along the Guadalupe River at Spring Branch, which is upstream of Canyon Lake approximately 4 miles outside of Comal County, and above Canyon Lake (References 14 and 15). Heavy flooding occurred in October 1998 in the watersheds feeding the Guadalupe River (below Canyon Dam), the Comal River and Dry Comal Creek that caused inundation of areas outside the flood boundaries of the previous effective FIS. According to the National Weather Service (NWS), two hurricanes in the Eastern Pacific, Hurricane Madeline and Hurricane Lester, coupled with an atmospheric trough of low pressure over the western United States, led to heavy thunderstorms in various counties including Kendall, Comal, Hays and Travis Counties. Many of the recording rain gages operated by the NWS overflowed during the storm and incremental rainfall totals are not available for much of the area with the greatest rainfall. The largest rainfall occurred in the Guadalupe River Basin; most of the Basin received 8 or more inches of rainfall. A streamflow of 142,000 cfs was recorded at Station No. 08168500, which drains the Guadalupe River above the Comal River at New Braunfels, while 222,000 cfs were recorded at Station No. 08169500, which drains the Guadalupe River at New Braunfels. The volume of runoff for the gage at Guadalupe River at Cuero was computed for the period October 17-31, 1998, at about 1,840,000 acre-feet. The total outflow from Canyon Lake was only about 2,600 acre-feet, thus, almost all runoff at the Cuero Station originated from the basin downstream of the reservoir. The maximum water elevation at Canyon Lake was about 923 feet, which is about 20 feet lower than the spillway crest at the reservoir (References 16 and 17). In July 2002, 5 to 35 inches of rain caused massive flooding throughout central and southcentral Texas and affected thousands of homes. For the first time since it was filled in

11
1968, Canyon Lake Dam in Comal County poured over its emergency spillway (Reference 18). The 2002 flood is further illustrated in the City of New Braunfels section below. City of Garden Ridge: The history of flooding on the streams within the City of Garden Ridge indicates that flooding usually occurs during the spring tornado season and from occasional fall hurricanes. Heavy rains in the general geographic region produce higher flooding; however, intense local thunderstorms can also produce severe flooding (Reference 2).
City of New Braunfels: New Braunfels has a long history of extreme rainfall events and flooding. Major floods were recorded in July 1869, October 1870, June 1872, December 1913, July 1927, July 1932, June 1935, September 1952, May 1958, May 1972, October 1998, and July 2002. Those flood events that are of particular note include the floods of 1972, 1998, and 2002. These are important because they occurred after the construction of Canyon Dam in 1963. Excerpts describing these disastrous floods are provided below (Reference 3). Flood of May 1972 (References 19 and 20). According to informal "bucket surveys" in the area, rainfall estimates were as high as 16 inches over a 4-hour period. In addition, observational reports received from residents in the area stated that they observed 12 inches of rain between 8:40 p.m. and 9:40 p.m. on May 11, 1972. This flood caused extensive damage throughout the city and resulted in the loss of 15 lives. Heavy damage was sustained in areas along Blieders Creek near Landa Park (Landa Estates), areas along the Comal River (Guada Coma Estates), and areas along the Guadalupe River at Common Street and Rio Drive. The Comal River gage at San Antonio Street at the Tube Chute Park crested at 11:45 p.m. May 11 at 36.55 feet, driven by the 60,800 cubic feet per second (cfs) flood peak from the Blieders Creek Watershed. The same gage crested again at 5:30 a.m. on May 12 at 35.45 feet, this time dominated by the 55,800 cfs flood peak from the flood from Dry Comal Creek Watershed. The Guadalupe River above the Comal River confluence (at Common Street) crested at 31.65 feet, 92,600 cfs, between 12:30 to 1:00 a.m. on May 12. The New Braunfels gage (at the "Factory Mall") crested at 38.0 feet. Flood of October 1998. According to the USGS, by 6:00 a.m. on October 17, 1998, the area from western Comal County to eastern Medina County had received 4 to 6 inches of rain. By 8:00 a.m., 6 to 10 inches had fallen; and by late morning, the area had received about 15 inches of rainfall. The largest documented rainfall was in southern Hays County just south of San Marcos, where at least 30 inches was recorded. A second center, with about 22 inches of rain, was documented at a site in western Comal County. A flood-retention dam constructed on Blieders Creek apparently spared residents in the floodplain above Landa Park the severe flooding experienced in the May 1972 flood. Dry Comal Creek flooded hundreds of homes in western New Braunfels above the Comal River confluence just below Landa Park. The Comal River flooded many homes and businesses below Landa Park, including the Tube Chute Park. Flooding was disastrous along the Guadalupe River below Canyon Dam, starting where Bear Creek confluences with the Guadalupe River (Reference 21). Nineteen homes washed downstream in New Braunfels. One group, just above Common Street, had slab elevations as low as 12.5-feet gage height. The flood crest at the Common Street gage was 35.08 feet. The Common Street bridge deck is 17-feet gage height; 18 feet lower than the crest of the flood.

12
The remnants of the homes stacked against a grove of trees two blocks below Common Street in a stack three stories high Flood of July 2002. As much as 35 inches of rainfall fell during the event. The flood caused at least nine deaths and damage to about 48,000 homes. Nearly 250 flood rescue calls were reported, more than 130 roads were closed, and thousands of homes and businesses lost electrical power and telephone service. Thirty-four counties were identified by FEMA as Federal Declared Disaster areas. The storms produced large volumes of runoff and as many as four flood peaks at each of many streamflow-gaging stations in the Brazos, Colorado, and Guadalupe River Basins. The largest peak stream flow from the July 2002 storms represents the highest known peak gage height and discharge for 12 of the gaging stations. The July 2002 storm caused overtopping of Canyon Dam for the first time since its construction in 1963, contributing to a peak flow of 69,300 cfs along the Guadalupe River through New Braunfels (Reference 3). There are three USGS Gage Stations in the study area: one on the Comal River and two on the Guadalupe River. USGS Gage 08169000 (Comal River at New Braunfels) is located on the Comal River at San Antonio Street. The May 11, 1972, peak flow of 60,800 cfs was recorded at this location with two of a total of five Natural Resources Conservation Service (NRCS) flood-retarding dams in place. In 1998, after all five NRCS dams were in service, the Comal River recorded a peak flow of 73,500 cfs at the San Antonio Street gage (Reference 3). USGS Gage 08169500 (Guadalupe River at New Braunfels) is located on the Guadalupe River downstream of U.S. Interstate 35. USGS Gage 08168500 (Guadalupe River above Comal River) is located on the Guadalupe River at Common Street. The peak flow rates recorded for the Guadalupe River at this gage site since 1963 (construction of Canyon Dam) include the following (Reference 3).
October 17, 1998 – 142,000 cfs May 12, 1972 – 92,600 cfs July 6, 2002 – 69,300 cfs May 5, 1993 – 13,100 cfs July 27, 1979 – 13,000 cfs
City of Schertz: Accounts of flooding for Cibolo Creek in the City of Schertz have been well documented since installation of a gaging station at Selma by the USGS in 1947. Prior to this, recollection by long-time residents and high-water marks had been matched to establish previous events. The highest flood on record occurred July 16, 1973. The third highest flood occurred May 12, 1972. Both the 1972 and 1973 floods caused extensive property damage in Schertz. The second highest flood occurred in 1889, but little damage was noted due to lack of area development (Reference 4). City of Selma: In the City of Selma, three bridges on Cibolo Creek at the Interstate Highway 35 crossing in Guadalupe County cause only a small amount of backwater as the base flood is mostly contained within the channel banks. The main Interstate Highway 35 bridge has a stream

13
opening adequate to carry all of the selected discharges except the 0.2-percent-annual-chance -flood, which will overtop the main highway (Reference 5).
2.4 Flood Protection Measures
Canyon Lake, which is operated by the USACE, serves as a water conservation and major flood protection device on the Guadalupe River, with a total detention capacity of 736,700 acre-feet (References 22 and 23). Canyon Lake restrained most of the floodwaters from the August 1978 flood, restricting flood damage in Comal County. Major flooding did occur at Comfort and Spring Branch, which are upstream of the lake. There are four dams and reservoirs within the Comal River Watershed upstream of the county that serve as flood protection devices. These structures control runoff from 44.4 square miles, with a combined detention capacity of 9,875 acre-feet (Reference 24). Four dams on Rebecca Creek form recreational lakes at housing subdivisions upstream of Comal County. There are several water-retarding structures within the Cibolo Creek Watershed upstream of Comal County. These structures control runoff from 34 square miles, with a combined detention capacity of 8,850 acre-feet (Reference 25). Two dams are located within the York Creek Watershed upstream of the county. These dams control runoff from 15.73 square miles with a combined detention capacity of 3,764 acre-feet. At the present time, no other flood control projects are known to be underway or proposed for the county. Non-structural measures of flood protection can be utilized to aid in the prevention of future flood damage. These are in the form of land-use regulations adopted from the Code of Federal Regulations which control building within areas that have a high risk of flooding (Reference 1). City of Garden Ridge: At the present time, no flood control projects are underway or proposed for the City of Garden Ridge. Non-structural measures of flood protection can be utilized to aid in the prevention of future flood damage. These are in the form of land-use regulations adopted from the Code of Federal Regulations which control building within areas that have a high risk of flooding (Reference 2). City of New Braunfels: Canyon Dam is located upstream of New Braunfels, in the Guadalupe River Watershed. Completed in 1964, the Canyon Lake reservoir has a contributing drainage area of about 1,430 square miles, has a surface area of about 8,320 acres at normal pool elevation, and can impound 346,000 acre-feet of floodwaters before engaging the emergency spillway. The principal spillway has a capacity of about 5,000 cfs (Reference 26). However, the operating policy of the dam is to close the gates of this principal spillway and impound all the observed inflow when the flood peak downstream of the dam exceeds 12,000 cfs, based on the observed flow at the Gonzales, Texas gaging station. From 1964, when water was first impounded in Canyon Lake, until July 2002, no water was released from Canyon Lake during flood conditions. In July 2002, water overtopped the emergency spillway for the first time, with a peak rate of about 66,800 cfs as recorded on July 6, 2002 (References 26 and 27).

14
The NRCS, formerly the Soil Conservation Service, operates four flood control structures within the Dry Comal Creek Watershed, and one flood control structure in the Blieders Creek Watershed. These dams are upstream of New Braunfels and provide peak flow attenuation during intense storms, as follows (Reference 28):
Dam No. 1 on Dry Comal Creek - flood storage of 3,737 acre-feet; Dam No. 2 on Dry Comal Creek - flood storage of 7,878 acre-feet; Dam No. 3 on Blieders Creek - flood storage of 3,422 acre-feet; Dam No. 4 on Dry Comal Creek - flood storage of 3,604 acre-feet; and Dam No. 5 on Dry Comal Creek - flood storage of 350 acre-feet.
On the North Guadalupe Tributary, immediately downstream of Walnut Drive, there is a small basin named Structure 40. The structure consists of a 370-feet long earthen berm adjacent to a 30-feet wide by 5.2-feet tall concrete weir outlet. The basin attenuates the North Tributary flow a negligible amount. There are two low head dams on the studied reach of the Guadalupe River: upstream of Faust Street (No. 8) and upstream of Common Street (No. 7). These low-head dams do not provide flood protection. Dunlap Dam is located at the downstream end of the Guadalupe River study area in Guadalupe County. This dam is used to impound water for hydropower and provides little flood attenuation for downstream communities. Channelization projects along the North and South Tributaries were completed in 1989. Other flood control projects such as channel improvements (brush clearing and dredging), regional and local detention ponds, and re-routing of stormwater runoff are being currently evaluated by the city as part of a citywide drainage master plan (Reference 3). City of Schertz: There are no flood control measures in the City of Schertz within Comal County at this time, although channel improvements are under construction further downstream in Guadalupe County. Drainage channel maintenance and City zoning ordinances are the primary attempts to provide flood protection. Appropriate updating is required to ensure that these measures remain current (Reference 4).
3.0 ENGINEERING METHODS
For the flooding sources studied by detailed methods in the community, standard hydrologic and hydraulic study methods were used to determine the flood-hazard data required for this study. Flood events of a magnitude that is expected to be equaled or exceeded once on the average during any 10-, 50-, 100-, or 500-year period (recurrence interval) have been selected as having special significance for floodplain management and for flood insurance rates. These events, commonly termed the 10-, 50-, 100-, and 500-year floods, have a 10-, 2-, 1-, and 0.2-percent chance, respectively, of being equaled or exceeded during any year. Although the recurrence interval represents the long-term, average period between floods of a specific magnitude, rare floods could occur at short intervals or even within the same year. The risk of experiencing a rare flood increases when periods greater than 1 year are considered. For example, the risk of having a flood that equals or exceeds the 1-percent-annual-chance flood in any 50-year period is approximately 40 percent (4 in 10); for any 90-year period, the risk increases to approximately 60 percent (6 in 10). The analyses reported herein

15
reflect flooding potentials based on conditions existing in the community at the time of completion of this study. Maps and flood elevations will be amended periodically to reflect future changes. 3.1 Hydrologic Analyses
Hydrologic analyses were carried out to establish peak discharge-frequency relationships for each flooding source studied by detailed methods affecting the county. Peak discharge-drainage area relationships for the streams studied by detailed methods are shown in Table 4, Summary of Discharges. The streams that were modeled or revised during the 2005 New Braunfels FIS update or the 2005 countywide study are marked “New/Revised Detailed Study Streams”, streams that were redelineated as part of the countywide study are marked “Redelineation, Detailed Study Streams” and those converted from the effective FIS by digital conversion are marked “Unrevised Digitally Converted Detailed Study Streams”.
3.1.1 New/Revised Detailed Study Streams New Braunfels The hydrologic analysis approach used for all the streams that were revised in the 2005 New Braunfels FIS Update followed procedures outlined in New Braunfels Drainage and Erosion Control Design Manual (Reference 29). The streams studied by detailed methods include Comal Springs, Blieders Creek, Blieders Creek (Upper Reach), the Comal River, Dry Comal Creek, the Guadalupe River (Lower Reach) in New Braunfels, the New Channel Comal River, the North Guadalupe Tributary, the Old Channel Comal River, and the South Guadalupe Tributary.
TABLE 4 – SUMMARY OF DISCHARGES Detailed Study Streams
PEAK DISCHARGES (cfs) FLOODING SOURCE
AND LOCATION DRAINAGE
AREA (sq. miles)
10% Annual Chance
2% Annual Chance
1% Annual Chance
0.2% Annual Chance
New/Revised
Detailed Study Streams
ALLIGATOR CREEK 2110 feet downstream of FM 1101 13.30 9,600 18,000 21,700 32,500 2605 feet upstream of FM 1101 12.26 9,500 17,300 20,900 31,500 145 feet upstream of I-35 Northbound Lanes
10.09 9,500 16,500 20,000 30,300
890 feet upstream of I-35 Northbound Lanes
10.09 10,000 16,600 20,100 30,200
545 feet downstream of FM 1102 7.74 9,200 15,400 18,600 27,400 245 feet upstream of Hoffman Lane 7.27 9,300 16,200 19,700 28,200

16
TABLE 4 – SUMMARY OF DISCHARGES (Cont’d) Detailed Study Streams
PEAK DISCHARGES (cfs) FLOODING SOURCE
AND LOCATION DRAINAGE
AREA (sq. miles)
10% Annual Chance
2% Annual Chance
1% Annual Chance
0.2% Annual Chance
New/Revised
Detailed Study Streams
ALLIGATOR TRIBUTARY NO. 6 Approximately 3000 feet above the confluence with Alligator Creek
1.90 2,050 3,500 4,300 6,200
165 feet upstream of FM 306 0.56 900 1,550 1,850 2,650 BEAR CREEK SCS DAM 4 13.59 150 2,250 2,400 12,500 Split flow analysis --1 150 443 1,046 5,803 Split flow analysis --1 150 250 250 250 BRACKEN TRIBUTARY Upstream of Confluence with Garden Ridge Tributary (Sect. 2195)
3.2 2,227 4,092 5,032 7,767
Approx. 1200 feet upstream of Jethro Lane (Sect. 11042)
2.2 1,671 2,927 3,606 5,170
Approx. 480 feet downstream of Garden North Dr (Sect. 16331)
0.8 1,253 2,073 2,467 3,337
CIBOLO CREEK 731 feet upstream of Guadalupe County boundary
271.6 34,404 81,696 99,469 140,722
102 feet downstream of confluence of Bracken Tributary
271.2 34,560 81,806 99,570 140,827
1116 feet E-SE of intersection of Wagon Road and Evans Road
265.5 34,504 81,492 99,183 140,401
Below Stream CC-23 263.1 34,589 81,452 99,125 140,342 2926 feet W of intersection of Tommy Trail Drive and Garden North Drive
260.3 34,589 81,322 98,953 140,151
Below Stream CC-22 257.0 34,723 81,278 98,853 140,071 1265 feet NE from northern most corner of Cibolo View
253.5 34,723 81,099 98,619 139,816
CIBOLO CREEK (cont’d) 207 feet upstream of Cibolo Vista 249.7 34,904 81,047 98,495 139,665 XS 537372 242.2 34,883 80,558 97,782 138,847 Approximately 7350 feet upstream of FM 1863
238.4 35,103 80,533 97,623 138,638
2786 feet upstream of FM 1863 234.5 35,300 80,482 97,465 138,462 2799 feet S of end of Vogel Valley 230.8 35,284 80,217 97,079 138,061 830 feet SW of end of Twin Creeks Drive 228.8 35,477 80,250 97,050 138,002 1434 feet S-SW of intersection of Onion Creek Drive and FM 1863
206.4 35,143 78,186 93,753 134,663

17
TABLE 4 – SUMMARY OF DISCHARGES (Cont’d) Detailed Study Streams
PEAK DISCHARGES (cfs) FLOODING SOURCE
AND LOCATION DRAINAGE
AREA (sq. miles)
10% Annual Chance
2% Annual Chance
1% Annual Chance
0.2% Annual Chance
New/Revised
Detailed Study Streams
1538 feet NE of end of Kingsnake Drive 203.0 35,288 78,359 93,736 134,739 737 feet downstream of downstream face of Highway 281 North
197.1 35,468 78,023 93,085 134,370
2071 feet upstream of Bulverde Road 192.1 35,652 77,391 92,046 133,858 2390 feet upstream of confluence of Museback Creek
179.2 35,151 74,878 89,412 131,007
241 feet SW of intersection of Leroy Scheel Road and Bulverde Road
175.2 35,518 74,087 88,612 130,242
1630 feet downstream of Specht Road 165.5 34,867 72,293 86,347 127,673 735 feet upstream of Specht Road 165.1 35,015 72,352 86,409 127,696 176 feet downstream of Ludwig Trail 162.6 34,974 72,046 85,940 127,141 813 feet upstream of Ludwig Trail 162.5 35,028 72,041 85,952 127,126 99 feet upstream of Blanco Road 154.3 34,718 70,899 84,362 125,215 Approximately 6450 feet upstream of Blanco Road
153.3 35,046 71,029 84,504 125,697
4250 feet upstream of confluence of Pleasant Valley Creek
151.1 35,027 70,813 84,100 125,213
2024 feet SE of end of Georg Oaks Drive 150.1 35,243 71,083 84,314 125,545 1206 feet E of end of Schaefer Road 127.9 32,595 65,405 77,354 116,975 Below Stream CC-18 124.9 33,217 66,201 78,092 117,435 1808 feet SW of end of Georg Street 121.8 33,217 65,836 77,541 116,809 XS 691005 120.6 33,570 66,062 77,563 116,971 XS 695851 117.0 33,416 65,252 76,600 115,896 1994 feet downstream of Ralph Fair Road 115.2 33,973 65,336 76,540 116,383 443 feet upstream of Ralph Fair Road 111.8 33,398 63,900 74,909 114,430 769 feet W-NW of intersection of Mellow Wind and Sweetwind
111.1 33,700 64,229 75,217 114,828
831 feet downstream of Battle Intense 102.6 31,046 59,372 69,820 108,422 1004 feet upstream of Comal County boundary
100.8 31,320 59,811 70,638 108,677
COMAL RIVER/DRY COMAL CREEK IN NEW BRAUNFELS
At confluence with Guadalupe River 128.5 21,648 36,846 43,670 67,238 DRY COMAL CREEK (ETJ AREA) --2 --2 --2 --2 --2 DRY COMAL CREEK Bunker Street 80.35 12,299 22,428 26,823 41,857 High Creek Road (Friesenhahn Lane) 79.80 12,194 22,212 26,542 41,307 Coyote Run 70.53 3,450 6,900 8,900 33,200

18
TABLE 4 – SUMMARY OF DISCHARGES (Cont’d) Detailed Study Streams
PEAK DISCHARGES (cfs) FLOODING SOURCE
AND LOCATION DRAINAGE
AREA (sq. miles)
10% Annual Chance
2% Annual Chance
1% Annual Chance
0.2% Annual Chance
New/Revised
Detailed Study Streams
250 feet downstream of confluence with Bear Creek
68.81 3,400 6,300 8,100 32,800
125 feet downstream of confluence with West Fork Dry Comal Creek
53.83 2,850 5,200 6,500 27,100
COMAL SPRINGS/BLIEDERS CREEK IN NEW BRAUNFELS
At confluence with Old Channel Comal River (Segment CRJ010)
16.8 4,114 7,132 8,126 14,644
BLIEDERS CREEK (ETJ AREA) --2 --2 --2 --2 --2 BLIEDERS CREEK (UPPER REACH) At Klingeman Street, outflow to Comal Springs (Segment BC Outflow)
15.8 3,531 6,306 7,445 14,129
At Loop 337 (Segment BCJ220) 14.9 3,271 5,995 6,963 13,936 At NRCS Dam No. 3 (Outflow) 11.5 1,33 1,189 2,873 12,293 At NRCS Dam No. 3 (Inflow) 11.5 11,314 18,488 24,159 30,655 At State Highway 46 (Segment CJ041) 1.8 3,348 4,999 5,505 7,670 BLIEDERS CREEK (ETJ ABOVE UPPER REACH)
--2 --2 --2 --2 --2
GARDEN RIDGE TRIBUTARY Upstream of Confluence with Bracken Tributary (Sect. 326)
2.2 1,834 2,843 3,860 6,286
Upstream of FM 2252 (Sect. 6751) 1.5 1,834 2,843 3,369 4,843 Approx. 740 feet downstream of Forest Waters Circle (Sect. 13535)
0.5 1,569 2,397 2,805 3,820
GUADALUPE RIVER (LOWER REACH, NEW BRAUNFELS) 6
At Dunlap Dam 233 59,438 103,388 122,977 184,036 At US Interstate 35, below Comal River (Segment GRJ500)
221 58,588 102,133 120,962 188,253
At Common Street, above confluence with Comal River (Segment GRJ450)
88 39,233 71,559 85,458 132,918
At Gruence Road (Segment GRJ450) 85 39,086 71,372 85,458 132,975

19
TABLE 4 – SUMMARY OF DISCHARGES (Cont’d) Detailed Study Streams
PEAK DISCHARGES (cfs) FLOODING SOURCE
AND LOCATION DRAINAGE
AREA (sq. miles)
10% Annual Chance
2% Annual Chance
1% Annual Chance
0.2% Annual Chance
New/Revised
Detailed Study Streams
GUADALUPE RIVER (LOWER REACH, ETJ AREA) 6
--2 --2 --2 --2 --2
GUADALUPE RIVER (LOWER REACH, FROM ETJ LIMITS TO CANYON LAKE DAM) 6
3880 feet upstream of River Road 60.91 35,900 61,000 72,400 129,7003 325 feet downstream of confluence of Deep Creek
58.99 37,600 63,400 75,100 129,7003
585 feet downstream of confluence of Turkey Creek
55.68 37,100 62,000 73,500 129,7003
425 feet downstream of confluence of Bear Creek
53.22 36,700 60,900 72,700 129,7003
555 feet upstream of Ponderosa Crossing 34.82 25,100 41,700 50,800 129,8003 5500 feet upstream of Ponderosa Crossing 29.96 21,700 37,200 44,900 129,8003 335 feet downstream of confluence of Sattler Tributary 4
24.67 18,200 31,100 38,200 129,8003
220 feet downstream of confluence of Cordovs Hollow
22.56 17,500 29,800 36,200 129,9003
1600 feet upstream of FM 306 16.43 13,800 23,800 29,100 129,9003 7960 feet upstream of FM 306 2.37 --5 --5 14,0003 130,0003 7800 feet upstream of unnamed dam 2.37 5,500 5,900 7,200 10,100 NEW CHANNEL COMAL RIVER --2 --2 --2 --2 --2
NORTH GUADALUPE TRIBUTARY At confluence with Guadalupe River (Mouth Segment NGJ080)
4.7 4,708 6,714 7,436 9,738
At FM 725 (Segment GRJ500) 1.4 2,058 2,890 3,073 3,656 At Walnut Avenue (Segment NGJ030) 0.8 1,882 2,707 2,936 4,267 OLD CHANNEL COMAL RIVER Just upstream of East Common Street 17.9 3,799 5,563 6,629 8,803 SOUTH GUADALUPE TRIBUTARY At FM 725 (Segment SGJ060) 3.0 3,005 4,256 4,755 6,177 At Walnut Avenue (Segment SGJ040) 2.0 2,705 4,028 4,496 6,283 UPPER DRY COMAL CREEK SCS DAM 2 30.15 200 1,200 3,600 14,800 Outflow of SCS DAM 2 minus weir flow --2 200 330 330 330

20
TABLE 4 – SUMMARY OF DISCHARGES (Cont’d) Detailed Study Streams
PEAK DISCHARGES (cfs) FLOODING SOURCE
AND LOCATION DRAINAGE
AREA (sq. miles)
10% Annual Chance
2% Annual Chance
1% Annual Chance
0.2% Annual Chance
Unrevised Digitally Converted
Detailed Study Streams
Approximately 35,500 feet upstream of FM 1863
7.8 --2 --2 9,928 --2
WEST FORK DRY COMAL CREEK 470 feet upstream of Tonne Drive 22.65 2,450 4,350 5,600 18,700 SCS DAM 1 18.38 900 2,300 5,600 18,600 Outflow of SCS DAM 1 minus weir flow --2 900 1,500 1,500 1,500
Redelineation
Detailed Study Streams
LEWIS CREEK --2 --2 --2 --2 --2
Unrevised Digitally Converted Detailed Study Streams
CIBOLO-KELLEY CREEK OVERFLOW At time of Cibolo Creek peak --2 --2 1,690 4,100 17,110 CIBOLO TRIBUTARY Upstream of confluence with Cibolo Creek
3.10 4,262 5,894 6,773 8,669
CYPRESS CREEK --2 --2 --2 --2 --2 ELM CREEK Upstream of confluence with the Guadalupe River
15.3 3,010 4,565 5,471 7,620
At cross section O 4.6 2,854 4,322 5,180 7,217 At cross section Z 3.1 2,311 3,463 4,130 5,763 At cross section AJ 1.4 1,538 2,304 2,706 3,600 ELM CREEK 1 Just Upstream of Confluence with Hanz
Creek 6.07 --2 --2 11,870 --2
GUADALUPE RIVER (UPPER REACH) At cross section CP 1332.1 46,730 113,450 156,600 305,360 At cross section CZ 1328.8 46,940 114,450 158,260 309,670 Upstream of FM 331 1315.0 47,230 115,860 160,570 315,730 At confluence of Ahern Creek 1296.0 47,630 117,820 163,800 324,270

21
TABLE 4 – SUMMARY OF DISCHARGES (Cont’d) Detailed Study Streams
PEAK DISCHARGES (cfs) FLOODING SOURCE
AND LOCATION DRAINAGE
AREA (sq. miles)
10% Annual Chance
2% Annual Chance
1% Annual Chance
0.2% Annual Chance
Unrevised Digitally Converted
Detailed Study Streams
Upstream of Ammann Road 1270.2 48,820 123,730 173,620 350,530 Upstream of confluence of Curry Creek 1199.0 49,020 124,720 175,260 354,960 HANZ CREEK
Approximately 2,550 feet Upstream of the confluence with Elm Creek 1
3.62 --2 --2 5,646 --2
INDIAN CREEK Upstream of confluence with Cibolo Creek
13.5 8,988 17,097 21,875 30,227
At the confluence of Indian Creek Tributary A
9.6 7,754 13,396 16,695 22,470
Upstream of confluence of Indian Creek Tributary B
9.1 7,603 12,936 16,063 21,578
INDIAN CREEK TRIBUTARY A Upstream of confluence with Indian Creek 2.0 3,135 4,165 4,682 5,868 INDIAN CREEK TRIBUTARY B Upstream of confluence with Indian Creek 0.8 1,606 2,066 2,276 2,741 KELLEY CREEK At confluence with Cibolo Creek (Cibolo Creek Diversion added)
10.85 7,200 13,800 15,910 22,740
POSTOAK CREEK At confluence with Cibolo Creek 8.20 2,600 5,300 7,300 10,237 REBECCA CREEK At cross section B 14.1 7,524 11,382 13,534 18,768 At cross section C 12.8 7,221 10,926 12,986 17,991 At cross section I 11.9 7,114 10,744 12,735 17,660 Upstream of confluence of Putter Creek 9.7 6,539 9,854 11,641 16,053 REBECCA CREEK (Cont’d) At FM 306 3.9 3,296 4,976 5,868 7,950 At cross section AG 1.9 1,577 2,390 2,821 3,853 SATTLER TRIBUTARY Upstream of confluence with the Guadalupe River
1.0 814 1,224 1,452 1,909

22
TABLE 4 – SUMMARY OF DISCHARGES (Cont’d) Detailed Study Streams
PEAK DISCHARGES (cfs) FLOODING SOURCE
AND LOCATION DRAINAGE
AREA (sq. miles)
10% Annual Chance
2% Annual Chance
1% Annual Chance
0.2% Annual Chance
Unrevised Digitally Converted
Detailed Study Streams
At cross section F 0.6 730 1,087 1,273 1,688 SWINE CREEK
Approximately 2,600 feet downstream of Lantana Valley Drive
1.53 --2 --2 3,130 --2
Approximately 500 feet downstream of Lantana Valley Drive
1.29 --2 --2 2,827 --2
TRIBUTARY NO. 1 TO SWINE CREEK
At confluence with Swine Creek 2.60 --2 --2 4,403 --2 TRIBUTARY NO. 2 TO SWINE CREEK
At the confluence with Swine Creek 0.13 --2 --2 342 --2 TRIBUTARY NO. 3 TO SWINE CREEK
At the confluence with Swine Creek 0.71 --2 --2 1,608 --2 UNNAMED TRIBUTARY TO CIBOLO CREEK
Just upstream of US Highway 281 0.6 --2 --2 1,260 --2 UNNAMED TRIBUTARY NO. 1 TO UPPER DRY COMAL CREEK
At the confluence with Upper Dry Comal Creek
0.6 --2 --2 1,020 --2
UNNAMED TRIBUTARY NO. 2 TO UPPER DRY COMAL CREEK
At the confluence with Upper Dry Comal Creek
0.5 --2 --2 1,135 --2
UNNAMED TRIBUTARY TO
TRIBUTARY NO. 1TO SWINE CREEK
At confluence with Tributary No. 1 to Swine Creek
0.24 --2 --2 673 --2
WEST FORK TRIBUTARY Upstream of confluence with Dry Comal Creek
31.1 1,315 1,964 2,305 3,060
23
TABLE 4 – SUMMARY OF DISCHARGES (Cont’d) Detailed Study Streams
PEAK DISCHARGES (cfs) FLOODING SOURCE
AND LOCATION DRAINAGE
AREA (sq. miles)
10% Annual Chance
2% Annual Chance
1% Annual Chance
0.2% Annual Chance
Unrevised Digitally Converted
Detailed Study Streams
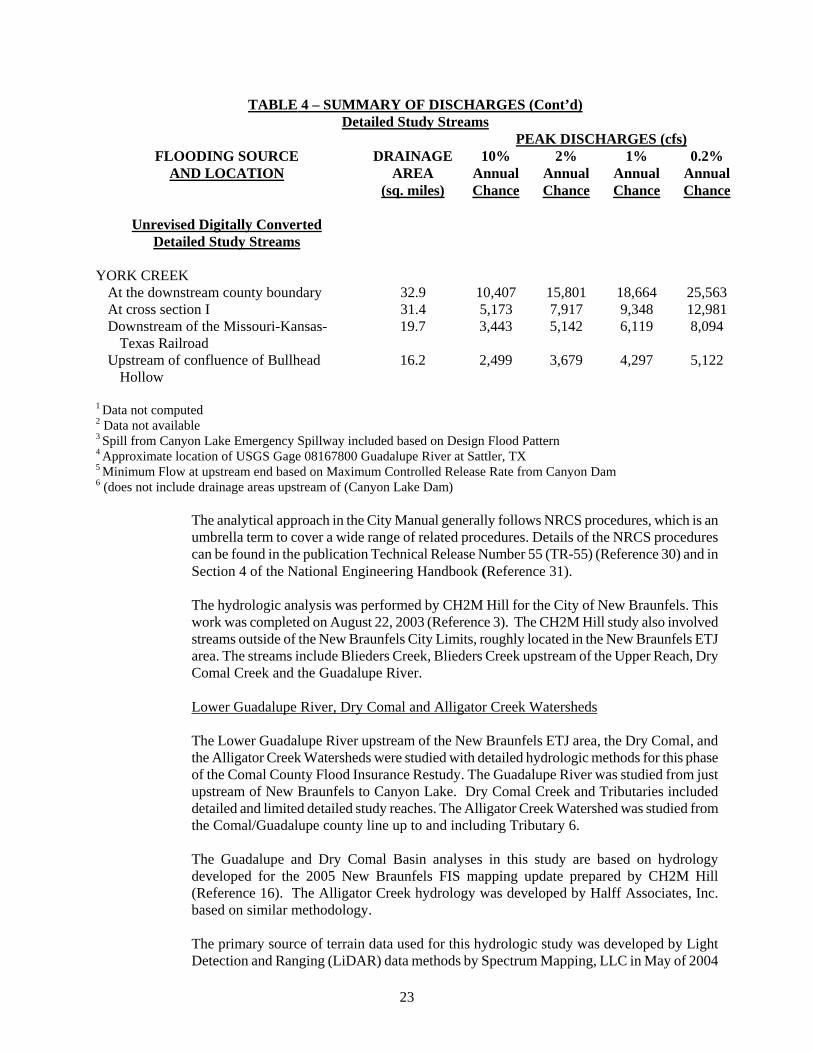
YORK CREEK At the downstream county boundary 32.9 10,407 15,801 18,664 25,563 At cross section I 31.4 5,173 7,917 9,348 12,981 Downstream of the Missouri-Kansas- Texas Railroad
19.7 3,443 5,142 6,119 8,094
Upstream of confluence of Bullhead Hollow
16.2 2,499 3,679 4,297 5,122
1 Data not computed 2 Data not available 3 Spill from Canyon Lake Emergency Spillway included based on Design Flood Pattern 4 Approximate location of USGS Gage 08167800 Guadalupe River at Sattler, TX
5 Minimum Flow at upstream end based on Maximum Controlled Release Rate from Canyon Dam 6 (does not include drainage areas upstream of (Canyon Lake Dam)
The analytical approach in the City Manual generally follows NRCS procedures, which is an umbrella term to cover a wide range of related procedures. Details of the NRCS procedures can be found in the publication Technical Release Number 55 (TR-55) (Reference 30) and in Section 4 of the National Engineering Handbook (Reference 31). The hydrologic analysis was performed by CH2M Hill for the City of New Braunfels. This work was completed on August 22, 2003 (Reference 3). The CH2M Hill study also involved streams outside of the New Braunfels City Limits, roughly located in the New Braunfels ETJ area. The streams include Blieders Creek, Blieders Creek upstream of the Upper Reach, Dry Comal Creek and the Guadalupe River. Lower Guadalupe River, Dry Comal and Alligator Creek Watersheds The Lower Guadalupe River upstream of the New Braunfels ETJ area, the Dry Comal, and the Alligator Creek Watersheds were studied with detailed hydrologic methods for this phase of the Comal County Flood Insurance Restudy. The Guadalupe River was studied from just upstream of New Braunfels to Canyon Lake. Dry Comal Creek and Tributaries included detailed and limited detailed study reaches. The Alligator Creek Watershed was studied from the Comal/Guadalupe county line up to and including Tributary 6. The Guadalupe and Dry Comal Basin analyses in this study are based on hydrology developed for the 2005 New Braunfels FIS mapping update prepared by CH2M Hill (Reference 16). The Alligator Creek hydrology was developed by Halff Associates, Inc. based on similar methodology. The primary source of terrain data used for this hydrologic study was developed by Light Detection and Ranging (LiDAR) data methods by Spectrum Mapping, LLC in May of 2004

24
(Reference 32). In addition, topography surveyed in 2002 by the City of New Braunfels was used for Alligator Creek (Reference 33). The USGS 30-meter National Elevation Dataset Digital Elevation Model (DEM) was used where the detailed topography was not available (Reference 34). Sub-basin delineation was performed in ArcMap GIS, utilizing the topography information described above. This Guadalupe Watershed consists of approximately 72.3 square miles of land below Canyon Lake and was divided into 36 sub-watersheds varying from approximately 0.1 to 14.5 square miles in size. The delineations were taken from the New Braunfels FIS Update hydrology model. The Dry Comal Watershed consists of approximately 77.5 square miles upstream of the railroad and was divided into 33 sub-watersheds varying from approximately 0.1 to 5.1 square miles in size. The delineations were based on the New Braunfels FIS Update hydrology model but the larger sub-basins were further subdivided to provide more accuracy. The Alligator Watershed consists of approximately 14.3 square miles upstream of the Comal/Guadalupe County line and was divided into 12 sub-watersheds varying from approximately 0.4 to 4.2 square miles in size. Rainfall totals for the frequency floods were obtained from the City of New Braunfels FIS Update, developed and calibrated in the Milestone II Report, prepared by CH2M Hill and dated May, 2003 (Reference 16). This hydrologic simulation used the HMS 24-hour storm distribution, which was considered appropriate for New Braunfels and the surrounding Guadalupe and Comal County areas in the New Braunfels Update study. It is customary in hydrologic studies to reduce the point total rainfall for areas as a function of drainage basin size. In the streams studied in detail for the Comal County flood mapping update, areal reduction factors were applied based on HMS default values. Soil information was obtained from the U.S. Department of Agriculture, NRCS State Soil Geographic database (STATSGO) for Texas, published in 1994. Hydrologic soil types C and D are the dominant soils found in the watershed (Reference 35). Runoff losses were computed using the NRCS Curve Number Method. Composite curve numbers were determined by overlaying GIS shape files of the land use polygons and STATSGO soil type polygons. These shape files were then intersected to create polygons consisting of specific land use and hydrologic soil group. These polygons were then weighted within their respective sub-basins to obtain a composite curve number. The NRCS Lag method was selected to compute the unit hydrographs. The sub-basin time of concentration was computed using the TR-55 Method (Reference 30), dividing the flow into 3 types:
Sheet flow- used TR-55 formula with a maximum length of 150 feet. Shallow Concentrated Flow- distance based on length from last identified stream
channel (USGS designation) minus the length used for sheet flow; velocities based on TR-55 equations for unpaved areas.
Channel Flow- distance based on length along actual stream channel; velocities based on velocity vs. channel slope relationship developed from computations for local streams in previous FIS and other studies.
Lag time for each subwatershed was computed as 60 percent of the time of concentration for the sub-basin.

25
The Modified Puls method was selected to route the hydrographs for all reaches studied in detail. Discharge-storage relationships were computed using the HEC-RAS models developed for hydraulics (Reference 36). The RAS models were generated using GeoRAS Version 8.1 and the Triangulated Irregular Network (TIN) developed specifically for this study from the available topography. Routing for stream reaches not studied in detail utilized the 8 point Muskingum Cunge method.
The 1 and 0.2 percent annual chance of exceedance (ACE) floods will discharge over the Canyon Dam Emergency Spillway into the Guadalupe River via a channel cut by the July 2002 flood event. The 1 and 0.2 percent ACE discharges are 14,000 cfs and 130,000 cfs respectively based on information supplied by the USACE, Fort Worth District Reservoir Operations Branch. In Comal County, the resulting routed hydrographs were used to define discharges downstream of the dam until a point where local runoff generated by the portion of the Guadalupe River watershed below Canyon Dam became greater. The 1 percent ACE spillway flows controlled for a distance of 2.6 miles and the 0.2 percent ACE spillway flows controlled for 13.9 miles or about 26,800 feet above the city limits of New Braunfels. Bracken Tributary, Garden Ridge Tributary Both Cibolo Creek Tributaries, the Bracken Tributary, and the Garden Ridge Tributary (the upper reach of the Garden Ridge Tributary is identified as Apple Run in the Garden Ridge FIS report, Reference 2), are part of the Bracken Tributary Watershed. The watershed was studied from the Bracken Tributary headwaters to its confluence with Cibolo Creek. The hydrologic rainfall\runoff model from the Hydrologic Engineering Center, HEC-HMS Version 2.2.2 (May, 2003) was used to estimate peak discharges for the watershed (Reference 37). The primary source of terrain data used for this hydrologic study was developed from the 2-foot interval topography that was created from TIN files obtained from the U.S. Army Corps of Engineers, which is being used for the current Cibolo Creek Restudy. To supplement the aerial mapping, a U.S. Geological Survey (USGS) 30-meter National Elevation Dataset DEM was used where the aerial topography was not available (Reference 34). Sub-basin delineation was performed in ArcMap GIS, utilizing the topography information described above. The combined watershed is approximately 5.58 square miles and was divided for this study into 13 sub-watersheds varying in size from .0289 to 0.867 square miles. Rainfall totals for the frequency floods were obtained from the previous City of New Braunfels’ FIS update, developed and calibrated in the Milestone II Report, prepared by CH2M Hill and dated May, 2003 (Reference 16). This hydrologic simulation uses the NRCS Type III 24-hour storm distribution, which is considered appropriate for New Braunfels and the surrounding Comal County area. A 24-hour duration hypothetical storm was used for the various frequency event simulations in HEC-HMS (Reference 37). For this hydrologic analysis, it was assumed that aerial reduction of point rainfall was not necessary for watersheds under 10 square miles. Therefore, aerial reduction factors were not used for the Bracken Tributary Watershed, which is 5.58 square miles in size.

26
Soil information, runoff losses, lag times and hydrograph routing were computed in a manner generally similar to the one used for the Lower Guadalupe River, Dry Comal and Alligator Creek Watersheds. Soil information and runoff losses were determined using STATSGO and the NRCS Curve Number Method. Hydrologic soil types B and D are the dominant soils in the Bracken Tributary Watershed. Land use was determined from the aerial Digital Orthophotos that were flown in 2003 by Tobin International (Reference 38). The land use data file was developed by digitizing land uses using the Digital Orthophotos in GIS. The NRCS Lag method was once again selected to compute the unit hydrographs. Sheet Flow computations used the TR-55 formula with a maximum of 125 feet in length and 20 minutes in time. Cibolo Creek The hydrologic analyses for Cibolo Creek are based on preliminary models prepared by the USACE Fort Worth District, in support of an ongoing Planning Study for the San Antonio River Authority, the Guadalupe Blanco River Authority and the San Antonio Water System. The USACE study was not complete at the time of this FIS report preparation and the hydrology modeling is subject to revision. The USACE modeling represents the best available data for this reach of Cibolo Creek at that time. It should be noted that discharges on Cibolo Creek increase with decreasing drainage area. This phenomenon is caused by a loss of water starting just below Boerne in Kendall County and continuing downstream to Interstate Highway 10. This area has outcrops of massive cavernous limestone of the Cretaceous Period. The water is, in effect, stored in caverns underground and never reaches downstream points as flood flows (Reference 5).
3.1.2 Unrevised (Digitally Converted) Detailed Study Streams
Guadalupe River (Upper Reach) Peak discharges for the Guadalupe River Upper Reach (above Canyon Lake) were not updated for this FIS revision; they were originally determined using the Log-Pearson Type III Method (Reference 39). Peak discharges for the Guadalupe River Lower Reach (below Canyon Lake) were revised using the USACE computer program HEC-HMS, as detailed in Section 3.1.1 above. These methods enabled taking into account the retention effects of Canyon Lake. Cibolo Tributaries Peak discharges for Cibolo Tributary, Indian Creek, Indian Creek Tributary A, and Indian Creek Tributary B were determined using USGS Water Resources Investigations 77-110 (Reference 40). Peak discharges for Postoak Creek were determined using discharge-frequency curves taken from the Texas State Department of Highways and Public Transportation's Hydraulic Manual (Reference 41). The Kelley Creek hydrology was revised as part of the 1995 Comal FIS first revision (Reference 1). Peak discharges for the selected recurrence intervals for Kelley Creek were

27
determined using the HEC-l computer model (Reference 42). The findings were presented in the report entitled "Hydrologic Analysis of the Cibolo Creek Watershed," Federal Emergency Management Agency, March 1992. Peak discharges for the selected recurrence intervals for Cibolo-Kelley Creek Overflow were determined using the split flow option of the HEC-2 computer model (Reference 43). On June 23, 1999, a Letter of Map Revision (LOMR) was issued by FEMA along an unnamed tributary to Cibolo Creek (Case Number 99-06-1314P). The LOMR reflected a detailed study along that reach and included an FIS flood profile plot, however no information on the hydrology was available in the text of the LOMR. All Other Un-revised Streams On February 22, 2002, a LOMR was issued by FEMA along Cypress Creek to reflect an existing hydrologic and hydraulic analysis for the Villarreal Flood Study (Case Number 01-06-949P). The LOMR indicated that a hydrologic and hydraulic analysis had been performed. The LOMR does not specify any hydrology methodology. On June 4, 2004, a LOMR was issued by FEMA along three streams, Upper Dry Comal Creek, Upper Dry Comal Creek Unnamed Tributary No. 1, and Upper Dry Comal Creek Unnamed Tributary No. 2 (Case Number 04-06-127P). The LOMR indicated that the basis of the LOMR request included a hydrologic analysis which included computation of 1-percent -annual-chance discharges. The LOMR does not specify any hydrology methodology. Peak discharges for all the other Comal County streams that are listed as Unrevised (Digitally Converted) Detailed Study Streams in “Table 1 – Scope of Study” were determined using the SCS TR-20 computer program (Reference 44). The results were compatible with the regional method derived from conducting a Log-Pearson Type III streamflow frequency analysis of gaging records in the surrounding area, and with a USGS statistical method used to determine discharges in several regions of Texas (Reference 45). Pool elevations for the 10-, 2-, 1-, and 0.2-percent-annual-chance floods of Canyon Lake Reservoir were determined by the USACE, which is responsible for regulating the reservoir and dam (Reference 46). A summary of peak elevation-frequency relationships for Canyon Lake Reservoir is shown on Table 5, "Summary of Reservoir Stillwater Elevations."
TABLE 5 - SUMMARY OF RESERVOIR STILLWATER ELEVATIONS ELEVATION IN FEET (NAVD 88)
FLOODING SOURCE AND LOCATION
10% Annual Chance
2% Annual Chance
1% Annual Chance
0.2% Annual Chance
CANYON LAKE Entire Shoreline within the County 924.0 940.0 946.0 949.7

28
3.1.3 Redelineated Detailed Study Streams Lewis Creek was redelineated using the existing FIS profile. This method does not involve generating any hydrology or hydraulic data. The hydrologic analysis used for the detailed study area of Lewis Creek is not available.
3.1.4 Enhanced Approximate Study Streams Streams studied by Enhanced Approximate Methods Type II, also referred to as Limited Detail Studies (LDS), were analyzed using the same methods as the New/Revised Detailed Study Streams described in Section 3.1.1. In the case of the West Fork of Dry Comal Creek and Upper Dry Comal Creek, the starting water surface elevations were based on rating curves established for the large detention structures on each stream. For each stream, the detention structure's rating curve was entered into the steady flow file as the downstream boundary condition, and the peak discharge for the structure, as calculated in the hydrology model, was input as a flow change at the downstream section.
3.2 Hydraulic Analyses
Analyses of the hydraulic characteristics of flooding from the sources studied were carried out to provide estimates of the elevations of floods of the selected recurrence intervals. Users should be aware that flood elevations shown on the FIRM represent rounded whole-foot elevations and may not exactly reflect the elevations shown on the Flood Profiles or in the Floodway Data tables in the FIS report. Flood elevations shown on the FIRM are primarily intended for flood insurance rating purposes. For construction and/or floodplain management purposes, users are cautioned to use the flood elevation data presented in this FIS in conjunction with the data shown on the FIRM. Locations of selected cross sections used in the hydraulic analyses are shown on the Flood Profiles (Exhibit 1). For stream segments for which a floodway was computed (Section 4.2), selected cross-section locations are also shown on the FIRM (Exhibit 2). The channel and overbank "n" values for the streams studied by detailed methods are shown in Table 6, Summary of Roughness Coefficients. The hydraulic analyses for this study were based on unobstructed flow. The flood elevations shown on the Flood Profiles (Exhibit 1) are thus considered valid only if hydraulic structures remain unobstructed, operate properly, and do not fail.
For the streams studied by non-enhanced approximate methods and listed in Section 2.1, only the 1-percent-annual-chance flood elevations were determined. The flows used in the approximate studies were computed by taking the higher results of either the USGS Regional Regression Equation (Reference 45) or a cubic-feet-per-second-per-square-mile (CSM) relationship generated for selected streams in Comal County. Geo-RAS was used to generate cross-sections that were imported into RAS. The centerline for each stream was based on the best available topo and the n-values were determined using aerial photos. The boundary conditions for each Zone A model used the slope/area method.

29
TABLE 6 – SUMMARY OF ROUGHNESS COEFFICIENTS
Stream Reaches Studied by Detailed Methods
Stream Name Channel “n” Value Overbank “n” Value
New/Revised Detailed Study Streams
Alligator Creek 0.040 – 0.050 0.040 – 0.100 Alligator Tributary No. 6 0.035 – 0.070 0.040 – 0.100 Bear Creek 0.040 – 0.140 0.035 – 0.140 Bracken Tributary 0.035 – 0.050 0.055 – 0.100 Cibolo Creek 0.040 – 0.065 0.060 – 0.090 Comal River/Dry Comal Creek in New Braunfels
0.045 0.065 – 0.150
Dry Comal Creek (ETJ area) --1 --1 Dry Comal Creek 0.025 – 0.140 0.025 – 0.140 Comal Springs/Blieders Creek in New Braunfels
0.050 – 0.080 0.060 – 0.090
Blieders Creek (ETJ area) --1 --1 Blieders Creek (Upper Reach) 0.040 – 0.090 0.060 – 0.090 Blieders Creek (ETJ above Upper Reach)
--1 --1
Garden Ridge Tributary 0.020 – 0.070 0.045 – 0.100 Guadalupe River in New Braunfels 0.035 – 0.040 0.060 – 0.110 Guadalupe River in ETJ area --1 --1 Guadalupe River from ETJ limits to Canyon Lake Dam
--1 --1
New Channel Comal River --1 --1 North Guadalupe Tributary 0.030 – 0.070 0.060 – 0.110 Old Channel Comal River 0.050 – 0.080 0.060 – 0.090 South Guadalupe Tributary 0.030 – 0.070 0.060 – 0.075 Upper Dry Comal Creek 0.045 – 0.140 0.045 – 0.140 West Fork Dry Comal Creek 0.045 – 0.140 0.040 – 0.140
Redelineation
Detailed Study Streams
Lewis Creek --1 --1
Unrevised Digitally Converted Detailed Study Streams
Cibolo-Kelley Creek Overflow 0.055 - 0.075 0.075 - 0.105 Cibolo Tributary 0.040 – 0.050 0.060 – 0.110

30
TABLE 6 – SUMMARY OF ROUGHNESS COEFFICIENTS (Cont’d) Stream Reaches Studied by Detailed Methods
Stream Name Channel “n” Value Overbank “n” Value
New/Revised
Detailed Study Streams
Cypress Creek --1 --1 Elm Creek 0.045 – 0.066 0.060 – 0.110 Guadalupe River (Upper Reach) 0.042 – 0.063 0.068 – 0.126 Indian Creek 0.048 – 0.060 0.066 – 0.130 Indian Creek Tributary A 0.060 0.130 Indian Creek Tributary B 0.058 0.090 Kelley Creek 0.045 – 0.075 0.070 – 0.095 Postoak Creek 0.042 – 0.066 0.054 – 0.132 Rebecca Creek 0.045 – 0.066 0.060 – 0.110 Sattler Tributary 0.040 – 0.060 0.060 – 0.110 Unnamed Tributary to Cibolo Creek --1 --1 Unnamed Tributary No. 1 to Upper Dry Comal Creek
--1 --1
Unnamed Tributary No. 2 to Upper Dry Comal Creek
--1 --1
Upper Dry Comal Creek (LOMR) --1 --1 West Fork Tributary 0.052 – 0.085 0.080 – 0.098 York Creek 0.050 – 0.060 0.075 – 0.110 1 Data not available
3.2.1 New/Revised Detailed Study Streams
New Braunfels The streams that were revised in the 2005 New Braunfels FIS Update include Comal Springs, Blieders Creek, Blieders Creek (Upper Reach), the Comal River, Dry Comal Creek in New Braunfels, the Guadalupe River (Lower Reach) in New Braunfels, the New Channel Comal River, the North Guadalupe Tributary, the Old Channel Comal River, and the South Guadalupe Tributary. The backwater analyses stream and valley cross sections were derived from 2-foot contour topographic maps (Reference 33) using GIS techniques. In the case of the studied streams that are dry during normal conditions (all streams included in this FIS report, except the Comal River and Guadalupe River), the channel centerline was used to determine channel inverts. For the Guadalupe and Comal Rivers, the Guadalupe-Blanco River Authority (GBRA) developed underwater cross sections at representative locations coinciding with stream and valley cross sections derived from the topographic maps. Underwater geometry along the Guadalupe and Comal Rivers was developed using data from both the May 15,

31
1991 FIS report, and interpolating between the underwater surveys completed for this revision. Additionally, channel geometry at surveyed road crossings was applied to adjacent stream and valley sections for all studied streams. For all streams revised in this FIS report, the Texas Department of Transportation (TXDOT) as-built drawings were used to obtain data on existing river crossing structures. Field surveys were performed to verify the hydraulic data for each of the low water crossings, bridges, culverts and other hydraulic restrictions that were not available through TXDOT. In the case of the flood-retarding dams and reservoirs included in this FIS report, rating tables and associated drawings were used as the source for hydrology modeling data. The USACE HEC-RAS (Reference 47) computer program was used for the hydraulic analysis of all streams revised in this FIS report. In many instances, peak discharges from the different flooding sources analyzed in this FIS report occurred at distinct times. Downstream boundary conditions and water surface elevations (WSELs) were determined as follows:
Along the Guadalupe River, starting WSELs were interpolated from Dunlap Dam stage versus discharge tables (provided by GBRA) based on the Dunlap Dam spillway flow rate corresponding to each storm event.
The Blieders Creek model extends from its headwaters downstream through Comal Springs at Landa Lake and ends at a diversion where the channel splits between the New Channel and Old Channel Comal River. A known WSEL was assigned to each storm based on the influence the upstream end of the New Channel Comal River has on the downstream end of Blieders Creek at the Landa Park diversion. The upstream end of Old Channel Comal River is an earthen weir; the weir does not influence the downstream WSEL on Blieders Creek.
Along the Old Channel Comal River and New Channel Comal River, normal depth
slopes were used in both models for hydraulic computations, and a backwater due to the Comal River below the confluence with Dry Comal Creek were manually entered for each storm, for floodplain mapping purposes.
A normal depth was used in the Comal River model (including Dry Comal Creek) as
the downstream boundary condition. The Guadalupe River peak stage was plotted as a backwater up the Comal River until it crossed the peak WSEL on the Comal River on the floodplain maps.
The initial downstream boundary conditions for North Guadalupe Tributary were set
as a constant slope for normal depth computations. The peak WSEL for each storm at the confluence with the Guadalupe River was shown as a backwater effect to the point the WSEL for the North Tributary exceeded the backwater elevation.
Because the North and South Guadalupe Tributaries peak flows almost coincide
with one another, a known WSEL for each storm on the North Guadalupe Tributary at the confluence with the South Guadalupe Tributary was entered into the South Guadalupe Tributary model as a downstream boundary condition. The Guadalupe backwater slightly influenced the most downstream end of the South Guadalupe Tributary floodplain.
There are three locations along the North and South Guadalupe Tributaries where the 1-percent-annual-chance floodwaters spill out of the defined channel in an indeterminate

32
manner. These locations are on the North Guadalupe Tributary between FM 725 and McQueeney Road, and on the South Guadalupe Tributary upstream of McQueeney Road and downstream of FM 725. The 1-percent-annual-chance WSEL exceeds the top of berm elevation of the channels by 0.21 to 0.75 feet at these isolated locations. Because the 1-percent-annual-chance flows get out of the channel by such a small amount, it was assumed that the floodplain beyond the channel in these areas will not be inundated sufficiently to warrant designation as floodplain. These areas were identified as areas of potential shallow flooding. Channel roughness coefficients (Manning’s “n” values) used in the hydraulic computations were chosen based on standard references, engineering judgment, aerial photographs, and field observations of the streams and floodplain areas. The primary reference for assigning values was Chow (Reference 48), and New Braunfels staff collaborated with CH2M Hill to determine how to apply Chow’s values to New Braunfels (Reference 3).
Countywide Study. As listed in Table 1 – Scope of Study, the following streams were revised or created for the purpose of the countywide FIS study: Alligator Creek, Alligator Creek Tributary No. 6, Bear Creek (Dry Comal Watershed), Bracken Tributary, Dry Comal Creek (starting approximately 10.2 miles upstream of its confluence with the Comal River), Garden Ridge Tributary, the Guadalupe River Lower Reach from the New Braunfels ETJ limits to Canyon Lake Dam, Upper Dry Comal Creek and the West Fork of Dry Comal Creek. The revised reach of the Guadalupe River begins at its headwaters at the outlet of Canyon Lake dam and ends fourteen and a half stream miles downstream, at the Guadalupe Unnamed Tributary 11 confluence. The downstream limit corresponds to the study limits of the CH2M Hill (City of New Braunfels 2005 FIS Update) model, about 10,000 feet upstream of the actual New Braunfels ETJ limits. For comparison purposes, the study reach is referred to as the Guadalupe River (Lower Reach) from the New Braunfels ETJ limits to Canyon Lake Dam. The USACE’s River Analysis System (HEC-RAS), Version 3.1.2 (Reference 36), was used to compute the water surface profiles and floodways of the study streams. One of the sources of terrain data was LiDAR data prepared by Spectrum Mapping LLC and acquired on February 17, 2004 (Reference 32). The data is referenced to the North American Vertical Datum of 1988 (NAVD88). Quality control of the resulting bare earth LiDAR data was performed by Spectrum Mapping and independently verified by Watershed Concepts. The LiDAR data was used to generate topographic information in the upstream reach of Alligator Tributary 6, the Guadalupe River revised reach, Bear Creek (Dry Comal Watershed), the revised reach of Dry Comal Creek, Upper Dry Comal Creek, and the West Fork of Dry Comal Creek. The terrain data used for the hydraulic studies of Bracken and Garden Ridge Tributaries was developed from 2-foot interval topography that was created from the TIN files obtained from the USACE, which was used for the USACE Cibolo Creek study. The USACE’s TIN, outside the Cibolo Creek’s 0.2-percent-annual-chance floodplain, was developed from 5-foot contour interval topographic mapping, created using traditional photogrammetric compilation from aerial photography. The topography was flown in 2002 and is based on the North American Datum of 1983 and NAVD88.

33
Additional sources of topographic data for the study area included 2-foot contour data provided by the City of New Braunfels and standard USGS quadrangle contours. The 2-foot contour data was derived from orthophotography that was flown in 2001 as part of a FIS restudy prepared for the City by CH2M Hill (Reference 33). The CH2M Hill topographic information was used in the downstream reach of Alligator Tributary No. 6 and along the entire Alligator Creek study reach as well as Bear Creek (Dry Comal Watershed), the revised reach of Dry Comal Creek, Upper Dry Comal Creek and the West Fork of Dry Comal Creek. USGS quadrangle hypsography was obtained from the Texas Natural Resources Information System (TNRIS) website (Reference 34). The primary terrain data was supplemented with field surveyed intermediate cross-section and structure data, based on field surveys conducted from November 2003 to May 2004. The cross sections were supplemented by underwater surveyed elevation shots as appropriate. In addition, interpolated cross sections were inserted in the model in order to better represent transitions in ground geometry. The USACE HEC GeoRAS software package (Version 8.1) was used to extract channel and overbank cross-section data from the study TIN's and to map floodplains according to the results of the hydraulic studies. Manning’s “n” values (or roughness coefficients) were assigned by visual inspection and analysis of aerial and field photographs. The water surface elevation profiles for the various frequency storms, the 10-, 2-, 1-, and 0.2-percent-annual-chance of exceedance floods for the studied streams, were computed using the USACE HEC-RAS program Version 3.1.2. Starting boundary conditions for most of the streams were computed using the normal depth (slope-area) method, except in the case of the Guadalupe River where the starting boundary condition was taken from the CH2MHill New Braunfels FIS restudy HEC-RAS model. Cibolo Creek The hydraulic analyses for Cibolo Creek are based on preliminary models prepared by the USACE Fort Worth District, in support of an ongoing Planning Study for the San Antonio River Authority, the Guadalupe Blanco River Authority and the San Antonio Water System. The USACE study was not complete at the time of this FIS report preparation and the hydraulics modeling is subject to revision. The USACE modeling represents the best available data for this reach of Cibolo Creek at that time.
3.2.2 Unrevised (Digitally Converted) Detailed Study Streams The hydraulic analyses for Kelley Creek and the Cibolo-Kelley Creek Overflow were updated for the 1995 Comal FIS first revision (Reference 1) using the HEC-2 computer program (Reference 43). Cross sections for the backwater analyses were obtained from field surveys, highway plans, and aerial photographs. Channel roughness factors (Manning's "n") used in the hydraulic computations were chosen by engineering judgment and based on field observations of the stream and floodplain areas. BFE's were added along Cibolo-Kelley Creek Overflow and along Kelley Creek from its confluence with Cibolo Creek to 8,510 feet upstream, resulting in revised floodplain boundaries.

34
Overbank cross-section data for the backwater analyses of all other unrevised (digitally converted) detailed study streams were obtained using topographic maps compiled from aerial photographs (Reference 49). Channel geometry was determined from field surveys. All bridges, dams, and culverts were field checked to obtain elevation data and structural geometry. Water-surface elevations of floods of the selected recurrence intervals were computed using the USACE HEC-2 step-backwater computer program (Reference 43). Flood profiles were drawn showing computed water-surface elevations for floods of the selected recurrence intervals. Starting water-surface elevations for Rebecca Creek and the Guadalupe River (Upper Reach) were determined using 10-, 2-, 1-, and 0.2-percent-annual-chance pool tables of Canyon Lake Reservoir (Reference 46). Starting water-surface elevations for South Guadalupe Tributary were determined assuming coincident peak flows with North Guadalupe Tributary. Starting water-surface elevations for all other streams studied by detailed methods were determined by the slope/area method. The hydraulic analyses used for the water-surface elevation determination of Lewis Creek were taken from the original Flood Insurance Study for Comal County (Reference 50). Channel roughness factors (Manning's "n") used in the hydraulic computations were chosen by engineering judgment and based on field observations of the streams and floodplain areas. On June 23, 1999, a LOMR was issued by FEMA along an unnamed tributary to Cibolo Creek (Case Number 99-06-1314P). The LOMR reflects a detailed study along that reach and includes an FIS flood profile plot, however no information on the hydraulics methodology is available in the text of the LOMR. A profile is included in the countywide FIS and the FIRM (Exhibit 2) reflects the LOMR mapping. On February 22, 2002, a LOMR was issued by FEMA along Cypress Creek to reflect an existing hydrologic and hydraulic analysis for the Villarreal Flood Study (Case Number 01-06-949P). The LOMR indicates that a hydrologic and hydraulic analysis has been performed. The LOMR does not specify any hydraulics methodology. A profile is included in the countywide FIS and the FIRM (Exhibit 2) reflects the LOMR mapping. On June 4, 2004, a LOMR was issued by FEMA along 3 streams, Upper Dry Comal Creek, Upper Dry Comal Creek Unnamed Tributary No. 1, and Upper Dry Comal Creek Unnamed Tributary No. 2 (Case Number 04-06-127P). The LOMR indicates that the basis of the LOMR request includes a hydraulics analysis which included computation of 1-percent- annual-chance discharges. The LOMR does not specify any hydraulics methodology. A profile is included in the countywide FIS and the FIRM (Exhibit 2) reflects the LOMR mapping. Water-surface elevations were initially computed through the use of computer programs. Table 7, “Hydraulic Methods” includes a listing of the specific version of the programs used, as well as the starting water surface method used in the profile computations.
3.2.3 Redelineated Detailed Study Streams The detailed study reach of Lewis Creek was mapped using the prior effective FIS flood profile. A table was produced that recorded station and water surface elevation at inflection

35
points along the 1- and 0.2-percent-annual-chance profile lines, at limits of study, and any other location that assisted in creating the floodplains. An attempt was made to also incorporate road crossing locations based on the prior effective FEMA profile, however, it appears that road crossings are shown incorrectly on the Lewis Creek profile, they were therefore ignored (the effective FIS profile does not show any structures at the road crossings). Typical hydraulic mapping cross sections were placed to correspond to the stations from this table with consideration given to BFE locations. The cross sections were attributed with the water surface elevation matching the station from the created table.
3.2.4 Enhanced Approximate Study Streams
Streams listed on Table 1, Scope of Study, as having been studied by enhanced approximate methods type II (also referred to as Limited Detailed Studies) were analyzed using the same general methods as the New/Revised Detailed Study Streams described in Section 3.2.1, except that culvert and bridge survey data was generated by combining a top of road survey point with field sketches and structure measurements. The streams were modeled using HEC-RAS 3.1.2. The Dry Comal Creek Tributary No. 13 downstream starting conditions were computed using the slope area method. In the case of the West Fork of Dry Comal Creek and Upper Dry Comal Creek, the rating curve for the SCS dams was taken from the hydrology model and used to determine the starting water surface elevations. For streams studied using enhanced approximate methods, only the 1-percent-annual-chance flood was computed. No flood profiles are provided. The Manning’s “n” values were based on aerial photography.
TABLE 7 – HYDRAULIC METHODS Stream Reaches Studied by Detailed Methods
Stream Name Starting Water-Surface
Elevations Hydraulic Program
New/Revised Detailed Study Streams
Alligator Creek Slope area method HEC-RAS v 3.1.2 (Reference 36) Alligator Tributary No. 6 Slope area method HEC-RAS v 3.1.2 (Reference 36) Bear Creek Slope area method HEC-RAS v 3.1.2 (Reference 36) Bracken Tributary Slope area method HEC-RAS v 3.1.2 (Reference 36) Cibolo Creek Slope area method HEC-RAS v 3.1.2 (Reference 36) Comal River/Dry Comal Creek in New Braunfels
Slope area method HEC-RAS v 3.0.1 (Reference 47)
Dry Comal Creek (ETJ area) Part of Comal River model HEC-RAS v 3.0.1 (Reference 47) Dry Comal Creek Slope area method HEC-RAS v 3.1.2 (Reference 36)

36
TABLE 7 – HYDRAULIC METHODS (Cont’d) Stream Reaches Studied by Detailed Methods
Stream Name Starting Water-Surface
Elevations Hydraulic Program
New/Revised Detailed Study Streams
Comal Springs/Blieders Creek in New Braunfels
Known WSEL from New Channel Comal River
HEC-RAS v 3.0.1 (Reference 47)
Blieders Creek (ETJ area) Part of Blieders Creek model HEC-RAS v 3.0.1 (Reference 47) Blieders Creek (Upper Reach) Part of Blieders Creek model HEC-RAS v 3.0.1 (Reference 47) Blieders Creek (ETJ above Upper Reach)
Part of Blieders Creek model HEC-RAS v 3.0.1 (Reference 47)
Garden Ridge Tributary Slope area method HEC-RAS v 3.1.2 (Reference 36) Guadalupe River in New Braunfels Dunlap Dam stage versus
discharges tables HEC-RAS v 3.0.1 (Reference 47)
Guadalupe River in ETJ area Part of Guadalupe River model
HEC-RAS v 3.0.1 (Reference 47)
Guadalupe River from ETJ limits to Canyon Lake Dam
Slope area method HEC-RAS v 3.1.2 (Reference 36)
New Channel Comal River Slope area method HEC-RAS v 3.0.1 (Reference 47) North Guadalupe Tributary Slope area method HEC-RAS v 3.0.1 (Reference 47) Old Channel Comal River Slope area method HEC-RAS v 3.0.1 (Reference 47) South Guadalupe Tributary Known WSEL from North
Guadalupe Tributary HEC-RAS v 3.0.1 (Reference 47)
Upper Dry Comal Creek Slope area method HEC-RAS v 3.1.2 (Reference 36) West Fork Dry Comal Creek Slope area method HEC-RAS v 3.1.2 (Reference 36)
Redelineation Detailed Study Streams
Lewis Creek Older Comal County FIS
(Reference 50) Older Comal County FIS
(Reference 50) Cibolo-Kelley Creek Overflow --1 HEC-2 split flow (Reference 43) Cibolo Tributary Slope area method HEC-2 (Reference 43) Cypress Creek --1 --1 Elm Creek Slope area method HEC-2 (Reference 43) Guadalupe River (Upper Reach) Canyon Lake Reservoir
elevation (Reference 1) HEC-2 (Reference 43)
Indian Creek Slope area method HEC-2 (Reference 43) Indian Creek Tributary A Slope area method HEC-2 (Reference 43) Indian Creek Tributary B Slope area method HEC-2 (Reference 43) Kelley Creek --1 HEC-2 (Reference 43)

37
TABLE 7 – HYDRAULIC METHODS (Cont’d) Stream Reaches Studied by Detailed Methods
Stream Name Starting Water-Surface
Elevations Hydraulic Program
Unrevised Digitally Converted Detailed Study Streams
Postoak Creek Slope area method HEC-2 (Reference 43) Rebecca Creek Canyon Lake Reservoir
elevation (Reference 1) HEC-2 (Reference 43)
Sattler Tributary Slope area method HEC-2 (Reference 43) Unnamed Tributary to Cibolo Creek --1 --1 Unnamed Tributary No. 1 to Upper Dry Comal Creek
--1 --1
Unnamed Tributary No. 2 to Upper Dry Comal Creek
--1 --1
Upper Dry Comal Creek (LOMR Area)
--1 --1
West Fork Tributary Slope area method HEC-2 (Reference 43) York Creek Slope area method HEC-2 (Reference 43) 1 Data not available
3.3 Vertical Datum All FIS reports and FIRMs are referenced to a specific vertical datum. The vertical datum provides a starting point against which flood, ground, and structure elevations can be referenced and compared. Until recently, the standard vertical datum used for newly created or revised FIS reports and FIRMs was the National Geodetic Vertical Datum of 1929 (NGVD). With the completion of the North American Vertical Datum of 1988 (NAVD 88), many FIS reports and FIRMs are now prepared using NAVD as the referenced vertical datum. The datum conversion factor from NGVD29 to NAVD88 in Comal County is +0.3 feet. Flood elevations shown in this FIS report and on the FIRM are referenced to the NAVD 88 datum. These flood elevations must be compared to structure and ground elevations referenced to the same vertical datum. For information regarding conversion between the NGVD and NAVD, visit the National Geodetic Survey website at www.ngs.noaa.gov, or contact the National Geodetic Survey at the following address:
Vertical Network Branch, N/CG13 National Geodetic Survey, NOAA Silver Spring Metro Center 3 1315 East-West Highway Silver Spring, Maryland 20910 (301) 713-3191

38
Temporary vertical monuments are often established during the preparation of a flood hazard analysis for the purpose of establishing local vertical control. Although these monuments are not shown on the FIRM, they may be found in the Technical Support Data Notebook associated with the FIS report and FIRM for this community. Interested individuals may contact FEMA to access these data. To obtain current elevation, description, and/or location information for benchmarks shown on this map, please contact the Information Services Branch of the NGS at (301) 713-3242, or visit their website at www.ngs.noaa.gov.
4.0 FLOODPLAIN MANAGEMENT APPLICATIONS The NFIP encourages State and local governments to adopt sound floodplain management programs. To assist in this endeavor, each FIS report provides 1-percent-annual-chance floodplain data, which may include a combination of the following: 10-, 2-, 1-, and 0.2-percent-annual-chance flood elevations; delineations of the 1- and 0.2-percent-annual-chance floodplains; and a 1-percent-annual-chance floodway. This information is presented on the FIRM and in many components of the FIS report, including Flood Profiles, Floodway Data tables, and Summary of Stillwater Elevation tables. Users should reference the data presented in the FIS report as well as additional information that may be available at the local community map repository before making flood elevation and/or floodplain boundary determinations. 4.1 Floodplain Boundaries
To provide a national standard without regional discrimination, the 1-percent-annual-chance flood has been adopted by FEMA as the base flood for floodplain management purposes. The 0.2-percent-annual-chance flood is employed to indicate additional areas of flood risk in the community. For each stream studied by detailed methods, the 1- and 0.2-percent-annual -chance floodplain boundaries have been delineated using the flood elevations determined at each cross section. Between cross sections, the boundaries were interpolated using topographic maps. Table 8, “Topographic Mapping”, lists the topographic maps used to delineate the floodplain boundaries for each community’s previously printed FIS as well as the revised floodplain mapping for this countywide FIS. The 1- and 0.2-percent-annual-chance floodplain boundaries are shown on the FIRM. On this map, the 1-percent-annual-chance floodplain boundary corresponds to the boundary of the areas of special flood hazards (Zones A, AE, and AO), and the 0.2-percent-annual-chance floodplain boundary corresponds to the boundary of areas of moderate flood hazards. In cases where the 1- and 0.2-percent-annual-chance floodplain boundaries are close together, only the 1-percent-annual-chance floodplain boundary has been shown. Small areas within the floodplain boundaries may lie above the flood elevations, but cannot be shown due to limitations of the map scale and/or lack of detailed topographic data. For the streams studied by approximate methods, only the 1-percent-annual-chance floodplain boundary is shown on the FIRM.

39
TABLE 8 – TOPOGRAPHIC MAPPING
Community and Topographic Mapping Source Scale
Contour Interval Reference
Comal County Unincorporated Areas USACE Cibolo Creek topo (TIN) n/a 2 feet / 5 feet --- USGS 7.5-Minute Quads – 30 Meter DEMs
1:24,000 10 feet Reference 34
USGS 7.5-Minute Quads – 30 Meter DEMs
1:24,000 20 feet Reference 34
New Braunfels FIS topo 1:6,000 2 feet Reference 33 Spectrum LiDAR n/a 2 feet Reference 32
City of Bulverde USACE Cibolo Creek topo (TIN) n/a 2 feet / 5 feet --- USGS 7.5-Minute Quads – 30 Meter DEMs
1:24,000 20 feet Reference 34
City of Fair Oaks Ranch USACE Cibolo Creek topo (TIN) n/a 2 feet / 5 feet --- City of Garden Ridge USGS 7.5-Minute Quads – 30 Meter DEMs
1:24,000 20 feet Reference 33
Spectrum LiDAR n/a 2 feet Reference 32 USACE Cibolo Creek topo (TIN) n/a 2 feet / 5 feet --- City of New Braunfels USGS 7.5-Minute Quads – 30 Meter DEMs
1:24,000 20 feet Reference 33
New Braunfels FIS topo 1:6,000 2 feet Reference 33 Spectrum LiDAR n/a 2 feet Reference 32 City of Schertz USACE Cibolo Creek topo (TIN) n/a 2 feet / 5 feet --- USGS 7.5-Minute Quads – 30 Meter DEMs
1:24,000 10 feet Reference 34
USGS 7.5-Minute Quads – 30 Meter DEMs
1:24,000 20 feet Reference 34
New Braunfels FIS topo 1:6,000 2 feet Reference 33 City of Selma USACE Cibolo Creek topo (TIN) n/a 2 feet / 5 feet ---

4.2 Floodways Encroachment on floodplains, such as structures and fill, reduces flood-carrying capacity, increases flood heights and velocities, and increases flood hazards in areas beyond the encroachment itself. One aspect of floodplain management involves balancing the economic gain from floodplain development against the resulting increase in flood hazard. For purposes of the NFIP, a floodway is used as a tool to assist local communities in this aspect of floodplain management. Under this concept, the area of the 1-percent-annual-chance floodplain is divided into a floodway and a floodway fringe. The floodway is the channel of a stream, plus any adjacent floodplain areas, that must be kept free of encroachment so that the base flood can be carried without substantial increases in flood heights. Minimum Federal standards limit such increases to 1 foot, provided that hazardous velocities are not produced. The floodways in this study are presented to local agencies as minimum standards that can be adopted directly or that can be used as a basis for additional floodway studies.
The floodways presented in this study were computed for certain stream segments on the basis of equal-conveyance reduction from each side of the floodplain. Floodway widths were computed at cross sections. Between cross sections, the floodway boundaries were interpolated. The results of the floodway computations are tabulated for selected cross sections (see Table 9, Floodway Data). In cases where the floodway and 1-percent-annual -chance floodplain boundaries are either close together or collinear, only the floodway boundary is shown.
The area between the floodway and 1-percent-annual-chance floodplain boundaries is termed the floodway fringe. The floodway fringe encompasses the portion of the floodplain that could be completely obstructed without increasing the WSEL of the base flood more than 1 foot at any point. Typical relationships between the floodway and the floodway fringe and their significance to floodplain development are shown in Figure 1.
Figure 1. Floodway Schematic
40

41
No floodways were computed for Lewis Creek or Postoak Creek. None were shown in the original Flood Insurance Study of Comal County (Unincorporated Areas). No Postoak Creek floodway is shown for the City of Fair Oaks Ranch in the Bexar County FIS.

CROSS SECTION DISTANCE 1WIDTH (FEET)
SECTION AREA
(SQUARE FEET)
MEAN VELOCITY (FEET PER SECOND)
REGULATORY WITHOUT FLOODWAY
WITH FLOODWAY
INCREASE
Alligator CreekA 30,085 695 5,341 4.2 642.7 642.7 643.7 1.0B 31,367 871 5,576 4.1 644.4 644.4 645.2 0.8 C 33,330 890 5,142 4.4 647.7 647.7 648.2 0.5D 34,553 857 4,145 5.2 649.2 649.2 649.7 0.5E 36,098 605 3,688 5.9 651.9 651.9 652.7 0.8F 37,611 706 4,412 4.9 655.3 655.3 655.8 0.5G 39,544 581 3,128 6.7 657.7 657.7 658.3 0.6H 40,999 626 2,737 7.6 661.4 661.4 662.0 0.6I 42,478 830 6,067 3.4 664.2 664.2 665.1 0.9J 44,584 990 7,910 2.6 670.4 670.4 671.4 1.0K 46,185 841 5,153 3.9 672.8 672.8 673.6 0.8L 48,114 605 3,481 5.8 675.6 675.6 676.3 0.7M 49,968 458 3,468 5.8 680.8 680.8 681.4 0.6N 50,300 614 4,637 4.3 682.0 682.0 682.3 0.3O 51,663 627 4,268 4.7 684.7 684.7 685.2 0.5P 53,589 464 2,927 6.9 688.6 688.6 688.7 0.1Q 55,585 400 3,101 6.5 695.8 695.8 696.8 1.0R 57,395 633 3,721 5.4 699.8 699.8 700.6 0.8S 58,886 213 2,430 8.4 706.5 706.5 706.5 0.0T 59,780 1,009 13,654 1.4 711.3 711.3 711.3 0.0U 61,004 403 4,172 4.7 711.5 711.5 711.7 0.2V 62,243 392 3,300 6.0 712.5 712.5 713.4 0.9W 63,585 598 4,627 4.3 716.9 716.9 717.7 0.8
1 Feet Above Confluence With Geronimo Creek
FLOODING SOURCE FLOODWAYBASE FLOOD
WATER SURFACE ELEVATION
TA
BL
E 9
FEDERAL EMERGENCY MANAGEMENT AGENCYCOMAL COUNTY, TEXAS
AND INCORPORATED AREAS
FLOODWAY DATA
ALLIGATOR CREEK
FEET (NAVD 88, 2001 Adjustment) FEET (NAVD 88, 2001 Adjustment) FEET (NAVD 88)

CROSS SECTION DISTANCE WIDTH (FEET)
SECTION AREA
(SQUARE FEET)
MEAN VELOCITY (FEET PER SECOND)
REGULATORY WITHOUT FLOODWAY
WITH FLOODWAY
INCREASE
Alligator CreekTributary No. 6
A 412 1 412 773 5.6 716.5 714.5 3 714.5 0.0 B 1,773 1 268 1,006 4.3 723.3 723.3 723.4 0.1C 3,002 1 348 1,145 3.8 731.5 731.5 731.5 0.0D 5,127 1 323 695 2.7 746.9 746.9 746.9 0.0E 6,150 1 211 585 3.2 754.8 754.8 754.9 0.1F 7,483 1 108 391 4.7 765.1 765.1 765.2 0.1G 8,921 1 224 477 3.9 776.1 776.1 776.1 0.0H 9,810 1 120 382 4.8 782.3 782.3 783.1 0.8I 10,950 1 97 336 5.5 789.1 789.1 789.5 0.4J 11,912 1 136 323 5.7 795.5 795.5 795.9 0.4
Bear CreekA 162 2 155 532 4.5 733.0 729.9 3 730.3 0.4B 931 2 99 195 5.4 737.7 737.7 737.7 0.0C 1,413 2 179 500 0.5 739.4 739.4 739.4 0.0D 2,459 2 221 1,873 9.7 800.9 800.9 800.9 0.0E 3,428 2 417 2,981 6.1 800.9 800.9 800.9 0.0F 4,813 2 386 2,754 6.6 800.9 800.9 800.9 0.0G 5,721 2 300 2,038 8.9 800.9 800.9 800.9 0.0H 6,786 2 396 3,285 5.5 801.0 801.0 801.0 0.0I 7,556 2 378 3,491 5.2 801.1 801.1 801.1 0.0J 8,562 2 720 4,574 4.0 801.5 801.5 801.5 0.0K 9,757 2 458 3,875 4.7 802.3 802.3 802.3 0.0L 10,232 2 476 3,771 4.8 803.4 803.4 803.4 0.0M 11,481 2 239 2,833 6.4 808.7 808.7 809.5 0.8
1 Feet Above Confluence With Alligator Creek 3 Elevation Computed Without Consideration Of Backwater Effects2 Feet Above Confluence With Dry Comal Creek
FLOODING SOURCE FLOODWAYBASE FLOOD
WATER SURFACE ELEVATION
TA
BL
E 9
FEDERAL EMERGENCY MANAGEMENT AGENCYCOMAL COUNTY, TEXAS
AND INCORPORATED AREAS
FLOODWAY DATA
ALLIGATOR CREEK TRIBUTARY NO. 6 / BEAR CREEK
FEET (NAVD 88, 2001 Adjustment) FEET (NAVD 88, 2001 Adjustment) FEET (NAVD 88)

CROSS SECTION DISTANCE WIDTH (FEET)
SECTION AREA
(SQUARE FEET)
MEAN VELOCITY (FEET PER SECOND)
REGULATORY WITHOUT FLOODWAY
WITH FLOODWAY
INCREASE
Bear Creek(Continued)
N 12,853 1 245 3,081 4.5 815.0 815.0 815.8 0.8 O 13,271 1 255 3,130 4.5 816.1 816.1 817.1 1.0P 14,388 1 240 2,836 4.9 820.6 820.6 821.0 0.4Q 15,050 1 250 2,791 5.0 823.5 823.5 823.8 0.3R 16,089 1 260 3,477 4.0 827.1 827.1 827.5 0.4S 17,513 1 274 2,807 5.0 831.7 831.7 832.7 1.0
Bracken TributaryA 3,407 2 60 394 12.8 772.4 772.4 772.5 0.1B 4,245 2 135 1,025 4.9 784.4 784.4 785.0 0.6C 5,706 2 52 355 14.2 787.0 787.0 787.0 0.0D 5,749 2 106 1,257 4.0 793.3 793.3 794.1 0.8E 6,148 2 350 3,338 1.5 793.6 793.6 794.6 1.0F 7,740 2 325 1,900 2.7 795.8 795.8 796.1 0.3G 8,249 2 500 1,055 5.1 796.8 796.8 797.1 0.3H 9,188 2 500 2,157 2.2 804.1 804.1 804.2 0.1I 9,899 2 725 1,193 3.0 805.0 805.0 805.2 0.2J 10,438 2 700 758 4.8 807.6 807.6 807.8 0.2K 10,833 2 625 1,509 2.4 810.9 810.9 811.3 0.4L 10,899 2 600 2,701 1.3 813.6 813.6 813.9 0.3M 12,152 2 523 1,118 2.8 817.8 817.8 817.9 0.1N 12,527 2 485 1,679 1.9 819.6 819.6 819.8 0.2O 12,998 2 545 1,089 2.9 823.9 823.9 824.0 0.1P 13,515 2 859 883 3.5 825.4 825.4 825.4 0.0Q 14,268 2 825 1,165 2.7 830.6 830.6 830.9 0.3
1 Feet Above Confluence With Dry Comal Creek2 Feet Above Confluence With Cibolo Creek
FLOODING SOURCE FLOODWAYBASE FLOOD
WATER SURFACE ELEVATION
TA
BL
E 9
FEDERAL EMERGENCY MANAGEMENT AGENCYCOMAL COUNTY, TEXAS
AND INCORPORATED AREAS
FLOODWAY DATA
BEAR CREEK / BRACKEN TRIBUTARY
FEET (NAVD 88, 2001 Adjustment) FEET (NAVD 88, 2001 Adjustment) FEET (NAVD 88)

CROSS SECTION DISTANCE WIDTH (FEET)
SECTION AREA
(SQUARE FEET)
MEAN VELOCITY (FEET PER SECOND)
REGULATORY WITHOUT FLOODWAY
WITH FLOODWAY
INCREASE
Bracken Tributary(Continued)
R 14,688 1 775 2,207 1.4 831.8 831.8 832.1 0.3 S 16,007 1 350 1,075 2.9 842.5 842.5 842.6 0.1T 16,978 1 220 654 3.8 851.7 851.7 851.9 0.2U 18,069 1 215 345 3.1 864.6 864.6 864.7 0.1V 18,151 1 395 791 0.8 866.6 866.6 866.8 0.2W 18,620 1 57 166 3.7 872.1 872.1 872.7 0.6X 19,185 1 117 186 3.3 882.5 882.5 882.7 0.2Y 19,614 1 107 204 3.0 890.3 890.3 890.6 0.3Z 20,156 1 98 113 5.5 899.1 899.1 899.1 0.0
Cibolo CreekA 471,305 2 1,658 / 994 3 28,201 3.5 763.3 763.3 764.0 0.8B 473,443 2 498 / 60 3 12,811 7.8 765.1 765.1 765.6 0.5C 474,430 2 467 / 206 3 10,585 9.4 767.0 767.0 767.9 0.9D 475,626 2 827 / 766 3 19,646 5.1 769.8 769.8 770.5 0.8E 478,699 2 407 / 338 3 9,427 10.5 775.1 775.1 775.6 0.5F 479,197 2 252 / 72 3 7,476 13.3 777.4 777.4 778.2 0.8G 482,794 2 496 / 59 3 10,850 9.1 786.9 786.9 787.2 0.4H 484,952 2 493 / 350 3 12,139 8.2 793.4 793.4 793.9 0.5I 487,922 2 578 / 91 3 11,300 8.8 802.0 802.0 802.2 0.3J 488,340 2 592 / 163 3 11,685 8.5 802.9 802.9 803.5 0.6K 489,866 2 1,158 / 53 3 18,620 5.3 806.1 806.1 806.8 0.7L 493,297 2 338 / 60 3 8,680 11.4 817.1 817.1 817.7 0.5M 494,854 2 317 / 134 3 8,860 11.2 821.2 821.2 821.8 0.6N 495,754 2 371 / 115 3 10,526 9.4 824.3 824.3 824.9 0.6
1 Feet Above Confluence With Cibolo Creek 3 Width / Width Within County2 Feet Above Confluence With San Antonio River
FLOODING SOURCE FLOODWAYBASE FLOOD
WATER SURFACE ELEVATION
TA
BL
E 9
FEDERAL EMERGENCY MANAGEMENT AGENCYCOMAL COUNTY, TEXAS
AND INCORPORATED AREAS
FLOODWAY DATA
BRACKEN TRIBUTARY / CIBOLO CREEK
FEET (NAVD 88, 2001 Adjustment) FEET (NAVD 88, 2001 Adjustment) FEET (NAVD 88)

CROSS SECTION DISTANCE 1 WIDTH 2
(FEET)
SECTION AREA
(SQUARE FEET)
MEAN VELOCITY (FEET PER SECOND)
REGULATORY WITHOUT FLOODWAY
WITH FLOODWAY
INCREASE
Cibolo Creek(Continued)
O 496,784 328 / 267 9,440 10.5 827.0 827.0 827.5 0.5 P 497,111 280 / 229 8,504 11.6 827.6 827.6 828.1 0.5Q 498,215 406 / 315 10,430 9.5 832.1 832.1 832.7 0.6R 499,406 792 / 254 13,718 7.2 835.6 835.6 836.2 0.7S 500,812 285 / 33 8,071 12.3 837.6 837.6 838.2 0.7T 501,472 309 / 36 8,774 11.3 840.0 840.0 840.6 0.6U 502,471 471 / 112 12,240 8.1 844.4 844.4 845.2 0.8V 502,926 700 / 470 14,236 6.9 846.0 846.0 846.3 0.3W 504,041 342 / 171 9,561 10.3 848.6 848.6 849.1 0.5X 504,847 332 / 224 9,426 10.5 850.6 850.6 851.0 0.5Y 505,559 360 / 190 10,252 9.6 852.3 852.3 852.9 0.6Z 507,279 364 / 316 10,633 9.3 857.4 857.4 858.0 0.6
AA 507,708 341 / 302 9,921 9.9 858.2 858.2 858.7 0.6AB 508,411 473 / 124 13,461 7.3 860.3 860.3 861.0 0.7AC 509,824 424 / 114 9,156 10.8 862.3 862.3 863.1 0.8AD 510,222 378 / 99 10,119 9.8 865.0 865.0 865.6 0.6AE 515,303 263 / 211 7,527 13.1 877.8 877.8 878.0 0.3AF 515,986 375 / 304 11,624 8.5 883.4 883.4 883.9 0.5AG 522,123 1,150 / 923 24,595 4.0 895.6 895.6 896.1 0.6AH 523,829 1,076 / 355 17,312 5.7 897.3 897.3 897.8 0.5AI 525,305 425 / 62 9,568 10.2 898.9 898.9 899.5 0.6AJ 526,125 573 / 24 14,238 6.9 901.4 901.4 902.1 0.7AK 526,955 701 / 480 12,393 7.9 901.8 901.8 902.4 0.7AL 528,242 594 / 373 14,050 7.0 904.1 904.1 904.7 0.5AM 530,148 637 / 550 11,466 8.5 906.8 906.8 907.2 0.5
1 Feet Above Confluence With San Antonio River2 Width / Width Within County
FLOODING SOURCE FLOODWAYBASE FLOOD
WATER SURFACE ELEVATION
TA
BL
E 9
FEDERAL EMERGENCY MANAGEMENT AGENCYCOMAL COUNTY, TEXAS
AND INCORPORATED AREAS
FLOODWAY DATA
CIBOLO CREEK
FEET (NAVD 88, 2001 Adjustment) FEET (NAVD 88, 2001 Adjustment) FEET (NAVD 88)

CROSS SECTION DISTANCE 1 WIDTH 2
(FEET)
SECTION AREA
(SQUARE FEET)
MEAN VELOCITY (FEET PER SECOND)
REGULATORY WITHOUT FLOODWAY
WITH FLOODWAY
INCREASE
Cibolo Creek(Continued)
AN 531,741 516 / 356 10,845 9.0 910.6 910.6 911.2 0.7 AO 532,968 839 / 791 14,079 7.0 913.1 913.1 913.7 0.6AP 533,509 1,021 / 977 13,751 7.1 914.1 914.1 914.8 0.6AQ 534,776 1,115 / 932 13,110 7.5 916.2 916.2 916.7 0.5AR 536,961 692 / 462 10,058 9.7 919.4 919.4 919.9 0.5AS 538,533 1,032 / 937 13,059 7.5 923.0 923.0 923.6 0.6AT 539,472 1,018 / 934 10,581 9.2 923.6 923.6 924.4 0.8AU 540,257 724 / 581 12,159 8.0 926.3 926.3 926.6 0.3AV 542,225 318 / 19 8,402 11.6 929.3 929.3 929.7 0.4AW 543,822 383 / 245 9,718 10.1 933.2 933.2 933.5 0.3AX 545,606 430 / 258 12,017 8.1 937.4 937.4 938.0 0.6AY 546,894 309 / 57 8,003 12.2 938.5 938.5 939.3 0.8AZ 547,479 377 / 69 10,600 9.2 941.2 941.2 941.9 0.7BA 548,214 406 / 180 9,627 10.1 941.7 941.7 942.4 0.7BB 549,081 442 / 303 10,055 9.7 943.2 943.2 943.8 0.5BC 549,991 657 / 607 16,765 5.8 946.2 946.2 946.8 0.6BD 551,845 283 / 38 7,517 13.0 947.8 947.8 948.2 0.5BE 552,343 338 / 113 9,900 9.8 950.4 950.4 950.9 0.6BF 553,488 559 / 452 13,811 7.1 952.6 952.6 953.2 0.6BG 554,915 412 / 164 10,429 9.4 954.6 954.6 955.1 0.5BH 556,683 951 / 676 18,496 5.3 957.9 957.9 958.5 0.6BI 557,345 1,267 / 807 22,997 4.2 958.7 958.7 959.3 0.6BJ 558,915 460 / 94 11,025 8.8 960.4 960.4 961.0 0.6BK 559,410 858 / 23 16,710 5.8 962.3 962.3 963.0 0.7BL 561,290 760 / 242 16,105 6.1 964.3 964.3 965.0 0.6
1 Feet Above Confluence With San Antonio River2 Width / Width Within County
FLOODING SOURCE FLOODWAYBASE FLOOD
WATER SURFACE ELEVATION
TA
BL
E 9
FEDERAL EMERGENCY MANAGEMENT AGENCYCOMAL COUNTY, TEXAS
AND INCORPORATED AREAS
FLOODWAY DATA
CIBOLO CREEK
FEET (NAVD 88, 2001 Adjustment) FEET (NAVD 88, 2001 Adjustment) FEET (NAVD 88)

CROSS SECTION DISTANCE 1 WIDTH 2
(FEET)
SECTION AREA
(SQUARE FEET)
MEAN VELOCITY (FEET PER SECOND)
REGULATORY WITHOUT FLOODWAY
WITH FLOODWAY
INCREASE
Cibolo Creek(Continued)
BM 563,150 548 / 257 12,185 8.0 967.4 967.4 968.0 0.6 BN 564,360 752 / 633 12,349 7.9 969.7 969.7 970.0 0.2BO 567,722 1,211 / 1,185 18,938 5.1 977.7 977.7 978.3 0.6BP 568,409 1,570 / 1,498 14,382 6.8 978.2 978.2 978.8 0.5BQ 569,930 2,468 / 1,570 24,857 3.9 983.7 983.7 984.5 0.8BR 571,681 2,557 / 190 22,180 4.4 985.0 985.0 985.8 0.8BS 574,342 2,871 / 118 18,772 5.2 989.1 989.1 989.8 0.7BT 577,429 1,875 / 118 10,722 8.7 995.9 995.9 996.3 0.4BU 577,776 1,736 / 237 16,075 5.8 998.9 998.9 999.7 0.8BV 579,307 700 / 160 12,239 7.7 1,002.0 1,002.0 1,002.4 0.3BW 580,436 572 / 365 13,433 7.0 1,004.5 1,004.5 1,005.1 0.6BX 581,611 473 / 291 8,980 10.4 1,006.0 1,006.0 1,006.6 0.6BY 583,006 2,325 / 2,226 24,422 3.8 1,011.1 1,011.1 1,011.4 0.3BZ 586,149 2,255 / 327 24,073 3.9 1,015.2 1,015.2 1,015.5 0.4CA 589,459 2,796 / 563 16,574 5.7 1,018.1 1,018.1 1,018.5 0.3CB 590,350 2,962 / 712 28,005 3.4 1,020.5 1,020.5 1,021.2 0.7CC 591,898 876 / 303 12,017 7.8 1,021.4 1,021.4 1,022.0 0.6CD 593,257 1,467 / 311 16,025 5.9 1,023.4 1,023.4 1,024.3 0.9CE 594,562 1,760 / 152 19,146 4.9 1,025.7 1,025.7 1,026.2 0.6CF 595,962 1,846 / 210 13,854 6.7 1,028.2 1,028.2 1,028.7 0.5CG 597,272 1,642 / 252 16,883 5.5 1,033.2 1,033.2 1,033.7 0.5CH 599,295 2,176 / 840 21,609 4.3 1,036.4 1,036.4 1,036.8 0.4CI 603,698 1,494 / 476 14,884 6.3 1,043.7 1,043.7 1,044.2 0.5CJ 604,622 1,291 / 130 20,122 4.6 1,046.0 1,046.0 1,046.5 0.5CK 607,784 2,527 / 2,374 24,197 3.9 1,050.2 1,050.2 1,050.4 0.2
1 Feet Above Confluence With San Antonio River2 Width / Width Within County
FLOODING SOURCE FLOODWAYBASE FLOOD
WATER SURFACE ELEVATION
TA
BL
E 9
FEDERAL EMERGENCY MANAGEMENT AGENCYCOMAL COUNTY, TEXAS
AND INCORPORATED AREAS
FLOODWAY DATA
CIBOLO CREEK
FEET (NAVD 88, 2001 Adjustment) FEET (NAVD 88, 2001 Adjustment) FEET (NAVD 88)

CROSS SECTION DISTANCE 1 WIDTH 2
(FEET)
SECTION AREA
(SQUARE FEET)
MEAN VELOCITY (FEET PER SECOND)
REGULATORY WITHOUT FLOODWAY
WITH FLOODWAY
INCREASE
Cibolo Creek(Continued)
CL 610,377 968 / 839 9,122 10.2 1,052.9 1,052.9 1,053.8 0.8 CM 611,061 1,730 / 1,681 27,585 3.4 1,057.6 1,057.6 1,058.1 0.5CN 613,049 661 / 248 9,529 9.8 1,058.3 1,058.3 1,058.7 0.4CO 614,060 489 / 161 10,564 8.7 1,062.2 1,062.2 1,062.9 0.7CP 615,425 1,411 / 1,263 14,017 6.6 1,066.6 1,066.6 1,067.4 0.8CQ 618,147 564 / 205 10,291 8.9 1,073.1 1,073.1 1,073.6 0.5CR 620,481 1,512 / 1,213 18,731 4.9 1,078.5 1,078.5 1,079.2 0.7CS 622,314 2,193 / 1,889 16,766 5.5 1,081.4 1,081.4 1,082.1 0.7CT 624,619 3,399 / 3,347 22,804 4.0 1,086.3 1,086.3 1,087.0 0.8CU 630,594 1,376 / 286 14,648 6.1 1,097.4 1,097.4 1,098.0 0.6CV 632,542 1,100 / 804 14,318 6.2 1,101.9 1,101.9 1,102.3 0.5CW 634,571 1,325 / 253 11,341 7.8 1,104.7 1,104.7 1,105.0 0.3CX 635,157 1,700 / 275 15,932 5.6 1,107.1 1,107.1 1,107.2 0.1CY 637,102 895 / 602 12,967 6.7 1,109.4 1,109.4 1,109.8 0.4CZ 641,224 705 / 546 13,289 6.5 1,117.6 1,117.6 1,118.0 0.4DA 642,087 411 / 184 9,223 9.2 1,119.3 1,119.3 1,119.9 0.6DB 644,853 349 / 192 6,546 12.9 1,126.7 1,126.7 1,126.9 0.3DC 646,447 568 / 367 10,991 7.7 1,134.6 1,134.6 1,135.3 0.7DD 648,606 347 / 139 7,492 11.3 1,139.0 1,139.0 1,139.6 0.6DE 650,271 581 / 66 11,979 7.1 1,144.6 1,144.6 1,145.4 0.7DF 655,187 326 / 270 7,549 11.1 1,153.9 1,153.9 1,154.5 0.7DG 656,028 513 / 444 12,272 6.9 1,157.6 1,157.6 1,158.3 0.6DH 658,049 642 / 35 12,842 6.6 1,162.2 1,162.2 1,162.7 0.5DI 661,986 1,294 / 1,209 8,758 8.8 1,166.5 1,166.5 1,167.0 0.5DJ 663,227 1,536 / 1,280 22,347 3.5 1,171.8 1,171.8 1,172.3 0.5
1 Feet Above Confluence With San Antonio River2 Width / Width Within County
FLOODING SOURCE FLOODWAYBASE FLOOD
WATER SURFACE ELEVATION
TA
BL
E 9
FEDERAL EMERGENCY MANAGEMENT AGENCYCOMAL COUNTY, TEXAS
AND INCORPORATED AREAS
FLOODWAY DATA
CIBOLO CREEK
FEET (NAVD 88, 2001 Adjustment) FEET (NAVD 88, 2001 Adjustment) FEET (NAVD 88)

CROSS SECTION DISTANCE 1 WIDTH 2
(FEET)
SECTION AREA
(SQUARE FEET)
MEAN VELOCITY (FEET PER SECOND)
REGULATORY WITHOUT FLOODWAY
WITH FLOODWAY
INCREASE
Cibolo Creek(Continued)
DK 664,425 440 / 188 10,034 7.7 1,172.0 1,172.0 1,172.9 0.9 DL 667,337 1,276 / 63 14,589 5.3 1,177.8 1,177.8 1,178.3 0.5DM 670,448 270 / 241 6,842 11.4 1,182.1 1,182.1 1,182.5 0.4DN 671,343 485 / 468 11,061 7.1 1,186.0 1,186.0 1,186.6 0.6DO 672,299 420 / 387 10,773 7.3 1,188.3 1,188.3 1,189.0 0.7DP 673,205 290 / 113 7,322 10.7 1,188.8 1,188.8 1,189.5 0.6DQ 674,563 255 / 175 6,960 11.2 1,192.8 1,192.8 1,193.2 0.4DR 675,492 674 / 663 17,112 4.6 1,196.5 1,196.5 1,197.1 0.6DS 677,416 311 / 124 7,817 10.0 1,198.8 1,198.8 1,199.3 0.5DT 678,025 478 / 202 11,367 6.9 1,201.4 1,201.4 1,202.0 0.5DU 679,955 499 / 108 11,608 6.7 1,205.4 1,205.4 1,206.0 0.5DV 683,147 1,099 / 237 9,173 8.5 1,209.6 1,209.6 1,209.9 0.3DW 684,406 730 / 375 17,086 4.5 1,214.1 1,214.1 1,214.4 0.3DX 687,622 455 / 364 10,268 7.6 1,220.0 1,220.0 1,220.4 0.5DY 689,965 399 / 330 9,378 8.3 1,223.8 1,223.8 1,224.2 0.4DZ 691,005 287 / 75 7,288 10.6 1,225.8 1,225.8 1,226.2 0.4EA 693,908 744 / 592 11,678 6.6 1,232.0 1,232.0 1,232.4 0.4EB 695,851 956 / 935 18,095 4.2 1,236.3 1,236.3 1,236.9 0.6EC 697,900 530 / 431 10,327 7.4 1,239.2 1,239.2 1,239.7 0.5ED 700,689 1,306 / 1,875 11,663 6.6 1,244.4 1,244.4 1,244.9 0.5EE 703,580 865 / 687 8,518 9.0 1,249.4 1,249.4 1,249.8 0.4EF 705,479 478 / 303 8,920 8.4 1,256.1 1,256.1 1,256.4 0.3EG 706,048 615 / 184 11,196 6.7 1,258.2 1,258.2 1,258.6 0.3EH 707,352 662 / 210 10,384 7.2 1,260.1 1,260.1 1,260.9 0.8EI 708,789 1,418 / 1,267 17,887 4.2 1,263.7 1,263.7 1,264.1 0.4
1 Feet Above Confluence With San Antonio River2 Width / Width Within County
FLOODING SOURCE FLOODWAYBASE FLOOD
WATER SURFACE ELEVATION
TA
BL
E 9
FEDERAL EMERGENCY MANAGEMENT AGENCYCOMAL COUNTY, TEXAS
AND INCORPORATED AREAS
FLOODWAY DATA
CIBOLO CREEK
FEET (NAVD 88, 2001 Adjustment) FEET (NAVD 88, 2001 Adjustment) FEET (NAVD 88)

FIRM CROSS-SECTION 7
MAPPED DISTANCE WIDTH (FEET)
SECTION AREA
(SQUARE FEET)
MEAN VELOCITY (FEET PER SECOND)
REGULATORY WITHOUT FLOODWAY
WITH FLOODWAY
INCREASE
710,011 2 1,685 / 1,574 5 12,579 6.0 1,264.3 1,264.3 1,264.7 0.5711,822 2 2,038 / 1,796 5 11,024 6.3 1,268.6 1,268.6 1,269.1 0.4712,501 2 1,554 / 1,955 5 8,407 8.3 1,269.5 1,269.5 1,270.0 0.4713,367 2 2,085 / 1,850 5 15,166 4.7 1,273.1 1,273.1 1,273.7 0.6
1,840 3 143 722 9.4 1,253.7 1,249.4 6 1,250.4 1.02,620 3 228 1,160 5.8 1,256.2 1,256.2 1,256.8 0.63,320 3 126 730 9.3 1,259.7 1,259.7 1,260.7 1.04,290 3 181 1,084 6.3 1,265.3 1,265.3 1,266.2 0.95,230 3 330 1,218 5.6 1,269.0 1,269.0 1,269.4 0.4
280 280 4 145 2,078 22.1 616.6 590.9 6 590.9 0.02,480 2,455 4 241 4,481 10.2 616.6 608.1 6 608.1 0.03,380 3,350 4 498 5,992 7.7 616.6 611.6 6 612.1 0.55,580 5,552 4 350 6,511 7.0 616.6 616.3 6 616.4 0.16,040 6,018 4 383 8,018 5.7 617.2 617.2 618.2 1.0
6,960 6,980 4 280 6,131 7.1 618.0 618.0 618.8 0.88,680 8,655 4 147 3,941 11.1 621.5 621.5 622.3 0.8
1 Cross Sections A-E Shown Under Comal River 5 Width / Width Within County2 Feet Above Confluence With San Antonio River 6 Elevation Computed Without Consideration Of Backwater Effects3 Feet Above Confluence With Cibolo Creek 7 Stream Station Per The DFIRM And RAS Model Cross-Sections4 Feet Above Confluence With Guadalupe River, As Shown On FIS Profile
FLOODWAY DATA
CIBOLO CREEK / CIBOLO TRIBUTARY / COMAL RIVER / DRY COMAL CREEK
TA
BL
E 9
FLOODWAYBASE FLOOD
WATER SURFACE ELEVATION
CROSS SECTION
Cibolo Creek(Continued)
EJEKELEM
Cibolo TributaryABCD
Comal River
A-E 1
ABCD
FEDERAL EMERGENCY MANAGEMENT AGENCYCOMAL COUNTY, TEXAS
AND INCORPORATED AREAS
FLOODING SOURCE
FG
E
Dry Comal Creek
E
FEET (NAVD 88, 2001 Adjustment) FEET (NAVD 88, 2001 Adjustment) FEET (NAVD 88)

FIRM CROSS-SECTION 2
MAPPED DISTANCE 1
WIDTH (FEET)
SECTION AREA
(SQUARE FEET)
MEAN VELOCITY (FEET PER SECOND)
REGULATORY WITHOUT FLOODWAY
WITH FLOODWAY
INCREASE
10,050 9,946 692 8,645 4.9 625.0 625.0 625.9 0.911,410 11,368 290 5,364 8.0 628.4 628.4 629.1 0.713,790 13,674 339 6,863 6.2 634.5 634.5 635.1 0.615,010 14,956 640 12,060 3.6 637.6 637.6 638.2 0.616,830 16,786 483 9,373 4.6 639.5 639.5 640.4 0.918,830 18,774 723 14,099 3.1 641.2 641.2 642.1 0.920,890 20,793 1,628 15,694 2.7 642.1 642.1 643.1 1.022,430 22,337 520 9,231 4.7 643.5 643.5 644.4 0.924,070 24,066 1,000 15,007 2.9 644.4 644.4 645.3 0.926,290 26,297 1,190 11,174 3.9 645.7 645.7 646.7 1.028,440 28,414 1,550 12,065 3.5 647.7 647.7 648.7 1.030,450 30,404 1,100 8,493 5.0 651.3 651.3 651.9 0.632,230 32,177 1,913 12,432 3.4 654.7 654.7 655.6 0.933,980 33,913 950 9,531 4.0 658.5 658.5 659.4 0.936,220 36,149 784 9,458 4.0 661.0 661.0 661.8 0.838,220 38,164 1,400 11,609 3.3 663.7 663.7 664.6 0.939,570 39,498 1,399 13,461 2.8 664.7 664.7 665.7 1.040,500 40,484 992 9,332 4.1 665.6 665.6 666.6 1.042,620 42,580 1,042 10,578 2.9 667.9 667.9 668.9 1.045,700 45,590 608 7,134 4.3 673.1 673.1 673.8 0.748,640 48,700 962 10,552 2.7 677.4 677.4 678.2 0.851,880 51,900 1,250 7,591 3.5 684.0 684.0 684.8 0.8
53,880 887 7,405 3.6 687.2 687.2 687.7 0.554,870 975 7,490 3.6 688.1 688.1 688.8 0.755,754 794 4,238 6.3 688.6 688.6 689.6 1.056,821 555 4,789 5.5 693.6 693.6 693.7 0.1
1 Feet Above Confluence With Guadalupe River, As Shown On FIS Profile 2 Stream Station Per The DFIRM And RAS Model Cross-Sections
BASE FLOOD WATER SURFACE ELEVATION
TA
BL
E 9
FEDERAL EMERGENCY MANAGEMENT AGENCYCOMAL COUNTY, TEXAS
AND INCORPORATED AREAS
FLOODWAY DATA
DRY COMAL CREEK
CROSS SECTION
Dry Comal Creek(Continued)
H
AF
FLOODING SOURCE FLOODWAY
X
T
P
L
UVW
AG
IJK
MNO
QRS
ADAE
YZ
AA
ACAB
FEET (NAVD 88, 2001 Adjustment) FEET (NAVD 88, 2001 Adjustment) FEET (NAVD 88)

CROSS SECTION DISTANCE 1WIDTH (FEET)
SECTION AREA
(SQUARE FEET)
MEAN VELOCITY (FEET PER SECOND)
REGULATORY WITHOUT FLOODWAY
WITH FLOODWAY
INCREASE
Dry Comal Creek(Continued)
AH 57,210 480 4,352 6.1 694.4 694.4 694.7 0.3 AI 58,088 460 5,385 4.9 697.0 697.0 697.8 0.8AJ 59,258 330 3,815 2.3 699.8 699.8 700.6 0.8AK 59,641 310 3,271 2.7 700.9 700.9 701.3 0.4AL 59,915 310 2,899 3.1 700.9 700.9 701.5 0.6AM 60,700 314 3,064 2.6 701.2 701.2 702.0 0.8AN 61,623 333 3,473 2.3 701.5 701.5 702.5 1.0AO 62,563 275 2,187 3.7 702.4 702.4 703.2 0.8AP 63,781 174 1,506 5.4 704.8 704.8 705.2 0.4AQ 64,798 234 1,308 6.2 709.7 709.7 710.3 0.6AR 65,559 200 1,681 4.8 711.9 711.9 712.9 1.0AS 66,004 163 1,417 5.7 713.5 713.5 714.4 0.9AT 66,481 151 1,586 5.1 715.6 715.6 716.1 0.5AU 67,702 155 1,248 6.5 720.8 720.8 721.0 0.2AV 68,320 200 1,419 5.7 723.2 723.2 723.9 0.7AW 69,217 180 1,662 4.9 725.2 725.2 726.1 0.9AX 70,177 150 1,845 4.4 728.1 728.1 728.6 0.5AY 71,246 164 1,429 5.7 732.6 732.6 733.4 0.8AZ 71,634 128 1,572 4.1 733.9 733.9 734.7 0.8BA 72,088 123 1,059 6.1 735.1 735.1 735.7 0.6BB 73,325 105 931 7.0 742.6 742.6 742.7 0.1BC 73,717 144 839 7.8 746.1 746.1 746.2 0.1BD 75,512 141 1,865 3.5 750.1 750.1 750.5 0.4BE 76,440 174 1,149 5.7 752.3 752.3 752.6 0.3BF 77,774 171 1,342 4.8 758.8 758.8 759.1 0.3BG 79,156 223 1,917 3.4 765.7 765.7 765.8 0.1
1 Feet Above Confluence With Guadalupe River
FLOODING SOURCE FLOODWAYBASE FLOOD
WATER SURFACE ELEVATION
TA
BL
E 9
FEDERAL EMERGENCY MANAGEMENT AGENCYCOMAL COUNTY, TEXAS
AND INCORPORATED AREAS
FLOODWAY DATA
DRY COMAL CREEK
FEET (NAVD 88, 2001 Adjustment) FEET (NAVD 88, 2001 Adjustment) FEET (NAVD 88)

FIRM CROSS-SECTION 5
MAPPED DISTANCE WIDTH (FEET)
SECTION AREA
(SQUARE FEET)
MEAN VELOCITY (FEET PER SECOND)
REGULATORY WITHOUT FLOODWAY
WITH FLOODWAY
INCREASE
81,234 2 292 1,547 4.2 775.4 775.4 776.3 0.982,586 2 259 2,171 3.0 779.3 779.3 780.2 0.983,539 2 192 1,418 4.6 780.3 780.3 781.0 0.7
8,580 8,232 3 319 932 8.7 624.5 623.5 4 623.5 0.09,340 8,956 3 535 3,170 2.4 626.0 626.0 626.0 0.09,910 9,545 3 289 1,485 5.0 626.6 626.6 626.6 0.0
10,310 9,998 3 292 1,759 4.2 627.8 627.8 627.8 0.011,090 10,739 3 265 2,372 3.1 629.0 629.0 629.0 0.011,800 11,455 3 188 1,318 5.7 630.1 630.1 630.2 0.112,560 12,237 3 261 1,747 4.3 632.4 632.4 632.5 0.1
13,410 13,109 3 80 845 8.8 633.8 633.8 633.8 0.013,880 13,603 3 83 888 8.2 635.5 635.5 635.9 0.414,370 14,092 3 188 1,666 4.4 638.4 638.4 639.3 0.915,250 14,952 3 265 1,972 3.7 639.6 639.6 640.6 1.016,040 15,788 3 400 1,974 3.5 641.4 641.4 642.4 1.016,990 16,671 3 200 1,438 4.8 646.5 646.5 647.5 1.017,530 17,455 3 89 782 8.9 648.2 648.2 649.0 0.820,920 20,693 3 150 1,063 5.9 663.0 663.0 663.6 0.623,020 22,809 3 125 887 7.0 671.4 671.4 672.1 0.7
1 Cross Sections A-F Shown Under Comal Springs 4 Elevation Computed Without Consideration Of Backwater Effects2 Feet Above Confluence With Guadalupe River 5 Stream Station Per The DFIRM And RAS Model Cross-Sections3 Feet Above Confluence With Comal River, Measured Along Old Channel Comal River, As Shown On FIS Profile
FEDERAL EMERGENCY MANAGEMENT AGENCYCOMAL COUNTY, TEXAS
AND INCORPORATED AREAS
FLOODING SOURCE
NOP
JKL
FG
M
Blieders CreekA-G 1
HI
BCDE
BJ
Comal SpringsA
FLOODWAY DATA
DRY COMAL CREEK / COMAL SPRINGS / BLIEDERS CREEK
TA
BL
E 9
FLOODWAYBASE FLOOD
WATER SURFACE ELEVATION
CROSS SECTION
Dry Comal Creek(Continued)
BHBI
FEET (NAVD 88, 2001 Adjustment) FEET (NAVD 88, 2001 Adjustment) FEET (NAVD 88)

FIRM CROSS-SECTION 4
MAPPED DISTANCE WIDTH (FEET)
SECTION AREA
(SQUARE FEET)
MEAN VELOCITY (FEET PER SECOND)
REGULATORY WITHOUT FLOODWAY
WITH FLOODWAY
INCREASE
24,245 24,400 1 111 730 5.2 679.1 679.1 680.0 0.926,260 26,410 1 78 658 4.6 687.1 687.1 688.0 0.927,648 27,820 1 122 521 5.8 692.1 692.1 693.1 1.028,849 29,060 1 93 564 5.4 699.2 699.2 700.0 0.830,355 30,540 1 215 931 3.3 708.1 708.1 709.1 1.032,325 32,550 1 990 490 8.9 718.5 718.5 718.5 0.033,649 33,916 1 1,505 712 4.0 733.5 733.5 733.5 0.037,075 37,441 1 1,119 32,456 0.1 774.6 774.6 775.6 1.040,725 41,164 1 430 3,241 1.9 774.8 774.8 775.7 0.943,410 43,854 1 88 900 6.9 787.1 787.1 787.9 0.846,075 46,982 1 99 828 6.7 810.0 810.0 810.7 0.747,025 47,940 1 119 883 6.2 815.6 815.6 816.4 0.847,660 48,566 1 150 1,192 4.0 823.0 823.0 823.7 0.748,199 49,129 1 180 783 4.8 828.2 828.2 828.2 0.049,180 50,117 1 160 790 4.7 836.3 836.3 836.3 0.050,200 51,049 1 27 88 9.5 848.7 848.7 849.0 0.351,348 52,199 1 61 218 3.9 868.6 868.6 869.5 0.952,249 53,097 1 29 93 4.5 891.8 891.8 892.3 0.5
2,040 2 110 754 7.3 666.5 660.6 3 661.6 1.03,040 2 96 601 9.1 673.2 673.2 673.2 0.04,040 2 132 803 6.8 685.3 685.3 685.8 0.54,540 2 95 626 8.7 691.5 691.5 691.6 0.15,040 2 97 531 10.3 701.5 701.5 701.6 0.1
1 Feet Above Confluence With Comal River, As Shown On FIS Profile 3 Elevation Computed Without Consideration of Backwater Effects2 Feet Above Confluence With Guadalupe River 4 Stream Station Per The DFIRM And RAS Model Cross-Sections
FLOODWAY DATA
BLIEDERS CREEK / ELM CREEK
TA
BL
E 9
FLOODWAYBASE FLOOD
WATER SURFACE ELEVATION
CROSS SECTION
Blieders Creek(Continued)
QRSTUVWXYZ
AAABAC
A
ADAEAFAG
FEDERAL EMERGENCY MANAGEMENT AGENCYCOMAL COUNTY, TEXAS
AND INCORPORATED AREAS
FLOODING SOURCE
BCDE
AH
Elm Creek
FEET (NAVD 88, 2001 Adjustment) FEET (NAVD 88, 2001 Adjustment) FEET (NAVD 88)

CROSS SECTION DISTANCE 1WIDTH (FEET)
SECTION AREA
(SQUARE FEET)
MEAN VELOCITY (FEET PER SECOND)
REGULATORY WITHOUT FLOODWAY
WITH FLOODWAY
INCREASE
Elm Creek(Continued)
F 6,040 132 1,340 4.1 718.6 718.6 718.6 0.0 G 7,040 138 776 7.1 724.7 724.7 724.8 0.1H 8,040 112 637 8.6 738.7 738.7 738.8 0.1I 9,040 104 924 5.9 750.1 750.1 750.3 0.2J 10,040 128 682 8.0 760.1 760.1 760.4 0.3K 11,040 165 796 6.9 775.3 775.3 775.3 0.0L 12,040 121 1,053 5.2 783.8 783.8 784.0 0.2M 13,040 91 612 8.9 792.5 792.5 792.8 0.3N 13,770 290 2,174 2.5 799.6 799.6 800.1 0.5O 15,030 205 810 6.4 809.4 809.4 809.5 0.1P 16,030 146 1,129 4.6 818.8 818.8 818.8 0.0Q 17,030 147 732 7.1 826.5 826.5 826.7 0.2R 18,030 247 1,390 3.7 835.6 835.6 835.8 0.2S 19,030 70 567 9.1 842.3 842.3 842.7 0.4T 20,080 211 1,404 3.7 850.9 850.9 851.8 0.9U 21,080 184 928 5.6 856.8 856.8 856.9 0.1V 22,080 145 1,054 4.9 863.1 863.1 863.2 0.1W 23,080 201 930 5.6 869.5 869.5 869.7 0.2X 24,030 150 875 5.9 877.5 877.5 877.8 0.3Y 25,030 141 895 5.8 884.7 884.7 885.1 0.4Z 26,030 143 706 5.9 893.0 893.0 893.2 0.2
AA 27,030 202 980 4.2 900.6 900.6 900.6 0.0AB 28,030 210 752 5.5 909.0 909.0 909.0 0.0AC 29,030 129 832 5.0 917.6 917.6 917.7 0.1AD 30,050 199 851 4.9 923.9 923.9 924.0 0.1AE 31,050 134 582 7.1 935.6 935.6 935.7 0.1
1 Feet Above Confluence With Guadalupe River
FLOODING SOURCE FLOODWAYBASE FLOOD
WATER SURFACE ELEVATION
TA
BL
E 9
FEDERAL EMERGENCY MANAGEMENT AGENCYCOMAL COUNTY, TEXAS
AND INCORPORATED AREAS
FLOODWAY DATA
ELM CREEK
FEET (NAVD 88, 2001 Adjustment) FEET (NAVD 88, 2001 Adjustment) FEET (NAVD 88)

CROSS SECTION DISTANCE 1WIDTH (FEET)
SECTION AREA
(SQUARE FEET)
MEAN VELOCITY (FEET PER SECOND)
REGULATORY WITHOUT FLOODWAY
WITH FLOODWAY
INCREASE
Elm Creek(Continued)
AF 32,050 1 119 837 4.9 946.1 946.1 946.4 0.3 AG 32,510 1 125 504 8.2 952.3 952.3 952.4 0.1AH 33,050 1 146 622 6.6 963.1 963.1 963.1 0.0AI 34,050 1 207 1,289 3.2 971.5 971.5 971.9 0.4AJ 35,050 1 299 1,187 2.3 973.7 973.7 973.9 0.2
Garden Ridge TributaryA 987 2 190 515 7.5 777.8 777.8 778.2 0.4B 1,470 2 190 897 4.3 782.5 782.5 783.5 1.0C 2,609 2 120 677 5.0 789.1 789.1 789.8 0.7D 3,562 2 160 748 4.5 795.4 795.4 796.1 0.7E 4,327 2 140 623 5.4 802.2 802.2 802.6 0.4F 4,585 2 260 4,039 2.0 814.2 814.2 815.1 0.9G 5,984 2 270 1,309 2.6 814.6 814.6 815.5 0.9H 6,341 2 134 599 5.6 815.9 815.9 816.5 0.6I 6,573 2 109 528 7.0 818.1 818.1 818.5 0.4J 6,887 2 200 1,846 1.8 824.7 824.7 825.4 0.7K 7,761 2 290 746 4.5 825.3 825.3 826.2 0.9L 9,173 2 320 798 4.2 837.2 837.2 837.8 0.6M 10,448 2 142 513 5.5 845.5 845.5 845.8 0.3N 11,001 2 100 559 5.0 851.2 851.2 851.8 0.6O 11,665 2 90 445 6.3 855.7 855.7 856.6 0.9P 12,183 2 120 851 3.3 863.1 863.1 863.4 0.3Q 12,763 2 139 437 3.7 863.4 863.4 864.4 1.0R 12,893 2 110 638 2.6 866.9 866.9 867.4 0.5
1 Feet Above Confluence With Guadalupe River2 Feet Above Confluence With Bracken Tributary
FLOODING SOURCE FLOODWAYBASE FLOOD
WATER SURFACE ELEVATION
TA
BL
E 9
FEDERAL EMERGENCY MANAGEMENT AGENCYCOMAL COUNTY, TEXAS
AND INCORPORATED AREAS
FLOODWAY DATA
ELM CREEK / GARDEN RIDGE TRIBUTARY
FEET (NAVD 88, 2001 Adjustment) FEET (NAVD 88, 2001 Adjustment) FEET (NAVD 88)

FIRM CROSS-SECTION 3
MAPPED DISTANCE WIDTH (FEET)
SECTION AREA
(SQUARE FEET)
MEAN VELOCITY (FEET PER SECOND)
REGULATORY WITHOUT FLOODWAY
WITH FLOODWAY
INCREASE
13,215 1 175 696 2.3 871.4 871.4 871.8 0.413,743 1 249 494 3.3 884.7 884.7 884.7 0.013,883 1 478 1,063 1.5 884.9 884.9 884.9 0.014,131 1 590 1,262 4.0 884.8 884.8 884.8 0.014,604 1 110 338 3.8 896.4 896.4 896.7 0.315,167 1 23 55 3.3 898.9 898.9 899.2 0.315,602 1 23 48 3.5 909.3 909.3 909.7 0.416,785 1 22 31 6.0 933.7 933.7 933.7 0.017,389 1 60 121 1.4 951.4 951.4 951.8 0.4
27,700 28,211 2 332 9,459 15.4 598.3 598.3 599.2 0.928,700 29,102 2 377 10,994 13.2 600.0 600.0 600.9 0.929,700 30,066 2 540 15,650 10.0 602.0 602.0 602.9 0.930,660 30,971 2 396 11,910 13.1 602.0 602.0 602.9 0.931,980 32,292 2 371 10,332 15.7 602.8 602.8 603.6 0.833,340 33,808 2 329 10,963 13.8 604.8 604.8 605.6 0.834,880 35,215 2 309 9,564 16.4 605.8 605.8 606.5 0.735,660 36,077 2 615 15,388 12.8 608.3 608.3 609.1 0.837,260 37,586 2 851 23,372 5.2 610.7 610.7 611.5 0.839,060 39,384 2 587 14,727 8.2 612.0 612.0 612.9 0.940,560 40,845 2 570 17,238 11.1 615.1 615.1 616.0 0.9
1 Feet Above Confluence With Bracken Tributary 3 Stream Station Per The DFIRM And RAS Model Cross-Sections2 Feet Above Dunlap Dam, As Shown On The FIS Profile
FEDERAL EMERGENCY MANAGEMENT AGENCYCOMAL COUNTY, TEXAS
AND INCORPORATED AREAS
FLOODING SOURCE
JK
FGH
Guadalupe River(Lower Reach)
A
I
BCDE
YZ
AA
UVWX
FLOODWAY DATA
GARDEN RIDGE TRIBUTARY / GUADALUPE RIVER (LOWER REACH)
TA
BL
E 9
FLOODWAYBASE FLOOD
WATER SURFACE ELEVATION
CROSS SECTION
Garden Ridge Tributary(Continued)
ST
FEET (NAVD 88, 2001 Adjustment) FEET (NAVD 88, 2001 Adjustment) FEET (NAVD 88)

FIRM CROSS-SECTION 2
MAPPED DISTANCE 1
WIDTH (FEET)
SECTION AREA
(SQUARE FEET)
MEAN VELOCITY (FEET PER SECOND)
REGULATORY WITHOUT FLOODWAY
WITH FLOODWAY
INCREASE
42,690 42,999 1,204 25,412 12.9 616.3 616.3 617.1 0.844,210 44,489 775 20,292 7.0 617.4 617.4 618.1 0.746,270 46,514 399 10,269 13.1 617.6 617.6 618.1 0.547,810 48,012 723 16,798 9.0 619.4 619.4 620.2 0.849,290 49,544 605 14,538 8.7 620.8 620.8 621.8 1.050,650 50,768 351 9,984 12.3 621.9 621.9 622.6 0.752,710 52,933 446 11,630 10.0 624.6 624.6 625.3 0.754,230 54,520 485 12,120 11.7 625.0 625.0 625.7 0.755,150 55,370 661 17,577 9.6 627.2 627.2 628.1 0.957,630 57,704 1,621 21,237 11.4 628.9 628.9 629.2 0.360,310 60,340 874 14,898 12.9 630.4 630.4 631.4 1.061,450 61,724 564 11,206 10.0 633.9 633.9 634.8 0.9
66,490 270 7,333 11.5 639.3 639.3 640.3 1.070,490 249 6,257 13.4 644.0 644.0 644.6 0.674,490 305 6,898 12.1 653.4 653.4 653.8 0.480,010 367 8,595 9.0 670.2 670.2 670.7 0.582,820 239 5,978 11.7 672.7 672.7 673.3 0.685,550 290 7,119 9.8 676.6 676.6 677.4 0.887,090 282 6,015 11.6 677.6 677.6 678.4 0.890,130 304 5,954 11.7 681.3 681.3 682.0 0.791,177 434 7,508 9.6 685.0 685.0 686.0 1.092,191 233 6,145 11.8 687.3 687.3 687.9 0.693,334 261 7,494 9.7 689.5 689.5 690.3 0.8
1 Feet Above Dunlap Dam, As Shown On FIS Profile 2 Stream Station Per The DFIRM And RAS Model Cross-Sections
AGAH
ABACAD
AFAE
LMN
PQR
TUV
FLOODING SOURCE FLOODWAY
AA
W
S
O
XYZ
BASE FLOOD WATER SURFACE ELEVATION
TA
BL
E 9
FEDERAL EMERGENCY MANAGEMENT AGENCYCOMAL COUNTY, TEXAS
AND INCORPORATED AREAS
FLOODWAY DATA
GUADALUPE RIVER (LOWER REACH)
CROSS SECTION
Guadalupe River(Lower Reach)
(Continued)
FEET (NAVD 88, 2001 Adjustment) FEET (NAVD 88, 2001 Adjustment) FEET (NAVD 88)

CROSS SECTION DISTANCE 1WIDTH (FEET)
SECTION AREA
(SQUARE FEET)
MEAN VELOCITY (FEET PER SECOND)
REGULATORY WITHOUT FLOODWAY
WITH FLOODWAY
INCREASE
Guadalupe River(Lower Reach)
(Continued) AI 94,538 326 7,553 9.6 691.3 691.3 692.1 0.8AJ 96,774 354 8,661 8.7 694.2 694.2 695.1 0.9AK 97,634 390 8,580 8.8 695.1 695.1 696.0 0.9AL 98,997 494 9,360 8.0 697.1 697.1 698.0 0.9AM 99,892 279 5,543 13.6 697.1 697.1 698.1 1.0AN 101,095 327 7,419 10.1 701.0 701.0 701.8 0.8AO 102,580 281 6,740 11.1 703.1 703.1 703.8 0.7AP 103,354 224 6,361 11.6 704.0 704.0 704.7 0.7AQ 104,392 291 7,639 9.6 705.7 705.7 706.5 0.8AR 105,414 257 6,975 10.5 706.7 706.7 707.4 0.7AS 107,383 351 8,631 8.5 709.9 709.9 710.7 0.8AT 108,123 329 7,384 10.0 711.0 711.0 711.6 0.6AU 109,718 384 8,823 8.3 712.8 712.8 713.7 0.9AV 111,506 286 6,802 10.8 714.1 714.1 714.9 0.8AW 113,497 473 7,073 10.3 716.8 716.8 717.4 0.6AX 115,105 419 10,119 7.2 720.2 720.2 721.1 0.9AY 116,871 293 7,184 10.1 721.5 721.5 722.4 0.9AZ 118,276 753 13,028 5.6 723.9 723.9 724.9 1.0BA 120,467 191 5,191 9.8 725.0 725.0 725.9 0.9BB 121,358 237 5,722 8.9 726.1 726.1 726.9 0.8BC 122,243 252 6,211 8.2 726.9 726.9 727.8 0.9BD 123,903 180 5,074 10.0 727.8 727.8 728.6 0.8BE 124,923 203 4,804 10.6 728.9 728.9 729.6 0.7
1 Feet Above Dunlap Dam
FLOODING SOURCE FLOODWAYBASE FLOOD
WATER SURFACE ELEVATION
TA
BL
E 9
FEDERAL EMERGENCY MANAGEMENT AGENCYCOMAL COUNTY, TEXAS
AND INCORPORATED AREAS
FLOODWAY DATA
GUADALUPE RIVER (LOWER REACH)
FEET (NAVD 88, 2001 Adjustment) FEET (NAVD 88, 2001 Adjustment) FEET (NAVD 88)

CROSS SECTION DISTANCE 1WIDTH (FEET)
SECTION AREA
(SQUARE FEET)
MEAN VELOCITY (FEET PER SECOND)
REGULATORY WITHOUT FLOODWAY
WITH FLOODWAY
INCREASE
Guadalupe River(Lower Reach)
(Continued) BF 126,119 325 7,363 6.1 732.7 732.7 733.5 0.8BG 126,916 219 5,395 8.3 732.8 732.8 733.6 0.8BH 128,360 221 5,714 7.9 734.0 734.0 734.7 0.7BI 129,382 262 7,214 6.2 735.0 735.0 735.7 0.7BJ 130,448 295 6,585 6.8 735.3 735.3 736.0 0.7BK 131,508 223 4,984 7.7 736.0 736.0 736.7 0.7BL 132,574 271 5,807 6.6 737.2 737.2 737.8 0.6BM 133,957 244 5,045 7.2 738.8 738.8 739.7 0.9BN 135,126 235 5,153 7.0 739.9 739.9 740.8 0.9BO 135,924 171 4,238 8.5 740.4 740.4 741.3 0.9BP 137,547 191 4,451 8.1 741.9 741.9 742.8 0.9BQ 139,212 188 4,316 8.4 743.0 743.0 743.8 0.8BR 140,067 199 4,490 8.1 744.1 744.1 744.9 0.8BS 140,669 230 4,700 7.7 745.3 745.3 746.2 0.9BT 141,767 191 4,121 8.8 746.8 746.8 747.6 0.8BU 143,179 363 6,218 4.7 749.5 749.5 750.4 0.9BV 144,504 288 4,780 6.1 750.3 750.3 751.2 0.9BW 146,370 260 4,139 7.0 751.9 751.9 752.7 0.8BX 148,025 214 4,458 6.5 755.3 755.3 755.3 0.0BY 149,575 189 3,758 7.7 756.2 756.2 756.2 0.0BZ 150,506 138 2,786 5.0 757.2 757.2 757.4 0.2CA 151,332 140 2,911 4.8 757.5 757.5 757.8 0.3CB 153,509 155 2,690 5.2 758.2 758.2 758.8 0.6
1 Feet Above Dunlap Dam
FLOODING SOURCE FLOODWAYBASE FLOOD
WATER SURFACE ELEVATION
TA
BL
E 9
FEDERAL EMERGENCY MANAGEMENT AGENCYCOMAL COUNTY, TEXAS
AND INCORPORATED AREAS
FLOODWAY DATA
GUADALUPE RIVER (LOWER REACH)
FEET (NAVD 88, 2001 Adjustment) FEET (NAVD 88, 2001 Adjustment) FEET (NAVD 88)

CROSS SECTION DISTANCE WIDTH (FEET)
SECTION AREA
(SQUARE FEET)
MEAN VELOCITY (FEET PER SECOND)
REGULATORY WITHOUT FLOODWAY
WITH FLOODWAY
INCREASE
Guadalupe River(Lower Reach)
(Continued) CC 155,590 1 184 2,685 5.2 760.5 760.5 761.4 0.9CD 156,847 1 260 3,369 2.1 761.5 761.5 762.3 0.8CE 158,811 1 192 3,398 2.1 761.8 761.8 762.7 0.9CF 159,506 1 192 3,721 1.9 761.9 761.9 762.7 0.8CG 160,606 1 172 2,991 2.4 762.0 762.0 762.8 0.8CH 162,407 1 141 2,017 3.6 762.3 762.3 763.1 0.8CI 163,368 1 198 2,543 2.8 762.6 762.6 763.4 0.8
Guadalupe River(Upper Reach)
CJ 19,130 2 1,614 27,488 5.7 965.4 965.4 966.1 0.7CK 20,080 2 1,532 26,544 5.9 966.1 966.1 966.8 0.7CL 21,130 2 1,627 30,985 5.1 967.0 967.0 967.7 0.7CM 22,255 2 805 24,230 6.5 967.5 967.5 968.2 0.7CN 23,130 2 492 16,015 9.8 967.4 967.4 968.1 0.7CO 24,080 2 922 24,802 6.3 969.5 969.5 970.3 0.8CP 24,240 2 922 24,545 6.4 969.5 969.5 970.3 0.8CQ 25,130 2 1,262 28,267 5.5 970.1 970.1 970.9 0.8CR 26,130 2 2,245 59,988 2.6 970.6 970.6 971.4 0.8CS 27,500 2 1,053 19,761 7.9 970.6 970.6 971.4 0.8CT 29,110 2 674 13,846 11.4 973.6 973.6 974.4 0.8CU 30,110 2 665 14,626 10.8 975.5 975.5 976.0 0.5CV 31,110 2 891 18,171 8.7 977.3 977.3 978.0 0.7
1 Feet Above Dunlap Dam2 Feet Above Confluence With Canyon Lake
FLOODING SOURCE FLOODWAYBASE FLOOD
WATER SURFACE ELEVATION
TA
BL
E 9
FEDERAL EMERGENCY MANAGEMENT AGENCYCOMAL COUNTY, TEXAS
AND INCORPORATED AREAS
FLOODWAY DATA
GUADALUPE RIVER (LOWER REACH) / GUADALUPE RIVER (UPPER REACH)
FEET (NAVD 88, 2001 Adjustment) FEET (NAVD 88, 2001 Adjustment) FEET (NAVD 88)

CROSS SECTION DISTANCE 1WIDTH (FEET)
SECTION AREA
(SQUARE FEET)
MEAN VELOCITY (FEET PER SECOND)
REGULATORY WITHOUT FLOODWAY
WITH FLOODWAY
INCREASE
Guadalupe River(Upper Reach)
(Continued) CW 32,110 750 17,011 9.3 978.1 978.1 978.8 0.7CX 33,110 914 20,452 7.7 979.9 979.9 980.9 1.0CY 34,310 1,082 21,380 7.4 981.1 981.1 981.8 0.7CZ 35,110 2,053 20,183 7.8 981.8 981.8 982.6 0.8DA 36,110 2,526 24,381 6.5 983.1 983.1 983.9 0.8DB 37,110 2,721 24,373 6.5 984.0 984.0 984.8 0.8DC 38,110 3,000 24,232 6.5 984.8 984.8 985.6 0.8DD 39,110 3,003 31,142 5.1 985.6 985.6 986.4 0.8DE 40,110 2,552 32,646 4.8 986.1 986.1 986.9 0.8DF 41,110 1,429 30,719 5.2 986.5 986.5 987.3 0.8DG 42,110 486 12,821 12.3 986.5 986.5 987.3 0.8DH 43,140 529 15,159 10.4 988.6 988.6 989.4 0.8DI 44,110 568 16,505 9.6 990.0 990.0 990.7 0.7DJ 45,080 907 18,019 8.8 990.8 990.8 991.5 0.7DK 46,110 1,256 18,016 8.8 992.1 992.1 992.7 0.6DL 47,110 661 16,564 9.6 993.2 993.2 993.8 0.6DM 47,910 696 13,681 11.7 994.0 994.0 994.6 0.6DN 48,050 710 14,067 11.4 994.6 994.6 995.2 0.6DO 48,960 600 13,810 11.6 995.8 995.8 996.2 0.4DP 49,960 608 15,081 10.6 997.9 997.9 998.3 0.4DQ 50,960 566 13,406 12.0 998.7 998.7 999.1 0.4DR 51,960 722 16,612 9.7 1,001.8 1,001.8 1,002.2 0.4DS 52,560 711 15,827 10. 1 1,002.5 1,002.5 1,002.9 0.4DT 53,960 414 9,998 16.1 1,002.7 1,002.7 1,002.7 0.0DU 54,960 438 13,224 12. 1 1,008.2 1,008.2 1,008.8 0.6
1 Feet Above Confluence With Canyon Lake
FLOODING SOURCE FLOODWAYBASE FLOOD
WATER SURFACE ELEVATION
TA
BL
E 9
FEDERAL EMERGENCY MANAGEMENT AGENCYCOMAL COUNTY, TEXAS
AND INCORPORATED AREAS
FLOODWAY DATA
GUADALUPE RIVER (UPPER REACH)
FEET (NAVD 88, 2001 Adjustment) FEET (NAVD 88, 2001 Adjustment) FEET (NAVD 88)

CROSS SECTION DISTANCE 1WIDTH (FEET)
SECTION AREA
(SQUARE FEET)
MEAN VELOCITY (FEET PER SECOND)
REGULATORY WITHOUT FLOODWAY
WITH FLOODWAY
INCREASE
Guadalupe River(Upper Reach)
(Continued) DV 55,960 593 19,927 8.2 1,010.7 1,010.7 1,011.4 0.7DW 56,270 552 18,315 8.9 1,011.2 1,011.2 1,011.8 0.6DX 56,960 672 17,195 9.5 1,012.3 1,012.3 1,012.8 0.5DY 57,960 722 16,379 10.0 1,013.3 1,013.3 1,013.8 0.5DZ 58,960 618 16,135 10.2 1,014.6 1,014.6 1,015.3 0.7EA 59,960 507 16,242 10. 1 1,015.7 1,015.7 1,016.4 0.7EB 60,960 702 16,876 9.7 1,017.1 1,017.1 1,017.9 0.8EC 61,960 598 20,357 8.0 1,018.8 1,018.8 1,019.6 0.8ED 62,960 508 17,147 9.6 1,019.4 1,019.4 1,020.2 0.8EE 63,960 563 17,527 9.3 1,020.6 1,020.6 1,021.5 0.9EF 64,960 496 17,550 9.3 1,022.0 1,022.0 1,022.9 0.9EG 65,960 503 19,601 8.4 1,024.0 1,024.0 1,024.9 0.9EH 67,960 508 19,680 8.3 1,027.0 1,027.0 1,027.7 0.7EI 68,960 664 26,240 6.2 1,028.2 1,028.2 1,029.0 0.8EJ 69,960 591 24,008 6.8 1,028.9 1,028.9 1,029.7 0.8EK 70,960 447 16,483 9.9 1,029.1 1,029.1 1,029.9 0.8EL 71,960 683 22,589 7.3 1,030.8 1,030.8 1,031.6 0.8EM 72,960 611 22,863 7.2 1,031.5 1,031.5 1,032.3 0.8EN 73,960 875 24,145 6.8 1,032.3 1,032.3 1,033.1 0.8EO 74,960 957 25,442 6.4 1,033.2 1,033.2 1,034.0 0.8EP 75,960 578 21,158 7.7 1,034.1 1,034.1 1,034.9 0.8EQ 76,960 404 18,460 9.4 1,034.8 1,034.8 1,035.7 0.9ER 77,960 515 19,648 8.8 1,036.0 1,036.0 1,037.0 1.0ES 78,960 495 16,796 10.3 1,037.1 1,037.1 1,038.1 1.0ET 79,960 540 21,723 8.0 1,038.8 1,038.8 1,039.8 1.0
1 Feet Above Confluence With Canyon Lake
FLOODING SOURCE FLOODWAYBASE FLOOD
WATER SURFACE ELEVATION
TA
BL
E 9
FEDERAL EMERGENCY MANAGEMENT AGENCYCOMAL COUNTY, TEXAS
AND INCORPORATED AREAS
FLOODWAY DATA
GUADALUPE RIVER (UPPER REACH)
FEET (NAVD 88, 2001 Adjustment) FEET (NAVD 88, 2001 Adjustment) FEET (NAVD 88)

CROSS SECTION DISTANCE 1WIDTH (FEET)
SECTION AREA
(SQUARE FEET)
MEAN VELOCITY (FEET PER SECOND)
REGULATORY WITHOUT FLOODWAY
WITH FLOODWAY
INCREASE
Guadalupe River(Upper Reach)
(Continued) EU 80,960 569 18,380 9.4 1,039.4 1,039.4 1,040.4 1.0EV 81,960 612 23,193 7.5 1,041.5 1,041.5 1,042.5 1.0EW 82,960 571 17,376 10.0 1,041.8 1,041.8 1,042.7 0.9EX 83,960 427 17,237 10.1 1,044.0 1,044.0 1,044.9 0.9EY 84,960 508 19,417 8.9 1,045.0 1,045.0 1,045.9 0.9EZ 85,960 613 21,225 8.2 1,046.7 1,046.7 1,047.6 0.9FA 87,260 542 20,745 8.4 1,048.1 1,048.1 1,049.1 1.0FB 87,960 636 21,803 8.0 1,048.7 1,048.7 1,049.7 1.0FC 88,960 562 22,302 7.9 1,049.5 1,049.5 1,050.5 1.0FD 89,960 550 20,305 8.6 1,050.4 1,050.4 1,051.4 1.0FE 90,960 390 16,009 10.9 1,051.3 1,051.3 1,052.3 1.0FF 91,960 705 29,222 6.0 1,053.3 1,053.3 1,054.3 1.0FG 92,960 957 28,131 6.2 1,053.6 1,053.6 1,054.6 1.0FH 93,960 667 24,094 7.3 1,054.3 1,054.3 1,055.3 1.0FI 94,960 790 29,754 5.9 1,055.0 1,055.0 1,056.0 1.0FJ 95,960 1,654 20,835 8.4 1,056.1 1,056.1 1,057.1 1.0FK 96,940 1,784 23,527 7.4 1,058.1 1,058.1 1,059.1 1.0FL 97,960 1,624 23,251 7.5 1,059.7 1,059.7 1,060.7 1.0FM 98,960 1,730 31,651 5.5 1,061.3 1,061.3 1,062.2 0.9FN 99,960 910 26,843 6.5 1,061.9 1,061.9 1,062.8 0.9FO 100,960 376 15,359 11.4 1,062.7 1,062.7 1,063.6 0.9FP 101,960 696 19,370 9.0 1,064.7 1,064.7 1,065.6 0.9
1 Feet Above Confluence With Canyon Lake
FLOODING SOURCE FLOODWAYBASE FLOOD
WATER SURFACE ELEVATION
TA
BL
E 9
FEDERAL EMERGENCY MANAGEMENT AGENCYCOMAL COUNTY, TEXAS
AND INCORPORATED AREAS
FLOODWAY DATA
GUADALUPE RIVER (UPPER REACH)
FEET (NAVD 88, 2001 Adjustment) FEET (NAVD 88, 2001 Adjustment) FEET (NAVD 88)

CROSS SECTION DISTANCE WIDTH (FEET)
SECTION AREA
(SQUARE FEET)
MEAN VELOCITY (FEET PER SECOND)
REGULATORY WITHOUT FLOODWAY
WITH FLOODWAY
INCREASE
Indian CreekA 7,670 1 309 2,326 7.2 1,091.1 1,088.5 3 1,089.1 0.6B 8,600 1 370 3,088 5.4 1,092.5 1,092.4 3 1,093.4 1.0 C 9,880 1 481 3,077 5.4 1,096.7 1,096.7 1,097.5 0.8D 10,380 1 608 3,581 4.7 1,098.7 1,098.7 1,099.3 0.6E 10,880 1 545 3,574 4.7 1,103.6 1,100.5 1,100.9 0.4F 12,180 1 402 2,601 6.4 1,107.6 1,105.0 1,106.0 1.0G 12,830 1 414 2,512 6.6 1,110.9 1,109.0 1,109.8 0.8H 13,680 1 400 2,966 5.4 1,113.2 1,113.2 1,114.1 0.9I 14,850 1 272 2,141 6.5 1,117.9 1,117.9 1,118.5 0.6J 16,130 1 441 2,460 5.7 1,124.2 1,124.2 1,125.1 0.9
Indian CreekTributary A
A 2,020 2 572 1,292 3.6 1,089.9 1,089.9 1,089.9 0.0B 3,200 2 246 816 5.7 1,096.8 1,096.8 1,096.9 0.1
Indian CreekTributary B
A 6,540 2 657 777 2.9 1,104.0 1,104.0 1,104.0 0.0B 7,560 2 397 1,051 2.2 1,107.4 1,107.4 1,108.0 0.6C 9,260 2 300 363 6.3 1,117.7 1,117.7 1,117.7 0.0
Kelley CreekA 2,280 1 318 3,545 4.5 1,120.3 1,114.9 3 1,115.8 0.9B 3,160 1 299 2,757 5.8 1,123.6 1,117.4 3 1,118.3 0.9C 4,110 1 202 3,295 4.8 1,126.5 1,119.9 3 1,120.9 1.0
1 Feet Above Confluence With Cibolo Creek 3 Elevation Computed Without Consideration Of Backwater Effects2 Feet Above Confluence With Indian Creek
FLOODING SOURCE FLOODWAYBASE FLOOD
WATER SURFACE ELEVATION
TA
BL
E 9
FEDERAL EMERGENCY MANAGEMENT AGENCYCOMAL COUNTY, TEXAS
AND INCORPORATED AREAS
FLOODWAY DATA
INDIAN CREEK / INDIAN CREEK TRIBUTARIES A AND B / KELLEY CREEK
FEET (NAVD 88, 2001 Adjustment) FEET (NAVD 88, 2001 Adjustment) FEET (NAVD 88)

FIRM CROSS-SECTION 5
MAPPED DISTANCE WIDTH (FEET)
SECTION AREA
(SQUARE FEET)
MEAN VELOCITY (FEET PER SECOND)
REGULATORY WITHOUT FLOODWAY
WITH FLOODWAY
INCREASE
5,020 1 122 1,930 8.2 1,131.2 1,122.1 4 1,122.8 0.76,020 1 244 2,431 6.5 1,134.7 1,130.0 4 1,130.8 0.86,870 1 415 3,426 4.6 1,135.0 1,133.3 4 1,134.1 0.87,920 1 463 3,221 4.9 1,137.3 1,137.3 1,138.2 0.98,510 1 623 4,447 3.6 1,140.1 1,140.1 1,141.1 1.0
5,330 9,756 2 41 135 10.3 624.5 615.8 4 615.8 0.06,730 11,174 2 73 280 5.0 624.5 618.5 4 618.5 0.07,235 11,687 2 47 436 3.2 624.5 622.5 4 623.0 0.57,710 12,190 2 187 1,545 0.9 624.5 623.4 4 623.8 0.4
300 270 3 225 3,109 2.4 602.1 596.1 4 596.9 0.81,550 1,579 3 92 1,374 2.3 602.1 596.6 4 597.5 0.92,070 2,054 3 100 1,019 3.1 602.1 597.0 4 597.9 0.92,935 2,980 3 66 477 16.0 602.1 601.4 4 601.6 0.23,225 3,272 3 79 821 9.8 605.2 605.2 605.8 0.64,025 4,068 3 70 655 4.7 609.1 609.1 609.4 0.35,425 5,463 3 66 408 7.6 614.7 614.7 615.0 0.36,125 6,131 3 120 566 5.4 616.8 616.8 616.8 0.06,975 7,008 3 120 490 5.8 618.5 618.5 618.6 0.1
1 Feet Above Confluence With Cibolo Creek 4 Elevation Computed Without Consideration Of Backwater Effects2 Feet Above Confluence With Comal River, As Shown On FIS Profile 5 Stream Station Per The DFIRM And RAS Model Cross-Sections3 Feet Above Confluence With Guadalupe River, As Shown On FIS Profile
BASE FLOOD WATER SURFACE ELEVATION
TA
BL
E 9
FEDERAL EMERGENCY MANAGEMENT AGENCYCOMAL COUNTY, TEXAS
AND INCORPORATED AREAS
FLOODWAY DATA
KELLEY CREEK / NEW CHANNEL COMAL RIVER / NORTH GUADALUPE TRIBUTARY
CROSS SECTION
Kelley Creek(Continued)
D
FLOODING SOURCE FLOODWAY
B
A
H
North GuadalupeTributary
A
EFG
New Channel ComalRiver
BCD
HI
CDE
GF
FEET (NAVD 88, 2001 Adjustment) FEET (NAVD 88, 2001 Adjustment) FEET (NAVD 88)

FIRM CROSS-SECTION 4
MAPPED DISTANCE WIDTH (FEET)
SECTION AREA
(SQUARE FEET)
MEAN VELOCITY (FEET PER SECOND)
REGULATORY WITHOUT FLOODWAY
WITH FLOODWAY
INCREASE
8,025 8,045 1 120 456 6.9 621.4 621.4 621.6 0.28,925 8,957 1 100 480 5.8 626.9 626.9 627.0 0.1
10,075 10,104 1 71 352 7.9 629.9 629.9 630.5 0.610,825 10,852 1 140 490 6.7 633.0 633.0 633.6 0.611,135 11,153 1 257 601 4.6 635.3 635.3 635.4 0.111,885 11,882 1 120 533 3.2 642.9 642.9 643.1 0.212,950 12,873 1 48 197 9.0 647.8 647.8 647.8 0.013,950 13,904 1 94 259 3.8 655.2 655.2 655.5 0.314,475 14,430 1 48 156 6.4 657.9 657.9 657.9 0.015,625 15,488 1 100 186 2.9 675.6 675.6 675.6 0.0
10 10 2 110 934 7.3 617.7 605.2 3 606.1 0.91,000 890 2 84 854 8.0 617.7 607.9 3 608.8 0.91,400 1,175 2 92 1,160 5.9 617.7 612.3 3 612.4 0.12,200 1,987 2 98 1,344 5.1 617.7 613.0 3 613.3 0.32,900 2,679 2 126 1,802 3.8 617.7 613.5 3 614.0 0.54,460 4,202 2 128 1,431 4.8 617.7 614.12 3 614.7 0.65,850 5,556 2 121 1,232 5.5 617.7 615.8 3 616.7 0.96,170 5,894 2 125 1,115 6.1 617.7 616.5 3 617.1 0.67,180 6,932 2 160 1,458 4.7 618.7 618.7 619.7 1.07,900 7,692 2 130 1,199 5.7 620.5 620.5 621.2 0.7
1 Feet Above Confluence With Guadalupe River, As Shown On FIS Profile 3 Elevation Computed Without Consideration Of Backwater Effects2 Feet Above Confluence With Comal River, As Shown On FIS Profile 4 Stream Station Per The DFIRM And RAS Model Cross-Sections.
J
DEF
HG
RS
I
Old Channel ComalRiver
FLOODING SOURCE FLOODWAY
K
BASE FLOOD WATER SURFACE ELEVATION
TA
BL
E 9
FEDERAL EMERGENCY MANAGEMENT AGENCYCOMAL COUNTY, TEXAS
AND INCORPORATED AREAS
FLOODWAY DATA
NORTH GUADALUPE TRIBUTARY / OLD CHANNEL COMAL RIVER
CROSS SECTION
North GuadalupeTributary
(Continued)
ABC
J
LMN
Q
OP
FEET (NAVD 88, 2001 Adjustment) FEET (NAVD 88, 2001 Adjustment) FEET (NAVD 88)

CROSS SECTION DISTANCE 1WIDTH (FEET)
SECTION AREA
(SQUARE FEET)
MEAN VELOCITY (FEET PER SECOND)
REGULATORY WITHOUT FLOODWAY
WITH FLOODWAY
INCREASE
Rebecca CreekA 4,600 348 7,538 1.8 946.3 946.3 947.3 1.0B 6,600 208 3,278 4.1 947.0 947.0 948.0 1.0 C 7,460 248 3,752 3.5 950.2 950.2 950.7 0.5D 8,240 197 1,811 7.2 952.2 952.2 952.5 0.3E 9,000 236 2,356 5.5 955.3 955.3 955.8 0.5F 10,320 186 1,605 8.1 962.0 962.0 962.5 0.5G 11,320 280 1,852 7.0 967.2 967.2 967.5 0.3H 12,300 438 2,608 4.9 976.3 976.3 976.3 0.0I 13,370 292 1,870 6.8 980.0 980.0 980.0 0.0J 14,160 297 1,560 8.2 986.4 986.4 986.4 0.0K 14,920 236 1,615 7.8 991.8 991.8 991.8 0.0L 15,670 255 1,351 9.4 997.6 997.6 997.6 0.0M 17,470 202 1,559 8.0 1,012.4 1,012.4 1,012.4 0.0N 18,510 336 1,930 6.0 1,018.0 1,018.0 1,018.0 0.0O 19,660 108 805 14.5 1,029.3 1,029.3 1,029.3 0.0P 20,610 230 2,752 4.2 1,042.4 1,042.4 1,042.4 0.0Q 21,430 189 1,033 11.3 1,060.7 1,060.7 1,060.7 0.0R 21,660 377 1,877 6.2 1,067.1 1,067.1 1,067.1 0.0S 22,620 466 2,112 5.5 1,073.3 1,073.3 1,073.3 0.0T 23,650 212 1,309 8.9 1,081.7 1,081.7 1,081.7 0.0U 24,700 338 2,759 3.8 1,089.5 1,089.5 1,089.5 0.0V 25,650 207 1,784 5.8 1,091.6 1,091.6 1,091.6 0.0W 26,650 140 931 11.2 1,100.6 1,100.6 1,100.6 0.0X 27,650 146 1,412 7.4 1,112.6 1,112.6 1,112.6 0.0Y 28,100 149 810 12.8 1,119.2 1,119.2 1,119.2 0.0Z 28,650 230 1,731 6.0 1,130.7 1,130.7 1,130.7 0.0
AA 29,650 158 1,133 9.2 1,137.2 1,137.2 1,137.5 0.31 Feet Above Confluence With Guadalupe River
FLOODING SOURCE FLOODWAYBASE FLOOD
WATER SURFACE ELEVATION
TA
BL
E 9
FEDERAL EMERGENCY MANAGEMENT AGENCYCOMAL COUNTY, TEXAS
AND INCORPORATED AREAS
FLOODWAY DATA
REBECCA CREEK
FEET (NAVD 88, 2001 Adjustment) FEET (NAVD 88, 2001 Adjustment) FEET (NAVD 88)

FIRM CROSS-SECTION 4
MAPPED DISTANCE WIDTH (FEET)
SECTION AREA
(SQUARE FEET)
MEAN VELOCITY (FEET PER SECOND)
REGULATORY WITHOUT FLOODWAY
WITH FLOODWAY
INCREASE
30,750 1 301 2,296 2.6 1,144.0 1,144.0 1,145.0 1.031,510 1 219 1,159 5.1 1,148.9 1,148.9 1,149.4 0.532,010 1 215 1,027 5.7 1,153.3 1,153.3 1,153.7 0.433,200 1 156 924 6.3 1,163.5 1,163.5 1,164.0 0.534,000 1 136 755 7.8 1,172.4 1,172.4 1,172.9 0.535,000 1 245 834 3.4 1,182.0 1,182.0 1,182.4 0.4
340 1 67 163 8.9 740.2 740.2 740.2 0.01,340 1 68 290 5.0 747.6 747.6 747.8 0.22,340 1 331 318 4.6 763.5 763.5 763.5 0.03,020 1 453 1,333 1. 1 779.0 779.0 779.0 0.03,340 1 263 571 2.5 781.3 781.3 781.3 0.04,340 1 68 188 6.8 795.8 795.8 795.8 0.05,340 1 60 267 4.8 815.8 815.8 815.8 0.06,340 1 54 176 7.2 833.9 833.9 833.9 0.07,340 1 127 142 3.9 865.6 865.6 865.6 0.0
30 30 2 100 811 5.8 602.1 597.2 3 598.1 0.91,050 1,033 2 125 848 5.6 608.4 608.4 608.4 0.01,600 1,593 2 103 524 9.1 610.3 610.3 610.3 0.02,550 2,541 2 280 1,087 5.3 614.3 614.3 614.6 0.33,325 3,304 2 287 1,354 4.5 615.4 615.4 615.9 0.5
1 Feet Above Confluence With Guadalupe River 3 Elevation Computed Without Consideration Of Backwater Effects2 Feet Above Confluence With North Guadalupe Tributary, As Shown On FIS Profile 4 Stream Station Per The DFIRM And RAS Model Cross-Sections.
D
CD
South GuadalupeTributary
BA
Sattler Tributary
BC
ACADAE
AG
FLOODING SOURCE FLOODWAY
I
E
A
AF
FGH
BASE FLOOD WATER SURFACE ELEVATION
TA
BL
E 9
FEDERAL EMERGENCY MANAGEMENT AGENCYCOMAL COUNTY, TEXAS
AND INCORPORATED AREAS
FLOODWAY DATA
REBECCA CREEK / SATTLER TRIBUTARY / SOUTH GUADALUPE TRIBUTARY
CROSS SECTION
Rebecca Creek(Continued)
AB
E
FEET (NAVD 88, 2001 Adjustment) FEET (NAVD 88, 2001 Adjustment) FEET (NAVD 88)

FIRM CROSS-SECTION 4
MAPPED DISTANCE WIDTH (FEET)
SECTION AREA
(SQUARE FEET)
MEAN VELOCITY (FEET PER SECOND)
REGULATORY WITHOUT FLOODWAY
WITH FLOODWAY
INCREASE
4,250 4,224 1 400 1,612 3.6 616.2 616.2 617.0 0.85,155 5,194 1 300 1,167 4.3 618.0 618.0 619.0 1.05,773 5,788 1 177 891 5.2 620.0 620.0 620.1 0.16,750 6,788 1 85 345 13.3 623.0 623.0 623.0 0.06,890 6,844 1 360 692 6.7 626.6 626.6 626.6 0.07,250 7,234 1 73 357 12.6 628.8 628.8 628.8 0.08,100 7,991 1 96 653 6.9 633.7 633.7 633.7 0.09,080 8,973 1 113 534 8.4 635.1 635.1 635.6 0.59,670 9,527 1 103 605 7.4 638.1 638.1 638.1 0.0
10,300 10,157 1 229 940 5.0 639.6 639.6 639.9 0.310,675 10,547 1 286 699 9.1 641.5 641.5 641.9 0.411,900 11,736 1 180 583 7.7 646.9 646.9 647.2 0.313,885 13,669 1 89 303 11.3 656.1 656.1 656.1 0.014,695 14,471 1 130 593 3.6 661.6 661.6 661.6 0.015,532 15,423 1 130 261 8.2 669.1 669.1 669.3 0.2
154 2 84 750 4.8 780.3 779.1 3 779.7 0.61,225 2 131 1,196 3.0 785.9 785.9 786.6 0.71,915 2 122 936 3.9 787.8 787.8 788.3 0.53,088 2 168 1,183 3.0 793.2 793.2 794.2 1.04,247 2 175 1,347 2.7 796.7 796.7 797.7 1.05,424 2 168 952 0.4 797.9 797.9 798.9 1.06,263 2 180 680 0.5 798.0 798.0 799.0 1.0
1 Feet Above Confluence With North Guadalupe Tributary, As Shown On FIS Profile 3 Elevation Computed Without Consideration Of Backwater Effects2 Feet Above Confluence With Dry Comal Creek 4 Stream Station Per The DFIRM And RAS Model Cross-Sections.
BASE FLOOD WATER SURFACE ELEVATION
TA
BL
E 9
FEDERAL EMERGENCY MANAGEMENT AGENCYCOMAL COUNTY, TEXAS
AND INCORPORATED AREAS
FLOODWAY DATA
SOUTH GUADALUPE TRIBUTARY / UPPER DRY COMAL CREEK
CROSS SECTION
South GuadalupeTributary
(Continued)
G
FLOODING SOURCE FLOODWAY
Q
M
I
RST
FGH
JKL
NOP
EF
Upper Dry Comal CreekAB
DC
FEET (NAVD 88, 2001 Adjustment) FEET (NAVD 88, 2001 Adjustment) FEET (NAVD 88)

CROSS SECTION DISTANCE WIDTH (FEET)
SECTION AREA
(SQUARE FEET)
MEAN VELOCITY (FEET PER SECOND)
REGULATORY WITHOUT FLOODWAY
WITH FLOODWAY
INCREASE
West Fork Dry Comal Creek
A 317 1 97 829 6.8 781.7 781.7 782.0 0.3 B 1,074 1 132 827 6.8 789.7 789.7 790.0 0.3C 1,673 1 211 1,578 3.6 793.2 793.2 793.7 0.5D 2,749 1 187 1,331 4.2 796.1 796.1 796.3 0.2E 2,946 1 201 1,506 3.7 798.6 798.6 798.7 0.1F 4,029 1 145 1,277 4.4 802.2 802.2 802.3 0.1G 4,507 1 197 1,056 5.3 804.2 804.2 804.2 0.0H 4,726 1 170 1,916 2.9 809.7 809.7 809.8 0.1I 5,361 1 174 1,474 3.8 810.9 810.9 811.0 0.1J 5,707 1 203 1,511 3.7 812.6 812.6 812.7 0.1K 6,613 1 299 1,519 3.7 818.2 818.2 818.3 0.1L 7,807 1 202 1,442 3.9 823.8 823.8 823.8 0.0M 8,497 1 159 1,314 4.3 827.6 827.6 827.7 0.1N 8,874 1 188 1,941 2.9 831.7 831.7 831.8 0.1O 9,825 1 227 1,698 3.3 834.6 834.6 834.7 0.1P 10,720 1 288 1,946 2.9 840.0 840.0 840.5 0.5Q 11,055 1 358 1,764 3.2 841.4 841.4 841.5 0.1R 12,178 1 401 2,006 2.8 846.9 846.9 846.9 0.0S 12,707 1 322 1,705 3.3 850.3 850.3 850.4 0.1T 13,535 1 230 1,497 3.7 855.1 855.1 855.9 0.8U 14,349 1 195 2,312 0.7 855.6 855.6 856.5 0.9
West Fork TributaryA 330 2 120 787 2.9 801.9 801.9 802.9 1.0B 820 2 100 302 7.6 806.4 806.4 806.6 0.2
1 Feet Above Confluence With Dry Comal Creek2 Feet Above Confluence With West Fork Dry Comal Creek
FLOODING SOURCE FLOODWAYBASE FLOOD
WATER SURFACE ELEVATION
TA
BL
E 9
FEDERAL EMERGENCY MANAGEMENT AGENCYCOMAL COUNTY, TEXAS
AND INCORPORATED AREAS
FLOODWAY DATA
WEST FORK DRY COMAL CREEK / WEST FORK TRIBUTARY
FEET (NAVD 88, 2001 Adjustment) FEET (NAVD 88, 2001 Adjustment) FEET (NAVD 88)

CROSS SECTION DISTANCE WIDTH (FEET)
SECTION AREA
(SQUARE FEET)
MEAN VELOCITY (FEET PER SECOND)
REGULATORY WITHOUT FLOODWAY
WITH FLOODWAY
INCREASE
West Fork Tributary(Continued)
C 1,270 1 71 325 7.1 812.6 812.6 812.6 0.0 D 2,270 1 139 528 4.4 818.8 818.8 819.4 0.6E 3,630 1 119 346 6.7 830.9 830.9 830.9 0.0F 4,630 1 213 213 5.0 843.4 843.4 843.5 0.1G 5,630 1 122 122 4.9 851.7 851.7 851.8 0.1
York CreekA -440 2 912 3 5,028 3.7 569.4 569.4 570.3 0.9B 860 2 1,082 5,869 3.2 571.5 571.5 572.2 0.7C 2,360 2 1,864 5,117 3.6 576.0 576.0 576.6 0.6D 3,360 2 1,159 5,402 3.5 580.5 580.5 581.5 1.0E 4,360 2 1,641 4,951 3.8 583.9 583.9 584.5 0.6F 5,360 2 1,513 4,653 4.0 589.2 589.2 589.7 0.5G 6,560 2 1,020 4,407 4.2 594.2 594.2 594.7 0.5H 7,620 2 316 3,226 5.8 597.0 597.0 597.6 0.6I 7,900 2 287 2,934 6.4 598.0 598.0 598.6 0.6J 9,150 2 146 1,357 6.9 600.8 600.8 601.3 0.5K 10,250 2 211 2,214 4.2 603.2 603.2 603.5 0.3L 11,250 2 190 1,900 4.9 604.1 604.1 604.4 0.3M 12,650 2 203 1,366 6.8 607.8 607.8 608.0 0.2N 13,310 2 92 899 10.4 614.9 614.9 614.9 0.0O 13,750 2 120 1,366 6.8 618.1 618.1 618.1 0.0P 14,350 2 93 947 9.9 620.3 620.3 620.4 0.1Q 14,830 2 224 1,865 3.3 623.3 623.3 623.4 0.1R 15,830 2 83 719 8.5 625.9 625.9 626.5 0.6
1 Feet Above Confluence With West Fork Dry Comal Creek 3 Width Extends Beyond County Boundary2 Feet Above County Boundary
FLOODING SOURCE FLOODWAYBASE FLOOD
WATER SURFACE ELEVATION
TA
BL
E 9
FEDERAL EMERGENCY MANAGEMENT AGENCYCOMAL COUNTY, TEXAS
AND INCORPORATED AREAS
FLOODWAY DATA
WEST FORK TRIBUTARY / YORK CREEK
FEET (NAVD 88, 2001 Adjustment) FEET (NAVD 88, 2001 Adjustment) FEET (NAVD 88)

CROSS SECTION DISTANCE 1WIDTH (FEET)
SECTION AREA
(SQUARE FEET)
MEAN VELOCITY (FEET PER SECOND)
REGULATORY WITHOUT FLOODWAY
WITH FLOODWAY
INCREASE
York Creek(Continued)
S 16,630 127 1,205 3.6 629.8 629.8 630.8 1.0 T 17,830 135 788 5.5 634.6 634.6 635.0 0.4U 18,880 115 618 7.0 643.5 643.5 643.5 0.0V 20,120 243 1,268 3.4 651.8 651.8 652.3 0.5W 20,830 223 867 5.0 655.8 655.8 656.0 0.2X 21,830 120 577 7.4 667.0 667.0 667.2 0.2
1 Feet Above County Boudary
FLOODING SOURCE FLOODWAYBASE FLOOD
WATER SURFACE ELEVATION
TA
BL
E 9
FEDERAL EMERGENCY MANAGEMENT AGENCYCOMAL COUNTY, TEXAS
AND INCORPORATED AREAS
FLOODWAY DATA
YORK CREEK
FEET (NAVD 88, 2001 Adjustment) FEET (NAVD 88, 2001 Adjustment) FEET (NAVD 88)

CROSS SECTION DISTANCE WIDTH (FEET)
SECTION AREA
(SQUARE FEET)
MEAN VELOCITY (FEET PER SECOND)
REGULATORY WITHOUT FLOODWAY
WITH FLOODWAY
INCREASE
Swine CreekA 21,328 1 158 479 6.5 1,123.2 1,123.2 1,123.7 0.5B 22,523 1 140 483 6.5 1,136.1 1,136.1 1,136.7 0.6 C 23,778 1 235 640 4.4 1,154.9 1,154.9 1,155.1 0.2D 24,733 1 145 458 6.2 1,165.6 1,165.6 1,166.1 0.5E 26,183 1 52 163 7.6 1,190.3 1,190.3 1,190.3 0.0
Tribuary No.1 to Swine Creek
A 1,150 2 98 521 7.6 1,119.0 1,119.0 1,119.2 0.2B 2,050 2 190 772 5.1 1,124.4 1,124.4 1,125.2 0.8C 2,650 2 337 915 4.3 1,129.3 1,129.3 1,129.3 0.0
Unnamed Tributary toTribuary No.1 to
Swine CreekA 390 3 126 149 4.5 1,118.6 1,116.2 5 1,116.2 0.0B 985 3 145 224 3.0 1,123.6 1,123.6 1,123.7 0.1
Tribuary No.1 to Swine Creek
A 570 4 70 108 3.2 1,144.7 1,144.7 1,145.6 0.9B 1,935 4 34 56 6.1 1,173.3 1,173.3 1,173.3 0.0C 2,815 4 14 24 7.1 1,208.6 1,208.6 1,208.6 0.0
1 Distance in feet above confluence with Guadalupe River 3 Distance in feet above confluence with Tributary No. 1 to Swine Creek2 Distance in feet above confluence with Swine Creek 4 Distance in feet above confluence with Swine Creek5 Elevation computed without consiering backwater effects from Tributary No.1 to Swine Creek
FLOODING SOURCE FLOODWAY BASE FLOOD WATER SURFACE ELEVATION
TA
BL
E 9
FEDERAL EMERGENCY MANAGEMENT AGENCYCOMAL COUNTY, TEXAS
AND INCORPORATED AREAS
FLOODWAY DATA
Swine Creek/Tribuary No.1 to Swine Creek/ Unnamed Tributary to Tribuary No.1 to Swine Creek/ Tribuary No.2 to Swine Creek
FEET (NAVD 88, 2001 Adjustment) FEET (NAVD 88, 2001 Adjustment) FEET (NAVD 88)

76
5.0 INSURANCE APPLICATIONS For flood insurance rating purposes, flood insurance zone designations are assigned to a community based on the results of the engineering analyses. These zones are as follows: Zone A Zone A is the flood insurance rate zone that corresponds to the 1-percent-annual-chance floodplains that are determined in the FIS report by approximate methods. Because detailed hydraulic analyses are not performed for such areas, no base (1-percent-annual-chance) flood elevations (BFEs) or depths are shown within this zone. Zone AE Zone AE is the flood insurance rate zone that corresponds to the 1-percent-annual-chance floodplains that are determined in the FIS report by detailed methods. Whole-foot BFEs derived from the detailed hydraulic analyses are shown at selected intervals within this zone. Zone AO Zone AO is the flood insurance rate zone that corresponds to areas of 1-percent-annual-chance shallow flooding (usually sheet flow on sloping terrain) where average depths are between 1 and 3 feet. Average whole-foot depths derived from the detailed hydraulic analyses are shown within this zone. Zone X Zone X is the flood insurance rate zone that corresponds to areas outside the 0.2-percent-annual-chance floodplain, areas within the 0.2-percent-annual-chance floodplain, areas of 1-percent-annual-chance flooding where average depths are less than 1 foot, areas of 1-percent-annual-chance flooding where the contributing drainage area is less than 1 square mile (sq. mi.), and areas protected from the base flood by levees. No BFEs or depths are shown within this zone.
6.0 FLOOD INSURANCE RATE MAP
The FIRM is designed for flood insurance and floodplain management applications. For flood insurance applications, the map designates flood insurance rate zones as described in Section 5.0 and, in the 1-percent-annual-chance floodplains that were studied by detailed methods, shows selected whole-foot BFEs or average depths. Insurance agents use zones and BFEs in conjunction with information on structures and their contents to assign premium rates for flood insurance policies. For floodplain management applications, the map shows by tints, screens, and symbols, the 1- and 0.2-percent-annual-chance floodplains, floodways, and the locations of selected cross sections used in the hydraulic analyses and floodway computations.

COMMUNITY NAME INITIAL IDENTIFICATION FIRM EFFECTIVE DATE FIRM REVISION
DATE(S)
Comal County, November 9, 1973 November 9, 1973 July 1, 1974Unincorporated Areas May 14, 1976
September 29, 1986February 4, 1988June 15, 1988July 17, 1995
Bulverde, City of November 9, 1973 November 9, 1973 July 1, 1974May 14, 1976September 29, 1986February 4, 1988June 15, 1988July 17, 1995
Fair Oaks Ranch, City of Septermber 2, 2009 Septermber 2, 2009 None
Garden Ridge, City of October 25, 1974 April 30, 1986 None
New Braunfels, City of December 2, 1972 December 2, 1972 November 9, 1973July 1, 1974September 12, 1975May 7, 1976June 17, 1986May 15, 1991January 5, 2006
Schertz, City of March 1, 1974 September 15, 1977 September 30, 1992August 6, 1976 July 17, 1995
Selma, City of December 7, 1974 July 2, 1980 None
January 30, 1976
None
None
COMMUNITY MAP HISTORY
FLOOD HAZARD BOUNDARY MAP REVISION DATE(S)
None
TA
BL
E 10
FEDERAL EMERGENCY MANAGEMENT AGENCYCOMAL COUNTY, TEXAS
AND INCORPORATED AREAS
None
None
None

78
The countywide FIRM presents flooding information for the entire geographic area of Comal County. Previously, FIRMs were prepared for each incorporated community and the unincorporated areas of the County identified as flood-prone. This countywide FIRM also includes flood-hazard information that was presented separately on Flood Boundary and Floodway Maps (FBFM’s), where applicable. Historical data relating to the maps prepared for each community are presented in Table 10, “Community Map History.”
7.0 OTHER STUDIES
No previous studies have been prepared for the countywide Comal County Flood Insurance Study. However, a countywide FIS was being finalized for Guadalupe County at the time of the Comal County FIS preparation. Also, an update of the Bexar County FIS was being performed with a tentative release date of 2007 or 2008. The hydrologic and hydraulic analyses for the reach of Cibolo Creek from upstream of Interstate Highway 10 to the Comal/Guadalupe County line are based on preliminary models prepared by the USACE Fort Worth District, in support of an ongoing Planning Study for the San Antonio River Authority, the Guadalupe Blanco River Authority and the San Antonio Water System. The USACE study is not complete at the time of this FIS report preparation and both the hydrology and hydraulics modeling are subject to revisions. The USACE modeling represents the best available data for this reach of Cibolo Creek at this time. Drainage improvements were being designed in the year 2004 by the Comal County Road Department on Schoenthal Road along Bear Creek in the Dry Comal Creek Watershed that would construct 10-foot x 10-foot x 10-foot box culverts in the place of the existing low water crossing. Construction had not started at the time of the countywide FIS report preparation, and the new culverts are not included in the FIS. A large dry detention facility has also been designed along Dry Comal Creek by CH2M Hill (Dry Comal Creek Dam – Site 11). The construction plans were at the review stage at the time of the FIS report preparation and the facility is not included in the FIS. A Flood Control project along the South Tributary was under development at the time of the FIS report publication. The project includes channel modifications and storm water detention considering multi-use facilities (trails and recreation fields). Construction is anticipated to be complete by 2007. This FIS report either supersedes or is compatible with all previous studies published on streams studied in this report and should be considered authoritative for the purposes of the NFIP.
8.0 LOCATION OF DATA
Information concerning the pertinent data used in the preparation of this study can be obtained by contacting Federal Insurance and Mitigation Division, FEMA Region VI, Federal Regional Center, Room 206, 800 North Loop 288, Denton, Texas 76201-3698.

79
9.0 BIBLIOGRAPHY AND REFERENCES
1. Federal Emergency Management Agency, Flood Insurance Study, Comal County, Texas (Unincorporated Areas), Washington D.C., July 17, 1995.
2. Federal Emergency Management Agency, Flood Insurance Study, City of Garden Ridge, Texas (Unincorporated Areas), Washington D.C., April 30, 1986.
3. Federal Emergency Management Agency, Flood Insurance Study, City of New Braunfels, Comal and Guadalupe Counties, Texas, Washington D.C., Preliminary, 2005.
4. Federal Emergency Management Agency, Flood Insurance Study, City of Schertz, Bexar, Comal and Guadalupe Counties, Texas, Washington D.C., September 30, 1992.
5. Federal Emergency Management Agency, Flood Insurance Study, Bexar County, Texas, and Incorporated Areas, Washington D.C., January 4, 2002.
6. Texas State Library and Archives Commission website, Source: U.S. Census Bureau, Census 2000 Data for the State of Texas, Last Revised: May 28, 2003. <http://www.tsl.state.tx.us/ref/abouttx/popcnty12000.html>
7. Texas State Library and Archives Commission website, Source: U.S. Census Bureau, Census 2000 Data for the State of Texas, Last Revised: May 28, 2003. <http://www.tsl.state.tx.us/ref/abouttx/popcity12000.html>
8. State of Texas, Water Development Board, Texas Water Commission Bulletin 6311, Floods in
Texas, Magnitude and Frequency of Peak Flows, Austin, Texas, December 1963.
9. U.S. Department of the Interior, Geological Survey, Water-Supply Paper 1682, Surface Water Supply of the United States, Part 8, Western Gulf of Mexico Basins, Washington, D.C., 1965.
10. U.S. Department of the Interior, Geological Survey, Water-Supply Paper 1923, Surface Water
Supply of the United States, Part 8, Western Gulf of Mexico Basins, 1961-1965, Washington, D.C., 1970.
11. U.S. Department of the Interior, Geological Survey, Water-Supply Paper 2123, Surface Water
Supply of the United States, Part 8, Western Gulf of Mexico Basins, 1966-1970, Washington, D.C., 1974.
12. U.S. Department of the Interior, Geological Survey, Water Resources Data for Texas, 1971-1981,
Three Volumes, Published 1972-1982.
13. U.S. Department of Agriculture, Soil Conservation Service, Special Storm Report, Storm of May 11-12, 1972, New Braunfels, Texas, Temple, Texas.
14. U.S. Department of Commerce, National Weather Service, NDS Report 79-1, The Disastrous Texas Floods of August 1-4, 1978, Washington, D.C., March 1979.
15. U.S. Department of the Interior, Geological Survey, Open-File Report, Flood in Central Texas, August 1978, Washington, D.C., April 1979.
16. CH2M Hill, Milestone II Report: City of New Braunfels FIS Update, May 2003.

80
17. Slade, R. M., Persky, Kristie., Geological Survey (U.S.), Floods in the San Antonio and Guadalupe River Basins in Texas, Reston, Virginia, October 1998.
18. Watershed Concepts, FEMA 1425-DR-TX, Central Texas Disaster Recovery Assistance, July 2002 Flood High Water Mark Survey Report, July 25, 2002, Revised August 16, 2002, Revised October 29, 2002.
19. Colwick, Allan B., McGill, H.N., Erichsen, F.P., Severe Floods at New Braunfels, TX, May 1972, June 1973.
20. Soil Conservation Service, Special Storm Report, Storm of May 11-12, 1972, New Braunfels, Texas.
21. U.S. Department of the Interior, Geological Survey, Floods in the Guadalupe and San Antonio River Basins in Texas, October 1998, September 1999.
22. State of Texas, Water Development Board, Report 126, Engineering Data on Dams and Reservoirs in Texas, Part III, Austin, Texas, February 1971.
23. U.S. Army Corps of Engineers, Fort Worth District, FWDR 1130-2-16, Guadalupe River Basin
Guadalupe River, Texas, Canyon Lake Reservoir Regulation, Fort Worth, Texas, April 1971.
24. U.S. Department of Agriculture, Soil Conservation Service, Watershed Work Plan for Watershed Protection and Flood Prevention, Comal River Watershed, Temple, Texas, August 1968.
25. Federal Emergency Management Agency, Flood Insurance Study, City of Boerne, Kendall
County, Texas (Unpublished).
26. U.S. Army Corps of Engineers, Spillway Design Flood Inflow-Outflow Hydrographs, Guadalupe River Basin, Texas, Canyon Reservoir, Guadalupe River, Texas, 1958-1969.
27. U.S. Department of the Interior, Geological Survey, Water-Supply Paper 1682, Surface Water
Supply of the United States, Part 8, Western Gulf of Mexico Basins, 1961-1965, Washington D.C., 1965.
28. U.S. Department of Agriculture, Soil Conservation Service, Watershed Work Plan for Watershed
Protection and Flood Protection, Comal River Watershed, Temple, Texas, August 1968.
29. City of New Braunfels, Texas, Drainage and Erosion Control Manual, September, 2000.
30. Natural Resources Conservation Service, Technical Release TR-55, Urban Hydrology for Small Watersheds, June, 1986.
31. U.S. Department of Agriculture, Soil Conservation Service, National Engineering Handbook: Section 4, Hydrology, Washington D.C., revised 1985.
32. Spectrum Mapping, LLC, Guadalupe, Texas, Final Report, Denver, Colorado, May 2004.
33. Landata, Topographic Maps, Scale 1:6,000, Contour Interval 2 feet, 2001.
34. Texas Natural Resources Information System Website, USGS 30-meter National Elevation Dataset Digital Elevation Model (DEM). <http://www.tnris.org/DigitalData/DEMs/dems.htm>
35. U.S. Department of Agriculture, Natural Resources Conservation Service website, STATSGO database, <http://www.tx.nrcs.usda.gov/soils_links.html>

81
36. U.S. Army Corps of Engineers, Hydrologic Engineering Center, HEC-RAS Analysis System, Version 3.1.2, Davis, California, April 2004.
37. U.S. Army Corps of Engineers, Hydrologic Engineering Center, HEC-HMS Version 2.2.2, Davis, California, May 2003.
38. Tobin International Ltd., San Antonio, Texas, Year 2003 0.5 foot resolution B&W Ortho-Imagery, Mr. SID format: Unpublished proprietary data.
39. U.S. Department of the Interior, Geological Survey, Office of Water Data Collection, Interagency Advisory Committee on Water Data, "Guidelines for Determining Flood Flow Frequency," Bulletin 17B, Reston, Virginia, Revised September 1981.
40. U.S. Department of the Interior, Geological Survey, Water Resources Investigations, Open-File Report No. 77-110, Technique for Estimating the Magnitude and Frequency of Floods in Texas, 1977.
41. Texas State Department of Highways and Public Transportation, Hydraulic Manual, Texas, September 1970.
42. U.S. Army Corps of Engineers, Hydrologic Engineering Center, HEC-l Flood Hydrograph Package, Davis, California, October 1970, with updates.
43. U.S. Army Corps of Engineers, Hydrologic Engineering Center, HEC-2 Water Surface Profiles, Generalized Computer Program, Davis, California, April 1976, with updates.
44. U.S. Department of Agriculture, Soil Conservation Service, Technical Release No. 20, Computer Program, Project Formulation, Hydrology, Washington, D.C., 1965.
45. William H. Asquith and Raymond M. Slade, Jr., Regional Equations for Estimation of Peak-Streamflow Frequency for Natural Basins in Texas, U.S. Geological Survey, Water-Resources Investigations Report 96-4307, March 2000, second printing.
46. U.S. Army Corps of Engineers, Fort Worth District, FWDR 1130-2-16, Guadalupe River Basin Guadalupe River, Texas, Canyon Lake Reservoir Regulation, Fort Worth, Texas, April 1971.
47. U.S. Army Corps of Engineers, Hydrologic Engineering Center, HEC-RAS River Analysis System, Version 3.0.1, Davis, California, March 2001.
48. Chow, Ven Te, “Open Channel Hydraulics,” McGraw-Hill Book Company, New York, New York, 1959.
49. Tobin Research, Inc. Topographic Maps Complied From Aerial Photographs, Scale 1:4,800, Contour Interval 4 Feet, Comal County, Texas, January 1982.
50. Federal Emergency Management Agency, Flood Insurance Study, Unincorporated Areas of Comal County, Texas, Washington, D.C., January 3, 1985.