Columbia Sportswear
17
Michael Kors Holding Ltd Discussion Materials Xucheng Lyu | Edward De Cabooter | Adam Bodrick | Fei Qiu Columbia Sportswear Company
-
Upload
xucheng-lyu -
Category
Documents
-
view
2.388 -
download
2
Transcript of Columbia Sportswear

Michael Kors Holding Ltd
Discussion Materials
Xucheng Lyu | Edward De Cabooter | Adam Bodrick | Fei Qiu
Columbia Sportswear Company

Industry Overview
2
Positioning Analysis
Potential Buyers & Rationale
Valuation Observations
LBO Recommendation
Page 4
Page 6
Page 8
Page 9
Page 17
Table of Contents

Columbia Sportswear positioning as an independent leading active lifestyle apparel, footwear, accessories and equipment company with exceptional growth potential, a solid financial performance, and limited debt will attract the interest from both strategic and financial buyers.
Industry Overview
3
Positioning Analysis
Potential Buyers & Rationale
LBO Recommendation
Valuation Observations
Executive Summary
Apparel/Accessories $225bn industry within the U.S (2015), key drivers are macro economic outlook, per capita disposable income, recreational expenditure, and increased external competition
Mature industry, revenue growth rate similar to US economy, level of concentration is high, increased competition within industry
Growth via vertical and horizontal integration, niche markets with higher margins, and global expansion
Columbia Sportswear is global leader in designing, sourcing, marketing, and distributing outdoor and active lifestyle apparel, footwear accessories and equipment
Continued growth in North America, focus on direct-to-consumer business, as well as expansion abroad Quality executive team, workforce and operations with a track record of success
Strategic buyers focused on expanding customer base, increasing geographic footprint, capturing market share, and increasing buying power
Financial buyers seeking a target that has a lot of opportunities to grow abroad and has considerable room for improvement within its core market
Columbia Sportswear is not a desirable target as a leveraged buyout candidate. The implied IRR is 12.1% based on our analysis. Too low compared to a target IRR larger than 20%
Columbia Sportswear is not able to generate strong enough cash flows to repay and service its debt
Valued Columbia Sportswear using comparable, precedent transactions, DCF, and Leverage Buyout analysis to get the understanding of company’s valuation
Preliminary valuation yields EBITDA multiple range of 10.5x-12.5x, and EV range of $3215.1MM-3827.5MM, implying a share price ranging from $47.48-$56.19 per share

$1,105 B revenue in 2015
Sources: Statista Apparel Retailherfindahl-hirschman-indexIbisWorldIndustryReport Hiking & Outdoor equipment storesDeloitte Global Luxury Goods report (2015)
Apparel and Accessories Industry Overview
Industry volatility dependent on macro economic environment; average beta 1.03
Level of Technology: medium
Capital intensity: low
Concentration level: high to medium
Globalization level: low
Industry average gross margin: 33.92%
Organic and inorganic growth
Average Operating margin: 3.87%
Industry average net margin: 2.34%
Industry life cycle: mature
Long-term industry growth rate: 1% to 2%
Regulatory Level: medium and steady
Barriers to entry: low
Competition level: medium
4
Apparel and Accessories Industry Overview
Nike controls 2.8% of the global market, one of the largest in the industry
Colombia Sportswear has .00208% of the global market

Growth Drivers Risk Environment
- Vertical and horizontal integration, economies of scale; buying power
- International expansion
- Upcoming and untapped market segments, technical innovation
- Company owned retail channels (stores and online)
Industry Outlook
5
• Macro economic conditions
• Mature industry with increased competition, vertical/horizontal integration, and industry consolidation may adversely impact margins, ability to retain customers, maintain market share, revenue growth rate, and profitability
• Company owned retail channels (stores and online) – industry wide push for more control
• Global expansion
• Intellectual property right disputes
• Currency Exchange Rate Fluctuations
• Low switching costs
• Fashion trend
Sources: IBISWorld Industry Report 42441 Grocery Wholesaling in the UShttp://www.justice.gov/atr/herfindahl-hirschman-indexGrant Thornton Wholesale and Distribution Industry Key Performance Indicators (KPIs)
- Industry consolidation, increased competition, threat of new entrants
- Unable to penetrate untapped market segments
- Fashion trend
- Sourcing, manufacturing, and transportation

Positioning Analysis
6
2012-2020 Revenue Snapshot
Sales by Products and Geographic Segments
• Large customers have developed significant private label brands during the past decade that compete directly with our products - reduced access to production capacity, challenges in obtaining favorable locations for our retail stores, reductions in display areas in retail locations
• Working capital assets accounted for approximately 71% of total assets, degree to which efficiently utilize working capital assets has a significant effect on financials
• Small size results in reduced buying power, leverage over upstream and downstream business partners – no long term contracts
• Ability to forecast, produce, and deliver product styles that matches ultimate seasonal wholesale customer and end-consumer demand can significantly affect sales
• 17 countries, 68% from China and Vietnam, a few key suppliers
• Expand globally and increase company owned retail channels (stores and online) – increase control and innovation
• Revenue growth rate above industry average revenue growth rate (2015 at 10.7% vs industry average of 2.0%)
• Climate changeSources: Colombia Sportswear 10-k
2011-2017 Sales Snapshot
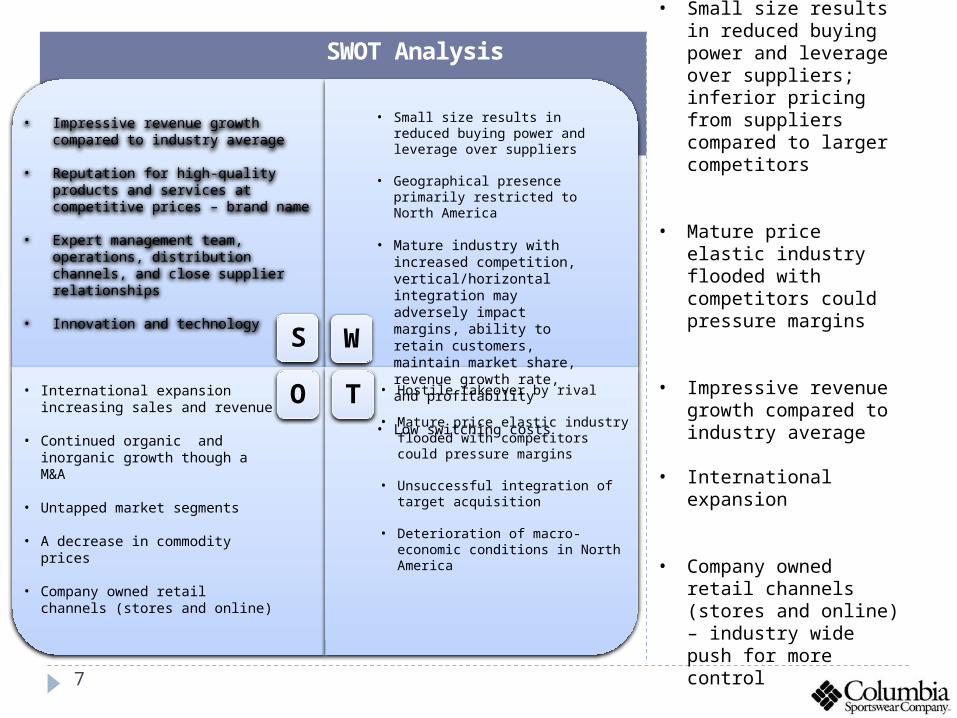
SWOT Analysis
7
S
• Impressive revenue growth compared to industry average
• Reputation for high-quality products and services at competitive prices – brand name
• Expert management team, operations, distribution channels, and close supplier relationships
• Innovation and technology
• Small size results in reduced buying power and leverage over suppliers
• Geographical presence primarily restricted to North America
• Mature industry with increased competition, vertical/horizontal integration may adversely impact margins, ability to retain customers, maintain market share, revenue growth rate, and profitability
• Low switching costs
• International expansion increasing sales and revenue
• Continued organic and inorganic growth though a M&A
• Untapped market segments
• A decrease in commodity prices
• Company owned retail channels (stores and online)
• Hostile takeover by rival
• Mature price elastic industry flooded with competitors could pressure margins
• Unsuccessful integration of target acquisition
• Deterioration of macro-economic conditions in North America
• Small size results in reduced buying power and leverage over suppliers; inferior pricing from suppliers compared to larger competitors
• Mature price elastic industry flooded with competitors could pressure margins
• Impressive revenue growth compared to industry average
• International expansion
• Company owned retail channels (stores and online) – industry wide push for more control
W
TO

Sponsor Description Geography Recent Activity Rationale Criteria Investment Size AUM($MM)
Selected Potential Financial Buyers
8
Permira
Sycamore Partners
Leonard Green and Partners
KKR & Co. L.P.
Catterton
Permira supports companies global ambitions, helps them find acquisition targets, attract new senior members to
their boards and assist them in developing new strategic relationships.
A private equity firm based in New York specializing in retail and consumer
investments. Our strategy is to partner with management teams to improve the
operating profitability and strategic value of their businesses
Leading private equity firm that has invested in 75 companies in the form of
traditional buyouts, going-private transactions, recapitalizations, growth
capital investments, corporate carve-outs and selective public equity and debt
positions.
KKR is a leading global investment firm that manages investments across multiple asset classes including
private equity, energy, infrastructure, real estate
Catterton has made over 100 investments in leading consumer brands across all segments of the
consumer industry.
US, Middle East and Asia
North America
North America
Americas, EMEIA, and Asia-Pacific
North America
Permira recently sold one of its fashion apparel brands
New Look for approx. $1.2 billion. Permira has owned New Look
for the past 11 years
Recently finalizing the acquisition of Belk a
department store for up to $3.5 billion
Affiliate of Leonard Green and Partners has agreed to acquire LifeTime Fitness in a deal valued at $4.0
Billion
Subsidiary of KKR called 58.com, a multi-category
online marketplace recently raised $300 Million with KKR
assistance
Recently invested in Sweaty Betty a women’s indoor and outdoor active
wear company
Consumer PE division, they have acquired numerous
fashion and apparel companies such as Hugo Boss (2007), Dr. Martens (2014), and Cortefeil
(2005)
Sycamore Partners has a proven track record of retail success with a portfolio that consist of mostly specialty apparel companies such as
Aeropostale, Coldwater Creek, Hot Topic
Very strong track record of retail acquisitions in both fashion apparel and sports
apparel
Have acquired numerous apparel companies as well as an outdoor athletic apparel company called Academy
Sports + Outdoors
Dedicated to growing middle market companies and emerging, high-growth enterprises, we are the largest and most experienced consumer-focused private equity
group in North America.
Investments that enhance product offering, improve
geographic coverage, or lead industry consolidation
N/A
Cash Flow positive business, with an ability to grow by at least 50% in a five year period
N/A
Valuations from $100 - $1 Billion
Not specified, but have made
investments as large as $8.07 Billion in their
consumer division
Largest Acquisition has been $4
Billion
N/A
$100MM – $1Billion
Has raised as much as $2.1 Billion in a recent fund raising
$38,000
$3,500
$15,000
$101,000
$4,000
Source: Bloomberg

• Selected comparables were chosen on basis of industry, % of 52-wk high, Size, and LTM EBITDA Margin; allowing
Columbia Sportswear to be benchmarked against industry leaders. These Comparable companies were divided into large-
cap, mid-cap, and small-cap companies based on market capitalization• Comparable analysis provided an implied Enterprise Value range of $3215.1MM-$3827.5MM at 10.5x-12.5x
EBTIDA• Implied share price range of $47.48-$56.19 per share
Selected Company Comparable
9
Comparable Company Analysis ($ in millions)
Source: Bloomberg

10Sources: Bloomberg
Financial Transaction Environment Overview:
2010 Q1
2010 Q2
2010 Q3
2010 Q4
2011 Q1
2011 Q2
2011 Q3
2011 Q4
2012 Q1
2012 Q2
2012 Q3
2012 Q4
2013 Q1
2013 Q2
2013 Q3
2013 Q4
2014 Q1
2014 Q2
2014 Q3
2014 Q4
2015 Q1
2015 Q2
2015 Q3
0
10
20
30
40
50
Financial Buyers Deal Count in Apparel
• Reviving deal count post recession• Transaction values are much smaller compared to
strategic buyers.• Financial acquirers are willing to use cash• Average premium of 19% in the industry• Indicate EBITDA exit multiple of 8.5x-
9.5x

58713%
407587%
Financial Buyers Strategic Buyers
11Sources: Bloomberg
Strategic Transaction Environment Overview:• 87% of total deal count are strategic transactions• High transaction volume with Enterprise Value much
more similar to Columbia• Higher premiums which is expected from synergies• Average premium is around 28% in the industry• Indicate EBITDA exit multiple of 12x-13x
Deal Count
2008 2009 2010 2011 2012 2013 2014 2015(YTD)02468
101214161820
Strategic vs Financial Buyers in Deal Volume in Apparel Industry
StrategicFinancial
$ in billions

Discounted Cash FlowRevenue Projection
Weight Average Cost of Capital
WACC=9.2%
• Beta (0.97) calculated from regression analysis
• Cost of equity calculated from CAMP (RF=2.27%, R(M)=9.52)
• Strong brand portfolio, robust product line-up and innovation drove Columbia Sportswear sales and profits better-than-expected in the first three quarters of 2015
• The industry Columbia is operating in is growing primarily due to the increase of per capita disposable income and the rise of consumer confidence index
• Columbia Sportswear is geared to expand its share in the market through several strategic joint ventures and acquisitions, which drives growth rate
• Columbia Sportswear receives 57.1% of sales from USA, which indicates significant international growth opportunity
• As the industry matures globally, the long-term growth rate for Columbia Sportswear will be around 2.5% a year
12

Discounted Cash FlowProjected 5 Years
10.68x 11.18x 11.68x 12.18x 12.68x
8.2% 3825.9 3976.8 4127.8 4278.7 4429.6
8.7% 3752.7 3900.5 4048.3 4196.1 4344.0
9.2% 3681.2 3826.0 3970.9 4115.6 4260.4
9.7% 3611.5 3753.3 3895.2 4037.1 4178.9
10.2% 3543.5 3682.4 3821.4 3960.4 4099.4
WACC
Terminal Multiple 2020 P EBITDA
• Terminal multiple used in EBITDA multiple method is from Comps analysis
• EBITDA multiple method is the optimal method for Columbia since the company lacks the ability to transfer EBITDA to FCF
• DCF analysis provided an implied Enterprise Value range of $3681.2MM-$4419.3MM at 10.7x-12.7x EBTIDA
• Implied share price range of $54.62-$62.86
13

Leverage Buyout Analysis
14
LBO Assumption• No operating synergies are expected since the
acquirer is a financial entity
• Senior debt at LIBOR + 3% interest, Subordinated debt at LIBOR + 7% interest
• Senior Debt to EBITDA multiple at 6.4x, Subordinated Debt to EBITDA multiple at 1.4x
• Purchase date EBITDA equal to 2015 E EBITDA ($302.4)
• Analysis based on same IS projections as DCF valuation
• Uses all available cash for debt repayment
Use & Source of Funds
Source: Bloomberg, IBISWorld Industry Reports
Financial Summary Projected Years2015 E 2016 P 2017 P 2018 P 2019 P 2020 P
Revenue $2,328 $2,501 $2,676 $2,850 $3,007 $3,127
Gross Profit 1,075 1,163 1,244 1,325 1,398 1,454
EBITDA 302 337 362 388 412 430
Cash Interest Expense 110 108 105 102 97
Free CF for Debt Repayment $47 $62 $78 $98 $121
Pay Down for Senior Debt 47 62 78 98 121
Pay Down for Sub. Debt 0 0 0 0 0
Ending Cash Flow 0 0 0 0 0

Leverage Buyout Analysis
IRR & Offer Premium Analysis: 1
15
Results
• LBO analysis implies an enterprise value between $3,368MM-$3,674MM at 11x-12x EBITDA
• Implied share price range of $48.7-$53.0
• Implied offer premium is about 4.2% based on current share price, which is not realistic
Implied Offer Price 10.7x 11.2x 11.7x 12.2x 12.7x
IRR
30.0%27.5%25.0%22.5%20.0%
47.0 47.8 48.6 49.4 50.3 48.0 48.9 49.8 50.7 51.6 49.2 50.2 51.2 52.1 53.1 50.5 51.6 52.7 53.8 54.9
51.9 53.2 54.4 55.6 56.8
IRR & Offer Premium Analysis: 2
Assumptions
• Exit multiple (11.7x) from Comparable Analysis
• Sponsor required IRR at 25%
Internal Rate of Return
Off
er P
rem
ium
30%25%20%15%10%
4.8% 6.5% 8.1% 9.5% 10.9%6.7% 8.4% 10.0% 11.5% 12.9%8.8% 10.5% 12.1% 13.6% 15.1%11.1% 12.9% 14.5% 16.1% 17.6%
13.8% 15.6% 17.3% 18.9% 20.4%
10.7x 11.2x 11.7x 12.2x 12.7x
Assumptions
• Exit multiple (11.7x) from Comparable Analysis
• Sponsor required offer premium at 20%
Results
• LBO analysis implies an IRR at 12.1%
• Implied cash return of 1.77x
• Implied return does not achieve desired return (IRR>20%)

Comparison of Valuations
16
• LBO valuation EBITDA multiple is close to that of Comparable analysis
• DCF analysis using EBITDA multiple method
• Financial sponsors typically provide lower control premium
• Strategic buyers provide relatively high control premium
• Comparable companies analysis bounded by industry average EV/LTM EBITDA ratio
• Current share price is $49.08
Comparables (10.5x-12.5x EBITDA)
Strategic Transaction(12.0x-13.0x EBITDA)
Financial Transaction (8.5x-9.5x EBITDA)
DCF Analysis (10.7x-12.7x EBITDA)
LBO Analysis (11.0x-12.0x EBITDA)
COLM Evaluation (10.5x-12.5x EBITDA)
30.00 35.00 40.00 45.00 50.00 55.00 60.00 65.00 70.00
47.48
54.01
38.77
54.62
48.71
47.48
56.19
58.37
43.12
62.86
53.00
56.19
Football Field for Columbia Sportswear
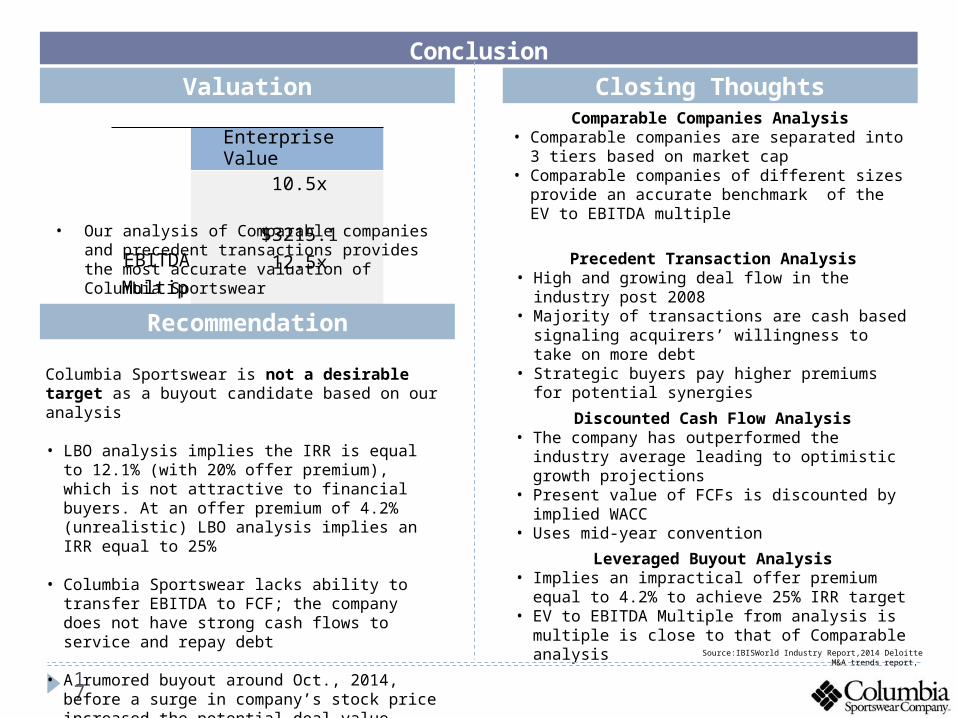
Valuation
EBITDAMultiple
Enterprise Value10.5x
$3215.112.5x
$3827.5
17
Conclusion
• Our analysis of Comparable companies and precedent transactions provides the most accurate valuation of Columbia Sportswear
Closing Thoughts
Recommendation
Columbia Sportswear is not a desirable target as a buyout candidate based on our analysis
• LBO analysis implies the IRR is equal to 12.1% (with 20% offer premium), which is not attractive to financial buyers. At an offer premium of 4.2% (unrealistic) LBO analysis implies an IRR equal to 25%
• Columbia Sportswear lacks ability to transfer EBITDA to FCF; the company does not have strong cash flows to service and repay debt
• A rumored buyout around Oct., 2014, before a surge in company’s stock price increased the potential deal value, making the implied IRR become undesirable for a financial buyer
Comparable Companies Analysis• Comparable companies are separated into 3 tiers based on
market cap• Comparable companies of different sizes provide an
accurate benchmark of the EV to EBITDA multiple
Discounted Cash Flow Analysis• The company has outperformed the industry average
leading to optimistic growth projections• Present value of FCFs is discounted by implied WACC• Uses mid-year convention
Leveraged Buyout Analysis• Implies an impractical offer premium equal to 4.2% to
achieve 25% IRR target• EV to EBITDA Multiple from analysis is multiple is close
to that of Comparable analysisSource:IBISWorld Industry Report,2014 Deloitte M&A trends report,
Precedent Transaction Analysis• High and growing deal flow in the industry post 2008• Majority of transactions are cash based signaling acquirers’
willingness to take on more debt• Strategic buyers pay higher premiums for potential
synergies