Columbia Program on Indian Economic Policies Working Paper ...
42
Columbia Program on Indian Economic Policies Working Paper No. 2012-3 Labor Regulations and the Firm Size Distribution in Indian Manufacturing Rana Hasan Karl Robert L. Jandoc
Transcript of Columbia Program on Indian Economic Policies Working Paper ...
Columbia Program on Indian Economic Policies
Working Paper No. 2012-3
Labor Regulations and the Firm Size Distribution in Indian Manufacturing
Rana Hasan
Karl Robert L. Jandoc

2
Labor Regulations and the Firm Size Distribution in Indian Manufacturing
Rana Hasan Asian Development Bank
and
Karl Robert L. Jandoc University of Hawaii, Manoa
January 2012 Abstract: We use data from Indian manufacturing to describe the distribution of firm size in terms of employment and discuss implications for public policy, especially labor regulations. A unique feature of our analysis is the use of nationally representative establishment-level data from both the registered (formal) and unregistered (informal) segments of the Indian manufacturing sector. While we find there to be little difference in the size distribution of firms across states believed to have flexible labor regulations versus those with inflexible labor regulations, restricting attention to labor-intensive industries changes the picture dramatically. Here, we find greater prevalence of larger sized firms in states with flexible labor regulations. Moreover, this differential prevalence is higher among firms that commenced production after 1982, when a key aspect of Indian labor regulations was tightened. Overall, our findings are consistent with the argument that labor regulations have affected firm size adversely.
This paper is an extensively revised version of our earlier work, “The Distribution of Firm Size in India:
What Can Survey Data Tell Us?” (ADB Economics Working Paper Series No. 213). We are indebted to Arvind Panagariya for detailed discussions on the possible effects of India's labor regulations, and which motivated the extensions to our original analysis that appear here. We would also like to thank Pranab Bardhan, Dipak Mazumdar, and K.V. Ramaswamy for useful comments and suggestions. Of course, any errors are our responsibility. The views presented here are those of the authors and not necessarily those of the Asian Development Bank, its Executive Directors, or the countries that they represent.
3
1. Introduction
There exists a large and growing literature that seeks to understand the policy determinants of
industrial performance. In this paper, we use data from establishment-level surveys from India's
manufacturing sector to contribute to this literature. The specific issue we examine is how the
size of Indian manufacturing establishments in terms of employment is distributed. We also
provide evidence on how one element of policy, namely labor regulations, may be contributing
to this size distribution.
Our interest in the size distribution is driven by the close link between establishment1 size and
various dimensions of industrial performance, including average wages and labor productivity
found internationally. Indeed, at least since Moore's (1911) study of daily wages of Italian
working women in textile mills, the finding that wages are higher in larger enterprises has been
confirmed repeatedly in different contexts. As noted by Oi and Idson (1999, page 2,207) in their
review of the relationship between firm size and wages in mostly industrialized countries, the
facts Moore uncovered had not changed nearly a century later:
"A worker who holds a job in a large firm is paid a higher wage, receives more generous
fringe benefits, gets more training, is provided with a cleaner, safer, and generally more
pleasant work environment. She has access to newer technologies and superior
equipment. She is, however, obliged to produce standardized as opposed to customized
goods and services, and for the most part to perform the work in tandem with other
members of a larger team. The cost of finding a job with a small firm is lower. The
personal relation between employee and employer may be closer, but layoff and firm
failure rates are higher, resulting in less job security."
To the extent that an important part of this correlation reflects a causal relationship running from
size to productivity and wages, any factor that constrains firm size will have adverse implications
1 The terms enterprise (or firms) and establishment are often used interchangeably in this paper. These
are distinct concepts. An establishment is a single physical location at which business is conducted or where services or industrial operations are performed. An enterprise or firm is a business organization consisting of one or more domestic establishments under common ownership or control. For companies with only one establishment, the enterprise and the establishment are the same.

4
for the growth of productivity and wages. In this way, an understanding of the size distribution of
enterprises in India and the factors that explain it can be key to an analysis of the potential
constraints to enterprise growth and, ultimately, economic growth more broadly.
Accordingly, we begin by examining how employment is distributed across enterprises of
different sizes in Indian manufacturing. As noted by the pioneering work of Dipak Mazumdar
(see, for example, the works cited in Mazumdar, 2003), the size distribution of Indian
manufacturing enterprises is characterized by a 'missing middle' whereby employment tends to
be concentrated in small and large enterprises. After confirming that this pattern continues to
hold even in data as recent as 2005, we turn our attention to an exploration of whether India's
industrial labor regulations may be one of the drivers of the missing middle phenomena. In
particular, we examine whether states coded by recent literature as having relatively flexible or
inflexible labor regulations differ in terms of how enterprises are distributed across different size
groups. Our findings are suggestive of labor regulations having an impact.
The remainder of this paper is organized as follows. Section 2 describes our data on Indian
manufacturing establishments. Section 3 uses this data to document the distribution of
employment by enterprise size groups in Indian manufacturing. It also uses similar information
from other countries in the region to highlight some policy issues. The main finding is that in
India, as elsewhere, large firms are on average more productive and pay better than smaller
firms; however, a unique feature of the Indian firm size distribution is the overwhelming
importance of smaller enterprises in accounting for total manufacturing employment—an
important phenomenon described in greater detail in Section 4. The implication is that a very
large proportion of Indian workers are engaged in employment in low productivity and low-wage
enterprises. Section 5 describes some reasons why the Indian size distribution looks the way it
does. One of these reasons has to do with labor regulations and Section 6 discusses these in
more detail, before turning to an empirical investigation of the links between labor regulations
and the size distribution of Indian enterprises. Section 7 concludes.

5
2. Data
The main sources of data used in this study are nationally representative surveys of formal and
informal manufacturing firms in India. The Annual Survey of Industries (ASI) gathers
information on "registered", or formal sector firms that are covered by Sections 2m(i) and 2m(ii)
of the 1948 Factories Act and firms registered by the 1966 Bidi and Cigar Workers Act—
particularly (a) those firms that use electricity and hire more than 10 workers; and (b) those that
do not use electricity but nevertheless employ 20 or more workers. It also covers certain utility
industries such as power, water supply, cold storage, and the like. Units with 100 or more
workers are categorized under the census sector and are completely enumerated2, while the rest
are categorized under the sample sector and are surveyed based on a predetermined sampling
design.
The "unregistered" or informal sector firms which are not covered by the ASI are covered by the
National Sample Survey Organisation (NSSO) Survey of Unorganised Manufacturing
Enterprises. The surveys are follow-ups to the different Economic Censuses conducted by the
NSSO. Informal firms engaged in manufacturing are classified as: (a) own account
manufacturing enterprises (OAME) if they operate without any hired worker employed on a
fairly regular basis; (b) non-directory manufacturing establishments (NDME) if they employ less
than six workers (household and hired workers taken together); or (c) directory manufacturing
establishment (DME) if they employed household members and hired workers of a total of six or
more.
For this study, we combine ASI and NSSO data from three years: 1994-1995, 2000-2001 and
2004-2005 for the ASI and 1994-1995, 2000-2001 and 2005-2006 for the NSSO. The first two
years match up very well across the two data sources. This is less so for the last year of data but
it is unavoidable given data availability. For expositional convenience we refer to the years
covered by the data as 1994, 2000 and 2005.
2 From 1997-1998 to 2003-2004 only units having 200 or more workers were covered in the census
sector. See India's Ministry of Statistics and Programme Implementation website http://mospi.nic.in/stat_act_t3.htm for more details.

6
From this combined dataset we mainly use four variables: employment, output, capital and value
added. Employment includes all workers in the firm, including production workers, employees
holding supervisory or managerial positions, and working proprietors.3 Output is the sum total
of the value of manufactured products and by-products, the value of other services rendered and
the value of other incidental receipts of the firm. Capital is defined as the value of total assets
minus the value of land and buildings. We use the net value (net of depreciation) for ASI while
we use the gross market value for NSSO. Although our measure of capital is imperfect, we use it
minimally and only for the purpose of determining labor intensive industries.4 Value added is
computed by deducting total output from total inputs (fuels, raw materials, etc.) of the firm. We
deflate the current rupee values using wholesale price indices of manufacturing industries used
by Gupta, Hasan and Kumar (2009).
We have employed some measures to filter and clean the data that are used in this study. First,
there are a substantial number of firms which failed to report output (or reported zero output)
especially in the 2000 and 2005 rounds of the ASI. Second, some variables have outliers and
implausible values (e.g., one firm reports employing 4 million workers). We conduct our
analysis by excluding non-manufacturing firms involved in industries such as recycling and
agriculture; including firms in the ASI which are reported to be "open" during the survey
period5; and dropping firms with very high values for employment (i.e., firms reporting
employment greater than 50,000).
We also restrict our attention to 15 major Indian states (using pre-2000 boundaries of three large
states). The states are: Andhra Pradesh, Assam, Bihar (including what is now Jharkhand), 3 ASI micro-data allow production workers to be further subdivided into two categories: Those hired
“directly” and “workers employed through contractors”. Directly hired workers include all “regular” or permanent workers. Others, including casual labor hired on daily wages are classified under the second category. Regular workers receive a number of benefits and protections not available to other workers.
4 The capital-intensity ranking of industries hardly changes when we use the market value of plant and machinery instead of our preferred measure. The capital intensive industries are: Machinery, Electrical Machinery, Transport, Metals and Alloys, Rubber/Plastic/Petroleum/Coal and Paper/Paper Products. The labor-intensive industries are: Beverages and Tobacco, Textile Products, Wood/Wood Products, Leather/Leather Products and Non-Metallic Products. The remaining industries are not as clearly distinguishable and include: Food Products, Textiles, Basic Chemicals, Metal Products and Other Manufacturing.
5 Firms in the ASI are also classified based on their status, i.e., whether they are "Open" or "Closed" for the reference year, and "Non-Operative" for at least three years prior to the reference year.

7
Gujarat, Haryana, Karnataka, Kerala, Madhya Pradesh (including what is now Chhattisgarh),
Maharashtra, Orissa, Punjab, Rajasthan, Tamil Nadu, Uttar Pradesh (including what is now
Uttarakhand) and West Bengal. This not only makes it easier to compare data across years, but
also allows us to use available information on state-level labor regulations in our analysis of the
links between labor regulations and the firm size distribution.
For some of our analysis, we need information on the manufacturing industries firms operate in.
Since the 1994 data use India's NIC-1987 industrial classification, the 2000 data use the NIC-
1998 classification, and the 2005 data use the NIC-2004 classification, we employ a concordance
that maps 3-digit NIC-1998 and NIC-2004 codes into unique 2-digit NIC-1987 codes. This
gives us a total of 16 aggregated industries.
Table 1 reports the number of firms surveyed and their implied population statistics. There are
around 26,000-47,000 firms surveyed across the different ASI rounds while there are roughly
72,000-196,000 enterprises surveyed across the NSSO rounds. Based on the population weights
provided in the various datasets, the sample firms represent around 11 to 16 million Indian firms
per year.
Table 1. Number of Firms in ASI and NSSO Datasets, 1994, 2000 and 2005
1994 2000 2005 Dataset Sample Population Sample Population Sample Population
ASI 47,121 97,846
26,611 106,205
33,838
110,873
NSSO 142,780 11,575,745
196,385 16,306,696
72,109
16,496,285
of which:
OAME 110,899 9,908,945
129,921 14,163,075
48,049
14,182,576
NDME 19,010 1,112,885
42,384 1,556,979
15,311
1,669,454
DME 12,871 553,915 24,080 586,642 8,749
644,255 Note: ASI = Annual Survey of Industries; NSSO = National Sample Survey Organisation (Survey of Unorganised Manufacturing Enterprises) OAME = own-account manufacturing enterprises; NDME = non-directory manufacturing enterprises; DME = directory of manufacturing enterprises. Source: Authors' computations based on ASI and NSSO datasets.

Table 2 provides some summary statistics for the main variables we use in this study. Apart
from the mean, we provide the median, the 10th percentile and the 90th percentile values of the
variables to give us a sense of their distribution. As expected, firms in the formal sector have
higher value added, output, employment and capital per worker. What is surprising, however, is
that a large number of these formal firms have less than 10 workers, as can be seen by the low
10th percentile value on number of workers.
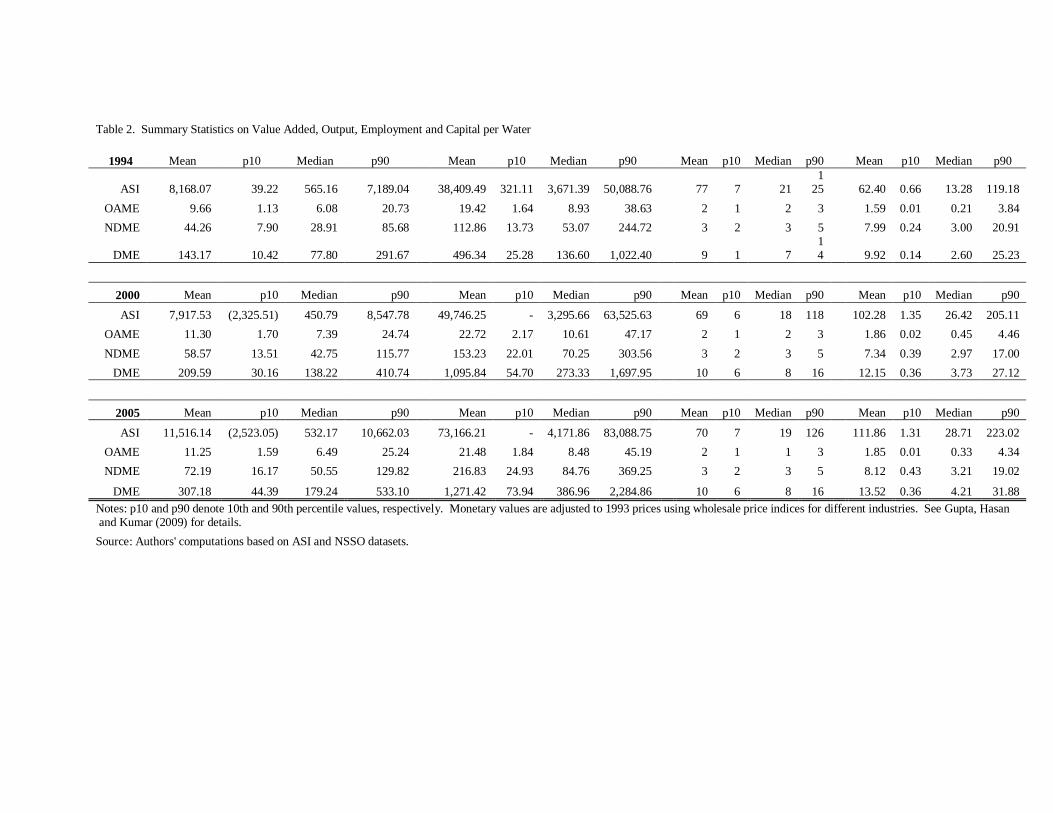
Table 2. Summary Statistics on Value Added, Output, Employment and Capital per Water
1994 Mean p10 Median p90 Mean p10 Median p90 Mean p10 Median p90 Mean p10 Median p90
ASI 8,168.07 39.22 565.16 7,189.04 38,409.49 321.11 3,671.39 50,088.76 77 7 21 1
25 62.40 0.66 13.28 119.18 OAME 9.66 1.13 6.08 20.73 19.42 1.64 8.93 38.63 2 1 2 3 1.59 0.01 0.21 3.84 NDME 44.26 7.90 28.91 85.68 112.86 13.73 53.07 244.72 3 2 3 5 7.99 0.24 3.00 20.91
DME 143.17 10.42 77.80 291.67 496.34 25.28 136.60 1,022.40 9 1 7 14 9.92 0.14 2.60 25.23
2000 Mean p10 Median p90 Mean p10 Median p90 Mean p10 Median p90 Mean p10 Median p90
ASI 7,917.53 (2,325.51) 450.79 8,547.78 49,746.25 - 3,295.66 63,525.63 69 6 18 118 102.28 1.35 26.42 205.11 OAME 11.30 1.70 7.39 24.74 22.72 2.17 10.61 47.17 2 1 2 3 1.86 0.02 0.45 4.46 NDME 58.57 13.51 42.75 115.77 153.23 22.01 70.25 303.56 3 2 3 5 7.34 0.39 2.97 17.00
DME 209.59 30.16 138.22 410.74 1,095.84 54.70 273.33 1,697.95 10 6 8 16 12.15 0.36 3.73 27.12
2005 Mean p10 Median p90 Mean p10 Median p90 Mean p10 Median p90 Mean p10 Median p90
ASI 11,516.14 (2,523.05) 532.17 10,662.03 73,166.21 - 4,171.86 83,088.75 70 7 19 126 111.86 1.31 28.71 223.02 OAME 11.25 1.59 6.49 25.24 21.48 1.84 8.48 45.19 2 1 1 3 1.85 0.01 0.33 4.34 NDME 72.19 16.17 50.55 129.82 216.83 24.93 84.76 369.25 3 2 3 5 8.12 0.43 3.21 19.02
DME 307.18 44.39 179.24 533.10 1,271.42 73.94 386.96 2,284.86 10 6 8 16 13.52 0.36 4.21 31.88 Notes: p10 and p90 denote 10th and 90th percentile values, respectively. Monetary values are adjusted to 1993 prices using wholesale price indices for different industries. See Gupta, Hasan and Kumar (2009) for details. Source: Authors' computations based on ASI and NSSO datasets.

While formal firms tend to have a higher number of workers per firm, the vast majority of
workers are employed in informal firms. Table 3 shows that around 80 percent of workers are
employed in the informal sector and out of these informal sector workers, around 70% belong to
the OAME, working on their own account. Although employing fewer workers in all, the formal
sector disproportionately produces more value added and output than the informal sector.
Table 3. Total Value Added, Output, and Employment by Year and Dataset
1994 2000 2005 Value Added Output Employment
Value Added Output Employment
Value Added Output Employment
Dataset (Billions of 1993
Rupees) (Millions) (Billions of 1993
Rupees) (Millions) (Billions of 1993
Rupees) (Millions)
ASI
798.76
4,233.99 7.52
840.56
7,935.00 7.30
1,276.50
14,493.53 7.70
NSSO
224.24
675.06 28.24
374.18
1,709.70 35.18
474.98
2,504.75 35.02
of which:
OAME
95.73
221.68 20.04
160.05 486.47 24.21
157.21
526.60 23.04
NDME
49.21
142.33 3.46
91.19 344.38 5.03
120.05
603.29 5.41
DME
79.30
311.04 4.73
122.95 878.86 5.94
197.72
1,374.87 6.58
Note: Monetary values are adjusted to 1993 prices using wholesale price indices for different industries.
Source: Authors' computations based on ASI and NSSO datasets.
3. Indian manufacturing and the "good jobs" problem
As the foregoing tables suggest, a very large share of workers in India's manufacturing sector are
employed in enterprises with less than 50 workers. This can be clearly seen from Figure 1 which
shows the distribution of employment by three size groups. Almost 85% (or 37.5 million out of
44.6 million) workers were employed in such enterprises in 2005. 6 This share is considerably
higher than that in many comparator countries in the Asia-Pacific region.
6 See Box 3.1 of ADB (2009, page 23) for details on data sources and methodology pertaining to Figure 1.

11
Figure 1. Share of Manufacturing Employment by Enterprise Size Groups (percent)
Source: ADB (2009).
This pattern of the distribution of employment has important welfare implications. First, large
enterprises are on average more productive (Figure 2), and not unrelated, they pay higher wages
on average (Figure 3). Accordingly, the preponderance of Indian manufacturing employment in
small sized firms thus means low wages for a large fraction of workers. It also means high levels
of wage inequality: The distributions implicit in the figures shown here yield Gini coefficients of
0.35 in India versus 0.16 in Korea and 0.13 in Taipei,China.

12
Figure 2: Productivity (Value Added per Worker) Differentials by Enterprise Size Groups (large enterprises=100) Source: ADB (2009). Figure 3. Wage Differentials by Enterprise Size Groups (large enterprises=100) Source: ADB (2009).

13
A more disaggregated look at the distribution of Indian manufacturing employment by firm size
helps frame policy issues more sharply. Figure 4, which considers the distribution of workers by
finer size-groups than considered so far indicates that a very large amount of employment is
accounted for by firms with less than five workers. Moreover, as the figure also shows, the
overwhelming majority of these micro enterprises are the OAME.
Figure 4. Number of Workers by Firm Size and Type (millions)
Source: Authors' computations based on ASI and NSSO datasets.
Figure 5 presents the distribution of workers once again, but this time omitting the OAME.
While the figure continues to show how important small enterprises are to manufacturing
employment in India, it highlights a second feature of the distribution of employment by firm
size in India—the relatively low levels of employment in firms with 51-200 workers.

14
Figure 5. Number of Workers by Size and Firm Type, Without OAME Workers (millions)
Source: Authors' computations based on ASI and NSSO datasets.
As can be seen from the two figures, both features of the employment distribution are present in
each of the three years of our data. In the absence of panel data—which would enable us to
examine how given enterprises evolved in size—these features of the size distribution suggest
some combination of the following: (i) very small establishments seem unable or incapable of
expanding—i.e., the transition from a micro enterprise to a small enterprise seems difficult; (ii)
the transition from small to medium also seems difficult.
Given the size-productivity-wage relationship discussed earlier, the patterns above strongly
suggest that understanding what holds back Indian enterprises of different size groups from
expanding is critical insofar as the goal of generating better paying jobs is concerned. Given
that micro enterprises, especially the OAME are likely to be very different in characteristics and
face different constraints in their operations and growth than small and medium sized enterprises,
we discuss the factors that may be responsible for the patterns we see separately for the OAME
and the remaining firms.

15
4. The Own Account Manufacturing Enterprises (OAME)
As noted earlier, the OAME comprise very small enterprises that do not hire even one worker
from outside the family on a regular basis. Tables 4 and 5 show us which industries the OAME
operate in and where they are located. OAME are mostly based in rural areas (up to three
quarters). Moreover, they are mostly confined to a few industries, namely: wood/wood
products, food products, beverages, and textiles and textile products. Why are there so many OAME? Do they possess the potential to grow and expand? Will they
eventually become significant employers? It is beyond the scope of this paper to shed detailed
light on these issues. However, it is useful to consider the results of some recent research on this
issue from another South Asian country, namely Sri Lanka and examine what implications there
may be for the case of India.
As de Mel, McKenzie and Woodruff (2008) argue, understanding the OAME is very crucial
since it can guide policies on industrial development and employment generation. In particular,
it can help determine whether the focus of policy should be on helping microenterprises grow or
on the constraints to growth of those employers operating relatively larger enterprises—i.e., over
some size threshold. The issue in the literature is still unsettled. In a useful summary of the
unsettled debate in this area, de Mel, McKenzie and Woodruff note that while scholars such as
Peruvian economist Hernando de Soto7 tend to consider microenterprise owners as capitalists-in-
waiting held back by credit constraints, weak property rights and burdensome regulation, a very
different view comes from other scholars such as Viktor Tokman. Tokman (2007), along with
the International Labour Organisation (ILO), believe that these workers are the product of the
"failure of the economic system to create enough productive employment", and that given the
opportunity for regular salaried work, they may be more than willing to make the change and
abandon their businesses.
Recent evidence suggests that the Tokman and ILO view has the upper hand. In a systematic
comparison of wage workers, own-account workers and employers in Sri Lanka, de Mel,
McKenzie and Woodruff (2008) find that in a wide range of ability measures and cognitive tests,
7 For instance, de Soto (1989).

16
own-account workers and wage workers perform very similarly and their scores are below those
of entrepreneurs who operate larger enterprises. Moreover, they also find that parents of
entrepreneurs are more educated than parents of wage workers, who, in turn cannot be
distinguished from the parents of own-account workers in terms of educational achievements.
Employers are also more motivated (important for running a business) and more tenacious
(important for making the business grow) than own-account workers, according to industrial
psychology tests. Taken together, this study puts into doubt the idea that owners of
microenterprises are capable of growing their business.
There is also some suggestive evidence to support these findings in the Indian context. Figure 6
describes the distribution of education for different categories of non agricultural workers using
data from the 2004-05 NSS Employment-Unemployment Survey. The self-employed are
distinguished between employers and own account workers while wage earners are distinguished
between permanent and casual workers. The figure shows that the own account workers look a
lot like casual wage labor while employers and regular wage workers are fairly similar. For both
the self-employed and casual wage workers, a large share of workers have less than primary
education, while very few have tertiary education.
Figure 6. Distribution of Education by Type of Employment in India (percent)
Source: Authors' computations based on the 2004-2005 NSS Employment-Unemployment Survey.

17
Interestingly, as Figure 7 reveals, the similarities in education profiles are mirrored by very
similar profiles of household per capita expenditures across Indian households relying on self-
employment (own account) income and casual wage employment, and across households relying
on permanent wage employment and income from being a self-employed employer. Both these
patterns suggest important differences between microenterprise owners and entrepreneurs of
larger enterprises. Indeed, it is quite plausible that the vast majority of microenterprises are
unlikely to expand and become employers.
Figure 7: Household Per Capita Expenditure by Type of Employment in India (Rupees)
Source: Authors' computations based on the 2004-2005 NSS Employment-Unemployment Survey. To the extent that this is correct, the policy imperative of generating good jobs has to focus on
understanding the barriers to growth among larger enterprises. Accordingly, we omit the OAME
in the rest of our analysis and focus on understanding the distribution of employment by size
groups for all enterprises other than the OAME.
5. Understanding the size distribution of employment in non-OAME Enterprises
What is causing the appearance of the missing-middle? There are a host of factors that affect the
pattern of size distribution. To a certain extent, the pattern will reflect industrial composition. If
technology in a given industry is characterized by economies of scale—that is, the average cost
of producing each unit of product falls as total output increases—we can expect larger plant size.
In general, the more capital (machines) required in a production process, the greater will be the

18
scope for reaping scale economies and thus the larger the optimum size of enterprises. For
example, automobile production requires far more capital per unit of labor than apparel
production, and economies of scale are very important to the production process. As a result, the
typical automobile plant will be much larger than an apparel plant.
This can be seen quite clearly in Figure 8, which contrasts the distribution of non-OAME
employment across size groups in apparel and motor vehicles and parts in India. While there is a
mass of employment in very small enterprises in apparel, the situation is very different in motor
vehicles. Since total employment generated by non-OAME in apparel is about 4 times that in
motor vehicles and parts (2.6 million versus around 671,000 workers in 2005) in the 15 major
states, this will certainly exert a large influence on the distribution of employment across size
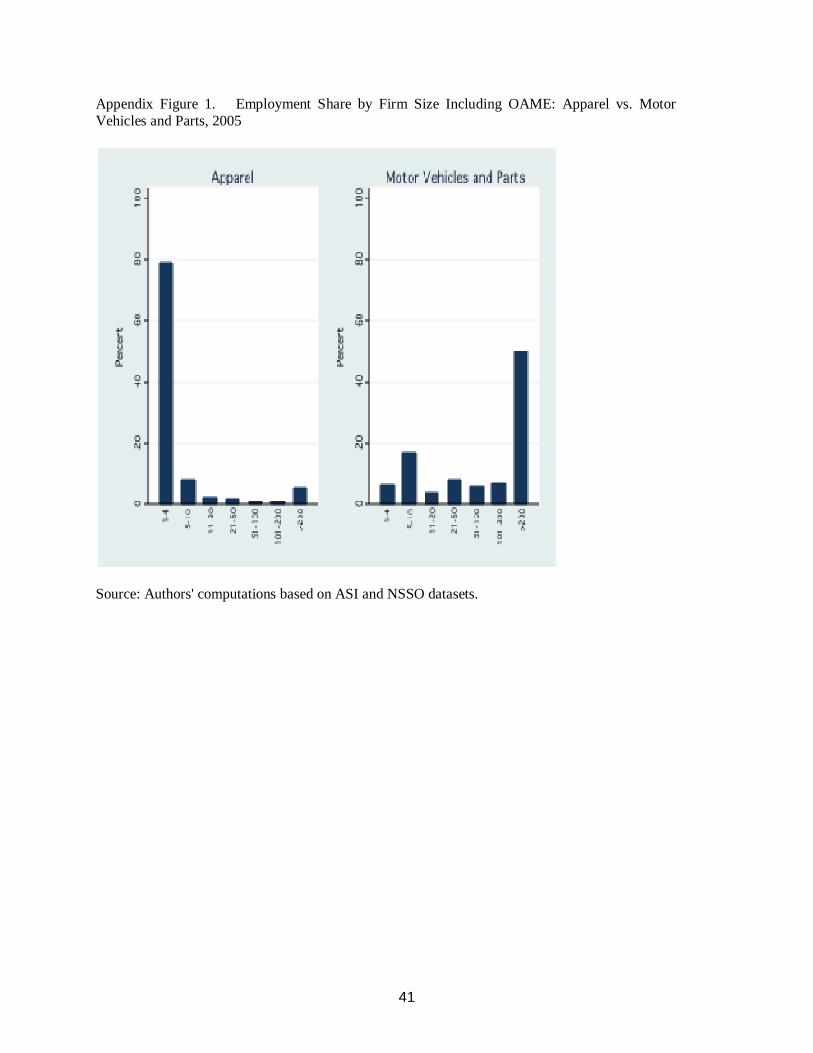
groups in manufacturing as a whole.8 Including the OAME reinforces this message even more
strongly. For example, in India's apparel sector close to 80% of employment is found to be
accounted by enterprises with less than five workers. This may be compared to a figure of
around 37% of employment when the OAME are excluded (as in Figure 8)! Appendix Figure 1
presents the analog to Figure 8 when the OAME are included. 8 Of course, the relationship between production technology and the optimum size of enterprises can be
quite complex and one that has changed over time. Moreover, other factors matter for firm size, such as the nature and evolution of transaction costs. See Section 4 of ADB (2009) for more details.

19
Figure 8. Employment Share by Firm Size: Apparel vs. Motor Vehicles and Parts, 2005
Source: Authors' computations based on ASI and NSSO datasets.
In this way, the size distribution of enterprises in an economy will depend to some extent on the
industrial composition of the economy. Since lower income countries will tend to have a
composition dominated by simpler to produce products like apparel and footwear, metal
products, and furniture—low incomes on average will mean greater demand for these types of
products—we can expect a tendency for a concentration of small enterprises in these countries.
But as noted by Mazumdar (2009) the effects of broad industrial composition should not be
exaggerated. This is because the size distribution within the same industry can show significant
variations across country. Thus, while apparel can be manufactured in small establishments
where one or a few tailors work on basic sewing machines, production can also occur in large
establishments using sophisticated machines (for example, machines for spreading and cutting
cloth). Figure 9 compares the distribution of employment across size groups in the PRC and

20
India for apparel products (and excluding OAMEs from the Indian distribution).9 Large
enterprises account for much more of total employment in apparel in the PRC than in India.10
The very different distributions across these two countries strongly suggest very different
production technologies for a broadly similar set of products and very different implications for
the firm size distribution. Indeed, these two distributions are entirely consistent with the
qualitative description provided by McKinsey Global Institute (2001) of the structure and
production technologies of Indian apparel producers in comparison with their Chinese and Sri
Lankan counterparts.
Figure 9. Employment Share by Firm Size in China and India: Apparel, 2005
Source: Authors' computations based on ASI and NSSO datasets for India and ADB (2009) for China.
As Mazumdar (2009) argues, a number of factors can explain the coexistence of firms of
different sizes within a given product line including the transition of production technologies
9 Including OAMEs in the Indian distribution reveals that more than 80% of employment in Indian
apparel is accounted for by enterprises with fewer than 8 employees (as opposed to around 53% depicted in Figure 9). See Appendix Figure 2 for the analog to Figure 9 when the OAME are included for India.
10 A question that arises is why firms of different sizes seem to coexist in the same broad product line. One reason is to be found in the diversity in quality of the product. While there are certainly exceptions, it is generally the case that higher-quality products require greater mechanization and more tasks. Accordingly, the optimal size of the enterprise increases.

21
derived from 'crafts' tradition to modern methods (especially important in textiles and apparel),
product market differentiation whereby low income consumers demand low quality-low-priced
products (especially important in countries with large rural populations such as India),
differential access to finance (especially problematic for smaller firms), transaction costs, and
wide range of government policies encompassing industrial regulations, trade policy, and even
labor market regulations.
Understanding which factors are key ones is important from a policy point of view. In this
context, analysis of detailed microlevel survey data can be helpful in discriminating between
different possibilities. In what follows, we provide an illustration of how the survey data we
have access to can be used to examine how one element of regulation, namely labor regulations,
may be affecting the firm size distribution. (For an analysis of how recent changes in trade
policy have affected the firm size distribution, see Nataraj, 2009.)
6. Labor Market Regulations and the Firm Size Distribution
Labor Regulations in India
Why should labor regulations affect the firm size distribution? It is useful to first consider the
different channels through which labor regulations can affect firms and then consider what the
implications of these channels are for the firm size distribution. First, labor regulations can
increase directly the cost of hiring workers, for example, through minimum-wage stipulations
and provisions for mandated benefits (such as health care and pension benefits). Second, labor
regulations can affect the speed and cost of adjusting employment levels via regulations
governing hiring and layoffs and changes to conditions of service for incumbent workers. Third,
labor regulations can influence the relative bargaining power of workers and firms by regulating
the conditions under which industrial disputes arise and are settled.
If labor regulations apply uniformly over all firms, then the size distribution of firms is unlikely
to be affected. However, if labor regulations apply to a subset of firms—for example, firms
above a certain threshold size—then the size distribution of firms may be affected. In the
context of Indian manufacturing, various aspects of labor regulation kick in depending on
22
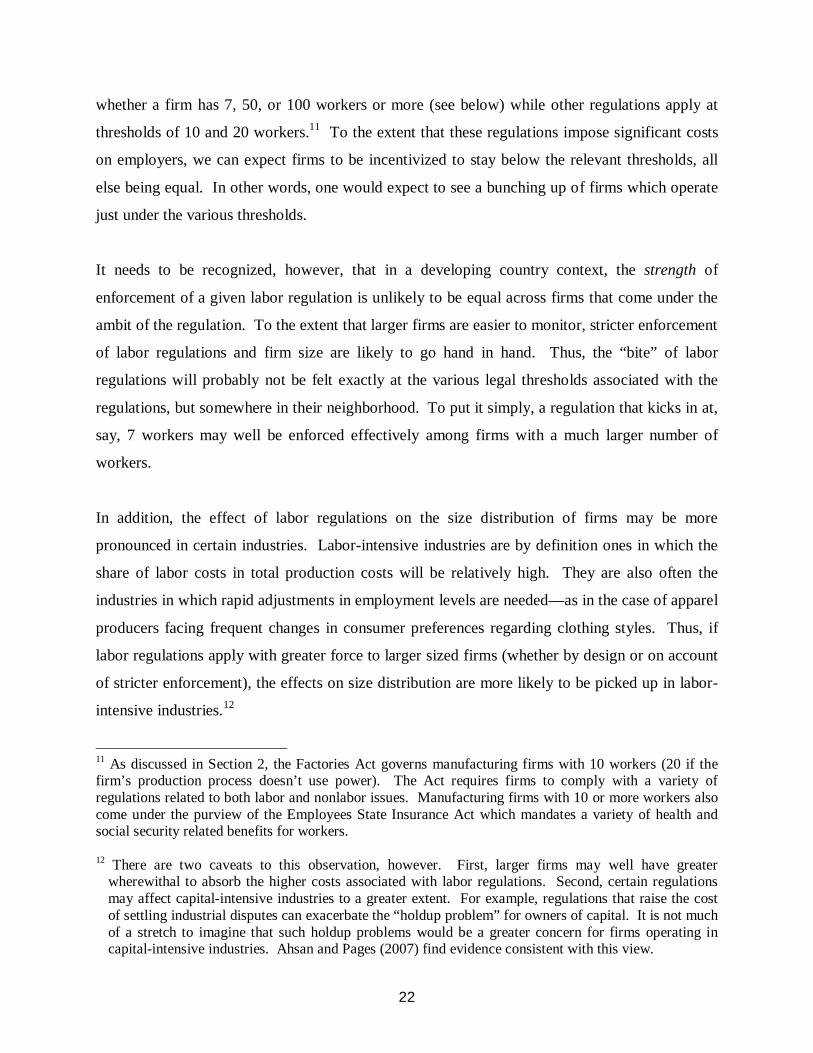
whether a firm has 7, 50, or 100 workers or more (see below) while other regulations apply at
thresholds of 10 and 20 workers.11 To the extent that these regulations impose significant costs
on employers, we can expect firms to be incentivized to stay below the relevant thresholds, all
else being equal. In other words, one would expect to see a bunching up of firms which operate
just under the various thresholds.
It needs to be recognized, however, that in a developing country context, the strength of
enforcement of a given labor regulation is unlikely to be equal across firms that come under the
ambit of the regulation. To the extent that larger firms are easier to monitor, stricter enforcement
of labor regulations and firm size are likely to go hand in hand. Thus, the “bite” of labor
regulations will probably not be felt exactly at the various legal thresholds associated with the
regulations, but somewhere in their neighborhood. To put it simply, a regulation that kicks in at,
say, 7 workers may well be enforced effectively among firms with a much larger number of
workers.
In addition, the effect of labor regulations on the size distribution of firms may be more
pronounced in certain industries. Labor-intensive industries are by definition ones in which the
share of labor costs in total production costs will be relatively high. They are also often the
industries in which rapid adjustments in employment levels are needed—as in the case of apparel
producers facing frequent changes in consumer preferences regarding clothing styles. Thus, if
labor regulations apply with greater force to larger sized firms (whether by design or on account
of stricter enforcement), the effects on size distribution are more likely to be picked up in labor-
intensive industries.12
11 As discussed in Section 2, the Factories Act governs manufacturing firms with 10 workers (20 if the firm’s production process doesn’t use power). The Act requires firms to comply with a variety of regulations related to both labor and nonlabor issues. Manufacturing firms with 10 or more workers also come under the purview of the Employees State Insurance Act which mandates a variety of health and social security related benefits for workers. 12 There are two caveats to this observation, however. First, larger firms may well have greater
wherewithal to absorb the higher costs associated with labor regulations. Second, certain regulations may affect capital-intensive industries to a greater extent. For example, regulations that raise the cost of settling industrial disputes can exacerbate the “holdup problem” for owners of capital. It is not much of a stretch to imagine that such holdup problems would be a greater concern for firms operating in capital-intensive industries. Ahsan and Pages (2007) find evidence consistent with this view.

23
Which specific labor regulations may be affecting the size distribution of Indian manufacturing
firms? Perhaps the single most important piece of labor legislation affecting Indian
manufacturing firms is the Industrial Disputes Act (IDA). In addition to laying down
procedures for the investigation and settlement of industrial disputes, the IDA also governs the
conditions under which layoff, retrenchment, and closure of firms can take place and the
appropriate level of compensation in each case (dealt with in Chapters V and VB).
Until 1976, the provisions of the IDA on retrenchments or layoffs were fairly uncontroversial.
The IDA allowed firms to lay off or retrench workers as per economic circumstances as long as
certain requirements such as the provision of sufficient notice, severance payments, and the order
of retrenchment among workers (last in first out) were met. An amendment in 1976 (the
introduction of Chapter VB), however, made it compulsory for employers with more than 300
workers to seek the prior approval of the appropriate government before workers could be
dismissed. A further amendment in 1982 widened the scope of this regulation by making it
applicable to employers with 100 workers or more. In some states, such as West Bengal, the
threshold of 100 was reduced to 50 workers or more.
Since government approval for retrenchments or layoffs is difficult to obtain, Chapter VB of the
IDA is believed to have incentivized formal sector manufacturing firms in India to conserve on
hiring labor—India's most abundant factor of production—and gravitate toward capital-intensive
production processes and sectors (see Panagariya, 2008 for a detailed discussion).13
However, the Chapter VB provisions of the IDA are not the only ones that may have created
such incentives. The IDA also prescribes the terms under which employers may change
“conditions of service” (dealt with in Sections 9A and 9B of Chapter IIA). Section 9A of the act
requires that employees be given at least 21 days’ notice before modifying wages and other
allowances, hours of work, rest intervals, and leave. According to some observers, including the
13 Consistent with the idea that India’s labor regulations have encouraged capital-intensive production
processes and sectors, Hasan, Mitra and Sundaram (2010) find that capital-labor ratios are higher in India than other countries with similar levels of development and factor endowments for a majority of manufacturing industries.
24
Government of India’s Task Force on Employment Opportunities, the “requirement of a 21 day
notice can present problems when units have to redeploy labor quickly to meet the requirement,
for example, for time bound export orders.” (Planning Commission, 2001, p. 7.8).
But the problem may be more serious than just delays caused by a 21 day notice period. Along
with the Industrial Employment (Standing Orders) Act, which requires all employers with 100 or
more workers (50 in certain states) to inform workers of the specific terms of their employment,
the provisions on service conditions seek to make labor contracts complete, fair, and legally
binding. While these are laudable objectives, the problem, according to some analysts, is that the
workings of India’s Trade Union Act make it difficult to obtain the worker consent needed to
execute changes in service conditions (including modifying job descriptions, moving workers
from one plant to another, etc.). The Trade Union Act allows any seven workers in the enterprise
to form and register a trade union, but has no provisions for union recognition (for example, by a
secret ballot).14 The result has been multiple unions (within the same establishment) with
rivalries common across unions so that a requirement of workers’ consent for enacting changes
“can become one of consensus amongst all unions and groups, a virtual impossibility” (Anant
2000, p. 251).
In summary, certain elements of India's labor regulations have the potential to create strong
incentives for firms to conserve on hiring workers. Since these incentives can be expected to
arise as firms approach the thresholds of 7, 50, and 100 workers due to the regulations discussed
above (and 10 and 20 workers owing to other regulations which also impinge on labor issues),
India's labor regulations may well have affected the size distribution of manufacturing firms. In
particular, on the assumption that very large sized firms—with say 200 or more workers (i.e.,
double the 100 worker threshold employed by Chapter VB of the IDA)—are better placed to
comply with these regulations and still be profitable, it would be small and medium-sized firms
14 An amendment to the Trade Union Act in 2001 raised the minimum number of workers that can form a
trade union in the case of enterprises with 100 or more workers. In such enterprises, the minimum has been set at 10% of the total number of workers up to a maximum of 100 workers. Additionally, one-third or five officers of the trade union, whichever is less, are permitted to be outsiders in the case of organized sector enterprises as per the 2001 amendment.

25
that can be expected to be the most affected by labor regulations and thus less prevalent in the
Indian manufacturing landscape.
It is important to note that not all analysts agree that India’s labor laws have made for a rigid
labor market. In particular, a counter-argument to the views above is that the rigidity inducing
regulations have been either ignored (see Nagaraj, 2002) or circumvented through the increased
usage of temporary (casual) or contract workers (Ramaswamy, 2003).15 Since many of
provisions of Indian labor regulations, including those of the IDA cover only "regular" workers,
firms have an incentive to hire temporary and contract workers instead of regular workers.
While the Contract Labour (Regulation and Prohibition) Act, which regulates the employment of
contract labor16, provides for the abolition of contract labor in work that is of a perennial nature
and is carried out by regular workers in the same or similar establishments (under Section 10 of
the Act), the share of contract labor in Indian manufacturing has increased considerably over
time and may have served to reduce the bite of labor regulations (Ahsan and Pages, 2007).17
At the same time, it needs to be recognized that some major industrial disputes have arisen over
contract labor (regarding “regularization” and union recognition, for example), and some amount
of uncertainty will always prevail over the use of contract labor for getting around other labor
regulations. Ultimately, and more generally, whether or not India’s labor laws have created
significant rigidities in labor markets is an empirical issue.
15 For a detailed review of Indian labor regulations and the debate surrounding the issue of rigidity, see
Anant et al (2006). 16 The Act applies to all establishments employing at least 20 workmen as contract labor on any day in the
preceding 12 months, and to every contractor employing 20 or more contract workers in the same period. The Act provides for the registration of establishments of the principal employer employing contract labor and the licensing of contractors. The principal employer must provide facilities such as rest room, canteens, first aid, etc., if the contractor fails to do so. The principal employer must also ensure that the contractor pays the wages due to the laborers.
17 The share of contract labor in manufacturing has increased from around 12% in 1985 to 23% in 2002 (Ahsan and Pages, 2007). Certain states have seen a particularly sharp rise in the use of contract labor. Andhra Pradesh, which has seen the largest increase, passed a law in 2003 permitting contract labor employment in so-called “core” activities of firms and widening the scope of “non-core” activities (Anant et al, 2006).

26
Evidence on Labor Regulations and the Firm Size Distribution
How can we test whether India's labor regulations have affected the firm size distribution? We
follow Besley and Burgess (2004) who exploit variation in labor regulations across India's states
to develop a measure of the stance of labor regulations at the state-level. As per the Indian
constitution, states are given control over various aspects of regulation (and enforcement). Labor
market regulation is one such area and starting with Besley and Burgess, various studies have
attempted to codify state level differences in labor regulation. If labor regulations do generate
incentives to remain small, then states deemed to have "inflexible" ("flexible") labor regulations
should have a firm size distribution that is characterized by greater prevalence of smaller (larger)
firms and thus more employment in smaller firms relative to larger firms.
Unfortunately, quantifying differences in labor market regulations across states—a critical step
in evaluating whether labor regulations have affected different dimensions of industrial
performance—has proved to be contentious. For example, Besley and Burgess exploit state-
level amendments to the Industrial Disputes Act (IDA)—arguably the most important set of
labor regulations governing Indian industry—and code legislative changes across major states as
pro-worker, neutral, or pro-employer. Bhattacharjea (2006), however, has argued that deciding
whether an individual amendment to the IDA is pro-employer or pro-worker in an objective
manner is difficult. Even if individual amendments can be so coded, the actual workings of the
regulations can hinge on judicial interpretations of the amendments. Moreover, if noncompliance
with the regulations is widespread, then even an accurate coding of amendments which takes into
account the appropriate judicial interpretation loses its meaning.
A recent study that considers these complexities is Gupta, Hasan and Kumar (2009; henceforth
GHK). GHK’s starting point is the state-level indexes of labor regulations developed by Besley
and Burgess, Bhattacharjea (2008), and OECD (2007). While the Besley and Burgess measure
relies on amendments to the IDA as a whole, the Bhattacharjea measure focuses exclusively on
Chapter VB of the IDA—i.e, the section that deals with the requirement for firms to seek
government permission for layoffs, retrenchments, and closures. Moreover, Bhattacharjea
considers not only the content of legislative amendments, but also judicial interpretations to
Chapter VB in assessing the stance of states vis-à-vis labor regulation. Finally, Bhattacharjea

27
carries out his own assessment of legislative amendments as opposed to relying on that of Besley
and Burgess.
The OECD study, on the other hand, is based on a survey of experts and codes progress in
introducing changes in recent years to not only regulations dealing with labor issues, but also the
relevant administrative processes and enforcement machinery. The regulations covered by the
survey go well beyond the IDA and include the Factories Act, the Trade Union Act, and Contract
Labour Act among others. Within each major regulatory area, a number of issues is considered.
Scores are given on the basis of whether or not a given state has introduced changes. A higher
score is given for changes that are deemed to be pro-employer. The responses on each individual
item across the various regulatory and administrative areas are aggregated into an index that
reflects the extent to which procedural changes have reduced transaction costs vis-à-vis labor
issues.
GHK compare the stance of state-level labor regulations proposed by each of the three studies
and find similarities across them.18 In particular, they note that diametrically opposite
classifications of labor regulations for a given state—i.e., a state classified as having flexible
(inflexible) regulations by one measure and inflexible (flexible) by another—are unusual. They
thus assign scores of 1, 0, and -1 (denoting flexible, neutral, and inflexible regulations,
respectively) to each state based on information from the three studies and then adopt a simple
majority rule to come up with a composite index of labor regulations. The advantage of this
approach is that if a particular methodology or data source used by one of the underlying studies
is subject to measurement error, it will be get ignored due to the majority rule.
In what follows, we use the GHK composite index to categorize states in terms of whether their
labor regulations are flexible or inflexible.19 Five states are deemed to have flexible labor
18 For the purpose of their study, GHK consider time-invariant measures of state-level labor regulations.
They also make two important changes to the original coding of Besley and Burgess. First, based on the arguments of Bhattacharjea (2006), they treat labor regulations in Gujarat as neutral rather than pro-worker. Second, they deem Madhya Pradesh’s labor regulations to be neutral rather than mildly pro-employer.
19 We checked our results using GHK’s time-invariant measure of state-level labor regulations based on only the Besley and Burgess coding of amendments to the IDA. Results were quite similar, something

28
regulations: Andhra Pradesh, Karnataka, Rajasthan, Tamil Nadu, and Uttar Pradesh. The
remaining 10 states are deemed to have inflexible labor regulations: Assam, Bihar, Gujarat,
Haryana, Kerala, Madhya Pradesh, Maharashtra, Orissa, Punjab, and West Bengal.
Figure 10 shows the 2005 distribution of employment in formal (i.e., ASI firms) and informal
(i.e., NSSO firms, but excluding the OAME) manufacturing firms across: (i) two types of states:
those with inflexible and flexible labor regulations as per the GHK measure; and (ii) five size
groups: 1-9 employees, 10-49 employees, 50-99 employees, 100-199 employees, and 200 or
more employees.20 The definition of the size groups are influenced by the key employment
thresholds at which various regulations impinging on labor issues taken—i.e., 10/around 10 for
the Factories Act and Trade Union Act; 50 for certain provisions of the IDA and the Industrial
Employment (Standing Orders) Act; and 100 for Chapter VB of the IDA.
which is not surprising given that the two state-level measures only differ for two states. Kerala is considered a flexible labor regulation state, while Uttar Pradesh considered an inflexible labor regulation state in GHK’s time-invariant version of Besley and Burgess.
20 Employee data is used here since it is difficult to distinguish between different types of workers in the NSSO data.

29
Figure 10. Employment Share by Firm Size and Labor Regulation, 2005
Notes: States are distinguished in terms of whether they have inflexible (0) or flexible (1) labor regulations. Firms are distinguished by size groups defined in terms of number of employees. Source: Authors' computations based on ASI and NSSO datasets.
The distributions shown in the first panel are constructed using all 16 manufacturing industries.
As is quite clear, they are quite similar across inflexible and flexible labor regulation states.
More than 40% of manufacturing employment in both types of states is accounted for by firms
with less than 10 employees; firms with either 10-49 employees or 200 or more employees
account for between 20%-25% of manufacturing employment each; and medium-sized firms,
i.e., those with 50-99 employees and 100-199 employees, account for around 5%-6% of total
manufacturing employment each.21 Differences in the share of total manufacturing employment
21 Employment shares are specific to the type of state. More specifically, the employment share for any
particular size group and state type is calculated by dividing the employment generated by manufacturing firms belonging to that particular size group in states with a common stance on labor regulations (i.e., inflexible or flexible) by the total manufacturing employment in those states.
0.2
.4.6
Shar
e in
tota
l em
ploy
men
t by
stat
e ty
pe
1-9 10-49 50-99 100-199 200+0 1 0 1 0 1 0 1 0 1
All manufacturing industries
0.2
.4.6
Shar
e in
tota
l em
ploy
men
t by
stat
e ty
pe
1-9 10-49 50-99 100-199 200+0 1 0 1 0 1 0 1 0 1
Labor-intensive manufacturing industries
30
accounted by firms in a given size group are never larger than two percentage points across the
two types of states.
To some extent, the distribution of employment for both types of states is consistent with their
being affected by labor regulations. First, the largest share of employment is accounted for by
the smallest firm size group, a category that is least subject to labor regulations. Second,
employment shares are the lowest for medium-sized firms, the category where the main
potentially rigidity inducing regulations kick in (i.e., in the neighborhoods of 50 and 100
workers, if not at precisely 50 and 100 workers once imperfections in monitoring and
enforcement of labor regulations are allowed for). Finally, larger shares of employment are
accounted for by firms with 200 or more workers; while these large firms would certainly face
the full weight of labor regulations, their large size should also enable them to be in a better
position to profitably comply with the costs of regulations as compared to medium-sized firms.
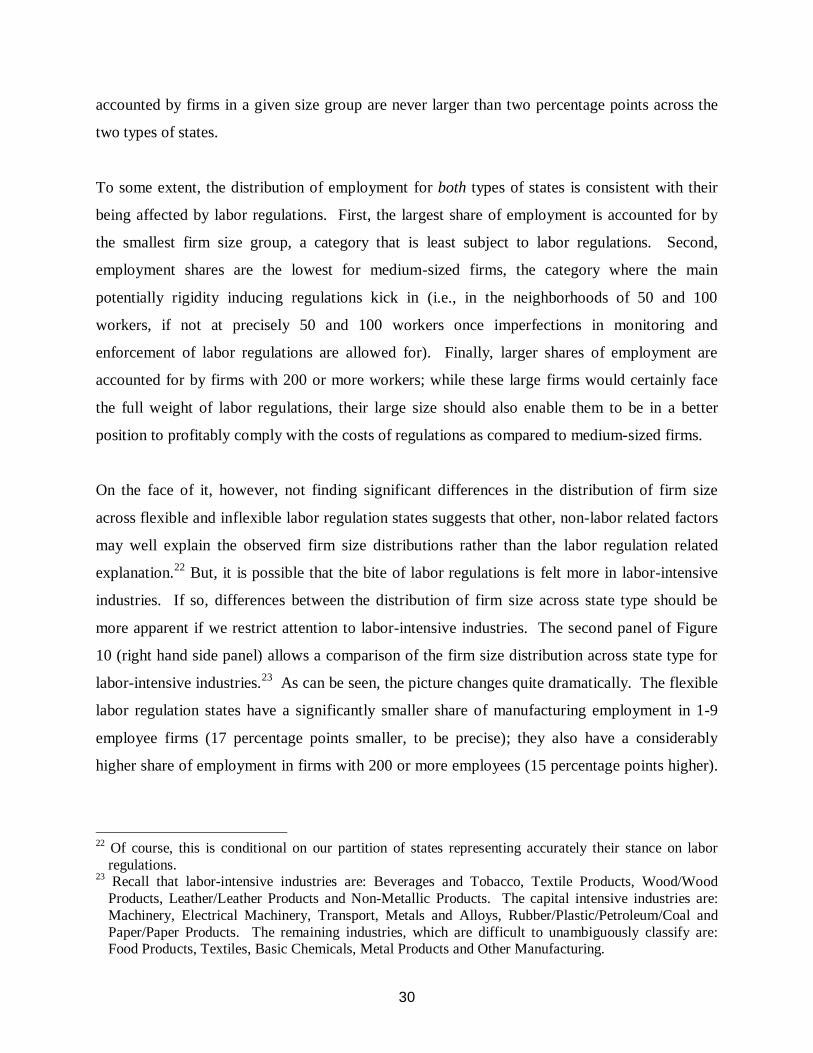
On the face of it, however, not finding significant differences in the distribution of firm size
across flexible and inflexible labor regulation states suggests that other, non-labor related factors
may well explain the observed firm size distributions rather than the labor regulation related
explanation.22 But, it is possible that the bite of labor regulations is felt more in labor-intensive
industries. If so, differences between the distribution of firm size across state type should be
more apparent if we restrict attention to labor-intensive industries. The second panel of Figure
10 (right hand side panel) allows a comparison of the firm size distribution across state type for
labor-intensive industries.23 As can be seen, the picture changes quite dramatically. The flexible
labor regulation states have a significantly smaller share of manufacturing employment in 1-9
employee firms (17 percentage points smaller, to be precise); they also have a considerably
higher share of employment in firms with 200 or more employees (15 percentage points higher).
22 Of course, this is conditional on our partition of states representing accurately their stance on labor
regulations. 23 Recall that labor-intensive industries are: Beverages and Tobacco, Textile Products, Wood/Wood
Products, Leather/Leather Products and Non-Metallic Products. The capital intensive industries are: Machinery, Electrical Machinery, Transport, Metals and Alloys, Rubber/Plastic/Petroleum/Coal and Paper/Paper Products. The remaining industries, which are difficult to unambiguously classify are: Food Products, Textiles, Basic Chemicals, Metal Products and Other Manufacturing.

31
The patterns are similar, though not as dramatic, if we use data from 1994 and if states are
partitioned on the basis of GHK’s Besley-Burgess measure.
Since labor-intensive industries are the ones in which the costs of labor are a significant share of
total production costs, the finding that states categorized as having inflexible labor regulations
have a much higher share of manufacturing employment in very small sized firms (i.e., firms
which are hardly subject to any labor regulation), and that states with flexible labor regulations
have a much larger share of manufacturing employment in large firms (i.e., firms which would
be subject to the full force of India's labor regulations, and likely to find their profitability
significantly affected by the costs of labor regulation relative to their counterparts in more
capital-intensive industries), are suggestive of a causal link between labor regulations and the
firm size distribution.
The case for a causal link would be strengthened if we could be more certain that our partition of
states is more influenced by labor regulations than something else—for example, some aspect of
the business environment unrelated to labor regulations. We thus consider how the distribution
of firm size varies across states partitioned on the basis of another characteristic, one likely to
have significant bearing on the prospects of manufacturing firms in general and not specifically
those operating in labor-intensive industries. In particular, we use the work of Kumar (2002) and
partition states into ones with relatively better or worse physical infrastructure. We then
examine how the size distribution of firms varies across these two types of states. As before, we
carry out this exercise for the entire sample of enterprises as well as those belonging to labor-
intensive industries only.
Figure 11 shows the resulting distributions of employment. Interestingly, when all
manufacturing industries are considered (left-hand side panel), states with better infrastructure
have a smaller share of total manufacturing employment in the smallest firms, i.e., with less than
10 employees. For all other size groups, states with better infrastructure have higher shares of
manufacturing employment. The differences are rarely large, however. More importantly,
restricting attention to labor-intensive industries does not yield dramatically different
distributions of employment across state type when distinguished in terms of the quality of

32
infrastructure. This is unlike the case of labor market regulations where large differences in
employment shares across state type appear in the case of labor-intensive industries, i.e., the
industries that should be most affected by labor regulations.
Figure 11. Employment Share by Firm Size and Infrastructure, 2005
Notes: States are distinguished in terms of whether they have weak (0) or strong (1) infrastructure. Firms are distinguished by size groups defined in terms of number of employees. Source: Authors' computations based on ASI and NSSO datasets.
We now turn to an analysis of the size distribution of employment and related issues using data
for formal manufacturing firms alone. As noted in Section 2, ASI data allow us to distinguish
between production workers and other employees, and also allow the former to be subdivided
into two categories that can be treated as regular workers and contract workers ( “directly” hired
workers and “workers employed through contractors” being the exact terms used in the ASI
surveys). They also allow analysis by age of enterprises (or as described in the ASI survey
questionnaire, year of initial production).
0.1
.2.3
.4.5
Sha
re in
tota
l em
ploy
men
t by
stat
e ty
pe
1-9 10-49 50-99 100-199 200+0 1 0 1 0 1 0 1 0 1
All manufacturing industries
0.1
.2.3
.4.5
Sha
re in
tota
l em
ploy
men
t by
stat
e ty
pe
1-9 10-49 50-99 100-199 200+0 1 0 1 0 1 0 1 0 1
Labor-intensive manufacturing industries

33
In what follows, we work with four size groups instead of the previous five. This is because we
drop formal enterprises with less than 10 regular workers given that the Factories Act, which
encompasses the universe of formal manufacturing firms, applies to firms with 10 or more
regular workers.24 The four size groups, based on the number of regular workers, are: 10-49
workers, 50-99 workers, 100-199 workers, and 200 or more workers. In so far as the
employment shares are concerned, we also construct these using data on regular workers. Figure
12 is the ASI data analog to Figure 10 and shows a very similar pattern: states with flexible labor
regulations have smaller (larger) employment shares in smaller (larger) sized firms when
attention is restricted to labor-intensive industries. Figure 12. Employment Share by Firm Size and Labor Regulation in the Formal Sector, 2005
Notes: States are distinguished in terms of whether they have inflexible (0) or flexible (1) labor regulations. Firms are distinguished by size groups defined in terms of number of regular production workers. Source: Authors' computations based on ASI data.
24 We also apply some filters such as dropping firms which report having more total employees than
production workers (i.e., regular workers plus contract workers). Fortunately, there are not too many such observations.
0.2
.4.6
Sha
re in
tota
l em
ploy
men
t by
stat
e ty
pe
10-49 50-99 100-199 200+0 1 0 1 0 1 0 1
All manufacturing industries
0.2
.4.6
Sha
re in
tota
l em
ploy
men
t by
stat
e ty
pe
10-49 50-99 100-199 200+0 1 0 1 0 1 0 1
Labor-intensive manufacturing industries

34
What is interesting in the case of ASI data is that this pattern is further reinforced when the ASI
firms are restricted to those that started production after 1982.25 As may be recalled, 1982 is
when Chapter VB of the IDA was amended to lower the threshold firm size above which
employers would have to seek formal permission from the government for laying off or
retrenching workers (i.e., from 300 workers to 100 workers). Thus, as may be seen by
comparing the first and second panels of Figure 13, the differentials in employment shares across
flexible and inflexible labor regulation states get accentuated when firms are restricted to those
which started production after 1982.26 Figure 13. Employment Share by Firm Size and Labor Regulation in the Labor-Intensive Formal Sector, 2005
Notes: States are distinguished in terms of whether they have inflexible (0) or flexible (1) labor regulations. Firms are distinguished by size groups defined in terms of number of regular production workers. Source: Authors' computations based on ASI data.
25 Firms failing to report the year in which they commenced production, or reporting it as earlier than
1800 or later than 2005 are dropped from this analysis. 26 The first panel of Figure 13 is virtually identical to the second panel of Figure 12; the only difference
stems from the omission of firms with missing or implausible information on year of establishment.
0.2
.4.6
Sha
re in
tota
l em
ploy
men
t by
stat
e ty
pe
10-49 50-99 100-199 200+0 1 0 1 0 1 0 1
All firms
0.2
.4.6
Sha
re in
tota
l em
ploy
men
t by
stat
e ty
pe
10-49 50-99 100-199 200+0 1 0 1 0 1 0 1
Post-1982 firms

Interestingly, and consistent with Figure 13, Table 6 reveals that of the firms operating in 2005, a
greater number had been established (commenced production, strictly speaking) in states with
flexible labor regulations after 1982 (first two column of the upper and lower panels).27 This is
true both in the aggregate as well as for every size group. However, this was not always the
case. For firms established prior to 1976, when Chapter VB of the IDA was first introduced, a
greater number operated in inflexible labor regulation states (last two columns of the upper and
lower panels). Again, this is true both in the aggregate as well as for every size group. This
pattern is particularly stark when we restrict attention to large firms in labor-intensive industries
(lower panel of Table 6). Thus, of the enterprises with 200 workers or more and established
post-1982, more than three times as many are in states with flexible labor regulations. In
contrast, for firms established prior to 1976, the number of enterprises in flexible labor regulation
states was only 70% of enterprises in inflexible labor regulation states. Table 6. Number of Firms in 2005 by Year of Initial Production, State Labor Regulation, and Industry Type
Size groups
(regular workers)
Post-1982 1976-1982 Pre-1976
Inflexible LR Flexible LR Inflexible
LR Flexible
LR Inflexible LR
Flexible LR
All Industries
10-49 16,889 16,984 2,652 1,686 3,532 2,075 50-99 2,304 2,869 336 339 706 401 100-199 1,219 1,704 166 240 674 405 200+ 877 1,154 214 236 758 471
Labor Intensive Industries
10-49 3,512 4,144 420 272 567 376 50-99 550 813 78 56 164 107 100-199 234 578 35 30 99 84 200+ 151 559 51 61 98 69
Notes : States are distinguished in terms of whether they have inflexible or flexible labor regulations (LR) Firms are distinguished by size groups defined in terms of number of regular production workers. Source: Authors' computations based on ASI data for 2005.
27 As with all other data analysis in this paper, the numbers reported in Table 6 are generated using survey
weights provided in the firm level data.

No analysis of effects on labor regulation on the employment patterns would be complete
without a look at the issue of contract labor. Table 7 describes for 1994, 2000, and 2005 both the
propensity of firms to hire contract workers, as well as the share of contract workers among all
production workers across different size groups of firms. The size groups used here are defined
on the basis of all production workers (i.e., regular plus contract workers) rather than only
regular workers as above.
Table 7. The Use of Contract Workers
Size groups (workers)
Firms with contract workers (%)
Average share of contract workers (%)
1994 2000 2005 1994 2000 2005
All Industries 10-49 18 21 25 11 14 17 50-99 30 38 46 19 24 31 100-199 30 38 46 16 21 29 200+ 32 43 50 13 19 27
Labor Intensive Industries
10-49 17 22 26 13 17 20 50-99 26 39 46 18 30 37 100-199 27 37 43 16 22 30 200+ 35 39 42 16 21 26 Note: Firms are distinguished by size groups defined in terms of number of production workers (i.e., on regular plus contract basis). Source: Authors' computations based on ASI data.
An examination of the first three columns of Table 7 reveals that the propensity of firms to hire
contract workers has increased over time and for each of the four size groups of firms.
Interestingly, within any given year a large increase in the propensity to hire contract workers
takes place as we go from firms with 10-49 production workers to firms with 50 or more
workers. Thus, for example, whereas around a quarter of firms with 10-49 workers used contract
workers in 2005, almost half did so among firms with 50-99 workers (regardless of whether we
consider all industries together or restrict attention to labor-intensive industries only). The
propensity increases over the subsequent two size groups when all industries are considered, but

37
nowhere as dramatically. Interestingly, when only labor-intensive industries are considered for
2005, the highest propensity to use contract workers is among firms with 50-99 workers.
A similar pattern emerges when we examine the average across firms of the share of contract
workers employed (i.e., the ratio of contract workers to all production workers). Thus, focusing
on data for 2005 (last column of Table 7), the share of contract workers almost doubles from an
average of 17% for firms with 10-49 workers to 31% for firms with 50-99 workers and tends to
stabilize beyond this size group. The corresponding increase for labor-intensive industries is
from 20% to 37%. Interestingly, the average share of contract workers peaks for the group of
firms with 50-99 workers. This is true for both all industries, as well as labor-intensive
industries alone.
It needs to be noted that while the use of contract workers should afford firms some “flexibility”
around labor regulations, it is not a very desirable solution to the potential rigidities caused by
labor regulations. From the perspective of workers, the higher wages and income stability that
comes with longer/stable tenure associated with regular work will always be preferable to
contract work. From the perspective of employers, Section 10 of the Contract Labour
(Regulation and Prohibition) Act creates uncertainties about the legitimate employment of
contract work in firms’ production processes. Indeed, the year 2011 has witnessed a series of
strikes across the country, especially in the motor vehicles and parts industry (Varma, 2011) and
the hiring of contract workers has been an underlying issue in many cases, suggesting that
flexibility earned through contract workers may be a short-term solution for firms.
7. Conclusion
In this paper, we have used establishment-level data from Indian manufacturing to examine the
distribution of firms across employment size groups. Like Mazumdar (2003) and Mazumdar and
Sarkar (2008) we find the Indian size distribution to be characterized by a heavy preponderance
of very small enterprises and a "missing middle" even with data as recent as 2005. We have also
discussed why such a pattern—especially a large share of employment accounted for by small
firms—can represent welfare losses. Like a wide international literature on the issue, we find

38
both average wages and labor productivity to be much lower in small firms as compared to large
firms.
We have also examined the possible role played by labor regulations in affecting firm size and its
distribution. Using available measures of labor regulations across India states, we find that in so
far as labor-intensive industries are concerned, states with more flexible (inflexible) labor
regulations tend to have a greater share of employment in larger (smaller) sized firms.
Moreover, this is more so for firms established after 1982, when an amendment to the Industrial
Disputes Act, perhaps the single most important piece of legislation affecting labor related issues
for Indian manufacturing, required firms with 100 workers or more to seek permission from the
government to lay off or retrench workers. Taken together, the results are suggestive of a link
between labor regulations and the firm size distribution.

39
References
Ahsan, Ahmad and Carmen Pagés. 2007. "Are All Labor Regulatıons Equal? Assessıng The
Effects Of Job Securıty, Labor Dıspute and Contract Labor Laws in Indıa." World Bank Policy Research Working Paper 4259, June.
Anant, T. C. A. 2000. “Reforming the Labour Market.” In S. Gangopadhyay and W. Wadhwa,
eds., Economic Reforms for the Poor. Konark, Delhi. Anant, T. C. A., R. Hasan, P. Mohapatra, R. Nagraj, and S. K. Sasikumar. 2006. “Labor Markets
in India: Issues and Perspectives.” In J. Felipe and R. Hasan, eds., Labor Markets in Asia: Issues and Perspectives. London: Palgrave Macmillan for the Asian Development Bank.
Asian Development Bank. 2009. Key Indicators 2009: Enterprises in Asia: Fostering
Dynamism in SMEs. Manila. Besley, Timothy and Robin Burgess. 2004. “Can regulation hinder economic performance?
Evidence from India.” The Quarterly Journal of Economics, 119(1): 91-134. Bhattacharjea, Aditya. 2006. “Labour market regulation and industrial performance in India: A
critical review of the empirical evidence.” The Indian Journal of Labour Economics, 49(2): 211-32.
__________. 2008. "How do Indian firms respond to employment protection legislation?"
Mimeo. de Mel, S., D. McKenzie and C. Woodruff. 2008. “Who Are the Microenterprise Owners?
Evidence from Sri Lanka on Tokman v. de Soto.” Policy Research Working Paper No. 4635. World Bank, Washington, DC.
de Soto, H. 1989. The Other Path: The Invisible Revolution in the Third World. New York:
Harper and Row. Gupta, Poonam, Rana Hasan, and Utsav Kumar. 2009. "Big Reforms but Small Payoffs:
Explaining the Weak Record of Growth in Indian Manufacturing." India Policy Forum, 5 Hasan, Rana, Devashish Mitra, and Asha Sundaram. 2010. The Determinants of Capital
Intensity in Manufacturing: The Role of Factor Endowments and Factor Market Imperfections. Mimeo, New York: Syracuse University.
Kumar, T. Ravi. 2002. “The Impact of Regional Infrastructure Investment in India”, Regional
Studies, 36(2): 194-200. Mazumdar, Dipak. 2009. "A Comparative Study Of The Size Structure Of Manufacturing In
Asian Countries." Mimeo. A Study Prepared For The Asian Development Bank.

40
Mazumdar, Dipak. 2003. “Small and Medium Enterprise Development in Equitable Growth and Poverty Alleviation” in Christopher M. Edmonds (ed) Reducing Poverty in Asia; Emerging Issues in Growth, Targeting and Measurement, Asian Development Bank, Edward Elgar, Chaltenham, UK.
Mazumdar, Dipak and Sandip Sarkar. 2008. Globalization, Labor Markets and Inequality in
India. Routledge, London and New York. McKinsey Global Institute. 2001. India: the growth imperative. September 2001. McKinsey &
Company. Moore, H. 1911. Laws of Wages: An Essay in Statistical Economics. New York: Augustus M.
Kelley. Nagaraj, Rayaprolu. 2002. “Trade and labor market linkages in India: Evidence and issues.”
Economic Series Working Paper no. 50. East West Center, Hawaii. Nataraj, Shanthi. 2009. "The Impact of Trade Liberalization on Productivity and Firm Size:
Evidence from India’s Formal and Informal Manufacturing Sectors." Mimeo. University of California, Berkeley.
Oi, W. and T.L. Idson. 1999. “Firm Size and Wages” in Orley C. Ashenfelter and David Card
(eds) Handbook of Labor Economics Volume 3B, Elsevier B.V., Amsterdam, the Netherlands.
Panagariya, Arvind. 2008. India: The Emerging Giant. USA: Oxford University Press. Planning Commission. 2001. Report of Task Force on Employment Opportunities. Government
of India, New Delhi. Ramaswamy, K. V. 2003. “Liberalization, Outsourcing and Industrial Labor Markets in India:
Some Preliminary Results.” In S. Uchikawa, ed., Labour Market and Institution in India, 1990s and Beyond. Manohar, New Delhi.
Tokman, V.E. 2007. “Modernizing the informal sector.” DESA Working Paper No. 42. United
Nations. Varma, Subodh. 2011. “Forces of Labour." Special Report, Times of India, November 6, page
18. New Delhi.
41
Appendix Figure 1. Employment Share by Firm Size Including OAME: Apparel vs. Motor Vehicles and Parts, 2005
Source: Authors' computations based on ASI and NSSO datasets.

42
Appendix Figure 2. Employment Share by Firm Size in China and India Including OAME: Apparel, 2005
Source: Authors' computations based on ASI and NSSO datasets for India and ADB (2009) for China.