Colours and Spectral Types: Learning about stars from their spectra
29
c Swinburne University of Technology, 2010 HET603-M05A01: Colours and Spectral Types: Learning about stars from their spectra PAGE 1 OF 29 Colours and Spectral Types: Learning about stars from their spectra Credit: Carl Hergenrother, 1997
Transcript of Colours and Spectral Types: Learning about stars from their spectra

c©S
winburne
University
ofTechnology,2010HET603-M05A01: Colours and Spectral Types: Learningabout stars from their spectra
PAGE 1 OF 29
Colours and Spectral Types: Learning about stars from theirspectra
Credit: Carl Hergenrother, 1997

c©S
winburne
University
ofTechnology,2010HET603-M05A01: Colours and Spectral Types: Learningabout stars from their spectra
PAGE 2 OF 29
Summary
In this Activity we will learn about the enormous amount of information contained in the spectra ofstars. In particular, we will discuss:
• the three types of specra - continuous, absorption and emission; and
• what spectra can tell us about the properties of stars by studying:
– the spectral line shape;
– spectral line shift;
– line broadening; and
– spectral line strength.

c©S
winburne
University
ofTechnology,2010HET603-M05A01: Colours and Spectral Types: Learningabout stars from their spectra
PAGE 3 OF 29
Stellar spectra
Spectrum of a star
When we break starlight up into its component wavelengths,we can plot the intensity (or flux) of the light against wavelengthto obtain the stellar spectrum.
We can glean a lot of information about the star by studyingthe overall shape of its spectrum, including the colour at whichthe spectrum reaches its maximum height and the overallnarrowness or broadness of the spectrum. Further, the positionof the spectrum, whether it is shifted toward the red or blue,and the relative strength of spectral lines provide additionalinformation about the properties of the star.
Studying stellar spectra can tell us about the temperature,composition and motion of stars. But first, let’s learn aboutthe three different type of spectra.

c©S
winburne
University
ofTechnology,2010HET603-M05A01: Colours and Spectral Types: Learningabout stars from their spectra
PAGE 4 OF 29
Three types of spectra
There are three types of spectra of interest to astronomers:
1. Continuous spectrum
This is the overall hill-shaped spectrum of electromagnetic radiation emitted by a black body.
c©S
winburne
University
ofTechnology,2010HET603-M05A01: Colours and Spectral Types: Learningabout stars from their spectra
PAGE 5 OF 29
2. Absorption spectrum
The absorption spectrum is a continuous spectrum, but with the flux of certain frequencies reducedbecause something absorbed them between the source and Earth.

c©S
winburne
University
ofTechnology,2010HET603-M05A01: Colours and Spectral Types: Learningabout stars from their spectra
PAGE 6 OF 29
3. Emission spectrum
An emission spectrum looks very different: Rather than a continuous spectrum, we see emission atspecific wavelengths.You will see the spectrum shown below in red. Why ?

c©S
winburne
University
ofTechnology,2010HET603-M05A01: Colours and Spectral Types: Learningabout stars from their spectra
PAGE 7 OF 29
Emission spectra explained
An emission spectrum is made by an object such as a cloud of gas emitting radiation rather thanabsorbing it.
It can only emit those same wavelengths that it can absorb, and those wavelengths will depend onthe atoms comprising the gas.

c©S
winburne
University
ofTechnology,2010HET603-M05A01: Colours and Spectral Types: Learningabout stars from their spectra
PAGE 8 OF 29
Emission versus absorption spectra
The type of spectrum you see will depend on how the source, the cloud of gas and how you are allarranged.

c©S
winburne
University
ofTechnology,2010HET603-M05A01: Colours and Spectral Types: Learningabout stars from their spectra
PAGE 9 OF 29
The three spectra
Here are simplified versions of the three spectra as they might be observed on photographic film.
1. Continuous spectrum
2. Absorption spectrum
3. Emission spectrum
In the real world, we always see a mixture of all three!

c©S
winburne
University
ofTechnology,2010HET603-M05A01: Colours and Spectral Types: Learningabout stars from their spectra
PAGE 10 OF 29
Two important assumptions
Stellar spectra can be extremely powerful, providing a great deal of information about stars. Forexample, if we know the distance to the star (by parallax methods) and we have the spectrum of thestar, we can detremine the motion of the star, the size of the star, and the its temperature.
However, we need to make two important assumptions.

c©S
winburne
University
ofTechnology,2010HET603-M05A01: Colours and Spectral Types: Learningabout stars from their spectra
PAGE 11 OF 29
Assumption 1: Blackbody radiation
As we saw in the Activity Magnitudes and Colours of Stars, it is assumed that a star behaves likea blackbody1 and emits a spectrum that is well described by various equations and laws of thermalphysics.
This assumption is made so that the overall shapes of spectra and the position of their maxima canbe compared quantitatively, and is based on what we know about the Sun and nearby stars.
1 To learn more about blackbody radiation, click here.

c©S
winburne
University
ofTechnology,2010HET603-M05A01: Colours and Spectral Types: Learningabout stars from their spectra
PAGE 12 OF 29
Assumption 2: Same composition
It is assumed that almost all stars have the same initial composition: Mostly hydrogen (H), somehelium (He), and traces of other elements (mostly light elements).
As far as we can tell, this is true; stars seem to be made up of much the same kind of stuff.

c©S
winburne
University
ofTechnology,2010HET603-M05A01: Colours and Spectral Types: Learningabout stars from their spectra
PAGE 13 OF 29
Why assume the stars have the same initial composition?
Because radiation leaving the inner regions of a star forms a continuous spectrum. Howeverdifferent particles in the photosphere absorb particular wavelengths as the radiation passes throughit. As a result there are gaps in the spectrum - spectral lines - and the results is an absorptionspectrum.
If the photospheres of stars have pretty much the same in composition, then these lines should occurin the absorption spectra for all stars.
The same should apply to emission spectra.

c©S
winburne
University
ofTechnology,2010HET603-M05A01: Colours and Spectral Types: Learningabout stars from their spectra
PAGE 14 OF 29
These two assumptions are made so that the overall shape of spectrum, and the position, width andstrength of absorption or emission lines within the spectra of different stars can be compared.
In reality, there are differences both in the overall continuous spectrum and in the fine detail of theabsorption and emission lines.
It is these differences that help astronomers to find out more about stars.

c©S
winburne
University
ofTechnology,2010HET603-M05A01: Colours and Spectral Types: Learningabout stars from their spectra
PAGE 15 OF 29
Comparing stellar spectra
Let’s have a look at some of the differences between the spectra of stars, and see what informationcan be deduced.
We will start off with the differences that you can see in the overall shape and position of thespectrum.
c©S
winburne
University
ofTechnology,2010HET603-M05A01: Colours and Spectral Types: Learningabout stars from their spectra
PAGE 16 OF 29
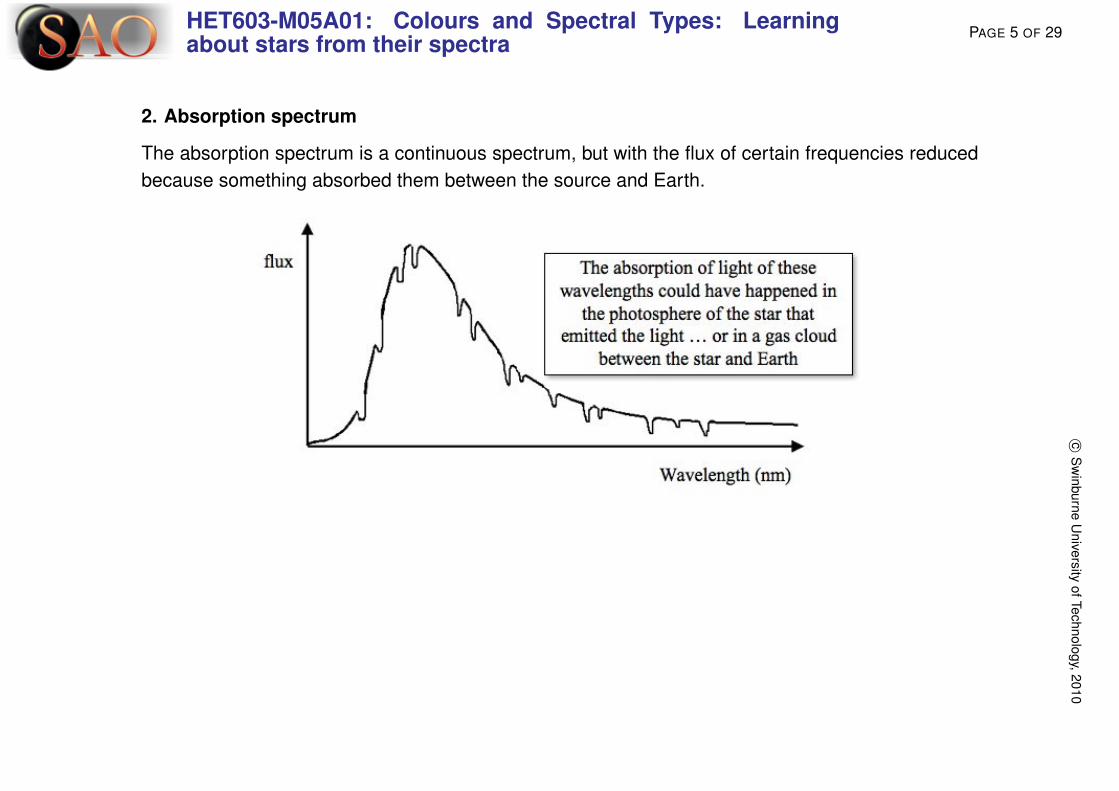
1. ”The whole spectrum has stretched, and the peak hasmoved...”
One of the most common differences between spectra is the position of the peak with respect towavelength, combined with an overall change in steepness.

c©S
winburne
University
ofTechnology,2010HET603-M05A01: Colours and Spectral Types: Learningabout stars from their spectra
PAGE 17 OF 29
According to the rules governing blackbody radiation, the spectrum of a hotter star will have ahigher, sharper peak closer to the blue end of the spectrum.
A cooler star will have a lower, flatter peak closer to the red end of the spectrum.
(Strictly speaking, every blackbody spectrum has the same functional form, but the total area varieswith size and temperature and the peak obey’s Wien’s law, peaking at a shorter wavelengths withincreasing temperature.)

c©S
winburne
University
ofTechnology,2010HET603-M05A01: Colours and Spectral Types: Learningabout stars from their spectra
PAGE 18 OF 29
The total energy radiated is proportional to the area under the graph multiplied by the frequencyof the light.
For the diagram below, we can clearly see that a hot star must radiate more energy than a cool star.

c©S
winburne
University
ofTechnology,2010HET603-M05A01: Colours and Spectral Types: Learningabout stars from their spectra
PAGE 19 OF 29
2. ”The entire spectrum is shifted”
Sometimes the spectrum of a star is like that of our Sun (or another known star)... except that theentire spectrum is moved towards the red end or the blue end.
There isn’t much change in “steepness” or intensity, just in position.
This effect is due to stellar motions - stars moving towards us will have their spectrum shifted to theblue end, and those moving away will have their spectrum shifted towards the red end.

c©S
winburne
University
ofTechnology,2010HET603-M05A01: Colours and Spectral Types: Learningabout stars from their spectra
PAGE 20 OF 29
Blue shift
If the spectrum (emission or absorption) were compared to a known, calibrated spectrum for a similarobject which is not moving relative to Earth, then the same features would be there but would all beshifted towards the blue end of the spectrum.

c©S
winburne
University
ofTechnology,2010HET603-M05A01: Colours and Spectral Types: Learningabout stars from their spectra
PAGE 21 OF 29
Red shift
Similarly, if an object emits light as it moves rapidly away from us, then its light is “stretched” and allfeatures of the spectrum are shifted towards the red end of the spectrum.

c©S
winburne
University
ofTechnology,2010HET603-M05A01: Colours and Spectral Types: Learningabout stars from their spectra
PAGE 22 OF 29
Red/blue shift
So if a star or galaxy or other object is zooming towards the Earth at any significant speed, thatspeed can easily be calculated by checking the spectrum of the star.
The entire spectrum will be shifted towards the blue end. The shift in wavelength and the “original”unshifted wavelength are related by:
Exactly the same sort of equation is used to work out the speed of an object if it is racing away fromEarth. In that case the light will be red shifted.

c©S
winburne
University
ofTechnology,2010HET603-M05A01: Colours and Spectral Types: Learningabout stars from their spectra
PAGE 23 OF 29
Reading between the lines
You can do more than examine the peak position and height of a spectrum, and check it for red orblue shift.
It is also possible to read ”between the lines” in astronomy! That is, you can study the individual lineswithin a spectrum and gain information from them.
We will now look at some of the variations that are found.

c©S
winburne
University
ofTechnology,2010HET603-M05A01: Colours and Spectral Types: Learningabout stars from their spectra
PAGE 24 OF 29
3. ”Why aren’t my lines sharp?”
Sometimes the lines within a spectrum are spread out, moved towards both the red end and theblue end of the spectrum at the same time. What does this mean?

c©S
winburne
University
ofTechnology,2010HET603-M05A01: Colours and Spectral Types: Learningabout stars from their spectra
PAGE 25 OF 29
Gas particles, when in an interstellar cloud or in the photosphere of a star, are moving at random asthey emit light.
The hotter the gas, the more likely it is that some fast-moving particles will emit light which reachesus blue- or red-shifted.
c©S
winburne
University
ofTechnology,2010HET603-M05A01: Colours and Spectral Types: Learningabout stars from their spectra
PAGE 26 OF 29
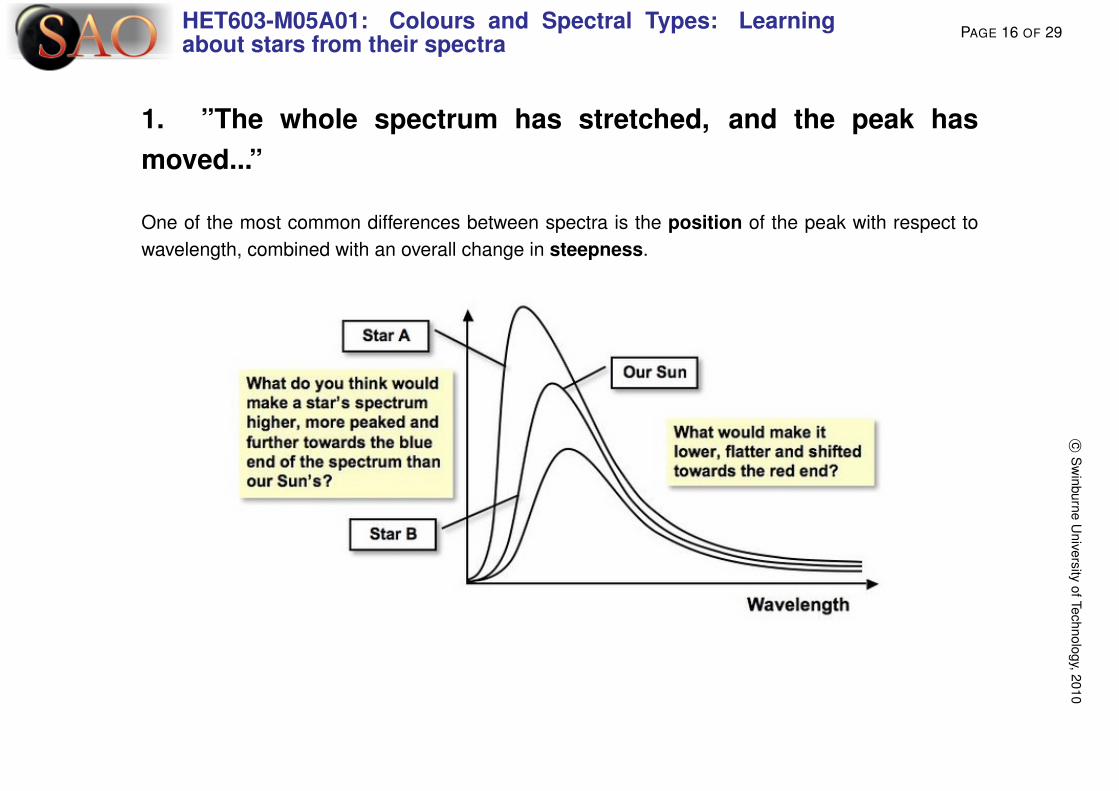
So a spectral line that would be expected to be very thin (confined to just one particular wavelength)is in fact spread across neighbouring wavelengths as well due to the random motion in a hot gas.This is called “broadening”.

c©S
winburne
University
ofTechnology,2010HET603-M05A01: Colours and Spectral Types: Learningabout stars from their spectra
PAGE 27 OF 29
4. ”Why are the lines different strengths?”
What if the strength of the lines differs between the spectrum of a star and that of the Sun?

c©S
winburne
University
ofTechnology,2010HET603-M05A01: Colours and Spectral Types: Learningabout stars from their spectra
PAGE 28 OF 29
This is yet another indication of temperature. If temperature in a gas varies, the sorts of processeswhich allow light to be emitted also vary: some processes get stronger and others get weaker.
Different line strengths can also be due to changes in the relative chemical abundance between twostars. The chemical composition of the star and relative elemental abundances can also affect theline strengths. The more Carbon present at the surface of the star, the more strength its carbon lineswill possess.
In the next Activity, we will study the most important of these processes: in particular, the Balmerseries.
c©S
winburne
University
ofTechnology,2010HET603-M05A01: Colours and Spectral Types: Learningabout stars from their spectra
PAGE 29 OF 29
Summary
In this Activity, we have learnt about three different types of spectra - continous, absorption andemission. We also learnt how a star’s properties can affect its spectrum and in particular that
• hot stars will have a high spectrum peaked towards the blue end;
• cool stars will have a low, flat spectrum peaked towards the red end;
• if a star is moving rapidly towards us (or away from us), then the entire spectrum is shiftedtowards the blue (or the red) end of the spectrum;
• that very hot stars will have broadened spectral lines; and
• that the relative line strength of absorption or emission lines can also indicate the temperatureof the star.
In the next Activity, we will learn more about line strength, the Balmer series, and how stars areclassifed according to their spectral type.