Colorado School of Minesinside.mines.edu/UserFiles/File/finance/controller/CSM...November 11, 2013...
53
Colorado School of Mines Financial Statements and Independent Auditor’s Report Financial Audit Years Ended June 30, 2013 and 2012
Transcript of Colorado School of Minesinside.mines.edu/UserFiles/File/finance/controller/CSM...November 11, 2013...

Colorado School of Mines
Financial Statements and Independent Auditor’s Report Financial Audit
Years Ended June 30, 2013 and 2012
Colorado School of Mines Years Ended June 30, 2013 and 2012
TABLE OF CONTENTS
FINANCIAL AUDIT REPORT SECTION
Independent Auditor’s Report ........................................................................................ 1
Management’s Discussion and Analysis (Unaudited) .................................................. 3
Financial Statements
Statements of Net Position ......................................................................................................... 17
Statements of Revenues, Expenses and Changes in Net Position .............................................. 18
Statements of Cash Flows .......................................................................................................... 19
Notes to Financial Statements .................................................................................................... 21
THIS PAGE LEFT BLANK INTENTIONALLY
Independent Auditor’s Report
Members of the Legislative Audit Committee:
Report on the Financial Statements
We have audited the accompanying financial statements of the business-type activities and the discretely presented component unit of the Colorado School of Mines, State of Colorado (the School) as of and for the years ended June 30, 2013 and 2012, and the related notes to the financial statements, which collectively comprise the School’s basic financial statements as listed in the table of contents.
Management’s Responsibility for the Financial Statements
Management is responsible for the preparation and fair presentation of these financial statements in accordance with accounting principles generally accepted in the United States of America; this includes the design, implementation and maintenances of internal control relevant to the preparation and fair presentation of financial statements that are free from material misstatement, whether due to fraud or error.
Auditor’s Responsibility
Our responsibility is to express opinions on these financial statements based on our audits. We did not audit the financial statements of the Colorado School of Mines Foundation, Incorporated (the Foundation), the discretely presented component unit of the School. Those statements were audited by other auditors whose report thereon has been furnished to us, and our opinions, insofar as it relates to the amounts included for the Foundation, are based solely on the report of the other auditors. We conducted our audits in accordance with auditing standards generally accepted in the United States of America. Those standards require that we plan and perform the audit to obtain reasonable assurance about whether the financial statements are free of material misstatement.
An audit involves performing procedures to obtain audit evidence about the amounts and disclosures in the financial statements. The procedures selected depend on the auditor’s judgment, including the assessment of the risks of material misstatement of the financial statements, whether due to fraud or error. In making those risk assessments, the auditor considers internal control relevant to the School’s preparation and fair presentation of the financial statements in order to design audit procedures that are appropriate in the circumstance, but not for the purpose of expressing an opinion on the effectiveness of the School’s internal control. Accordingly, we express no such opinion. An audit also includes evaluating the appropriateness of accounting policies used and the reasonableness of significant accounting estimates made by management, as well as evaluating the overall presentation of the financial statements.
We believe that the audit evidence we have obtained is sufficient and appropriate to provide a basis for our audit opinions.
Members of the Legislative Audit Committee
2
Opinions
In our opinion, based on our audits and the report of the other auditors, the financial statements referred to above present fairly, in all material respects, the respective financial position of the business-type activities and the discretely presented component unit of the School as of June 30, 2013 and 2012, and the respective changes in financial position and, where applicable, cash flows thereof for the years then ended in conformity with accounting principles generally accepted in the United States of America.
Emphasis of Matters
As discussed in Note 1, the financial statements of the Colorado School of Mines are intended to present the financial position, changes in financial position and, where applicable, cash flows of only that portion of the business-type activities and the discretely presented component unit of the State of Colorado that is attributable to the transactions of the School. They do not purport to, and do not, present fairly the financial position of the State of Colorado as of June 30, 2013 and 2012, and the changes in its financial position, or, where applicable, its cash flows for the years then ended in conformity with the accounting principles generally accepted in the United States of America. Our opinion is not modified with respect to this matter.
As discussed in Note 11 to the financial statements, in 2013, the School adopted new accounting guidance, Governmental Accounting Standards Board Statement No. 65, Items Previously Reported as Assets and Liabilities. Our opinion is not modified with respect to this matter.
Required Supplementary Information
Accounting principles generally accepted in the United States of America require that the management’s discussion listed in the table of contents, be presented to supplement the basic financial statements. Such information, although not part of the basic financial statements, is required by the Governmental Accounting Standards Board who considers it to be an essential part of financial reporting for placing the basic financial statements in an appropriate operational, economic or historical context. We have applied certain limited procedures to the required supplementary information in accordance with auditing standards generally accepted in the United States of America, which consisted of inquiries of management about the methods of preparing the information and comparing the information for consistency with management’s responses to our inquiries, the basic financial statements and other knowledge we obtained during our audit of the basic financial statements. We do not express an opinion or provide any assurance on the information because the limited procedures do not provide us with sufficient evidence to express an opinion or provide any assurance.
Denver, Colorado November 11, 2013
Colorado School of Mines Management’s Discussion and Analysis
(Unaudited) Year Ended June 30, 2013
3
This financial discussion and analysis of the Colorado School of Mines (the School) is intended to make the School’s financial statements easier to understand and communicate the School’s financial situation in an open and accountable manner. It provides an objective analysis of the School’s financial position (Statements of Net Position) and results of operations (Statements of Revenues, Expenses and Changes in Net Position) as of and for the years ended June 30, 2013 and 2012 (Fiscal Years 2013 and 2012, respectively) with comparative information for Fiscal Year 2011. Certain amounts reported in these two statements for Fiscal Years 2012 and 2011 have been restated in the various tables below to reflect the adoption of new accounting standards. See Note 11. School management is responsible for the completeness and fairness of this discussion and analysis and the financial statements, as well as the underlying system of internal controls.
Understanding the Financial Statements
Financial highlights are presented in this discussion and analysis to help your assessment of the School’s financial activities. Since the presentation includes highly summarized data, it should be read in conjunction with the financial statements, which have the following five parts:
Independent Auditor’s Report presents an unmodified opinion prepared by our auditors, an independent certified public accounting firm, on the fairness, in all material respects, of our financial statements.
Statements of Net Position present the assets, deferred outflows, liabilities, deferred inflows, and net position of the School at a point in time (June 30, 2013 and 2012). Their purpose is to present a financial snapshot of the School. They aid readers in determining the assets available to continue the School’s operations; how much the School owes to employees, vendors and creditors; and a picture of net positions and their availability for expenditure by the School.
Statements of Revenues, Expenses and Changes in Net Position present the total revenues earned and expenses incurred by the School for operating, nonoperating and other related activities during a period of time (the years ended June 30, 2013 and 2012). Their purpose is to assess the School’s operating and nonoperating activities.
Statements of Cash Flows present the cash receipts and disbursements of the School during a period of time (the years ended June 30, 2013 and 2012). Their purpose is to assess the School’s ability to generate net cash flows to meet its obligations as they come due.
Notes to the Financial Statements present additional information to support the financial statements and are commonly referred to as “Notes.” Their purpose is to clarify and expand on the information in the financial statements. Notes are referenced in this discussion and analysis to indicate where details of the financial highlights may be found.
We suggest that you combine this financial discussion and analysis with relevant nonfinancial indicators to assess the overall health of the School. Examples of nonfinancial indicators include trend and quality of student applicants, incoming class size and quality, student retention, building condition and campus safety. Information about nonfinancial indicators is not included in this discussion and analysis but may be obtained from the School’s Public Relations and Marketing Office. It should be noted that the School’s financial statements include the presentation of a discretely presented component unit, the Colorado School of Mines Foundation, Incorporated (the Foundation), which is a required presentation by accounting standards.
Colorado School of Mines Management’s Discussion and Analysis
(Unaudited) Year Ended June 30, 2013
4
Financial Highlights
Selected financial highlights for Fiscal Year 2013 include:
School assets totaled $502,149,000, deferred outflows of $14,987,000, with liabilities of $277,583,000 and net position of $239,553,000. Of the $239,553,000 in net position, $124,182,000 is net investment in capital assets, $6,535,000 is nonexpendable gifts, $22,281,000 is restricted but expendable, and $86,555,000 is unrestricted and may be used to meet ongoing School obligations.
The School’s total net position increased by $22,197,000. The increase is primarily due to higher operating revenues generated by tuition and fees, sponsored project activity, and auxiliary operations, as well as capital grants and contributions and additions to permanent endowments.
Cash and cash equivalents as of June 30, 2013 totaled $183,026,000. Net cash provided by operating activities was $16,329,000, net cash provided by noncapital financing activities was $15,645,000, net cash provided by capital and related financing activities was $32,599,000 and net cash provided by investing activities was $450,000 for a net increase in cash and cash equivalents for the fiscal year of $65,023,000.
The School completed the Marquez Hall academic building, started construction on the Elm Street Residence and Dining Hall and began planning for the Clear Creek Athletic Complex.
The following sections provide further explanations of the School’s financial health.
Statements of Net Position
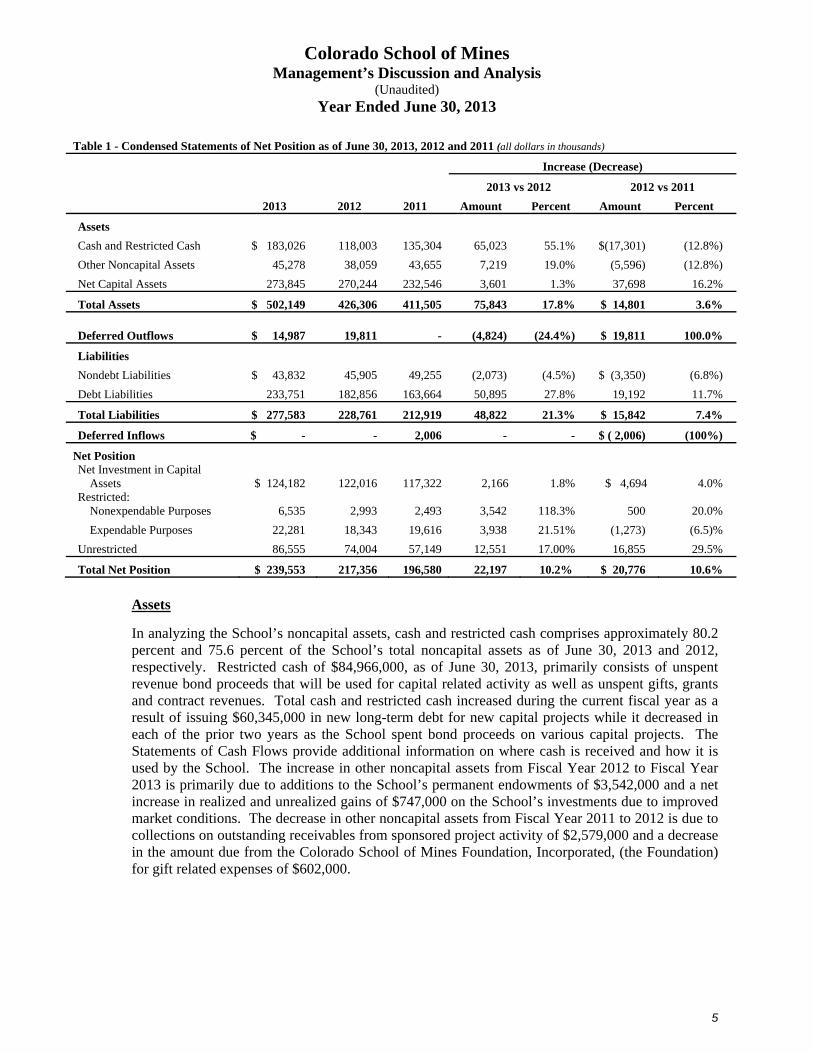
Table 1 - Condensed Statements of Net Position presents a financial snapshot of the School and serves, over time, as a useful indicator of the strength of the School’s financial position. It presents the fiscal resources (assets), claims against those resources (liabilities) and residual net position available for future operations (net position). Analysis of the School’s deferred outflows, deferred inflows, capital assets and related debt is included in the section titled Capital Assets and Debt Management, while this section provides analysis of the School’s noncapital assets and other liabilities.
Colorado School of Mines Management’s Discussion and Analysis
(Unaudited) Year Ended June 30, 2013
5
Table 1 - Condensed Statements of Net Position as of June 30, 2013, 2012 and 2011 (all dollars in thousands)
Increase (Decrease)
2013 vs 2012 2012 vs 2011
2013 2012 2011 Amount Percent Amount Percent
Assets
Cash and Restricted Cash $ 183,026 118,003 135,304 65,023 55.1% $(17,301) (12.8%)
Other Noncapital Assets 45,278 38,059 43,655 7,219 19.0% (5,596) (12.8%)
Net Capital Assets 273,845 270,244 232,546 3,601 1.3% 37,698 16.2%
Total Assets $ 502,149 426,306 411,505 75,843 17.8% $ 14,801 3.6%
Deferred Outflows $ 14,987 19,811 - (4,824) (24.4%) $ 19,811 100.0%
Liabilities
Nondebt Liabilities $ 43,832 45,905 49,255 (2,073) (4.5%) $ (3,350) (6.8%)
Debt Liabilities 233,751 182,856 163,664 50,895 27.8% 19,192 11.7%
Total Liabilities $ 277,583 228,761 212,919 48,822 21.3% $ 15,842 7.4%
Deferred Inflows $ - - 2,006 - - $ ( 2,006) (100%)
Net Position Net Investment in Capital
Assets $ 124,182 122,016 117,322 2,166 1.8% $ 4,694 4.0% Restricted:
Nonexpendable Purposes 6,535 2,993 2,493 3,542 118.3% 500 20.0%
Expendable Purposes 22,281 18,343 19,616 3,938 21.51% (1,273) (6.5)%
Unrestricted 86,555 74,004 57,149 12,551 17.00% 16,855 29.5%
Total Net Position $ 239,553 217,356 196,580 22,197 10.2% $ 20,776 10.6%
Assets
In analyzing the School’s noncapital assets, cash and restricted cash comprises approximately 80.2 percent and 75.6 percent of the School’s total noncapital assets as of June 30, 2013 and 2012, respectively. Restricted cash of $84,966,000, as of June 30, 2013, primarily consists of unspent revenue bond proceeds that will be used for capital related activity as well as unspent gifts, grants and contract revenues. Total cash and restricted cash increased during the current fiscal year as a result of issuing $60,345,000 in new long-term debt for new capital projects while it decreased in each of the prior two years as the School spent bond proceeds on various capital projects. The Statements of Cash Flows provide additional information on where cash is received and how it is used by the School. The increase in other noncapital assets from Fiscal Year 2012 to Fiscal Year 2013 is primarily due to additions to the School’s permanent endowments of $3,542,000 and a net increase in realized and unrealized gains of $747,000 on the School’s investments due to improved market conditions. The decrease in other noncapital assets from Fiscal Year 2011 to 2012 is due to collections on outstanding receivables from sponsored project activity of $2,579,000 and a decrease in the amount due from the Colorado School of Mines Foundation, Incorporated, (the Foundation) for gift related expenses of $602,000.
Colorado School of Mines Management’s Discussion and Analysis
(Unaudited) Year Ended June 30, 2013
6
Nondebt Liabilities
The School’s nondebt related liabilities totaling $43,832,000 and $45,905,000 as of June 30, 2013 and 2012, respectively, comprise 15.8 percent and 20.1 percent, respectively, of the total liabilities. The largest three categories of nondebt related liabilities are payables to vendors, accrued salaries and benefits, and unearned revenue on sponsored projects. Accrued salaries and benefits represent amounts owed to School employees, primarily for June payroll and compensated absences, but not paid as of fiscal year-end. Unearned sponsored project revenue represents amounts paid by grantors and contractors for which the School has not met all of the requirements for revenue recognition. These amounts will be recognized as revenue in future periods after all requirements have been satisfied. See Notes 6, 7 and 8 for additional information.
The decrease in nondebt related liabilities from Fiscal Year 2012 to 2013 is primarily due to a decrease of $3,655,000 in accounts payable to vendors. During the year, several large construction projects were completed and therefore less was owed to vendors at year-end compared to the prior year. The primary cause of the decrease in nondebt related liabilities from Fiscal Year 2011 to 2012 is a decrease of $2,648,000 in unearned revenue on sponsored projects.
Net Position
A portion of the School’s net position has restrictions imposed by external parties, such as donors, or are invested in capital assets (property, plant and equipment) and are therefore not immediately available to spend. To help understand these restrictions, the School’s net position is shown in four categories.
The largest category of net position relates to the School’s net investment in capital assets. This consists of the School’s capital assets less accumulated depreciation and related debt issued to fund the purchase or construction of those assets. This category comprises 51.8 percent and 56.1 percent of net position for Fiscal Years 2013 and 2012, respectively. This amount represents the School’s investments in campus facilities and equipment that is necessary to carry out the teaching, research, and student centered mission of the School. The increases over the past three years reflect the School’s commitment to improving the student’s on campus experience through new and renovated student and academic facilities and various infrastructure improvements.
Net position restricted nonexpendable represents gift funds received from donors whereby the donor has specified the original principal be set aside for perpetual investment (endowment). The majority of the endowment assets benefiting the School are held and managed by the Foundation, which is a discretely presented component unit (Note 1). The Foundation’s net position is not included in Table 1.
Net position restricted expendable represents funds received for specific purposes, but allow the School to fully expend those funds in accordance with the purposes identified by the entity providing the funds. This includes spendable distributions from the School’s endowments.
Net position unrestricted represents the amount available for spending for any lawful purpose and are at the full discretion of management. In some instances, management or the Board has placed internal designations on the use of these funds.
Colorado School of Mines Management’s Discussion and Analysis
(Unaudited) Year Ended June 30, 2013
7
Statements of Revenues, Expenses and Changes in Net Position
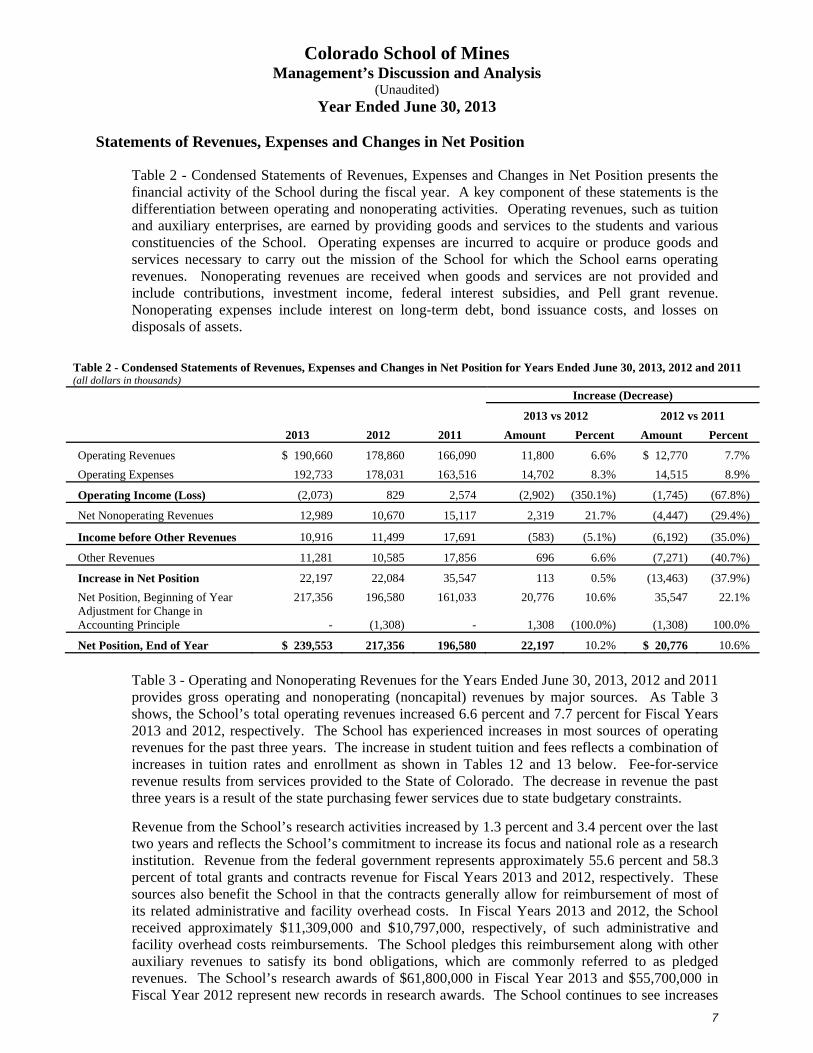
Table 2 - Condensed Statements of Revenues, Expenses and Changes in Net Position presents the financial activity of the School during the fiscal year. A key component of these statements is the differentiation between operating and nonoperating activities. Operating revenues, such as tuition and auxiliary enterprises, are earned by providing goods and services to the students and various constituencies of the School. Operating expenses are incurred to acquire or produce goods and services necessary to carry out the mission of the School for which the School earns operating revenues. Nonoperating revenues are received when goods and services are not provided and include contributions, investment income, federal interest subsidies, and Pell grant revenue. Nonoperating expenses include interest on long-term debt, bond issuance costs, and losses on disposals of assets.
Table 2 - Condensed Statements of Revenues, Expenses and Changes in Net Position for Years Ended June 30, 2013, 2012 and 2011 (all dollars in thousands)
Increase (Decrease)
2013 vs 2012 2012 vs 2011
2013 2012 2011 Amount Percent Amount Percent
Operating Revenues $ 190,660 178,860 166,090 11,800 6.6% $ 12,770 7.7%
Operating Expenses 192,733 178,031 163,516 14,702 8.3% 14,515 8.9%
Operating Income (Loss) (2,073) 829 2,574 (2,902) (350.1%) (1,745) (67.8%)
Net Nonoperating Revenues 12,989 10,670 15,117 2,319 21.7% (4,447) (29.4%)
Income before Other Revenues 10,916 11,499 17,691 (583) (5.1%) (6,192) (35.0%)
Other Revenues 11,281 10,585 17,856 696 6.6% (7,271) (40.7%)
Increase in Net Position 22,197 22,084 35,547 113 0.5% (13,463) (37.9%)
Net Position, Beginning of Year 217,356 196,580 161,033 20,776 10.6% 35,547 22.1% Adjustment for Change in Accounting Principle - (1,308) - 1,308 (100.0%) (1,308) 100.0%
Net Position, End of Year $ 239,553 217,356 196,580 22,197 10.2% $ 20,776 10.6%
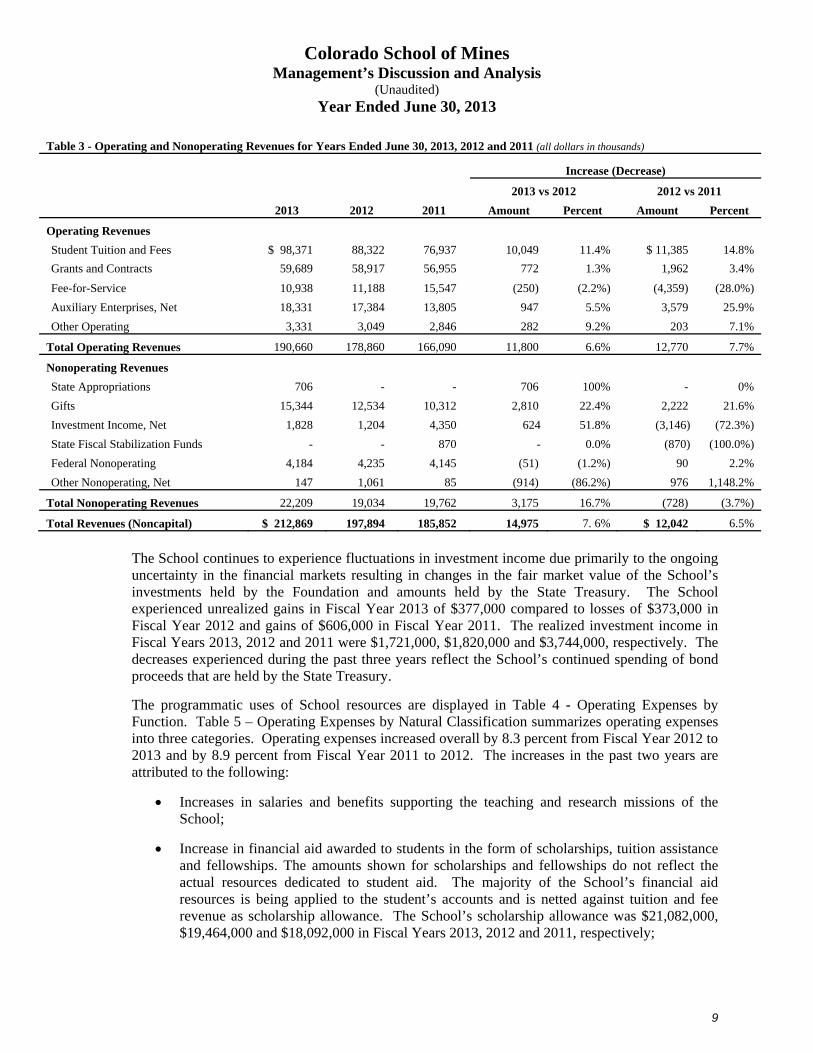
Table 3 - Operating and Nonoperating Revenues for the Years Ended June 30, 2013, 2012 and 2011 provides gross operating and nonoperating (noncapital) revenues by major sources. As Table 3 shows, the School’s total operating revenues increased 6.6 percent and 7.7 percent for Fiscal Years 2013 and 2012, respectively. The School has experienced increases in most sources of operating revenues for the past three years. The increase in student tuition and fees reflects a combination of increases in tuition rates and enrollment as shown in Tables 12 and 13 below. Fee-for-service revenue results from services provided to the State of Colorado. The decrease in revenue the past three years is a result of the state purchasing fewer services due to state budgetary constraints.
Revenue from the School’s research activities increased by 1.3 percent and 3.4 percent over the last two years and reflects the School’s commitment to increase its focus and national role as a research institution. Revenue from the federal government represents approximately 55.6 percent and 58.3 percent of total grants and contracts revenue for Fiscal Years 2013 and 2012, respectively. These sources also benefit the School in that the contracts generally allow for reimbursement of most of its related administrative and facility overhead costs. In Fiscal Years 2013 and 2012, the School received approximately $11,309,000 and $10,797,000, respectively, of such administrative and facility overhead costs reimbursements. The School pledges this reimbursement along with other auxiliary revenues to satisfy its bond obligations, which are commonly referred to as pledged revenues. The School’s research awards of $61,800,000 in Fiscal Year 2013 and $55,700,000 in Fiscal Year 2012 represent new records in research awards. The School continues to see increases
Colorado School of Mines Management’s Discussion and Analysis
(Unaudited) Year Ended June 30, 2013
8
in funding from both federal and private industries sources while Federal American Recovery and Reinvestment Act (ARRA) spending continues to decrease as the associated ARRA funded projects come to an end. The School receives funding from the State of Colorado in two ways; (1) fee-for-service contracts with the Department of Higher Education and (2) stipends to qualified undergraduate students used to pay a portion of tuition. Funding in Fiscal Years 2013 and 2012 related to fee-for-service contracts decreased by $250,000 and $4,359,000, respectively. The decreases are a result of the state’s continuing budget shortfalls.
The anticipated funding related to student stipends is incorporated into the School’s student tuition and fees rates. In Fiscal Years 2013, 2012 and 2011, the School applied $5,146,000, $5,066,000 and $5,039,000, respectively, of stipends against student bills. The per credit hour stipend allotted per student approved by the State Legislature for the past three fiscal years was $62. The number of stipend eligible hours students applied for during Fiscal Years 2013, 2012 and 2011 were 83,003.75, 81,676.50 and 81,948.00, respectively.
The fluctuations in fee-for-service funding each year corresponds with fluctuations in funding from the State Fiscal Stabilization Funds (SFSF). On February 17, 2009, ARRA was signed into law. ARRA is a $787 billion economic package designed to stimulate the national economy out of a continued recession. Included in the package was $144 billion of federal funds allocated to state governments, via the SFSF to mitigate the impacts of cuts to the state’s budgets as a result of the recession. The State of Colorado received $760 million from SFSF over a three year period, of which $622 million was allocated for education stabilization. Funding from SFSF stopped at the end of Fiscal Year 2011.
Gifts for noncapital purposes, received primarily from the School’s Foundation, have increased in each of the past two years. This reflects a continued strong fundraising effort by the School’s Foundation and a need to draw on those funds to replace ongoing decreases in funding from the state.
Federal nonoperating revenues consist of interest subsidies received for taxable Build America Bonds (BABs) issued by the School in addition to financial aid received under the Pell program. The School received $1,223,000, $1,297,000 and $1,080,000 in federal interest subsidies in Fiscal Years 2013, 2012 and 2011, respectively. The decrease in revenue experienced in Fiscal Year 2013 is a direct result of the federal sequestration. The increase from Fiscal Year 2011 to Fiscal Year 2012 is due to receiving a full year’s worth of interest subsidy on the three related bond issues in Fiscal Year 2012 versus in Fiscal Year 2011 when a full year of subsidy related to two bond issues and a half year subsidy on a third issue. Revenues from the Pell program for Fiscal Years 2013, 2012 and 2011 were $2,961,000, $2,938,000 and $3,066,000, respectively.
Colorado School of Mines Management’s Discussion and Analysis
(Unaudited) Year Ended June 30, 2013
9
Table 3 - Operating and Nonoperating Revenues for Years Ended June 30, 2013, 2012 and 2011 (all dollars in thousands)
Increase (Decrease)
2013 vs 2012 2012 vs 2011
2013 2012 2011 Amount Percent Amount Percent
Operating Revenues
Student Tuition and Fees $ 98,371 88,322 76,937 10,049 11.4% $ 11,385 14.8%
Grants and Contracts 59,689 58,917 56,955 772 1.3% 1,962 3.4%
Fee-for-Service 10,938 11,188 15,547 (250) (2.2%) (4,359) (28.0%)
Auxiliary Enterprises, Net 18,331 17,384 13,805 947 5.5% 3,579 25.9%
Other Operating 3,331 3,049 2,846 282 9.2% 203 7.1%
Total Operating Revenues 190,660 178,860 166,090 11,800 6.6% 12,770 7.7%
Nonoperating Revenues
State Appropriations 706 - - 706 100% - 0%
Gifts 15,344 12,534 10,312 2,810 22.4% 2,222 21.6%
Investment Income, Net 1,828 1,204 4,350 624 51.8% (3,146) (72.3%)
State Fiscal Stabilization Funds - - 870 - 0.0% (870) (100.0%)
Federal Nonoperating 4,184 4,235 4,145 (51) (1.2%) 90 2.2%
Other Nonoperating, Net 147 1,061 85 (914) (86.2%) 976 1,148.2%
Total Nonoperating Revenues 22,209 19,034 19,762 3,175 16.7% (728) (3.7%)
Total Revenues (Noncapital) $ 212,869 197,894 185,852 14,975 7. 6% $ 12,042 6.5%
The School continues to experience fluctuations in investment income due primarily to the ongoing uncertainty in the financial markets resulting in changes in the fair market value of the School’s investments held by the Foundation and amounts held by the State Treasury. The School experienced unrealized gains in Fiscal Year 2013 of $377,000 compared to losses of $373,000 in Fiscal Year 2012 and gains of $606,000 in Fiscal Year 2011. The realized investment income in Fiscal Years 2013, 2012 and 2011 were $1,721,000, $1,820,000 and $3,744,000, respectively. The decreases experienced during the past three years reflect the School’s continued spending of bond proceeds that are held by the State Treasury.
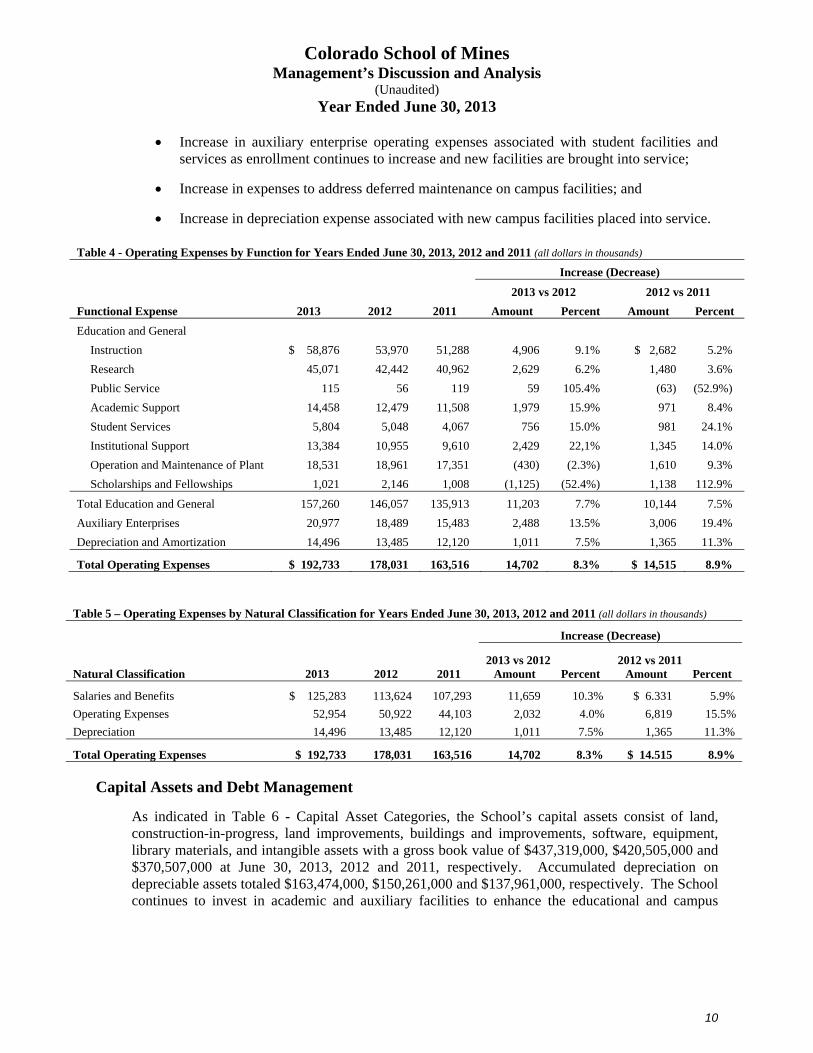
The programmatic uses of School resources are displayed in Table 4 - Operating Expenses by Function. Table 5 – Operating Expenses by Natural Classification summarizes operating expenses into three categories. Operating expenses increased overall by 8.3 percent from Fiscal Year 2012 to 2013 and by 8.9 percent from Fiscal Year 2011 to 2012. The increases in the past two years are attributed to the following:
Increases in salaries and benefits supporting the teaching and research missions of the School;
Increase in financial aid awarded to students in the form of scholarships, tuition assistance and fellowships. The amounts shown for scholarships and fellowships do not reflect the actual resources dedicated to student aid. The majority of the School’s financial aid resources is being applied to the student’s accounts and is netted against tuition and fee revenue as scholarship allowance. The School’s scholarship allowance was $21,082,000, $19,464,000 and $18,092,000 in Fiscal Years 2013, 2012 and 2011, respectively;
Colorado School of Mines Management’s Discussion and Analysis
(Unaudited) Year Ended June 30, 2013
10
Increase in auxiliary enterprise operating expenses associated with student facilities and services as enrollment continues to increase and new facilities are brought into service;
Increase in expenses to address deferred maintenance on campus facilities; and
Increase in depreciation expense associated with new campus facilities placed into service.
Table 4 - Operating Expenses by Function for Years Ended June 30, 2013, 2012 and 2011 (all dollars in thousands)
Increase (Decrease)
2013 vs 2012 2012 vs 2011
Functional Expense 2013 2012 2011 Amount Percent Amount Percent
Education and General
Instruction $ 58,876 53,970 51,288 4,906 9.1% $ 2,682 5.2%
Research 45,071 42,442 40,962 2,629 6.2% 1,480 3.6%
Public Service 115 56 119 59 105.4% (63) (52.9%)
Academic Support 14,458 12,479 11,508 1,979 15.9% 971 8.4%
Student Services 5,804 5,048 4,067 756 15.0% 981 24.1%
Institutional Support 13,384 10,955 9,610 2,429 22,1% 1,345 14.0%
Operation and Maintenance of Plant 18,531 18,961 17,351 (430) (2.3%) 1,610 9.3%
Scholarships and Fellowships 1,021 2,146 1,008 (1,125) (52.4%) 1,138 112.9%
Total Education and General 157,260 146,057 135,913 11,203 7.7% 10,144 7.5%
Auxiliary Enterprises 20,977 18,489 15,483 2,488 13.5% 3,006 19.4%
Depreciation and Amortization 14,496 13,485 12,120 1,011 7.5% 1,365 11.3%
Total Operating Expenses $ 192,733 178,031 163,516 14,702 8.3% $ 14,515 8.9%
Table 5 – Operating Expenses by Natural Classification for Years Ended June 30, 2013, 2012 and 2011 (all dollars in thousands)
Increase (Decrease)
2013 vs 2012 2012 vs 2011 Natural Classification 2013 2012 2011 Amount Percent Amount Percent
Salaries and Benefits $ 125,283 113,624 107,293 11,659 10.3% $ 6.331 5.9%
Operating Expenses 52,954 50,922 44,103 2,032 4.0% 6,819 15.5%
Depreciation 14,496 13,485 12,120 1,011 7.5% 1,365 11.3%
Total Operating Expenses $ 192,733 178,031 163,516 14,702 8.3% $ 14.515 8.9%
Capital Assets and Debt Management
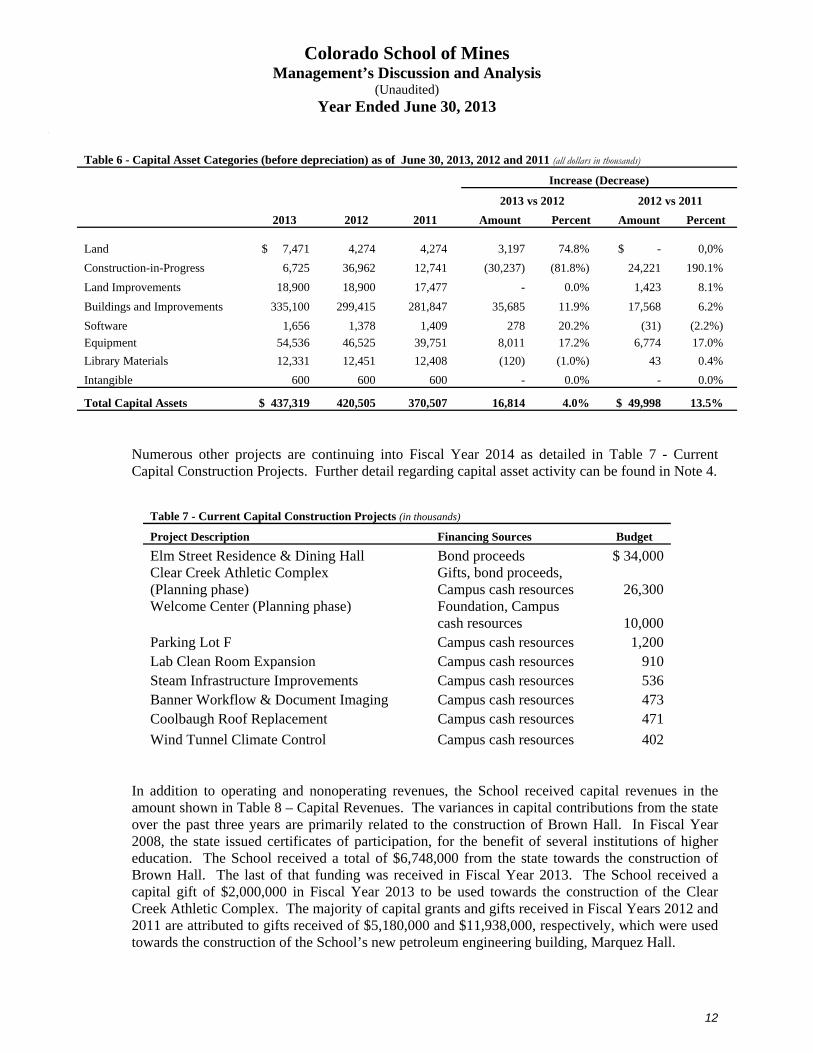
As indicated in Table 6 - Capital Asset Categories, the School’s capital assets consist of land, construction-in-progress, land improvements, buildings and improvements, software, equipment, library materials, and intangible assets with a gross book value of $437,319,000, $420,505,000 and $370,507,000 at June 30, 2013, 2012 and 2011, respectively. Accumulated depreciation on depreciable assets totaled $163,474,000, $150,261,000 and $137,961,000, respectively. The School continues to invest in academic and auxiliary facilities to enhance the educational and campus
Colorado School of Mines Management’s Discussion and Analysis
(Unaudited) Year Ended June 30, 2013
11
experience for students. During the construction of a project, costs are accumulated in construction-in-progress. Upon completion of the project, the costs are moved out of construction-in-progress into buildings and improvements. During the past three years, the School has completed or began construction on the following capital projects:
Completion of the Brown Hall academic building addition. This was a $35,000,000 bond funded project financed in large part through a student academic facility fee and by $6,748,000 of certificates of participation issued by the State of Colorado.
Completion of Maple Hall, a 291 bed residence hall. This was a $28,500,000 bond funded project that will be repaid by revenues generated by the School’s housing operations.
Completion of the Weaver Towers renovation, a 224 bed residence hall originally built in 1978. This was an $11,900,000 bond funded project that will be repaid by revenues generated by the School’s housing operations.
Completion of Marquez Hall and Wing. Marquez Hall is a $25,000,000 project financed entirely through private contributions. The Hall houses the School’s Petroleum Engineering program. The Wing is an $11,000,000 academic addition that is a bond funded project financed by student academic facility fees.
Completion of the new W. Lloyd Wright Student Wellness Center. This is a $3,200,000 bond funded project that replaced the School’s aging student health center. The bonds will be repaid from student health fees.
Completion of $2,800,000 of energy conservation improvements throughout campus funded by taxable qualified energy conservation bonds that will be repaid through energy savings.
Began construction of the Elm Street Residence and Dining Hall, a 200 bed residence hall
and 500 seat student dining facility. This is a $34,000,000 bond funded project that will be repaid by revenues generated by the School’s housing operations. The new facility is expected to be placed in service by the fall of 2014.
During Fiscal Year 2013, the School began planning for the following projects:
Welcome Center. This will be the new headquarters of the Foundation and the Alumni Association. The $10,000,000 project will be funded from a combination of Foundation funds, bonds, and School cash resources. The bonds issued to fund a portion of the project will be repaid from rent received from the Foundation.
Clear Creek Athletic Complex. This project will construct and equip a contemporary
football stadium to complement the existing turf football field at Campbell Field, locker room and training facilities for more than 200 football and track and field athletes, office and event facilities, functional space for club sports and intramurals, and updates and additions to the existing soccer pitch area that include locker and restroom facilities and a modern press box.
Colorado School of Mines Management’s Discussion and Analysis
(Unaudited) Year Ended June 30, 2013
12
Numerous other projects are continuing into Fiscal Year 2014 as detailed in Table 7 - Current Capital Construction Projects. Further detail regarding capital asset activity can be found in Note 4.
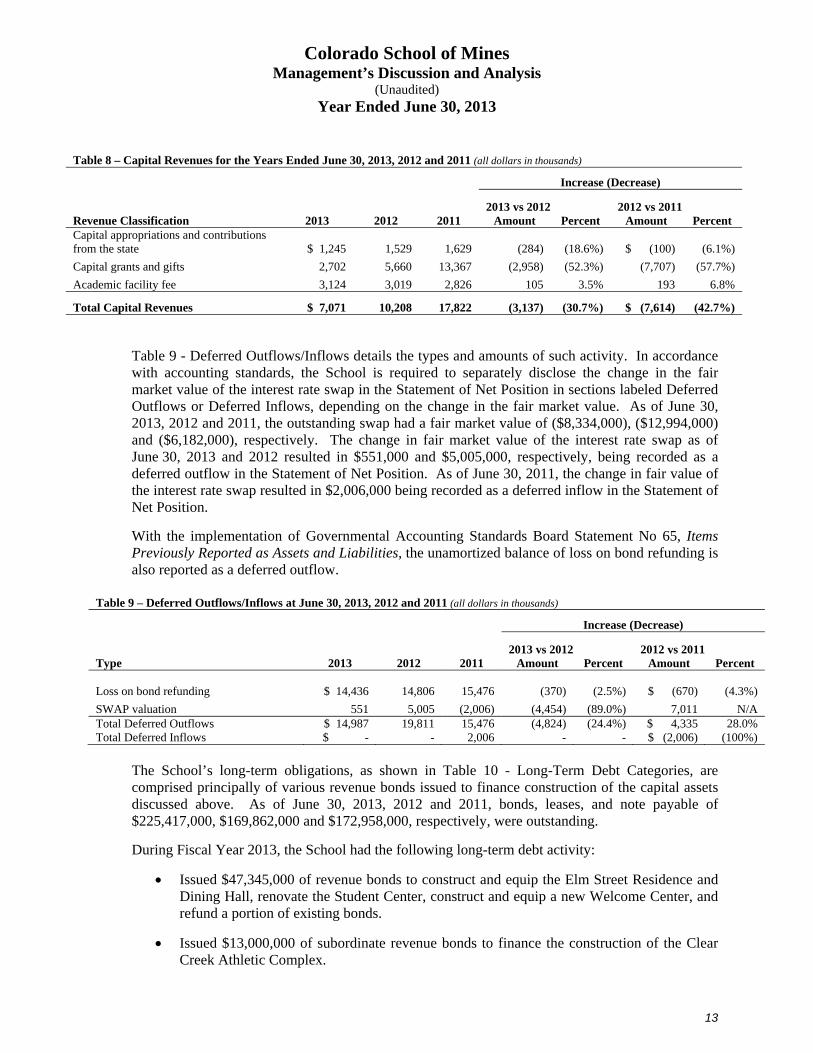
In addition to operating and nonoperating revenues, the School received capital revenues in the amount shown in Table 8 – Capital Revenues. The variances in capital contributions from the state over the past three years are primarily related to the construction of Brown Hall. In Fiscal Year 2008, the state issued certificates of participation, for the benefit of several institutions of higher education. The School received a total of $6,748,000 from the state towards the construction of Brown Hall. The last of that funding was received in Fiscal Year 2013. The School received a capital gift of $2,000,000 in Fiscal Year 2013 to be used towards the construction of the Clear Creek Athletic Complex. The majority of capital grants and gifts received in Fiscal Years 2012 and 2011 are attributed to gifts received of $5,180,000 and $11,938,000, respectively, which were used towards the construction of the School’s new petroleum engineering building, Marquez Hall.
Table 6 - Capital Asset Categories (before depreciation) as of June 30, 2013, 2012 and 2011 (all dollars in thousands)
Increase (Decrease)
2013 vs 2012 2012 vs 2011
2013 2012 2011 Amount Percent Amount Percent
Land $ 7,471 4,274 4,274
3,197 74.8% $ - 0,0%
Construction-in-Progress 6,725 36,962 12,741 (30,237) (81.8%) 24,221 190.1%
Land Improvements 18,900 18,900 17,477 - 0.0% 1,423 8.1%
Buildings and Improvements 335,100 299,415 281,847 35,685 11.9% 17,568 6.2%
Software 1,656 1,378 1,409 278 20.2% (31) (2.2%)
Equipment 54,536 46,525 39,751 8,011 17.2% 6,774 17.0%
Library Materials 12,331 12,451 12,408 (120) (1.0%) 43 0.4%
Intangible 600 600 600 - 0.0% - 0.0%
Total Capital Assets $ 437,319 420,505 370,507 16,814 4.0% $ 49,998 13.5%
Table 7 - Current Capital Construction Projects (in thousands)
Project Description Financing Sources Budget
Elm Street Residence & Dining Hall Bond proceeds $ 34,000Clear Creek Athletic Complex (Planning phase)
Gifts, bond proceeds, Campus cash resources 26,300
Welcome Center (Planning phase)
Foundation, Campus cash resources 10,000
Parking Lot F Campus cash resources 1,200Lab Clean Room Expansion Campus cash resources 910Steam Infrastructure Improvements Campus cash resources 536Banner Workflow & Document Imaging Campus cash resources 473Coolbaugh Roof Replacement Campus cash resources 471
Wind Tunnel Climate Control Campus cash resources 402
Colorado School of Mines Management’s Discussion and Analysis
(Unaudited) Year Ended June 30, 2013
13
Table 8 – Capital Revenues for the Years Ended June 30, 2013, 2012 and 2011 (all dollars in thousands)
Increase (Decrease)
2013 vs 2012 2012 vs 2011 Revenue Classification 2013 2012 2011 Amount Percent Amount Percent Capital appropriations and contributions from the state $ 1,245 1,529 1,629 (284) (18.6%) $ (100) (6.1%)
Capital grants and gifts 2,702 5,660 13,367 (2,958) (52.3%) (7,707) (57.7%)
Academic facility fee 3,124 3,019 2,826 105 3.5% 193 6.8%
Total Capital Revenues $ 7,071 10,208 17,822 (3,137) (30.7%) $ (7,614) (42.7%)
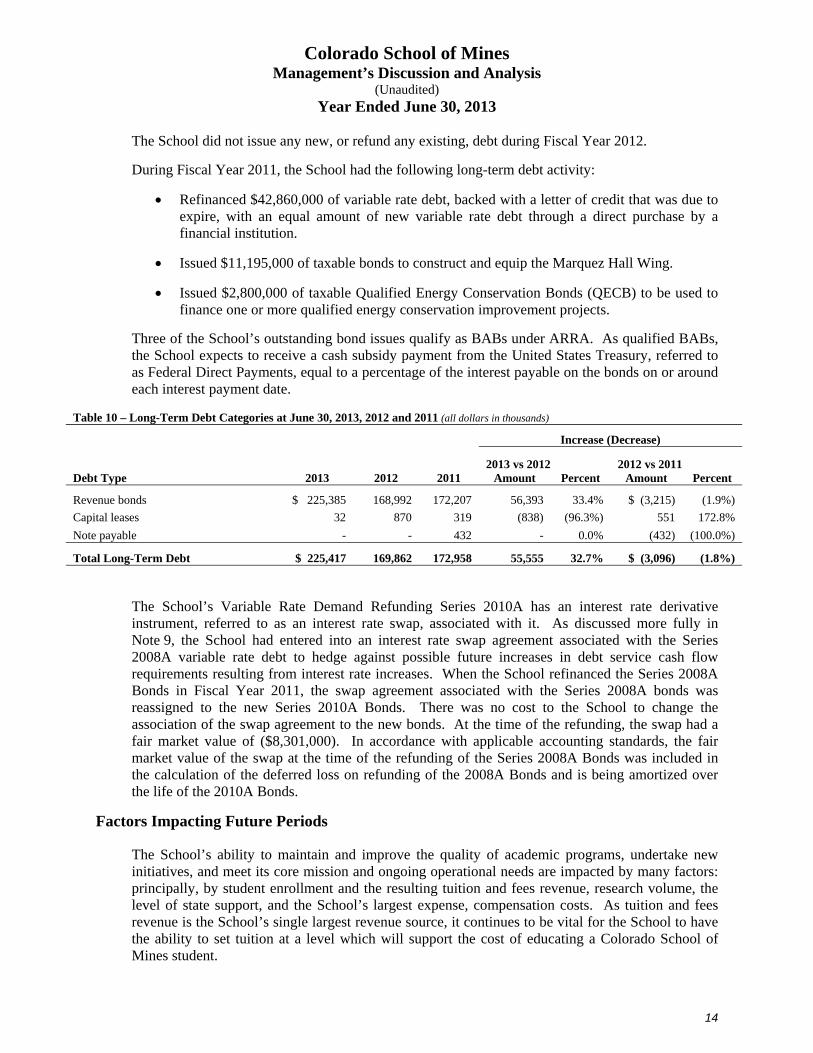
Table 9 - Deferred Outflows/Inflows details the types and amounts of such activity. In accordance with accounting standards, the School is required to separately disclose the change in the fair market value of the interest rate swap in the Statement of Net Position in sections labeled Deferred Outflows or Deferred Inflows, depending on the change in the fair market value. As of June 30, 2013, 2012 and 2011, the outstanding swap had a fair market value of ($8,334,000), ($12,994,000) and ($6,182,000), respectively. The change in fair market value of the interest rate swap as of June 30, 2013 and 2012 resulted in $551,000 and $5,005,000, respectively, being recorded as a deferred outflow in the Statement of Net Position. As of June 30, 2011, the change in fair value of the interest rate swap resulted in $2,006,000 being recorded as a deferred inflow in the Statement of Net Position.
With the implementation of Governmental Accounting Standards Board Statement No 65, Items Previously Reported as Assets and Liabilities, the unamortized balance of loss on bond refunding is also reported as a deferred outflow.
Table 9 – Deferred Outflows/Inflows at June 30, 2013, 2012 and 2011 (all dollars in thousands)
Increase (Decrease)
2013 vs 2012 2012 vs 2011 Type 2013 2012 2011 Amount Percent Amount Percent
Loss on bond refunding $ 14,436
14,806 15,476 (370) (2.5%) $ (670) (4.3%)
SWAP valuation 551 5,005 (2,006) (4,454) (89.0%) 7,011 N/A Total Deferred Outflows $ 14,987 19,811 15,476 (4,824) (24.4%) $ 4,335 28.0% Total Deferred Inflows $ - - 2,006 - - $ (2,006) (100%)
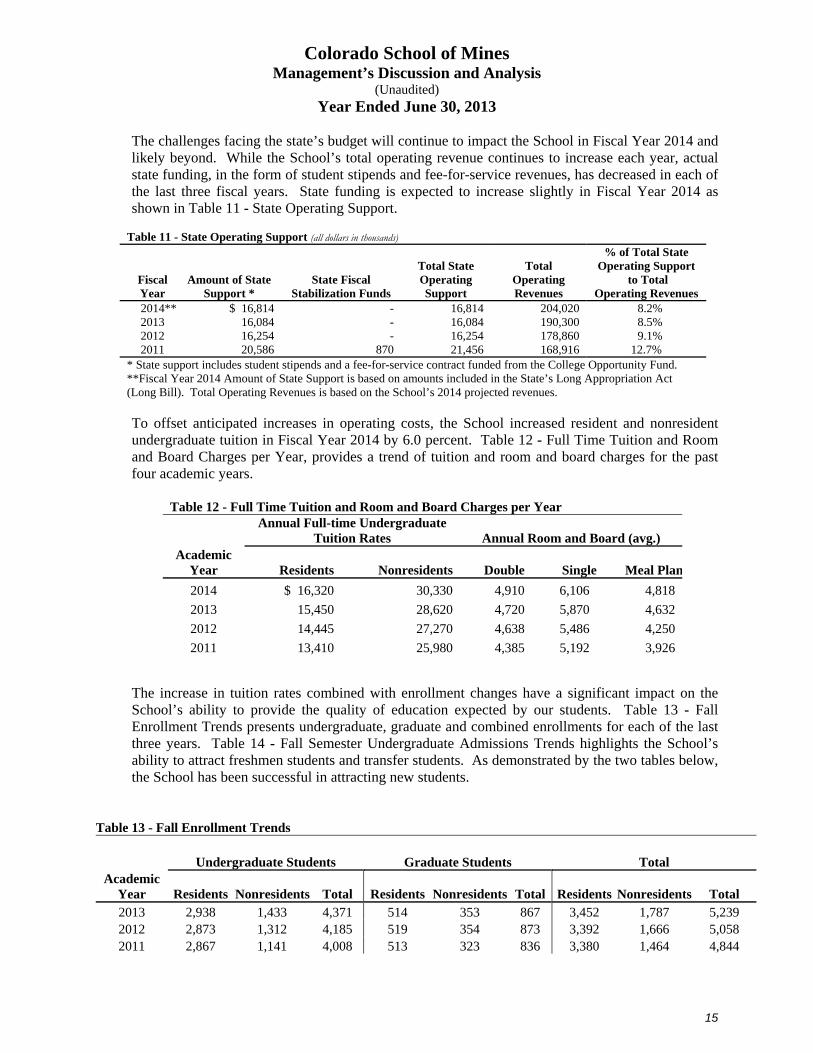
The School’s long-term obligations, as shown in Table 10 - Long-Term Debt Categories, are comprised principally of various revenue bonds issued to finance construction of the capital assets discussed above. As of June 30, 2013, 2012 and 2011, bonds, leases, and note payable of $225,417,000, $169,862,000 and $172,958,000, respectively, were outstanding.
During Fiscal Year 2013, the School had the following long-term debt activity:
Issued $47,345,000 of revenue bonds to construct and equip the Elm Street Residence and Dining Hall, renovate the Student Center, construct and equip a new Welcome Center, and refund a portion of existing bonds.
Issued $13,000,000 of subordinate revenue bonds to finance the construction of the Clear Creek Athletic Complex.
Colorado School of Mines Management’s Discussion and Analysis
(Unaudited) Year Ended June 30, 2013
14
The School did not issue any new, or refund any existing, debt during Fiscal Year 2012.
During Fiscal Year 2011, the School had the following long-term debt activity:
Refinanced $42,860,000 of variable rate debt, backed with a letter of credit that was due to expire, with an equal amount of new variable rate debt through a direct purchase by a financial institution.
Issued $11,195,000 of taxable bonds to construct and equip the Marquez Hall Wing.
Issued $2,800,000 of taxable Qualified Energy Conservation Bonds (QECB) to be used to finance one or more qualified energy conservation improvement projects.
Three of the School’s outstanding bond issues qualify as BABs under ARRA. As qualified BABs, the School expects to receive a cash subsidy payment from the United States Treasury, referred to as Federal Direct Payments, equal to a percentage of the interest payable on the bonds on or around each interest payment date.
Table 10 – Long-Term Debt Categories at June 30, 2013, 2012 and 2011 (all dollars in thousands)
Increase (Decrease)
2013 vs 2012 2012 vs 2011 Debt Type 2013 2012 2011 Amount Percent Amount Percent
Revenue bonds $ 225,385 168,992 172,207 56,393 33.4% $ (3,215) (1.9%)
Capital leases 32 870 319 (838) (96.3%) 551 172.8%
Note payable - - 432 - 0.0% (432) (100.0%)
Total Long-Term Debt $ 225,417 169,862 172,958 55,555 32.7% $ (3,096) (1.8%)
The School’s Variable Rate Demand Refunding Series 2010A has an interest rate derivative instrument, referred to as an interest rate swap, associated with it. As discussed more fully in Note 9, the School had entered into an interest rate swap agreement associated with the Series 2008A variable rate debt to hedge against possible future increases in debt service cash flow requirements resulting from interest rate increases. When the School refinanced the Series 2008A Bonds in Fiscal Year 2011, the swap agreement associated with the Series 2008A bonds was reassigned to the new Series 2010A Bonds. There was no cost to the School to change the association of the swap agreement to the new bonds. At the time of the refunding, the swap had a fair market value of ($8,301,000). In accordance with applicable accounting standards, the fair market value of the swap at the time of the refunding of the Series 2008A Bonds was included in the calculation of the deferred loss on refunding of the 2008A Bonds and is being amortized over the life of the 2010A Bonds.
Factors Impacting Future Periods
The School’s ability to maintain and improve the quality of academic programs, undertake new initiatives, and meet its core mission and ongoing operational needs are impacted by many factors: principally, by student enrollment and the resulting tuition and fees revenue, research volume, the level of state support, and the School’s largest expense, compensation costs. As tuition and fees revenue is the School’s single largest revenue source, it continues to be vital for the School to have the ability to set tuition at a level which will support the cost of educating a Colorado School of Mines student.
Colorado School of Mines Management’s Discussion and Analysis
(Unaudited) Year Ended June 30, 2013
15
The challenges facing the state’s budget will continue to impact the School in Fiscal Year 2014 and likely beyond. While the School’s total operating revenue continues to increase each year, actual state funding, in the form of student stipends and fee-for-service revenues, has decreased in each of the last three fiscal years. State funding is expected to increase slightly in Fiscal Year 2014 as shown in Table 11 - State Operating Support.
Table 11 - State Operating Support (all dollars in thousands)
Fiscal Year
Amount of State Support *
State Fiscal Stabilization Funds
Total State Operating Support
Total
Operating Revenues
% of Total State Operating Support
to Total Operating Revenues
2014** $ 16,814 - 16,814 204,020 8.2% 2013 16,084 - 16,084 190,300 8.5% 2012 16,254 - 16,254 178,860 9.1% 2011 20,586 870 21,456 168,916 12.7%
* State support includes student stipends and a fee-for-service contract funded from the College Opportunity Fund. **Fiscal Year 2014 Amount of State Support is based on amounts included in the State’s Long Appropriation Act (Long Bill). Total Operating Revenues is based on the School’s 2014 projected revenues.
To offset anticipated increases in operating costs, the School increased resident and nonresident undergraduate tuition in Fiscal Year 2014 by 6.0 percent. Table 12 - Full Time Tuition and Room and Board Charges per Year, provides a trend of tuition and room and board charges for the past four academic years.
Table 12 - Full Time Tuition and Room and Board Charges per Year
Annual Full-time Undergraduate
Tuition Rates Annual Room and Board (avg.) Academic
Year Residents Nonresidents Double Single Meal Plan
2014 $ 16,320 30,330 4,910 6,106 4,818
2013 15,450 28,620 4,720 5,870 4,632
2012 14,445 27,270 4,638 5,486 4,250
2011 13,410 25,980 4,385 5,192 3,926
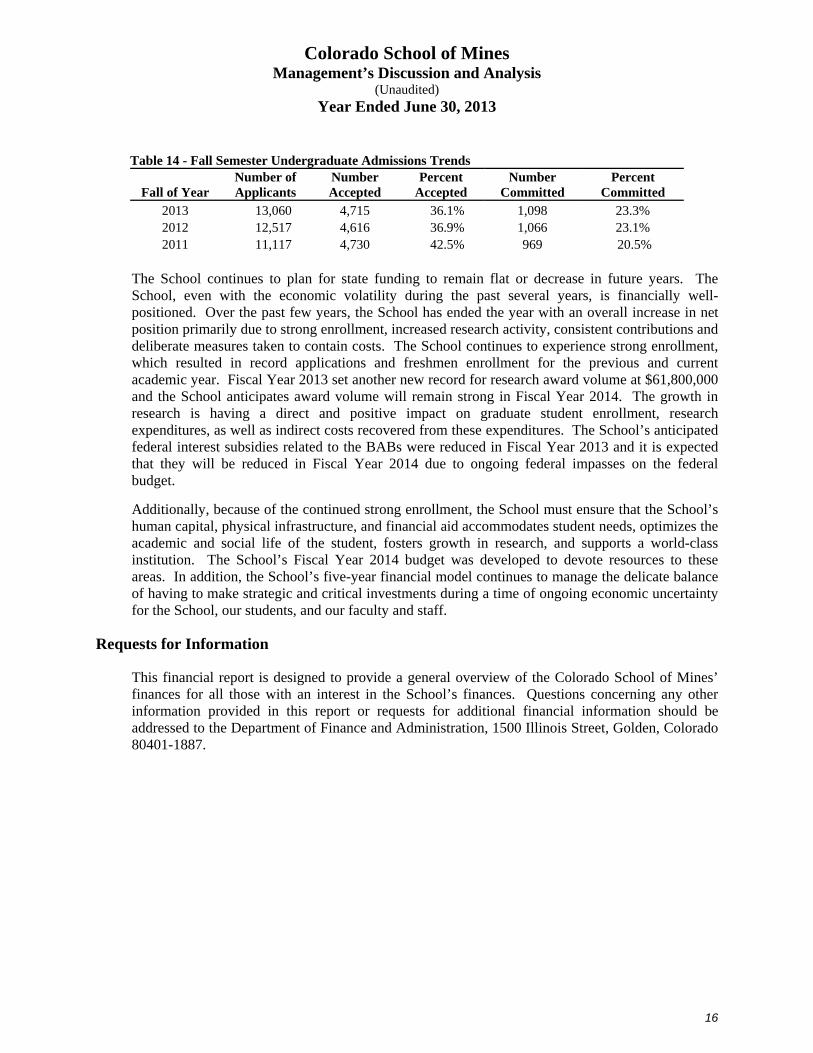
The increase in tuition rates combined with enrollment changes have a significant impact on the School’s ability to provide the quality of education expected by our students. Table 13 - Fall Enrollment Trends presents undergraduate, graduate and combined enrollments for each of the last three years. Table 14 - Fall Semester Undergraduate Admissions Trends highlights the School’s ability to attract freshmen students and transfer students. As demonstrated by the two tables below, the School has been successful in attracting new students.
Table 13 - Fall Enrollment Trends Undergraduate Students Graduate Students Total
Academic Year Residents Nonresidents Total Residents Nonresidents Total Residents Nonresidents Total 2013 2,938 1,433 4,371 514 353 867 3,452 1,787 5,239 2012 2,873 1,312 4,185 519 354 873 3,392 1,666 5,058 2011 2,867 1,141 4,008 513 323 836 3,380 1,464 4,844
Colorado School of Mines Management’s Discussion and Analysis
(Unaudited) Year Ended June 30, 2013
16
The School continues to plan for state funding to remain flat or decrease in future years. The School, even with the economic volatility during the past several years, is financially well-positioned. Over the past few years, the School has ended the year with an overall increase in net position primarily due to strong enrollment, increased research activity, consistent contributions and deliberate measures taken to contain costs. The School continues to experience strong enrollment, which resulted in record applications and freshmen enrollment for the previous and current academic year. Fiscal Year 2013 set another new record for research award volume at $61,800,000 and the School anticipates award volume will remain strong in Fiscal Year 2014. The growth in research is having a direct and positive impact on graduate student enrollment, research expenditures, as well as indirect costs recovered from these expenditures. The School’s anticipated federal interest subsidies related to the BABs were reduced in Fiscal Year 2013 and it is expected that they will be reduced in Fiscal Year 2014 due to ongoing federal impasses on the federal budget.
Additionally, because of the continued strong enrollment, the School must ensure that the School’s human capital, physical infrastructure, and financial aid accommodates student needs, optimizes the academic and social life of the student, fosters growth in research, and supports a world-class institution. The School’s Fiscal Year 2014 budget was developed to devote resources to these areas. In addition, the School’s five-year financial model continues to manage the delicate balance of having to make strategic and critical investments during a time of ongoing economic uncertainty for the School, our students, and our faculty and staff.
Requests for Information
This financial report is designed to provide a general overview of the Colorado School of Mines’ finances for all those with an interest in the School’s finances. Questions concerning any other information provided in this report or requests for additional financial information should be addressed to the Department of Finance and Administration, 1500 Illinois Street, Golden, Colorado 80401-1887.
Table 14 - Fall Semester Undergraduate Admissions Trends
Fall of Year Number of Applicants
Number Accepted
Percent Accepted
Number Committed
Percent Committed
2013 13,060 4,715 36.1% 1,098 23.3% 2012 12,517 4,616 36.9% 1,066 23.1% 2011 11,117 4,730 42.5% 969 20.5%
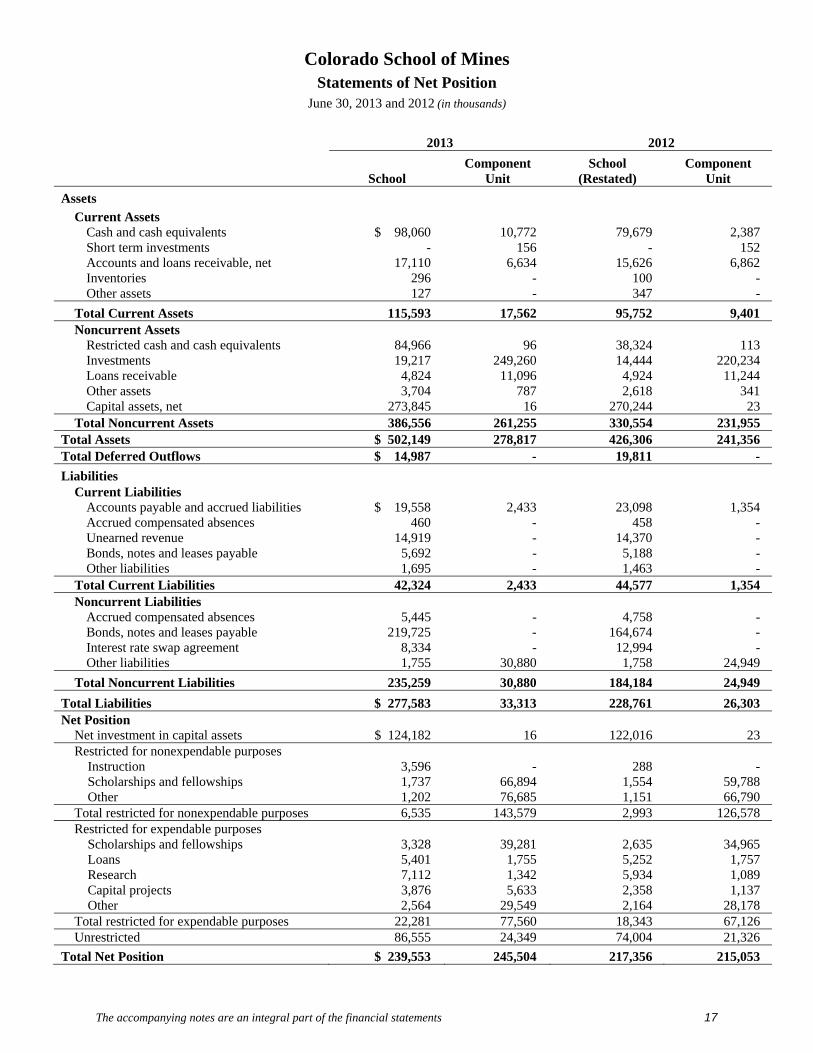
Colorado School of Mines Statements of Net Position
June 30, 2013 and 2012 (in thousands)
The accompanying notes are an integral part of the financial statements 17
2013 2012
School Component
Unit School
(Restated) Component
Unit
Assets
Current Assets Cash and cash equivalents $ 98,060 10,772 79,679 2,387 Short term investments - 156 - 152 Accounts and loans receivable, net 17,110 6,634 15,626 6,862 Inventories 296 - 100 - Other assets 127 - 347 -
Total Current Assets 115,593 17,562 95,752 9,401 Noncurrent Assets
Restricted cash and cash equivalents 84,966 96 38,324 113 Investments 19,217 249,260 14,444 220,234 Loans receivable 4,824 11,096 4,924 11,244 Other assets 3,704 787 2,618 341 Capital assets, net 273,845 16 270,244 23
Total Noncurrent Assets 386,556 261,255 330,554 231,955 Total Assets $ 502,149 278,817 426,306 241,356 Total Deferred Outflows $ 14,987 - 19,811 -
Liabilities Current Liabilities
Accounts payable and accrued liabilities $ 19,558 2,433 23,098 1,354 Accrued compensated absences 460 - 458 - Unearned revenue 14,919 - 14,370 - Bonds, notes and leases payable 5,692 - 5,188 - Other liabilities 1,695 - 1,463 -
Total Current Liabilities 42,324 2,433 44,577 1,354Noncurrent Liabilities
Accrued compensated absences 5,445 - 4,758 - Bonds, notes and leases payable 219,725 - 164,674 - Interest rate swap agreement 8,334 - 12,994 - Other liabilities 1,755 30,880 1,758 24,949
Total Noncurrent Liabilities 235,259 30,880 184,184 24,949
Total Liabilities $ 277,583 33,313 228,761 26,303Net Position
Net investment in capital assets $ 124,182 16 122,016 23 Restricted for nonexpendable purposes
Instruction 3,596 - 288 - Scholarships and fellowships 1,737 66,894 1,554 59,788 Other 1,202 76,685 1,151 66,790
Total restricted for nonexpendable purposes 6,535 143,579 2,993 126,578 Restricted for expendable purposes
Scholarships and fellowships 3,328 39,281 2,635 34,965 Loans 5,401 1,755 5,252 1,757 Research 7,112 1,342 5,934 1,089 Capital projects 3,876 5,633 2,358 1,137 Other 2,564 29,549 2,164 28,178
Total restricted for expendable purposes 22,281 77,560 18,343 67,126 Unrestricted 86,555 24,349 74,004 21,326
Total Net Position $ 239,553 245,504 217,356 215,053

Colorado School of Mines Statements of Revenues, Expenses and Changes in Net Position
Years Ended June 30, 2013 and 2012 (in thousands)
The accompanying notes are an integral part of the financial statements 18
2013 2012
School Component
Unit School
(Restated) Component
Unit Operating Revenues
Tuition and fees, (net of scholarship allowance of $20,763 in 2013 and $19,199 in 2012) $ 98,371 - 88,322 -
Fee-for-Service 10,938 - 11,188 - Federal grants and contracts 33,165 - 34,332 - State grants and contracts 4,506 - 3,897 - Nongovernmental grants and contracts 22,018 - 20,688 - Auxiliary enterprises, (net of scholarship allowance of
$319 in 2013 and $265 in 2012) 18,331 - 17,384 - Contributions - 26,074 - 31,146 Other operating revenues 3,331 2,459 3,049 169
Total Operating Revenues 190,660 28,533 178,860 31,315 Operating Expenses
Education and General Instruction 58,876 - 53,970 - Research 45,071 - 42,442 - Public service 115 - 56 - Academic support 14,458 - 12,479 - Student services 5,804 - 5,048 - Institutional support 13,384 21,427 10,955 21,419 Operation and maintenance of plant 18,531 - 18,961 - Scholarships and fellowships 1,021 - 2,146 -
Total Education and General 157,260 21,427 146,057 21,419 Auxiliary enterprises 20,977 - 18,489 - Depreciation and amortization 14,496 11 13,485 18
Total Operating Expenses 192,733 21,438 178,031 21,437 Operating Income (Loss) (2,073) 7,095 829 9,878 Nonoperating Revenues (Expenses)
State appropriations, noncapital 706 - - - Contributions from the Foundation 13,909 - 11,347 - Contributions 1,435 - 1,187 - Investment income, net 1,828 23,356 1,204 (4,155) Interest on debt (8,626) - (7,217) - Bond issuance costs (415) - (8) - Loss on disposal of assets (179) - (1,139) - Federal nonoperating revenue 4,184 - 4,235 - Other nonoperating revenue 147 - 1,061 -
Net Nonoperating Revenues 12,989 23,356 10,670 (4,155) Income Before Other Revenues 10,916 30,451 11,499 5,723
Capital appropriations and contributions from state 1,245 - 1,529 - Academic facility fee 3,124 - 3,019 - Capital grants and gifts 2,702 - 5,660 - Additions to permanent endowments 3,145 - 377 - Transfer of Colorado Geological Services 1,065 - - -
Total Other Revenues 11,281 - 10,585 -
Increase in Net Position 22,197 30,451 22,084 5,723Net Position, Beginning of Year 217,356 215,053 196,580 209,330
Adjustment for change in accounting principle - - (1,308) - Net Position, Beginning of Year, Restated 217,356 215,053 195,272 209,330
Net Position, End of Year $ 239,553 245,504 217,356 215,053
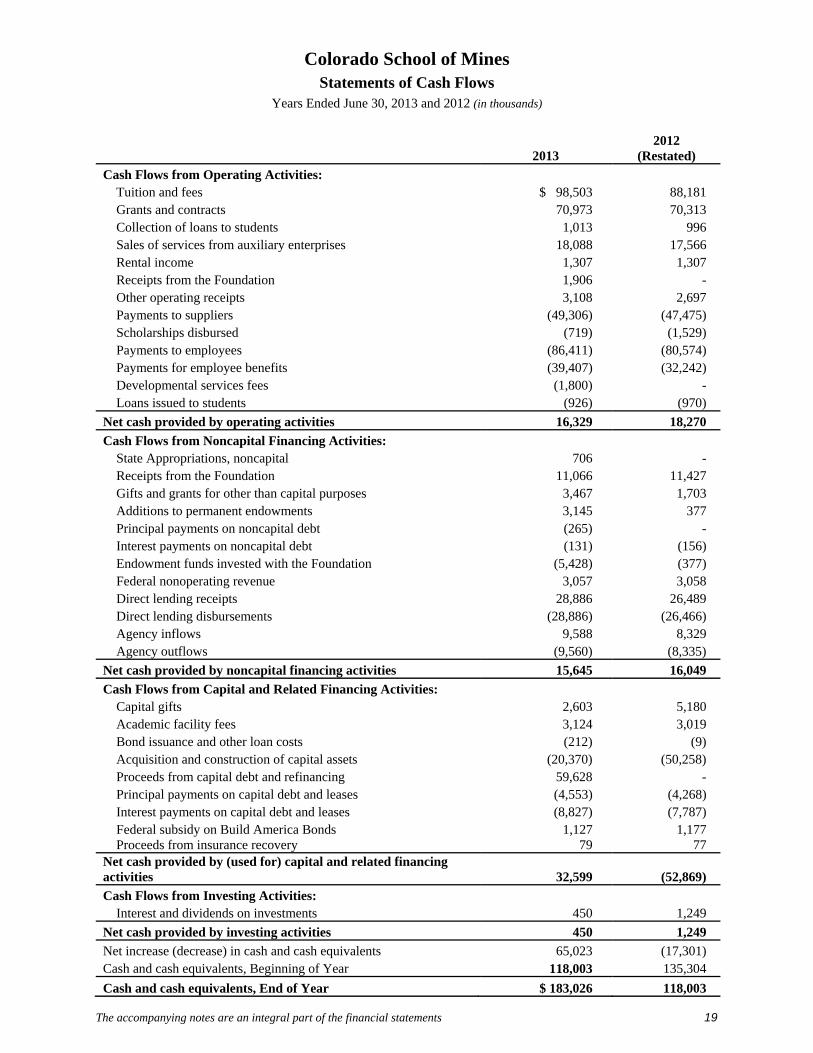
Colorado School of Mines Statements of Cash Flows
Years Ended June 30, 2013 and 2012 (in thousands)
The accompanying notes are an integral part of the financial statements 19
2013
2012 (Restated)
Cash Flows from Operating Activities: Tuition and fees $ 98,503 88,181 Grants and contracts 70,973 70,313 Collection of loans to students 1,013 996 Sales of services from auxiliary enterprises 18,088 17,566 Rental income 1,307 1,307 Receipts from the Foundation 1,906 - Other operating receipts 3,108 2,697 Payments to suppliers (49,306) (47,475) Scholarships disbursed (719) (1,529) Payments to employees (86,411) (80,574) Payments for employee benefits (39,407) (32,242) Developmental services fees (1,800) - Loans issued to students (926) (970)
Net cash provided by operating activities 16,329 18,270
Cash Flows from Noncapital Financing Activities: State Appropriations, noncapital 706 - Receipts from the Foundation 11,066 11,427 Gifts and grants for other than capital purposes 3,467 1,703 Additions to permanent endowments 3,145 377 Principal payments on noncapital debt (265) - Interest payments on noncapital debt (131) (156) Endowment funds invested with the Foundation (5,428) (377) Federal nonoperating revenue 3,057 3,058 Direct lending receipts 28,886 26,489 Direct lending disbursements (28,886) (26,466) Agency inflows 9,588 8,329 Agency outflows (9,560) (8,335)
Net cash provided by noncapital financing activities 15,645 16,049
Cash Flows from Capital and Related Financing Activities: Capital gifts 2,603 5,180 Academic facility fees 3,124 3,019 Bond issuance and other loan costs (212) (9) Acquisition and construction of capital assets (20,370) (50,258) Proceeds from capital debt and refinancing 59,628 - Principal payments on capital debt and leases (4,553) (4,268) Interest payments on capital debt and leases (8,827) (7,787) Federal subsidy on Build America Bonds 1,127 1,177 Proceeds from insurance recovery 79 77
Net cash provided by (used for) capital and related financing activities 32,599 (52,869)
Cash Flows from Investing Activities: Interest and dividends on investments 450 1,249
Net cash provided by investing activities 450 1,249
Net increase (decrease) in cash and cash equivalents 65,023 (17,301) Cash and cash equivalents, Beginning of Year 118,003 135,304
Cash and cash equivalents, End of Year $ 183,026 118,003
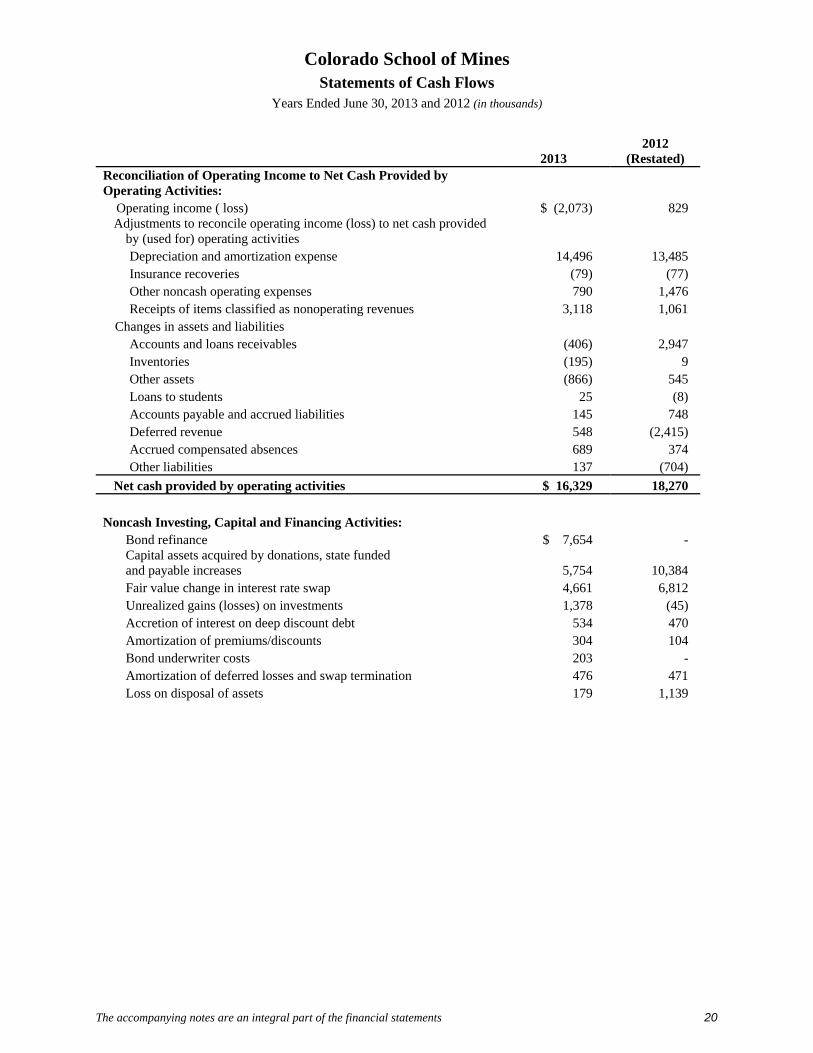
Colorado School of Mines Statements of Cash Flows
Years Ended June 30, 2013 and 2012 (in thousands)
The accompanying notes are an integral part of the financial statements 20
2013 2012
(Restated) Reconciliation of Operating Income to Net Cash Provided by Operating Activities:
Operating income ( loss) $ (2,073) 829 Adjustments to reconcile operating income (loss) to net cash provided
by (used for) operating activities Depreciation and amortization expense 14,496 13,485 Insurance recoveries (79) (77) Other noncash operating expenses 790 1,476 Receipts of items classified as nonoperating revenues 3,118 1,061
Changes in assets and liabilities Accounts and loans receivables (406) 2,947 Inventories (195) 9 Other assets (866) 545 Loans to students 25 (8) Accounts payable and accrued liabilities 145 748 Deferred revenue 548 (2,415) Accrued compensated absences 689 374 Other liabilities 137 (704)
Net cash provided by operating activities $ 16,329 18,270
Noncash Investing, Capital and Financing Activities:
Bond refinance $ 7,654 - Capital assets acquired by donations, state funded and payable increases 5,754 10,384 Fair value change in interest rate swap 4,661 6,812 Unrealized gains (losses) on investments 1,378 (45) Accretion of interest on deep discount debt 534 470 Amortization of premiums/discounts 304 104 Bond underwriter costs 203 - Amortization of deferred losses and swap termination 476 471 Loss on disposal of assets 179 1,139
Colorado School of Mines Notes to Financial Statements
June 30, 2013 and 2012
21
Note 1: Basis of Presentation and Summary of Significant Accounting Policies
Governance
Colorado School of Mines (the School) is a public institution of higher education with a primary emphasis in engineering and science education and research. The School is governed by a nine member Board of Trustees. Seven voting members are appointed by the Governor of the State of Colorado with the consent of the Colorado Senate. Two nonvoting members, representing the faculty and students of the School, are voted in by the respective constituents.
Financial Reporting Entity and Basis of Presentation
The School’s financial reporting entity includes the operations of the School and all related entities for which the School is financially accountable or that provide services to the School, referred to as blended component units. Financial accountability may stem from the School’s ability to appoint a majority of the governing board of the related organization, its ability to impose its will on the related organization, its ability to access assets, or its responsibility for debts of the related organization. As a result of legislation passed during the 2012 session, effective February 1, 2013 the Colorado Geological Services operations were transferred to the School from the Department of Natural Resources. The net effect of the transfer is reported as part of Other Revenues in the Statement of Revenues, Expenses and Changes in Net Position. The School includes the following blended component units:
Colorado School of Mines Building Corporation: established in June 1976 as a separate corporation under the laws of the State of Colorado. The purpose of the corporation was to build a facility that would house the United States Geological Survey (USGS). The corporation collects annual rent payments from the USGS. Upon dissolution, subject to certain provisions, any assets remaining shall be transferred to the School. Separate financial statements are not prepared.
Colorado School of Mines Development Corporation: established in September 2001 as a separate corporation under the laws of the State of Colorado. The corporation was formed for the purpose of issuing obligations for or assisting in the financing of capital expenditures on behalf of or for the benefit of the Colorado School of Mines. Upon dissolution, subject to certain provisions, any assets remaining shall be transferred to the School. Separate financial statements are not prepared.
Mines Applied Technology Transfer Inc. (MATTI): established in 2002 as a separate corporation under the laws of the State of Colorado with a December 31 year-end. The purpose of MATTI, a not-for-profit 501(c)(3), is to further the education, research, development and public services objectives of the School and to further the transfer of newly created technologies from the School to the private sector. The corporation is operated exclusively for the benefit of the School. Upon dissolution, subject to certain provisions, any assets remaining shall be transferred to the School. Separate financial statements are not prepared.
Discretely Presented Component Unit
The School’s financial statements include one supporting organization as a discretely presented component unit (DPCU) of the School.
Colorado School of Mines Notes to Financial Statements
June 30, 2013 and 2012
22
Colorado School of Mines Foundation, Incorporated (the Foundation) is a legally separate entity incorporated under Article 40, Title 7 of the Colorado Revised Statutes of 1973. The Foundation was established in 1928 to promote the welfare, development and growth of the School. The Foundation has a determination letter from the Internal Revenue Service stating it qualifies under Section 501(c)(3) of the Internal Revenue Code as a public charity. Although the School does not control the timing of receipts received by the Foundation, the majority of resources or income thereon that the Foundation holds and invests are restricted by the donors for the benefit of the School. Because these restricted resources held by the Foundation can only be used by, or for the benefit of, the School, the Foundation is considered a component unit of the School and is discretely presented in the School’s financial statements. Separately issued financial statements are available by contacting the Foundation at P.O. Box 4005, Golden, Colorado, 80401-0005.
Related Organizations
The Table Mountain Research Center (TMRC), formerly the Colorado School of Mines Research Institute (CSMRI), a not-for-profit corporation, was established in 1949 as a separate corporation under the laws of the State of Colorado. The purpose of TMRC is to promote, encourage and aid scientific and technological investigation and research.
TMRC ceased active operations during 1987 and sold most of its real estate in 1988.
Relationship to State of Colorado
Article VIII, Section 5 of the Colorado Constitution declares the School to be a state institution. Thus, for financial reporting purposes, the School is included as part of the state’s primary government.
Basis of Accounting and Presentation
For financial reporting purposes, the School is considered a special-purpose government engaged only in business-type activities. Accordingly, the School’s financial statements have been prepared using the economic resources measurement focus and the accrual basis of accounting. Under the accrual basis of accounting, revenues are recognized when earned, and expenses are recorded when an obligation is incurred.
The School applies all applicable Governmental Accounting Standards Board (GASB) pronouncements.
The Foundation reports under FASB standards. As such, certain revenue recognition criteria and presentation features are different from GASB revenue recognition criteria and presentation features. Modifications have been made to the Foundation’s financial information in the School’s financial reporting entity for these differences.
Significant Accounting Policies
Cash and Cash Equivalents
The School considers all highly liquid investments with original maturities of three months or less to be cash equivalents. Cash equivalents consist primarily of funds invested through the Treasury’s Cash Management Program and money market funds with brokers.
Colorado School of Mines Notes to Financial Statements
June 30, 2013 and 2012
23
Restricted Cash and Cash Equivalents
Restricted cash and cash equivalents include amounts whose use is constrained either through external party restrictions or imposition by law. Restricted purposes include gifts, endowments, debt funded project construction and debt service reserves.
Investments and Investment Income
Investments in equity and debt securities are carried at fair value. Fair value is determined using quoted market prices. Investments include, but are not limited to, funds managed by the Foundation on behalf of the School.
Investment income consists of interest and dividend income and the net change for the year in the fair value of investments carried at fair value.
Accounts and Loans Receivables
Accounts and loans receivables consist of tuition and fee charges to students, charges for auxiliary enterprise services provided to students, faculty and staff, reimbursements outstanding on research contracts and grants, and short- and long-term loans issued to students under various federal and other loan programs to cover tuition and fee charges. Receivables are recorded net of estimated uncollectible amounts. The School also administers student loans on behalf of the discretely presented component unit. The student loans administered by the School are recorded as a receivable from the student, included with loans to students in the Statements of Net Position, and a liability to the component unit.
Inventories
Inventories are stated at the lower of cost, determined using the FIFO (first-in, first-out) method, or market.
Bond Issuance Costs
Bond issuance costs incurred on revenue bond issues are expensed in the year the bond issue occurs.
Capital Assets
Capital assets are recorded at cost at the date of acquisition, or fair value at the date of donation, if acquired by gift. Depreciation is computed using the straight-line method over the estimated useful life of each asset. The following estimated useful lives are being used by the School:
Land improvements 20 years Buildings and improvements 20 – 40 years Equipment 3 – 10 years Library materials 10 years
For equipment, the capitalization policy includes all items with a value of $5,000 or more, and an estimated useful life of greater than one year.
Colorado School of Mines Notes to Financial Statements
June 30, 2013 and 2012
24
Renovations to buildings and other improvements that significantly increase the value or extend the useful life of the structure are capitalized. For renovations and improvements, the capitalization policy includes items with a value of $50,000 or more. Routine repairs and maintenance are charged to operating expense. Major outlays for capital assets and improvements are capitalized as construction-in-progress throughout the building project. Interest incurred during the construction phase is included as part of the value of the construction-in-progress.
Assets recorded under capital lease agreements are recorded at the present value of future minimum lease payments and are amortized over either the term of the lease or the estimated useful life of the asset, whichever period is shorter. Such amortization is included as depreciation expense in the accompanying financial statements.
Intangible assets are carried at cost and are comprised of an indefeasible right to use certain fiber optic cables. Intangible assets are being amortized over 20 years.
Compensated Absences
School policies permit most employees to accumulate vacation and sick leave benefits that may be realized as paid time-off or, in limited circumstances, as a cash payment. Expense and the related liabilities that are recognized as vacation benefits are earned whether the employee is expected to realize the benefit as time-off or in cash. Expense and the related liability for sick leave benefits are recognized when earned to the extent the employee is expected to realize the benefit in cash determined using the termination payment method. Sick leave benefits expected to be realized as paid time-off are recognized as expense when the time-off occurs and no liability is accrued for such benefits employees have earned but not yet realized. Compensated absence liabilities are computed using the regular pay and termination pay rates in effect as of July 1 plus an additional amount for compensation-related payments such as Social Security and Medicare taxes computed using rates in effect at that date.
Unearned Revenue – Tuition, Fees and Grants
Unearned revenue represents student tuition and fees, for which the School has not provided the associated services, and advances on grants and contract awards for which the School has not provided services or has not met all of the applicable eligibility requirements.
Bonds, Notes and Leases
Bonds, notes and leases represent debt by borrowing or financing usually for the acquisition of buildings, equipment, or capital construction. The School has an ISDA (International Swaps and Derivatives Association) Master Swap Agreement in order to convert certain variable rate debt to a synthetic fixed rate, thereby economically hedging against changes in the cash flow requirements of the School’s variable interest rate debt obligations (Note 9). Capital leases consist of a multi-year lease-purchase contract. The contract provides that any commitments beyond the current year are contingent upon funds being appropriated for such purposes by the School. It is reasonably assured that such leases will be renewed in the normal course of business and, therefore, are treated as noncancelable for financial reporting purposes.
Colorado School of Mines Notes to Financial Statements
June 30, 2013 and 2012
25
Deferred Outflows Deferred outflows represent losses on various bond refundings and the mark to market valuation of the School’s SWAP agreement. For current refundings and advance refundings resulting in defeasance of debt, the difference between the reacquisition price and the net carrying amount of the old debt is reported as a deferred outflow on the Statement of Net Position and amortized as a component of interest expense over the remaining life of the old debt or the life of the new debt, whichever is shorter. Classification of Revenues The School has classified its revenues as either operating or nonoperating revenues according to the following criteria:
Operating revenues – Operating revenues include activities that have the characteristics of exchange or exchange-like transactions, program-specific, or government-mandated nonexchange transactions, such as (1) student tuition and fees, (2) sales and services of auxiliary enterprises, (3) contracts and grants for research activities and (4) interest on student loans.
Nonoperating revenues – Nonoperating revenues include activities that have the characteristics of nonexchange transactions, such as gifts and contributions and other revenue sources that are not deemed operating revenues including Federal Pell revenue and interest subsidy payments associated with Build America Bonds (BABs).
Scholarship Discounts and Allowances Student tuition, fee revenues and certain other revenues from students are reported net of scholarship allowances in the Statements of Revenues, Expenses and Changes in Net Position. Scholarship allowances are the difference between the stated charge for goods and services provided by the School and the amount that is paid by students and/or third-parties making payments on the students’ behalf. Certain governmental grants, such as Pell grants and other federal, state or nongovernmental programs are recorded as either operating or nonoperating revenues in the School’s financial statements. To the extent that revenues from such programs are used to satisfy tuition and fees and other student charges, the School has recorded a scholarship allowance.
Donor Restricted Endowments
Disbursements of the net appreciation (realized and unrealized) of investments of endowment gifts are permitted by state law, except where a donor has specified otherwise. The amount of earnings and net appreciation available for spending by the School and the Foundation is based on a spending rate set by the Foundation board on an annual basis. For the years ended June 30, 2013 and 2012, the authorized spending rate was equal to the 4.5 percent of the rolling 36-month average market value of the endowment investments. Earnings in excess of the amount authorized for spending are available in future years and are included in the value of the related investment.
Application of Restricted and Unrestricted Resources
The School first applies restricted resources when an expense or outlay is incurred for purposes for which both restricted and unrestricted resources are available.
Colorado School of Mines Notes to Financial Statements
June 30, 2013 and 2012
26
Income Taxes
As a state institution of higher education, the income of the School is generally exempt from federal and state income taxes under Section 115(a) of the Internal Revenue Code and a similar provision of state law. However, the School is subject to federal income tax on any unrelated business taxable income. There was no tax liability related to income generated from activities unrelated to the School’s exempt purpose as of June 30, 2013 and 2012.
Use of Estimates
The preparation of financial statements in conformity with accounting principles generally accepted in the United States of America requires management to make estimates and assumptions that affect the reported amounts of assets and liabilities and disclosure of contingent assets and liabilities at the date of the financial statements and the reported amounts of revenues and expenses during the reporting period. Actual results could differ from those estimates.
Reclassifications
Certain 2012 amounts have been reclassified to conform to the 2013 presentation.
Note 2: Cash and Cash Equivalents and Investments
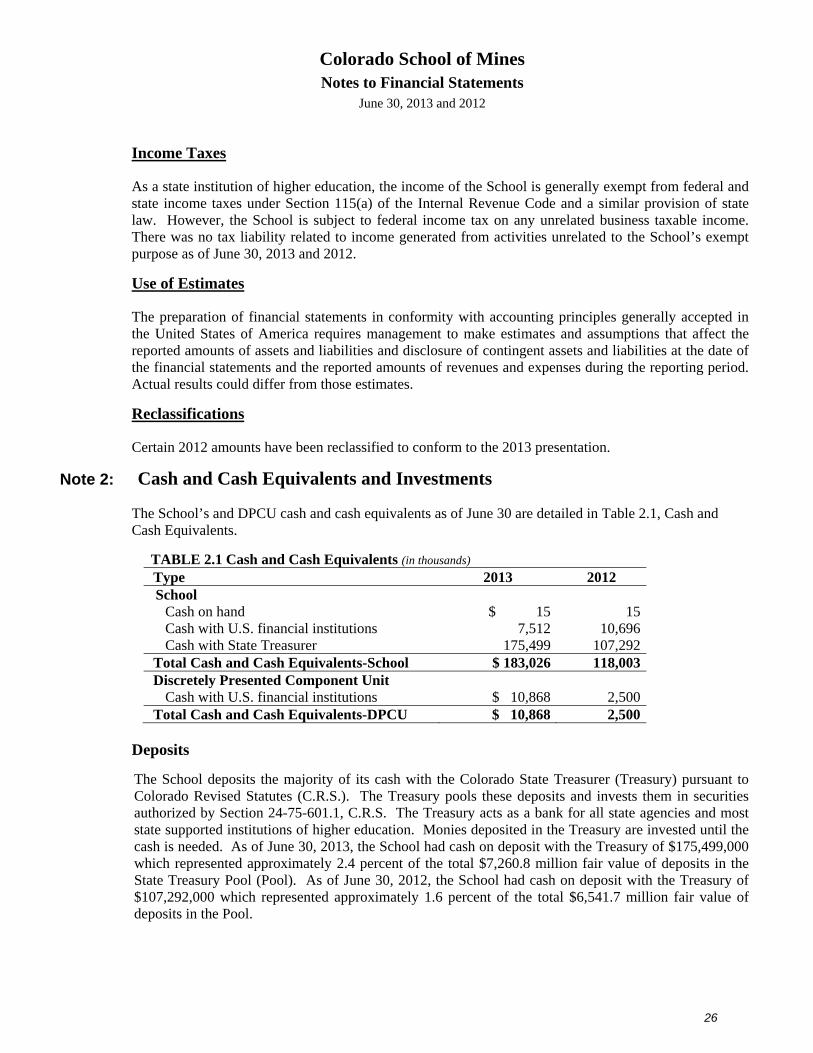
The School’s and DPCU cash and cash equivalents as of June 30 are detailed in Table 2.1, Cash and Cash Equivalents.
TABLE 2.1 Cash and Cash Equivalents (in thousands) Type 2013 2012 School
Cash on hand $ 15 15 Cash with U.S. financial institutions 7,512 10,696 Cash with State Treasurer 175,499 107,292
Total Cash and Cash Equivalents-School $ 183,026 118,003 Discretely Presented Component Unit
Cash with U.S. financial institutions $ 10,868 2,500 Total Cash and Cash Equivalents-DPCU $ 10,868 2,500
Deposits
The School deposits the majority of its cash with the Colorado State Treasurer (Treasury) pursuant to Colorado Revised Statutes (C.R.S.). The Treasury pools these deposits and invests them in securities authorized by Section 24-75-601.1, C.R.S. The Treasury acts as a bank for all state agencies and most state supported institutions of higher education. Monies deposited in the Treasury are invested until the cash is needed. As of June 30, 2013, the School had cash on deposit with the Treasury of $175,499,000 which represented approximately 2.4 percent of the total $7,260.8 million fair value of deposits in the State Treasury Pool (Pool). As of June 30, 2012, the School had cash on deposit with the Treasury of $107,292,000 which represented approximately 1.6 percent of the total $6,541.7 million fair value of deposits in the Pool.
Colorado School of Mines Notes to Financial Statements
June 30, 2013 and 2012
27
For financial reporting purposes all of the Treasury’s investments are reported at fair value, which is determined based on quoted market prices at fiscal year-end. On the basis of the School’s participation in the Pool, the School reports as an increase or decrease in cash for its share of the Treasury’s unrealized gains and losses on the Pool’s underlying investments. The Treasury does not invest any of the Pool’s resources in any external investment pool, and there is no assignment of income related to participation in the Pool. The unrealized gains/losses included in income reflect only the change in fair value for the fiscal year.
Investments in the Pool are exposed to custodial credit risk if the securities are uninsured, are not registered in the state’s name, and are held by either the counterparty to the investment purchase or the counterparty’s trust department or agent but not in the state’s name. As of June 30, 2013, none of the investments in the Pool are subject to custodial credit risk.
Credit quality risk is the risk that the issuer or other counterparty to a debt security will not fulfill its obligations. This risk is assessed by national rating agencies that assign a credit quality rating for many investments. Credit quality ratings for obligations of the U.S. government or obligations explicitly guaranteed by the U.S. government are not reported; however, credit quality ratings are reported for obligations of U.S. government agencies that are not explicitly guaranteed by the U.S. government. Based on these parameters, as of June 30, 2013 and 2012, approximately 88.5 percent and 89.0 percent, respectively, of investments of the Pool are subject to credit quality risk reporting. Except for $41,074,270 and $12,087,710, respectively, of corporate bonds rated lower medium, these investments are rated from upper medium to the highest quality, which indicates that the issuer has strong capacity to pay principal and interest when due.
Interest rate risk is the risk that changes in the market rate of interest will adversely affect the value of an investment. In addition to statutory limitations on the types of investments, the Treasury’s investment policy mitigates interest rate risk through the use of maturity limits set to meet the needs of the individual fund if the Treasurer is investing for a specific fund rather than the Pool. The Treasurer actively manages the time to maturity in reacting to changes in the yield curve, economic forecasts, and liquidity needs of the participating funds. The Treasurer further limits investment risk by setting a minimum/maximum range for the percentage of investments subject to interest rate risk and by laddering maturities and credit ratings. As of June 30, 2013, the weighted average maturity of investments in the Pool is 0.037 years for Commercial Paper (1.0 percent of the Pool), 1.321years for U.S. Government Securities (63.9 percent of the Pool), 3.371 years for Asset Backed Securities (16.0 percent of the Pool), and 3.100 years for Corporate Bonds (19.1 percent of the Pool). As of June 30, 2012, the weighted average maturity of investments in the Treasurer’s Pool is 0.090 years for Commercial Paper (2.1 percent of the Pool), 0.803 years for U.S. Government Securities (75.2 percent of the Pool), 2.379 years for Asset Backed Securities (6.6 percent of the Pool), and 3.252 years for Corporate Bonds (16.1 percent of the Pool).
The Pool was not subject to foreign currency risk or concentration of credit risk in Fiscal Year 2012-13.
Additional information on investments of the Pool may be obtained in the State’s Comprehensive Annual Financial Report for the year ended June 30, 2013.
Colorado School of Mines Notes to Financial Statements
June 30, 2013 and 2012
28
Deposits not with the Treasury are exposed to custodial credit risk (the risk that, in the event of the failure of a depository financial institution, the government would not be able to recover deposits or would not be able to recover collateral securities that are in the possession of an outside party), if they are not covered by depository insurance (FDIC) and the deposits are uncollateralized, collateralized with securities held by the pledging financial institution, except for deposits collateralized by certain types of collateral pools including a single financial institution collateral pool where the fair value of the pool is equal to or exceeds all uninsured public deposits held by the financial institution (the Public Deposit Protection Act) or collateralized with securities held by the pledging financial institution’s trust department or agent but not in the depositor – government’s name. Accordingly, none of the School’s deposits as of June 30, 2013 and 2012 are deemed to be exposed to custodial credit risk. As of June 30, 2013 and 2012, the DPCU maintained balances in various operating accounts in excess of federally insured limits totaling approximately $9,962,000 and $0, respectively.
Investments
The School has authority to invest institutional funds in any investment deemed advisable by the governing board per section 15-1-1106, C.R.S. The School may legally invest in direct obligations of, and other obligations guaranteed as to principal by, the U.S. Treasury and U.S. agencies and instrumentalities and in bank repurchase agreements. It may also invest, to a limited extent, in equity securities.
Credit Quality Risk – Credit quality risk is the risk that an issuer of an investment will not fulfill its obligation to the holder of the investment. Credit risk only applies to debt investments. This is measured by the assignment of a rating by a nationally recognized statistical rating organization (NRSRO). The School has no investment policy that would further limit its investment choices beyond those allowed by state statute.
Interest Rate Risk – Interest rate risk is the risk that changes in market interest rates will adversely affect the fair value of an investment. Interest rate risk only applies to debt investments. Generally, the longer the maturity of an investment, the greater the sensitivity of its fair value to changes in market interest rates. Interest rate risk inherent in the School’s investments is measured by monitoring the modified duration of the overall investments portfolio. Modified duration estimates the sensitivity of the School’s investments to changes in the interest rates. The School does not have a formal investment policy that limits investment maturities as a means of managing its exposure to fair value losses arising from increasing interest rates. The following table presents investment balances by type.
Concentration of Credit Risk – Concentration of credit risk is the risk of loss attributed to the magnitude of an entity’s investment in a single issuer. At June 30, 2013 and 2012, no single investment of the School exceeded 5 percent of the total investments.
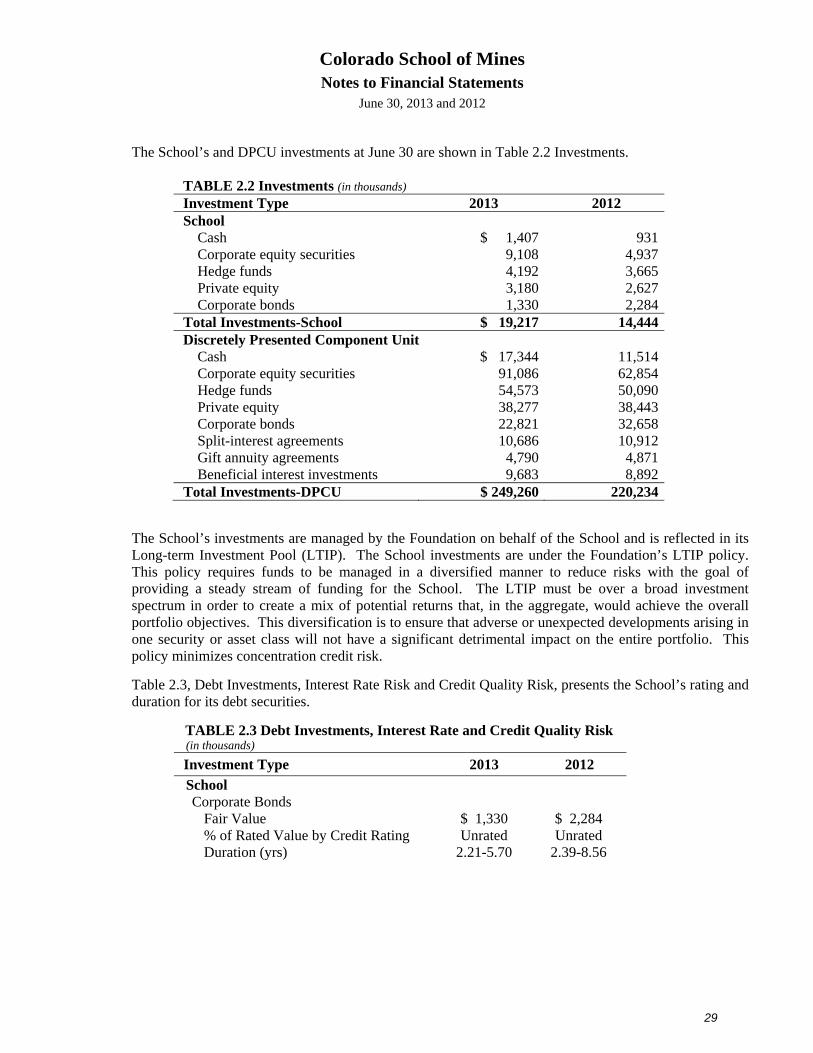
Colorado School of Mines Notes to Financial Statements
June 30, 2013 and 2012
29
The School’s and DPCU investments at June 30 are shown in Table 2.2 Investments.
TABLE 2.2 Investments (in thousands) Investment Type 2013 2012 School
Cash $ 1,407 931Corporate equity securities 9,108 4,937Hedge funds 4,192 3,665Private equity 3,180 2,627Corporate bonds 1,330 2,284
Total Investments-School $ 19,217 14,444Discretely Presented Component Unit
Cash $ 17,344 11,514Corporate equity securities 91,086 62,854Hedge funds 54,573 50,090Private equity 38,277 38,443Corporate bonds 22,821 32,658Split-interest agreements 10,686 10,912Gift annuity agreements 4,790 4,871Beneficial interest investments 9,683 8,892
Total Investments-DPCU $ 249,260 220,234
The School’s investments are managed by the Foundation on behalf of the School and is reflected in its Long-term Investment Pool (LTIP). The School investments are under the Foundation’s LTIP policy. This policy requires funds to be managed in a diversified manner to reduce risks with the goal of providing a steady stream of funding for the School. The LTIP must be over a broad investment spectrum in order to create a mix of potential returns that, in the aggregate, would achieve the overall portfolio objectives. This diversification is to ensure that adverse or unexpected developments arising in one security or asset class will not have a significant detrimental impact on the entire portfolio. This policy minimizes concentration credit risk.
Table 2.3, Debt Investments, Interest Rate Risk and Credit Quality Risk, presents the School’s rating and duration for its debt securities.
TABLE 2.3 Debt Investments, Interest Rate and Credit Quality Risk (in thousands) Investment Type 2013 2012
School Corporate Bonds
Fair Value $ 1,330 $ 2,284 % of Rated Value by Credit Rating Unrated Unrated Duration (yrs) 2.21-5.70 2.39-8.56

Colorado School of Mines Notes to Financial Statements
June 30, 2013 and 2012
30
TABLE 2.3 Debt Investments, Interest Rate and Credit Quality Risk (continued) (in thousands)
Investment Type 2013 2012 Discretely Presented Component Unit Corporate Bonds
Fair Value $ 22,821 $ 32,658 % of Rated Value by Credit Rating Unrated Unrated Duration 2.21-5.70 2.39-8.56
Note 3: Accounts, Contributions and Loans Receivable
Table 3.1, Accounts Receivable, segregates receivables as of June 30, 2013 and 2012, by type.
TABLE 3.1 Accounts Receivable (in thousands)
2013
Type of Receivable Gross
Receivables Allowance Net Receivable Net Current
Portion
School Student accounts $ 4,099 1,058 3,041 3,041Student loans 5,574 178 5,396 572Federal government 7,794 - 7,794 7,794Private sponsors 2,519 438 2,081 2,081DPCU 2,376 - 2,376 2,376Other 1,246 - 1,246 1,246
Total Receivable-School $ 23,608 1,674 21,934 17,110
Discretely Presented Component Unit
Contributions* $ 16,675 700 15,975 6,634Due from School 1,755 - 1,755 -
Total Receivable-DPCU $ 18,430 700 17,730 6,634
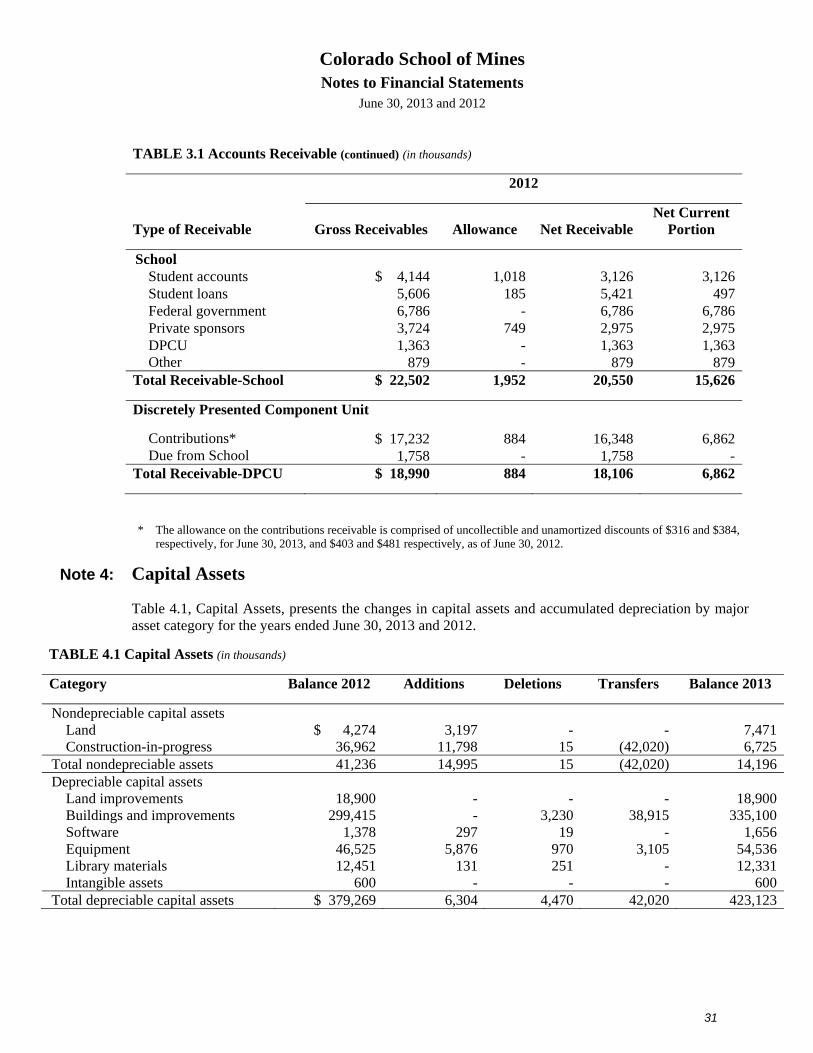
Colorado School of Mines Notes to Financial Statements
June 30, 2013 and 2012
31
TABLE 3.1 Accounts Receivable (continued) (in thousands)
2012
Type of Receivable Gross Receivables Allowance Net Receivable Net Current
Portion
School Student accounts $ 4,144 1,018 3,126 3,126Student loans 5,606 185 5,421 497Federal government 6,786 - 6,786 6,786Private sponsors 3,724 749 2,975 2,975DPCU 1,363 - 1,363 1,363Other 879 - 879 879
Total Receivable-School $ 22,502 1,952 20,550 15,626
Discretely Presented Component Unit
Contributions* $ 17,232 884 16,348 6,862Due from School 1,758 - 1,758 -
Total Receivable-DPCU $ 18,990 884 18,106 6,862
* The allowance on the contributions receivable is comprised of uncollectible and unamortized discounts of $316 and $384, respectively, for June 30, 2013, and $403 and $481 respectively, as of June 30, 2012.
Note 4: Capital Assets
Table 4.1, Capital Assets, presents the changes in capital assets and accumulated depreciation by major asset category for the years ended June 30, 2013 and 2012.
TABLE 4.1 Capital Assets (in thousands)
Category Balance 2012 Additions Deletions Transfers Balance 2013
Nondepreciable capital assets Land $ 4,274 3,197 - - 7,471Construction-in-progress 36,962 11,798 15 (42,020) 6,725
Total nondepreciable assets 41,236 14,995 15 (42,020) 14,196Depreciable capital assets
Land improvements 18,900 - - - 18,900Buildings and improvements 299,415 - 3,230 38,915 335,100Software 1,378 297 19 - 1,656Equipment 46,525 5,876 970 3,105 54,536Library materials 12,451 131 251 - 12,331Intangible assets 600 - - - 600
Total depreciable capital assets $ 379,269 6,304 4,470 42,020 423,123
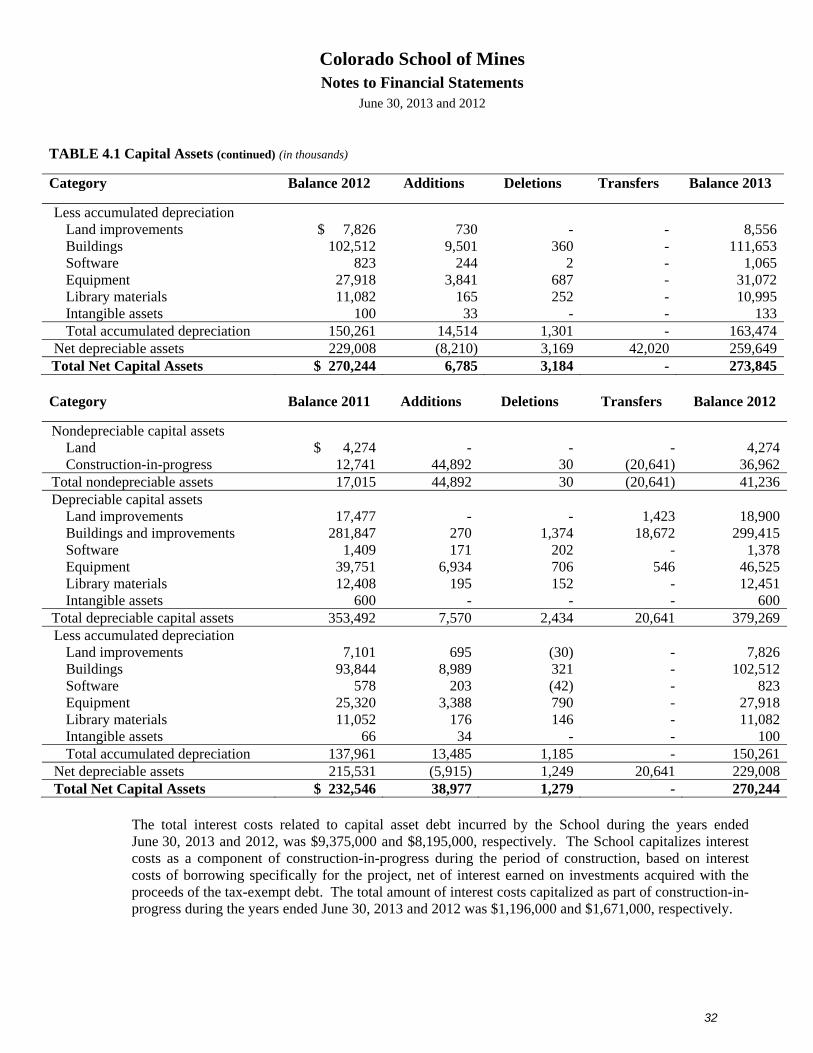
Colorado School of Mines Notes to Financial Statements
June 30, 2013 and 2012
32
TABLE 4.1 Capital Assets (continued) (in thousands)
Category Balance 2012 Additions Deletions Transfers Balance 2013
Less accumulated depreciation Land improvements $ 7,826 730 - - 8,556Buildings 102,512 9,501 360 - 111,653Software 823 244 2 - 1,065Equipment 27,918 3,841 687 - 31,072Library materials 11,082 165 252 - 10,995Intangible assets 100 33 - - 133Total accumulated depreciation 150,261 14,514 1,301 - 163,474
Net depreciable assets 229,008 (8,210) 3,169 42,020 259,649Total Net Capital Assets $ 270,244 6,785 3,184 - 273,845
Category Balance 2011 Additions Deletions Transfers Balance 2012
Nondepreciable capital assets Land $ 4,274 - - - 4,274Construction-in-progress 12,741 44,892 30 (20,641) 36,962
Total nondepreciable assets 17,015 44,892 30 (20,641) 41,236Depreciable capital assets
Land improvements 17,477 - - 1,423 18,900Buildings and improvements 281,847 270 1,374 18,672 299,415Software 1,409 171 202 - 1,378Equipment 39,751 6,934 706 546 46,525Library materials 12,408 195 152 - 12,451Intangible assets 600 - - - 600
Total depreciable capital assets 353,492 7,570 2,434 20,641 379,269Less accumulated depreciation
Land improvements 7,101 695 (30) - 7,826Buildings 93,844 8,989 321 - 102,512Software 578 203 (42) - 823Equipment 25,320 3,388 790 - 27,918Library materials 11,052 176 146 - 11,082Intangible assets 66 34 - - 100Total accumulated depreciation 137,961 13,485 1,185 - 150,261
Net depreciable assets 215,531 (5,915) 1,249 20,641 229,008Total Net Capital Assets $ 232,546 38,977 1,279 - 270,244
The total interest costs related to capital asset debt incurred by the School during the years ended June 30, 2013 and 2012, was $9,375,000 and $8,195,000, respectively. The School capitalizes interest costs as a component of construction-in-progress during the period of construction, based on interest costs of borrowing specifically for the project, net of interest earned on investments acquired with the proceeds of the tax-exempt debt. The total amount of interest costs capitalized as part of construction-in-progress during the years ended June 30, 2013 and 2012 was $1,196,000 and $1,671,000, respectively.
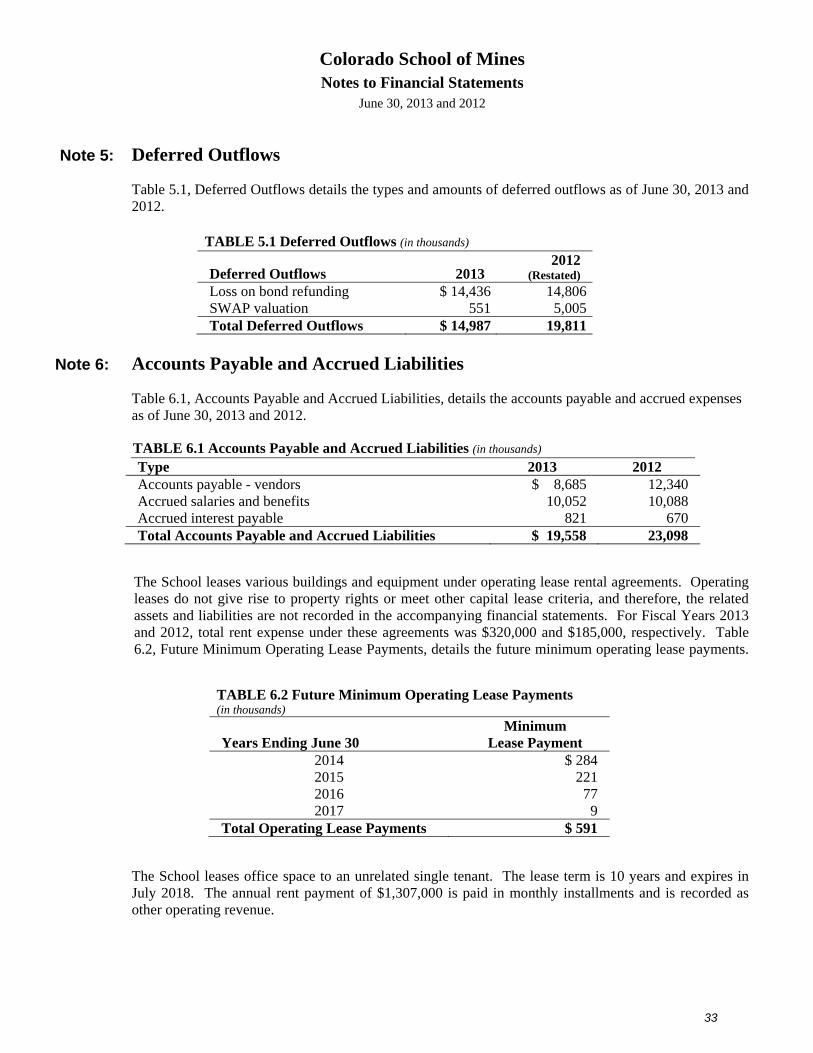
Colorado School of Mines Notes to Financial Statements
June 30, 2013 and 2012
33
Note 5: Deferred Outflows
Table 5.1, Deferred Outflows details the types and amounts of deferred outflows as of June 30, 2013 and 2012.
TABLE 5.1 Deferred Outflows (in thousands)
Deferred Outflows 2013 2012
(Restated)
Loss on bond refunding $ 14,436 14,806 SWAP valuation 551 5,005 Total Deferred Outflows $ 14,987 19,811
Note 6: Accounts Payable and Accrued Liabilities
Table 6.1, Accounts Payable and Accrued Liabilities, details the accounts payable and accrued expenses as of June 30, 2013 and 2012.
TABLE 6.1 Accounts Payable and Accrued Liabilities (in thousands) Type 2013 2012 Accounts payable - vendors $ 8,685 12,340 Accrued salaries and benefits 10,052 10,088 Accrued interest payable 821 670 Total Accounts Payable and Accrued Liabilities $ 19,558 23,098
The School leases various buildings and equipment under operating lease rental agreements. Operating leases do not give rise to property rights or meet other capital lease criteria, and therefore, the related assets and liabilities are not recorded in the accompanying financial statements. For Fiscal Years 2013 and 2012, total rent expense under these agreements was $320,000 and $185,000, respectively. Table 6.2, Future Minimum Operating Lease Payments, details the future minimum operating lease payments.
TABLE 6.2 Future Minimum Operating Lease Payments (in thousands) Years Ending June 30
Minimum Lease Payment
2014 $ 284 2015 221 2016 77 2017 9
Total Operating Lease Payments $ 591
The School leases office space to an unrelated single tenant. The lease term is 10 years and expires in July 2018. The annual rent payment of $1,307,000 is paid in monthly installments and is recorded as other operating revenue.
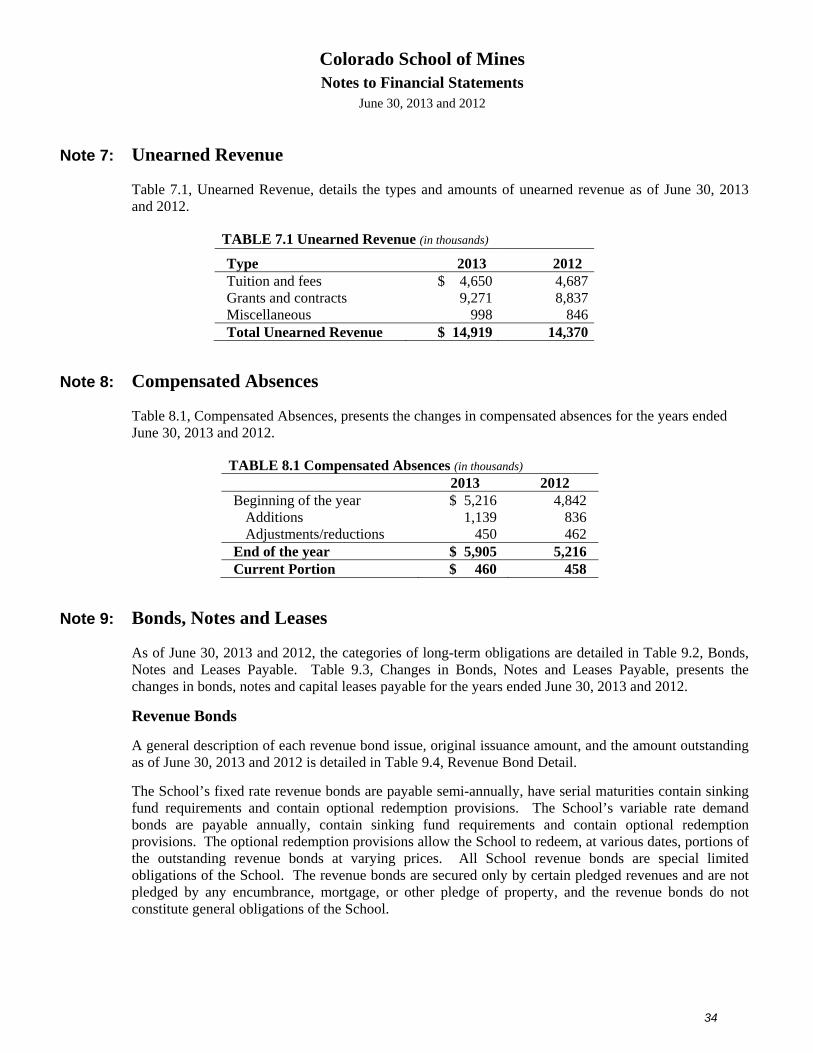
Colorado School of Mines Notes to Financial Statements
June 30, 2013 and 2012
34
Note 7: Unearned Revenue
Table 7.1, Unearned Revenue, details the types and amounts of unearned revenue as of June 30, 2013 and 2012.
TABLE 7.1 Unearned Revenue (in thousands)
Type 2013 2012 Tuition and fees $ 4,650 4,687 Grants and contracts 9,271 8,837 Miscellaneous 998 846 Total Unearned Revenue $ 14,919 14,370
Note 8: Compensated Absences
Table 8.1, Compensated Absences, presents the changes in compensated absences for the years ended June 30, 2013 and 2012.
TABLE 8.1 Compensated Absences (in thousands) 2013 2012 Beginning of the year $ 5,216 4,842
Additions 1,139 836 Adjustments/reductions 450 462
End of the year $ 5,905 5,216 Current Portion $ 460 458
Note 9: Bonds, Notes and Leases
As of June 30, 2013 and 2012, the categories of long-term obligations are detailed in Table 9.2, Bonds, Notes and Leases Payable. Table 9.3, Changes in Bonds, Notes and Leases Payable, presents the changes in bonds, notes and capital leases payable for the years ended June 30, 2013 and 2012.
Revenue Bonds
A general description of each revenue bond issue, original issuance amount, and the amount outstanding as of June 30, 2013 and 2012 is detailed in Table 9.4, Revenue Bond Detail.
The School’s fixed rate revenue bonds are payable semi-annually, have serial maturities contain sinking fund requirements and contain optional redemption provisions. The School’s variable rate demand bonds are payable annually, contain sinking fund requirements and contain optional redemption provisions. The optional redemption provisions allow the School to redeem, at various dates, portions of the outstanding revenue bonds at varying prices. All School revenue bonds are special limited obligations of the School. The revenue bonds are secured only by certain pledged revenues and are not pledged by any encumbrance, mortgage, or other pledge of property, and the revenue bonds do not constitute general obligations of the School.
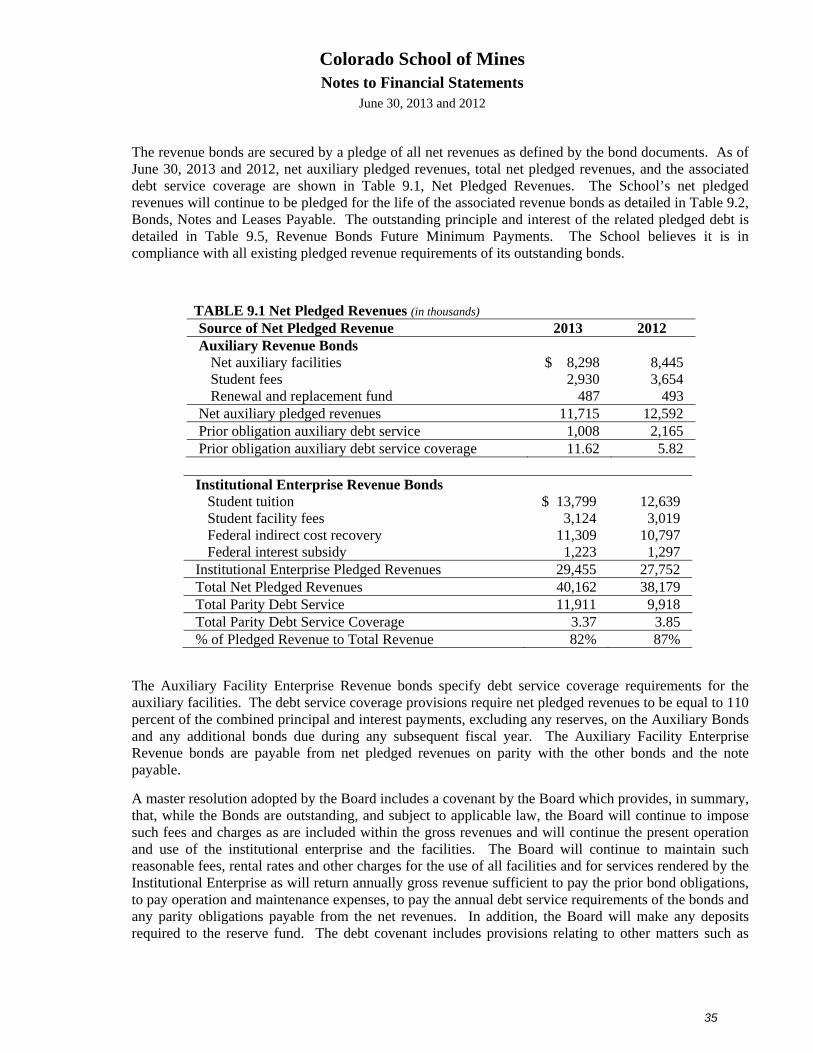
Colorado School of Mines Notes to Financial Statements
June 30, 2013 and 2012
35
The revenue bonds are secured by a pledge of all net revenues as defined by the bond documents. As of June 30, 2013 and 2012, net auxiliary pledged revenues, total net pledged revenues, and the associated debt service coverage are shown in Table 9.1, Net Pledged Revenues. The School’s net pledged revenues will continue to be pledged for the life of the associated revenue bonds as detailed in Table 9.2, Bonds, Notes and Leases Payable. The outstanding principle and interest of the related pledged debt is detailed in Table 9.5, Revenue Bonds Future Minimum Payments. The School believes it is in compliance with all existing pledged revenue requirements of its outstanding bonds.
TABLE 9.1 Net Pledged Revenues (in thousands) Source of Net Pledged Revenue 2013 2012 Auxiliary Revenue Bonds
Net auxiliary facilities $ 8,298 8,445 Student fees 2,930 3,654 Renewal and replacement fund 487 493
Net auxiliary pledged revenues 11,715 12,592 Prior obligation auxiliary debt service 1,008 2,165 Prior obligation auxiliary debt service coverage 11.62 5.82
Institutional Enterprise Revenue Bonds
Student tuition $ 13,799 12,639 Student facility fees 3,124 3,019 Federal indirect cost recovery 11,309 10,797 Federal interest subsidy 1,223 1,297
Institutional Enterprise Pledged Revenues 29,455 27,752 Total Net Pledged Revenues 40,162 38,179 Total Parity Debt Service 11,911 9,918 Total Parity Debt Service Coverage 3.37 3.85 % of Pledged Revenue to Total Revenue 82% 87%
The Auxiliary Facility Enterprise Revenue bonds specify debt service coverage requirements for the auxiliary facilities. The debt service coverage provisions require net pledged revenues to be equal to 110 percent of the combined principal and interest payments, excluding any reserves, on the Auxiliary Bonds and any additional bonds due during any subsequent fiscal year. The Auxiliary Facility Enterprise Revenue bonds are payable from net pledged revenues on parity with the other bonds and the note payable.
A master resolution adopted by the Board includes a covenant by the Board which provides, in summary, that, while the Bonds are outstanding, and subject to applicable law, the Board will continue to impose such fees and charges as are included within the gross revenues and will continue the present operation and use of the institutional enterprise and the facilities. The Board will continue to maintain such reasonable fees, rental rates and other charges for the use of all facilities and for services rendered by the Institutional Enterprise as will return annually gross revenue sufficient to pay the prior bond obligations, to pay operation and maintenance expenses, to pay the annual debt service requirements of the bonds and any parity obligations payable from the net revenues. In addition, the Board will make any deposits required to the reserve fund. The debt covenant includes provisions relating to other matters such as
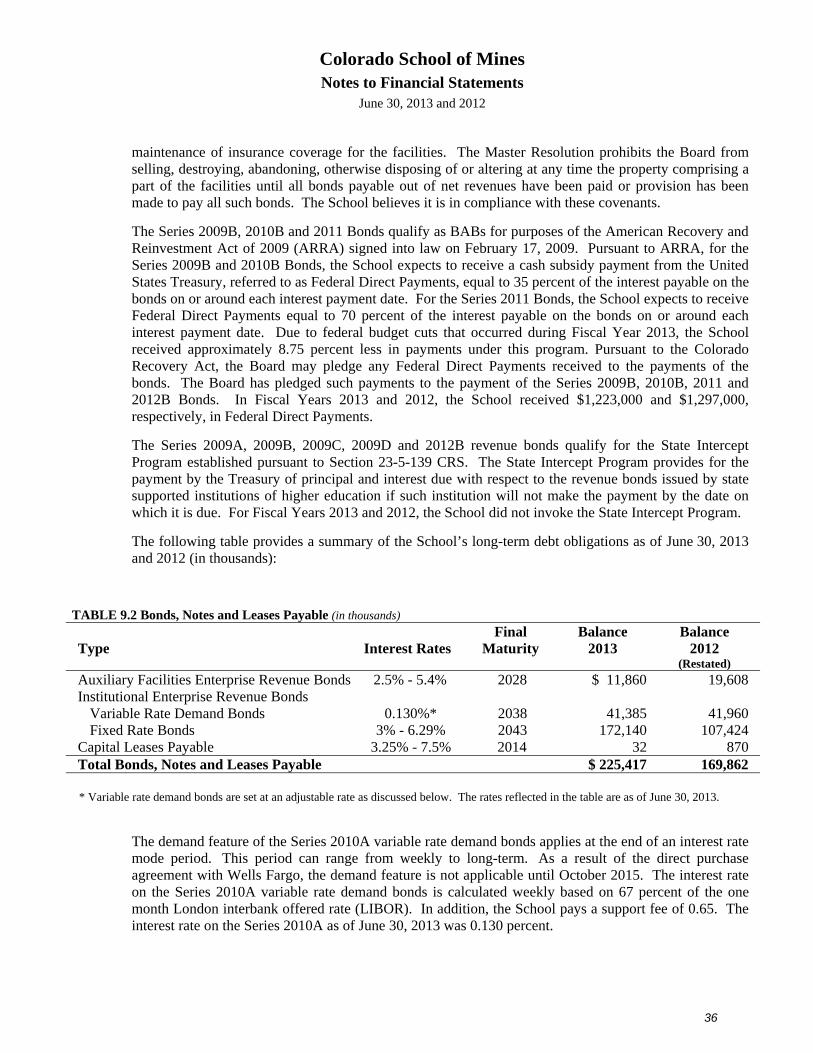
Colorado School of Mines Notes to Financial Statements
June 30, 2013 and 2012
36
maintenance of insurance coverage for the facilities. The Master Resolution prohibits the Board from selling, destroying, abandoning, otherwise disposing of or altering at any time the property comprising a part of the facilities until all bonds payable out of net revenues have been paid or provision has been made to pay all such bonds. The School believes it is in compliance with these covenants.
The Series 2009B, 2010B and 2011 Bonds qualify as BABs for purposes of the American Recovery and Reinvestment Act of 2009 (ARRA) signed into law on February 17, 2009. Pursuant to ARRA, for the Series 2009B and 2010B Bonds, the School expects to receive a cash subsidy payment from the United States Treasury, referred to as Federal Direct Payments, equal to 35 percent of the interest payable on the bonds on or around each interest payment date. For the Series 2011 Bonds, the School expects to receive Federal Direct Payments equal to 70 percent of the interest payable on the bonds on or around each interest payment date. Due to federal budget cuts that occurred during Fiscal Year 2013, the School received approximately 8.75 percent less in payments under this program. Pursuant to the Colorado Recovery Act, the Board may pledge any Federal Direct Payments received to the payments of the bonds. The Board has pledged such payments to the payment of the Series 2009B, 2010B, 2011 and 2012B Bonds. In Fiscal Years 2013 and 2012, the School received $1,223,000 and $1,297,000, respectively, in Federal Direct Payments.
The Series 2009A, 2009B, 2009C, 2009D and 2012B revenue bonds qualify for the State Intercept Program established pursuant to Section 23-5-139 CRS. The State Intercept Program provides for the payment by the Treasury of principal and interest due with respect to the revenue bonds issued by state supported institutions of higher education if such institution will not make the payment by the date on which it is due. For Fiscal Years 2013 and 2012, the School did not invoke the State Intercept Program.
The following table provides a summary of the School’s long-term debt obligations as of June 30, 2013 and 2012 (in thousands):
TABLE 9.2 Bonds, Notes and Leases Payable (in thousands)
Type
Interest Rates Final
Maturity Balance
2013 Balance
2012 (Restated)
Auxiliary Facilities Enterprise Revenue Bonds 2.5% - 5.4% 2028 $ 11,860 19,608 Institutional Enterprise Revenue Bonds
Variable Rate Demand Bonds Fixed Rate Bonds
0.130%*
3% - 6.29%
2038 2043
41,385
172,140
41,960
107,424 Capital Leases Payable 3.25% - 7.5% 2014 32 870 Total Bonds, Notes and Leases Payable $ 225,417 169,862 * Variable rate demand bonds are set at an adjustable rate as discussed below. The rates reflected in the table are as of June 30, 2013.
The demand feature of the Series 2010A variable rate demand bonds applies at the end of an interest rate mode period. This period can range from weekly to long-term. As a result of the direct purchase agreement with Wells Fargo, the demand feature is not applicable until October 2015. The interest rate on the Series 2010A variable rate demand bonds is calculated weekly based on 67 percent of the one month London interbank offered rate (LIBOR). In addition, the School pays a support fee of 0.65. The interest rate on the Series 2010A as of June 30, 2013 was 0.130 percent.
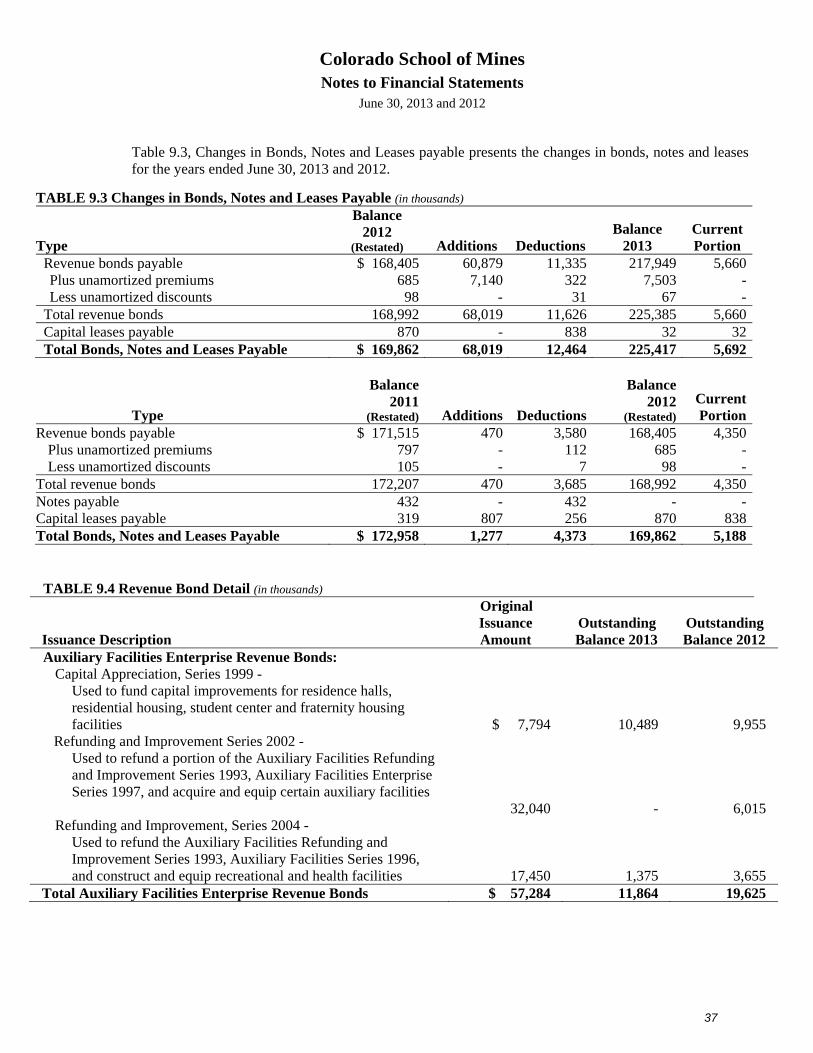
Colorado School of Mines Notes to Financial Statements
June 30, 2013 and 2012
37
Table 9.3, Changes in Bonds, Notes and Leases payable presents the changes in bonds, notes and leases for the years ended June 30, 2013 and 2012.
TABLE 9.3 Changes in Bonds, Notes and Leases Payable (in thousands)
Type
Balance 2012
(Restated) Additions Deductions Balance
2013 Current Portion
Revenue bonds payable $ 168,405 60,879 11,335 217,949 5,660Plus unamortized premiums 685 7,140 322 7,503 -Less unamortized discounts 98 - 31 67 -
Total revenue bonds 168,992 68,019 11,626 225,385 5,660Capital leases payable 870 - 838 32 32Total Bonds, Notes and Leases Payable $ 169,862 68,019 12,464 225,417 5,692
Type
Balance2011
(Restated) Additions Deductions
Balance2012
(Restated)
Current Portion
Revenue bonds payable $ 171,515 470 3,580 168,405 4,350Plus unamortized premiums 797 - 112 685 -Less unamortized discounts 105 - 7 98 -
Total revenue bonds 172,207 470 3,685 168,992 4,350Notes payable 432 - 432 - -Capital leases payable 319 807 256 870 838Total Bonds, Notes and Leases Payable $ 172,958 1,277 4,373 169,862 5,188
TABLE 9.4 Revenue Bond Detail (in thousands)
Issuance Description
Original Issuance Amount
Outstanding Balance 2013
Outstanding Balance 2012
Auxiliary Facilities Enterprise Revenue Bonds: Capital Appreciation, Series 1999 -
Used to fund capital improvements for residence halls, residential housing, student center and fraternity housing facilities
$ 7,794
10,489
9,955 Refunding and Improvement Series 2002 -
Used to refund a portion of the Auxiliary Facilities Refunding and Improvement Series 1993, Auxiliary Facilities Enterprise Series 1997, and acquire and equip certain auxiliary facilities
32,040
-
6,015 Refunding and Improvement, Series 2004 -
Used to refund the Auxiliary Facilities Refunding and Improvement Series 1993, Auxiliary Facilities Series 1996, and construct and equip recreational and health facilities
17,450
1,375
3,655 Total Auxiliary Facilities Enterprise Revenue Bonds $ 57,284 11,864 19,625
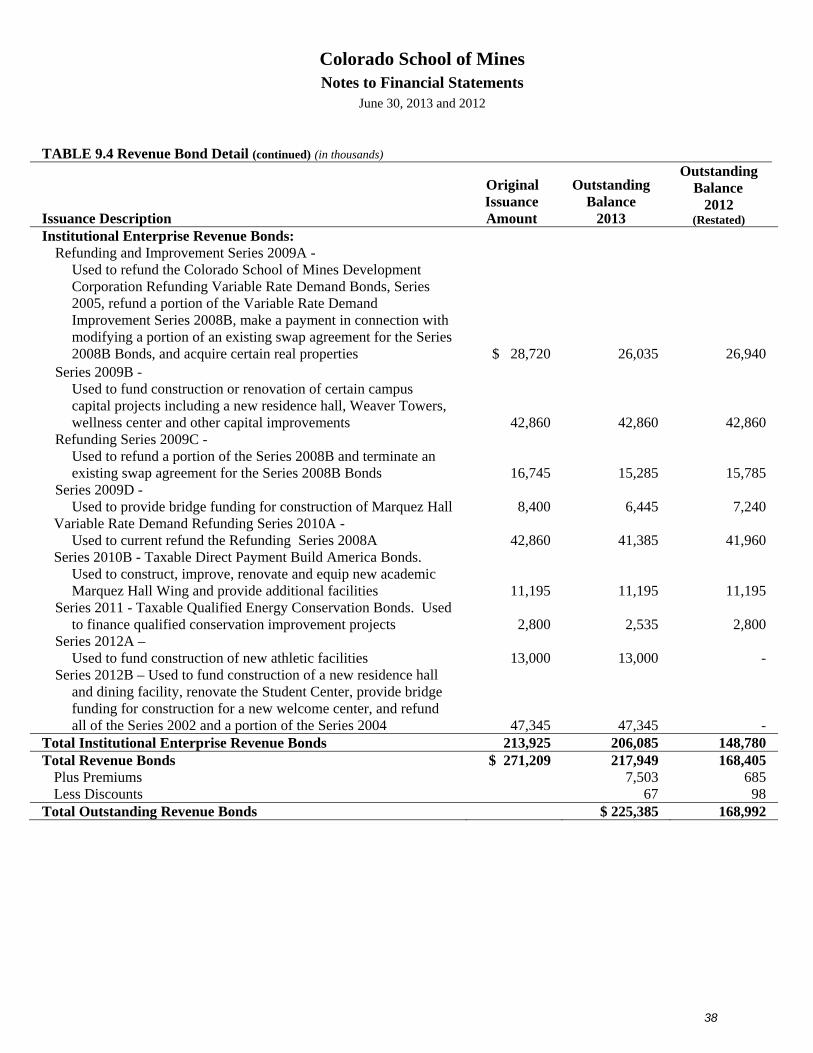
Colorado School of Mines Notes to Financial Statements
June 30, 2013 and 2012
38
TABLE 9.4 Revenue Bond Detail (continued) (in thousands)
Issuance Description
Original Issuance Amount
Outstanding Balance
2013
Outstanding Balance
2012 (Restated)
Institutional Enterprise Revenue Bonds: Refunding and Improvement Series 2009A -
Used to refund the Colorado School of Mines Development Corporation Refunding Variable Rate Demand Bonds, Series 2005, refund a portion of the Variable Rate Demand Improvement Series 2008B, make a payment in connection with modifying a portion of an existing swap agreement for the Series 2008B Bonds, and acquire certain real properties
$ 28,720
26,035
26,940
Series 2009B - Used to fund construction or renovation of certain campus capital projects including a new residence hall, Weaver Towers, wellness center and other capital improvements
42,860
42,860
42,860 Refunding Series 2009C -
Used to refund a portion of the Series 2008B and terminate an existing swap agreement for the Series 2008B Bonds
16,745
15,285
15,785 Series 2009D -
Used to provide bridge funding for construction of Marquez Hall
8,400
6,445
7,240 Variable Rate Demand Refunding Series 2010A -
Used to current refund the Refunding Series 2008A
42,860
41,385
41,960 Series 2010B - Taxable Direct Payment Build America Bonds.
Used to construct, improve, renovate and equip new academic Marquez Hall Wing and provide additional facilities
11,195
11,195
11,195 Series 2011 - Taxable Qualified Energy Conservation Bonds. Used
to finance qualified conservation improvement projects
2,800
2,535
2,800 Series 2012A –
Used to fund construction of new athletic facilities
13,000
13,000
- Series 2012B – Used to fund construction of a new residence hall
and dining facility, renovate the Student Center, provide bridge funding for construction for a new welcome center, and refund all of the Series 2002 and a portion of the Series 2004
47,345
47,345
- Total Institutional Enterprise Revenue Bonds 213,925 206,085 148,780 Total Revenue Bonds $ 271,209 217,949 168,405
Plus Premiums 7,503 685 Less Discounts 67 98
Total Outstanding Revenue Bonds $ 225,385 168,992
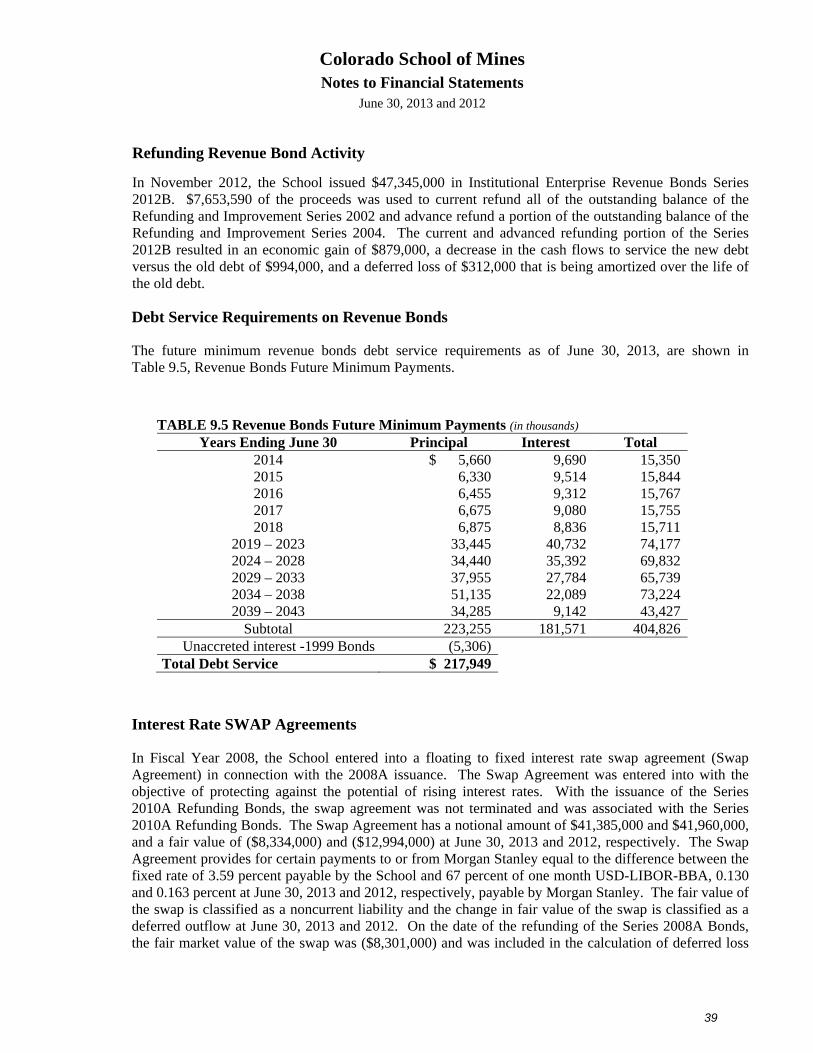
Colorado School of Mines Notes to Financial Statements
June 30, 2013 and 2012
39
Refunding Revenue Bond Activity
In November 2012, the School issued $47,345,000 in Institutional Enterprise Revenue Bonds Series 2012B. $7,653,590 of the proceeds was used to current refund all of the outstanding balance of the Refunding and Improvement Series 2002 and advance refund a portion of the outstanding balance of the Refunding and Improvement Series 2004. The current and advanced refunding portion of the Series 2012B resulted in an economic gain of $879,000, a decrease in the cash flows to service the new debt versus the old debt of $994,000, and a deferred loss of $312,000 that is being amortized over the life of the old debt.
Debt Service Requirements on Revenue Bonds
The future minimum revenue bonds debt service requirements as of June 30, 2013, are shown in Table 9.5, Revenue Bonds Future Minimum Payments.
TABLE 9.5 Revenue Bonds Future Minimum Payments (in thousands) Years Ending June 30 Principal Interest Total
2014 $ 5,660 9,690 15,3502015 6,330 9,514 15,8442016 6,455 9,312 15,7672017 6,675 9,080 15,7552018 6,875 8,836 15,711
2019 – 2023 33,445 40,732 74,1772024 – 2028 34,440 35,392 69,8322029 – 2033 37,955 27,784 65,7392034 – 2038 51,135 22,089 73,2242039 – 2043 34,285 9,142 43,427
Subtotal 223,255 181,571 404,826Unaccreted interest -1999 Bonds (5,306)
Total Debt Service $ 217,949
Interest Rate SWAP Agreements
In Fiscal Year 2008, the School entered into a floating to fixed interest rate swap agreement (Swap Agreement) in connection with the 2008A issuance. The Swap Agreement was entered into with the objective of protecting against the potential of rising interest rates. With the issuance of the Series 2010A Refunding Bonds, the swap agreement was not terminated and was associated with the Series 2010A Refunding Bonds. The Swap Agreement has a notional amount of $41,385,000 and $41,960,000, and a fair value of ($8,334,000) and ($12,994,000) at June 30, 2013 and 2012, respectively. The Swap Agreement provides for certain payments to or from Morgan Stanley equal to the difference between the fixed rate of 3.59 percent payable by the School and 67 percent of one month USD-LIBOR-BBA, 0.130 and 0.163 percent at June 30, 2013 and 2012, respectively, payable by Morgan Stanley. The fair value of the swap is classified as a noncurrent liability and the change in fair value of the swap is classified as a deferred outflow at June 30, 2013 and 2012. On the date of the refunding of the Series 2008A Bonds, the fair market value of the swap was ($8,301,000) and was included in the calculation of deferred loss
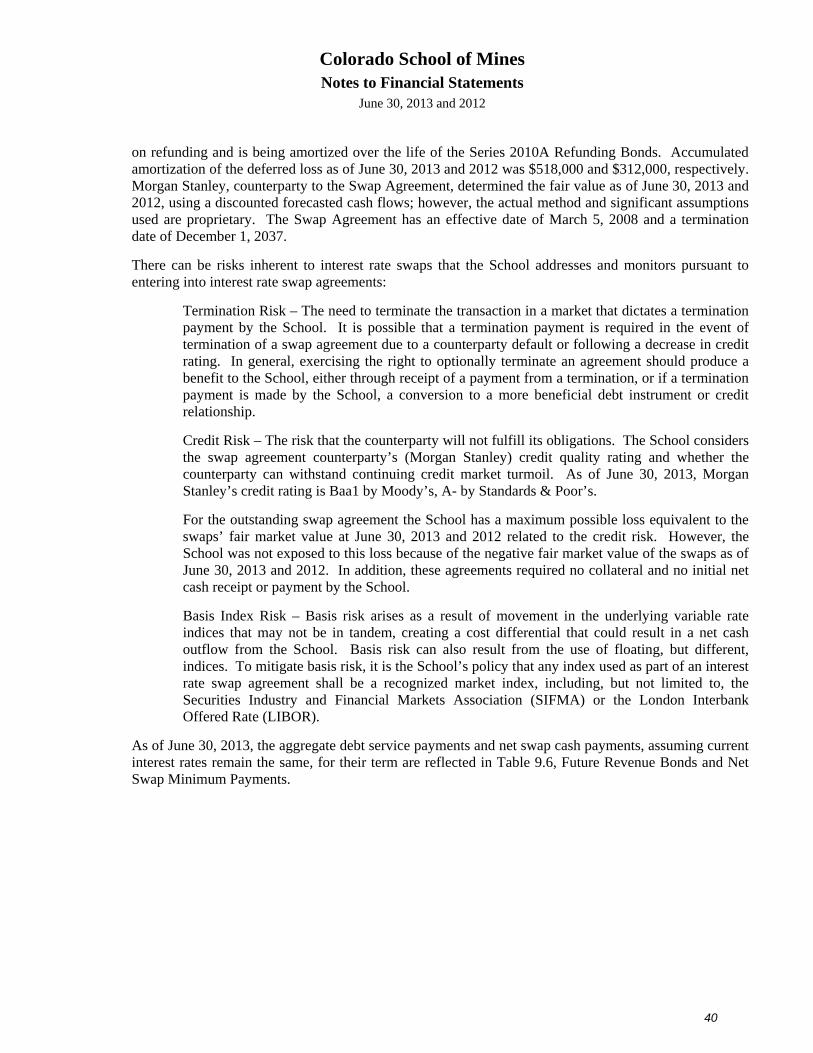
Colorado School of Mines Notes to Financial Statements
June 30, 2013 and 2012
40
on refunding and is being amortized over the life of the Series 2010A Refunding Bonds. Accumulated amortization of the deferred loss as of June 30, 2013 and 2012 was $518,000 and $312,000, respectively. Morgan Stanley, counterparty to the Swap Agreement, determined the fair value as of June 30, 2013 and 2012, using a discounted forecasted cash flows; however, the actual method and significant assumptions used are proprietary. The Swap Agreement has an effective date of March 5, 2008 and a termination date of December 1, 2037.
There can be risks inherent to interest rate swaps that the School addresses and monitors pursuant to entering into interest rate swap agreements:
Termination Risk – The need to terminate the transaction in a market that dictates a termination payment by the School. It is possible that a termination payment is required in the event of termination of a swap agreement due to a counterparty default or following a decrease in credit rating. In general, exercising the right to optionally terminate an agreement should produce a benefit to the School, either through receipt of a payment from a termination, or if a termination payment is made by the School, a conversion to a more beneficial debt instrument or credit relationship.
Credit Risk – The risk that the counterparty will not fulfill its obligations. The School considers the swap agreement counterparty’s (Morgan Stanley) credit quality rating and whether the counterparty can withstand continuing credit market turmoil. As of June 30, 2013, Morgan Stanley’s credit rating is Baa1 by Moody’s, A- by Standards & Poor’s.
For the outstanding swap agreement the School has a maximum possible loss equivalent to the swaps’ fair market value at June 30, 2013 and 2012 related to the credit risk. However, the School was not exposed to this loss because of the negative fair market value of the swaps as of June 30, 2013 and 2012. In addition, these agreements required no collateral and no initial net cash receipt or payment by the School.
Basis Index Risk – Basis risk arises as a result of movement in the underlying variable rate indices that may not be in tandem, creating a cost differential that could result in a net cash outflow from the School. Basis risk can also result from the use of floating, but different, indices. To mitigate basis risk, it is the School’s policy that any index used as part of an interest rate swap agreement shall be a recognized market index, including, but not limited to, the Securities Industry and Financial Markets Association (SIFMA) or the London Interbank Offered Rate (LIBOR).
As of June 30, 2013, the aggregate debt service payments and net swap cash payments, assuming current interest rates remain the same, for their term are reflected in Table 9.6, Future Revenue Bonds and Net Swap Minimum Payments.
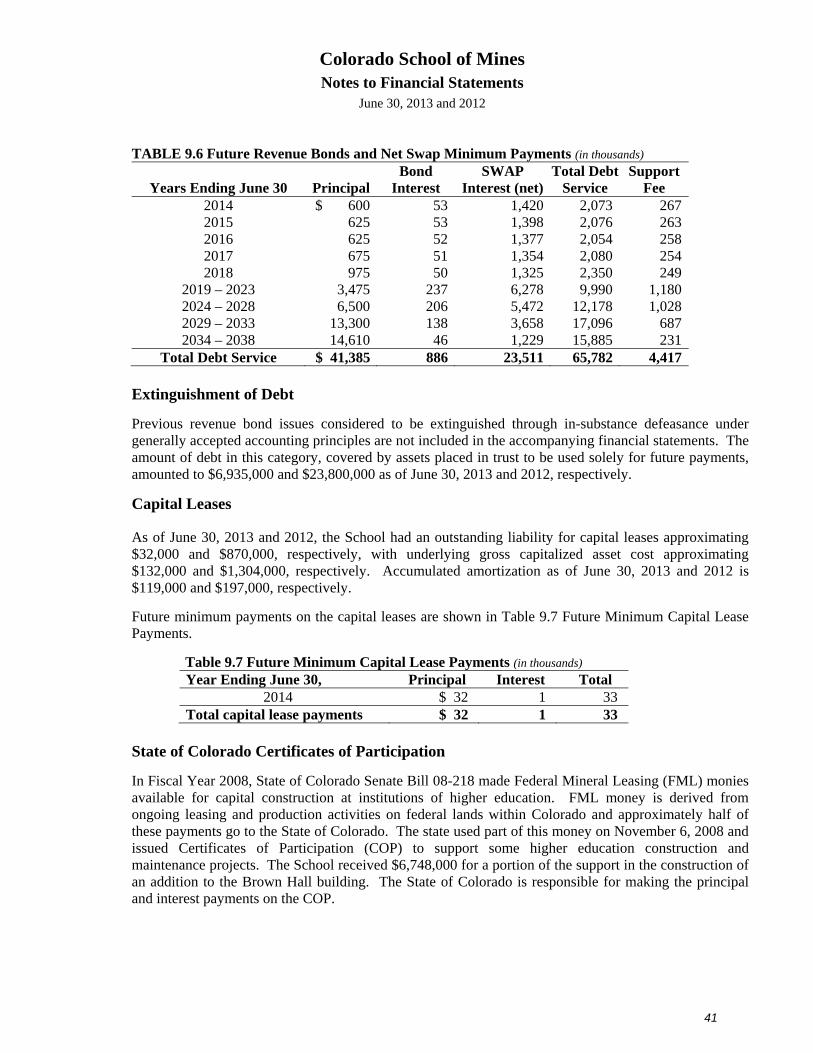
Colorado School of Mines Notes to Financial Statements
June 30, 2013 and 2012
41
TABLE 9.6 Future Revenue Bonds and Net Swap Minimum Payments (in thousands)
Years Ending June 30 PrincipalBond
Interest SWAP
Interest (net)Total Debt
Service Support
Fee 2014 $ 600 53 1,420 2,073 2672015 625 53 1,398 2,076 2632016 625 52 1,377 2,054 2582017 675 51 1,354 2,080 2542018 975 50 1,325 2,350 249
2019 – 2023 3,475 237 6,278 9,990 1,1802024 – 2028 6,500 206 5,472 12,178 1,0282029 – 2033 13,300 138 3,658 17,096 6872034 – 2038 14,610 46 1,229 15,885 231
Total Debt Service $ 41,385 886 23,511 65,782 4,417 Extinguishment of Debt
Previous revenue bond issues considered to be extinguished through in-substance defeasance under generally accepted accounting principles are not included in the accompanying financial statements. The amount of debt in this category, covered by assets placed in trust to be used solely for future payments, amounted to $6,935,000 and $23,800,000 as of June 30, 2013 and 2012, respectively.
Capital Leases
As of June 30, 2013 and 2012, the School had an outstanding liability for capital leases approximating $32,000 and $870,000, respectively, with underlying gross capitalized asset cost approximating $132,000 and $1,304,000, respectively. Accumulated amortization as of June 30, 2013 and 2012 is $119,000 and $197,000, respectively.
Future minimum payments on the capital leases are shown in Table 9.7 Future Minimum Capital Lease Payments.
Table 9.7 Future Minimum Capital Lease Payments (in thousands) Year Ending June 30, Principal Interest Total
2014 $ 32 1 33 Total capital lease payments $ 32 1 33
State of Colorado Certificates of Participation
In Fiscal Year 2008, State of Colorado Senate Bill 08-218 made Federal Mineral Leasing (FML) monies available for capital construction at institutions of higher education. FML money is derived from ongoing leasing and production activities on federal lands within Colorado and approximately half of these payments go to the State of Colorado. The state used part of this money on November 6, 2008 and issued Certificates of Participation (COP) to support some higher education construction and maintenance projects. The School received $6,748,000 for a portion of the support in the construction of an addition to the Brown Hall building. The State of Colorado is responsible for making the principal and interest payments on the COP.
Colorado School of Mines Notes to Financial Statements
June 30, 2013 and 2012
42
Note 10: Other Liabilities
Table 10.1, Other Liabilities, details other liabilities as of June 30, 2013 and 2012.
TABLE 10.1 Other Liabilities (in thousands) 2013 2012 Type
Total
Current Portion
Total
Current Portion
School Amounts due to the Foundation $ 2,001 246 1,937 179Funds held for others 129 129 101 101Pollution remediation 30 30 206 206Student deposits 620 620 598 598Miscellaneous 670 670 379 379
Total Other Liabilities - School $ 3,450 1,695 3,221 1,463Discretely Presented Component Unit
Colorado School of Mines $18,889 - 13,844 -Other trust funds 945 - 950 -Obligations under split-interest agreements 5,606 - 5,168 -Obligations under gift annuity agreements 5,116 - 4,715 -Refunded advances 96 - 113 -Other liabilities 228 - 159 -
Total Other Liabilities - DPCU $30,880 - 24,949 -
Direct Lending
The School began participation in the Direct Student Loan program operated by the federal government in the spring of Fiscal Year 2010. This program enables eligible students or parents to obtain a loan to pay for the student’s cost of attendance directly through the School rather than through a private lender. The School is responsible for handling the complete loan process, including funds management, as well as promissory note functions. The School is not responsible for collection of these loans or for defaults by borrowers, and therefore these loans are not recognized as receivables in the accompanying financial statements. Lending activity during the years ended June 30, 2013 and 2012 under these programs were $28,886,000 and $26,466,000, respectively.
Note 11: Changes in Accounting Principles
During Fiscal Year 2013, the School adopted Governmental Accounting Standards Board Statement No. 63, Financial Reporting of Deferred Outflows of Resources, Deferred Inflows of Resources, and Net Position (GASB 63). GASB 63 provides guidance for reporting deferred outflows of resources, deferred inflows of resources and net position (previously “net assets”) in a statement of net position (previously “statement of net assets”) and related disclosures. GASB 63 also changes the caption “Invested in capital assets, net of related debt” to “Net investment in capital assets” in the Statement of Net Position. Adoption of GASB 63 had no effect on the School’s beginning net position as of July 1, 2012 or on the change in net position for the year ended June 30, 2012.
Colorado School of Mines Notes to Financial Statements
June 30, 2013 and 2012
43
During Fiscal Year 2013, the School early adopted Governmental Accounting Standards Board Statement No 65, Items Previously Reported as Assets and Liabilities (GASB 65). GASB 65 establishes accounting and financial reporting standards that reclassify, as deferred outflows of resources or deferred inflows of resources, certain items that were previously reported as assets and liabilities and recognizes, as outflows of resources or inflows of resources, certain items that were previously reported as assets and liabilities. This standard expands on the financial reporting guidance provided in GASB 63 and concepts introduced and defined in GASB Concepts Statement 4, Elements of Financial Statements. Adoption of GASB 65 resulted in a decrease of $1,308,000 in beginning net position as of July 1, 2011, an increase in the change in net position for the year ended June 30, 2012 of $102,000, and a decrease in noncurrent assets and total assets of $1,206,000. Additionally, adoption of GASB 65 resulted in an increase in deferred outflows, an increase in noncurrent liabilities, and total liabilities of $14,806,000. The decrease in beginning net position, the increase in net position, and the decrease in noncurrent assets and total assets resulted from the requirement that debt issuance costs be recognized as an expense in the period incurred. The increases in deferred outflows, noncurrent liabilities and total liabilities resulted from the requirement to reclassify as deferred outflows certain items previously reported as assets or liabilities.
Note 12: Pension Plan
Plan Description
Virtually all the School employees participate in a defined benefit pension plan. The plan’s purpose is to provide income to members and their families at retirement or in case of death or disability. The plan is a cost-sharing multiple-employer plan, administered by the Public Employees’ Retirement Association (PERA). PERA was established by state statute in 1931. Responsibility for the organization and administration of the plan is placed with the Board of Trustees of PERA. Changes to the plan require an actuarial assessment and legislation by the General Assembly. The state plan and other divisions’ plans are included in PERA’s financial statements which may be obtained by writing PERA at P.O. Box 5800, Denver, Colorado, 80217 or by calling PERA at 1-800-729-PERA (7372), or by visiting www.copera.org.
PERA also administers the Voluntary Investment Program that administers two defined contribution plans.
Defined benefit plan members (except state troopers) vest after five years of service and are eligible for full retirement based on their original hire date as follows:
Hired before July 1, 2005 – age 50 with 30 years of service, age 60 with 20 years of service, or age 65 with 5 years of service.
Hired between July 1, 2005 and December 31, 2006 – any age with 35 years of service, age 55 with 30 years of service, age 60 with 20 years of service, or age 65 with any years of service.
Hired between January 1, 2007 and December 31, 2010 – any age with 35 years of service, age 55 with 30 years of service, age 60 with 25 years of service, or age 65 with 5 years of service. For members with less than five years of service credit as of January 1, 2011 age and service
Colorado School of Mines Notes to Financial Statements
June 30, 2013 and 2012
44
requirements increase to those required for members hired between January 1, 2007 and December 31, 2010.
Hired between January 1, 2011 and December 31, 2016 – any age with 35 years of service, age 58 with 30 years of service, age 65 with 5 years of service.
Hired on or after January 1, 2017 – any age with 35 years of service, age 60 with 30 years of service, or age 65 with 5 years of service.
Members are also eligible for retirement benefits without a reduction for early retirement based on their original hire date as follows:
Hired before January 1, 2007 – age 55 with a minimum of 5 years of service credit and age plus years of service equals 80 or more.
Hired between January 1, 2007 and December 2010 – age 55 with a minimum of 5 years of service credit and age plus years of service equals 85 or more. Age plus years of service requirements increase to 85 for members with less than five years of service credit as of January 1, 2011.
Hired between January 1, 2011 and December 31, 2016 – age 58 and age plus years of service equals 88 or more.
Hired on or after January 1, 2017 – age 60 and age plus years of service equals 90.
Most members automatically receive the higher of the defined retirement benefit or money purchase benefit at retirement. Defined benefits are calculated as 2.5 percent times the number of years of service times the highest average salary (HAS). For retirements before January 1, 2009, HAS is calculated as one-twelfth of the average of the highest salaries on which contributions were paid, associated with three periods of 12 consecutive months of service credit and limited to a 15 percent increase between periods. For retirements after January 1, 2009, or persons hired on or after January 1, 2007, more restrictive limits are placed on salary increases between periods used in calculating HAS.
Retiree benefits are increased annually in July after one year of retirement based on the member’s original hire date as follows:
Hired before July 1, 2007 – the lesser of 2 percent or the average of the monthly Consumer Price Index increases.
Hired on or after January 1, 2007 – the lesser of 2 percent or the actual increase in the national Consumer Price Index, limited to a 10 percent reduction in a reserve established for cost of living increases related strictly to those hired on or after January 1, 2007. (The reserve is funded by 1 percentage point of salaries contributed by employers for employees hired on or after January 1, 2007.)
The upper limits on benefits increase by one-quarter percentage point each year when the funded ratio of PERA equals or exceeds 103 percent and declines by one-quarter percentage point when the funded ratio drops below 90 percent after having exceeded 103 percent. The funded ratio increase does not apply for three years when a negative return on investment occurs.
Members who are disabled, who have five or more years of service credit, six months of which has been earned since the most recent period of membership, may receive retirement benefits if determined to be permanently disabled. If a member dies before retirement, their eligible children under the age of 18 (23 if a full time student) or their spouse may be entitled to a single payment or monthly benefit payments. If there are no eligible child or spouse then financially dependent parents, beneficiaries, or the member’s estate, may be entitled to a survivor’s benefit.
Colorado School of Mines Notes to Financial Statements
June 30, 2013 and 2012
45
Funding Policy
The contribution requirements of plan members and their employers are established, and may be amended by the General Assembly. Salary subject to PERA contribution is gross earnings less any reduction in pay to offset employer contributions to the state sponsored IRC 125 plan established under Section 125 of the Internal Revenue Code.
Most employees contribute eight percent of their salary, as defined in CRS 24-51-101(42), to an individual account in the plan. Effective July 1, 2012, the temporary contribution rate increase of 2.5 percent for members in the State and Judicial Divisions to replace the 2.5 percent reduction in employer contributions effective for Fiscal Years 2010-11 and 2011-12 expired.
From July 1, 2012, to December 31 2012, the School contributed a total of 15.65 percent of the employee’s salary. From January 1, 2013, through June 30, 2013, the School contributed a total of 16.55 percent. During all of Fiscal Year 2012-13, 1.02 percent of the employees’ total salary was allocated to the Health Care Trust Fund.
Per Colorado Revised Statutes, an amortization period of 30 years is deemed actuarially sound. At December 31, 2011, the division of PERA in which the state participates has a funded ratio of 59.2 percent and a 53-year amortization period based on current contribution rates. The funded ratio on the market value of assets is slightly higher at 60.2 percent.
In the 2004 and 2010 legislative sessions, the General Assembly authorized an Amortization Equalization Disbursement (AED) to address a pension-funding shortfall. The AED requires PERA employers to pay an additional 0.5 percent of salary for calendar years 2006 and 2007, with subsequent year increases of 0.4 percent of salary through 2017, to a maximum of 5 percent (except for the Judicial Division whose AED contribution was frozen at the 2010 level).
In the 2006 and 2010 legislative sessions, the General Assembly authorized a Supplemental Amortization Equalization Disbursement (SAED) that requires PERA employers to pay additional one half percentage point of total salaries, for calendar years 2008 through 2017, to a maximum of 5 percent (except for the Judicial Division whose SAED contribution was frozen at the 2010 level). The SAED will be deducted from the amount otherwise available to increase state employees’ salaries.
At a 103 percent funding ration, both the AED and the SAED will be reduced by one-half percentage point, and for subsequent declines to below 90 percent funded both the AED and SAED will be increased by one-half percentage point. For the Judicial Division, if the funding ratio reaches 90 percent and subsequently declines, the AED and SAED will be increased by one-half percentage point.
Historically, members have been allowed to purchase service credit at reduced rates. However, legislation passed in the 2006 session required, that future agreements to purchase service credit be sufficient to fund the related actuarial liability.
The School contributions to the defined benefit program described above for the fiscal years ended June 30, 2013, 2012 and 2011 were $10,731,000, $7,731,000 and $7,136,000, respectively, equal to its required contributions for those years.
CSM Foundation Retirement Plan
The Foundation participates in a defined contribution pension plan covering substantially all of its employees. Contributions and costs are based on the number of years of service and a percentage of regular salary. Pension expense was $135,000 and $82,000 for 2013 and 2012, respectively.
Colorado School of Mines Notes to Financial Statements
June 30, 2013 and 2012
46
Note 13: Volunteer Tax-Deferred Retirement Plans (Voluntary Investment Program)
Deferred Compensation Plan
The PERA Deferred Compensation Plan (457) was established July 1, 2009, as a continuation of the state’s deferred compensation plan which was established for state and local government employees in 1981. At July 1, 2009, the state’s administrative functions for the 457 plan were transferred to PERA, where all costs of administration and funding are borne by the plan participants. In calendar year 2012, participants were allowed to make contributions of up to 100 percent of their annual gross salary (reduced by their 8 percent PERA) to a maximum of $17,000. The reduction for the 8 percent PERA contribution reflects the expiration of the temporary contribution rate increase to 10.5 percent effective in Fiscal Years 2010-11 and 2011-12. Participants who are age 50 and older and contribution the maximum amount allowable, were allowed to make an additional $5,500 contribution in 2012, for a total maximum contribution of $22,500. Contributions and earnings are tax deferred. At December 31, 2012, the plan had 17,469 participants.
Note 14: Other Postemployment Benefits and Life Insurance
Health Care Plan
The PERA Health Care Program began covering benefit recipients and qualified dependents on July 1, 1986. This benefit was developed after legislation in 1985 established the program and the Health Care Fund; the program was converted to a trust fund in 1999. The plan is a cost-sharing multiple-employer plan under which PERA subsidizes a portion of the monthly premium for health care coverage. The benefits and employer contributions are established in statute and may be amended by the General Assembly. PERA includes the Health Care Trust Fund in its Comprehensive Annual Financial Report, which may be obtained by writing PERA at P.O. Box 5800, Denver, Colorado 80217, by calling PERA at 1-800-759-PERA (7372), or by visiting http://www.copera.org.
After the PERA subsidy, the benefit recipient pays the balance of the premium through an automatic deduction from the monthly retirement benefit. Monthly premium costs for participants depend on the health care plan selected, the PERA subsidy amount, Medicare eligibility, and the number of persons covered. Effective July 1, 2000, the maximum monthly subsidy is $230 per month for benefit recipients who are under 65 years of age and who are not entitled to Medicare; and $115 per month for benefit recipients who are 65 years of age or older or who are under 65 years of age and entitled to Medicare. The maximum subsidy is based on the recipient having 20 years of service credit, and is subject to reduction by 5 percent for each year less than 20 years.
Employees are not required to contribute to the Health Care Trust Fund, which is maintained by employer’s contributions as discussed in Note 12 above. The School is required to contribute 1.02 percent of gross covered wages to the Health Care Trust Fund. The School contributed $680,000, $621,000 and $617,000 as required by statute in Fiscal Years 2012-13, 2011-12 and 2010-11, respectively. In each year the amount contributed was 100 percent of the required contribution.
The Health Care Trust Fund offers two general types of plans: fully-insured plans offered through health care organizations and self-insured plans administered for PERA by third party vendors. As of December 31, 2012, there were 51,666 enrolled participants, including spouses and dependents, from all contributors to the plan. At December 31, 2012, the Health Care Trust Fund had an unfunded actuarial accrued liability of $1.43 billion, a funded ratio of 16.5 percent, and a 66-year amortization period.
Colorado School of Mines Notes to Financial Statements
June 30, 2013 and 2012
47
Colorado Higher Education Insurance Benefits Alliance Trust (CHEIBA)
Retired faculty and exempt-administrative staff are eligible to participate in the Colorado Higher Education Insurance Benefits Alliance Trust (CHEIBA). CHEIBA is a cost-sharing multiple-employer insurance purchasing pool, which allows for postemployment health coverage until the retiree is eligible for Medicare. As of June 30, 2013, there were 17 participants in post-retirement coverage from the nine member higher education institutions. For Fiscal Year 2013, the School had five retired faculty administrative participants under CHEIBA.
CHEIBA financial statements are prepared under accounting principles generally accepted in the United states using the accrual basis of accounting following governmental accounting standards for a business-type activity. The financial statements can be obtained by contacting Marshall Parks, Treasurer, CHEIBA Trust. Contributions are recognized in the period due. Benefits and refunds are recognized and paid when due according to the participating plans. The fair value of the Trust’s investments is based on quoted market prices from national securities exchanges.
There are no long-term contracts for contributions to the plan. Participating schools can withdraw their participation in the plan with at least one year’s notice to the CHEIBA board.
Note 15: Discretely Presented Component Unit
Colorado School of Mines Foundation
Distributions made by the Foundation to the School during the years ended June 30, 2013 and 2012 were approximately $16,522,000 and $16,527,000, respectively. These amounts have been recorded as contributions from the Foundation and as capital grants and gifts and Component Unit operating expenses in the accompanying financial statements. As of June 30, 2013 and 2012, the School has recorded an accounts receivable from the Foundation of $2,376,000 and $1,363,000, respectively. As of June 30, 2013 and 2012, the School has recorded a payable to the Foundation of $2,001,000 and $1,937,000, respectively.
The School is the ultimate beneficiary of substantially all restricted and trust funds held by the Foundation and is the income beneficiary of the majority of endowment funds held by the Foundation. The Foundation also manages a portion of the School’s endowments. The School has endowments and other assets held by the Foundation approximating $18,901,000 and $14,192,000 as of June 30, 2013 and 2012, respectively. The Foundation retains an investment management fee equal to 2 percent.
Note 16: Commitments and Contingencies
Commitments
Contracts have been entered into for the purpose of planning, acquiring, constructing and equipping certain building additions and other projects, with outstanding amounts totaling approximately $9,896,000 as of June 30, 2013. These commitments will be funded or financed by donor contributions, state appropriations, existing revenue bonds, and other campus resources.
Colorado School of Mines Notes to Financial Statements
June 30, 2013 and 2012
48
Claims and Litigation
In November 1992, the School and numerous other potentially responsible parties (PRP’s) were notified by the United States Environmental Protection Agency (EPA) of potential liability pursuant to the Comprehensive Environmental Response, Compensation and Liability Act of 1980, as amended (CERCLA). Such potential liability results from costs associated with the investigation and cleanup of hazardous substances at a site owned by the School and leased to CSMRI, which performed mining research for a variety of private and governmental entities. Negotiations with the EPA, the enforcement agency related to past costs, have been resolved. The Colorado Department of Public Health and Environment (CDPHE) and EPA have reserved their rights as to future costs of investigation and cleanup. In 2010, the School executed a contract to further assess and characterize the site in relation to ground water monitoring results. A liability of $1.8 million was recorded at June 30, 2010, to implement the plan. Work began in late 2010. As of June 30, 2013, the liability was $30,000 and relates to completion of a final report. The School is currently negotiating with PRP’s regarding the cost of the remediation work. It is unknown at this time how much, if any, the School will be able to recover from other potential responsible parties. In relation to the site above, CSMRI held Radioactive Materials License (RML) Number 617-01 that authorized its possession of soil contaminated with radioactive material. CSMRI applied on June 6, 2012 to terminate RML #617-01 and that termination was granted December 19, 2012. In addition, on July 26, 2012, the CDPHE issued to the School RML #1206-01 for the lower terrace portion of the site granting the School the right to possess groundwater containing uranium. The School placed an environmental covenant restricting use of the groundwater on the remaining upper terrace area previously covered by RMS #617-01. Current administrative controls at the site include the environmental covenant restricting use of groundwater on the upper terrace area and RML #1206-01 which covers the lower terrace area. The School prepared a draft comprehensive groundwater report for the site that was submitted to the CDPHE in conjunction with a request for termination of RML #1206-01. The draft report demonstrates that remaining levels of uranium in groundwater are due to ambient soil conditions and no additional remediation is recommended. The draft report is under review by CDPHE and termination of RML #1206-01 is anticipated. In December 2012, CSMRI changed its name to Table Mountain Research Center (TMRC). With the termination of RML #617-01 in December 2012, TMRC has no continuing lease or management responsibilities for the site. In the normal course of its operations, the School is involved in various litigation matters. Management believes that any future liability that it may incur as a result of these matters, including the EPA matter discussed above, will not have a material effect on the School’s financial statements.
Colorado School of Mines Notes to Financial Statements
June 30, 2013 and 2012
49
Government Grants
The School is currently participating in numerous grants from various departments and agencies of the federal and state governments. The expenditures of grant proceeds must be for allowable and eligible purposes. Single audits and audits by the granting department or agency may result in requests for reimbursement of unused grant proceeds or disallowed expenditures. Upon notification of final approval by the granting department or agency, the grants are considered closed. Management believes that any future liability that it may incur as a result of audits by the granting department or agency will not have a material effect on the School’s financial statements.
Future Accounting Standards
The Governmental Accounting Standards Board (GASB) issued Statement No. 68 Accounting and Financial Reporting for Pensions (Statement No. 68), which revises and establishes new financial reporting requirements for most governments that provide their employees with pension benefits. The School provides its employees with pension benefits through the state’s multiple-employer cost-sharing PERA defined benefit retirement program. Statement No. 68 requires cost-sharing employers participating in the PERA program, such as the School, to record their proportionate share, as defined in Statement No. 68, of PERA’s unfunded pension liability. The School has no legal obligation to fund this shortfall nor does it have any ability to affect funding, benefit, or annual required contribution decisions made by PERA. The requirement of Statement No. 68 to record a portion of PERA’s unfunded liability will negatively impact the School’s future unrestricted net position. Statement No. 68 is effective for Fiscal Year 2015. At this time, management is unable to estimate the magnitude of this impact. Information regarding PERA’s current funding status can be found in their Comprehensive Annual Financial Report.
Note 17: Risk Management
The School is subject to risks of loss from liability for accident, property damage and personal injury. These risks are managed by the State Division of Risk Management, an agency formed by statute and funded by the Long Appropriations Bill. Therefore, the School is not required to purchase insurance for such risk of loss. Commercial insurance coverage is purchased for employee health benefits. There has been no reduction in coverage nor have any settlements exceeded coverage in any of the three preceding years. The School does not retain risk of loss except for damage incurred to property belonging to the state, limited to a $1,000 deductible per incident.
The State Division of Risk Management is deemed to be a public entity risk pool; therefore, under the Governmental Immunity Act, the School is protected from suit by the Doctrine of Sovereign Immunity except under certain circumstances in which immunity is waived.
Colorado School of Mines Notes to Financial Statements
June 30, 2013 and 2012
50
Note 18: Legislative Appropriations
The Colorado State Legislature establishes spending authority to the School in its annual Long Appropriations Bill. The Long Appropriations Bill appropriated funds include an amount from the State of Colorado’s College Opportunity Fund.
For the years ended June 30, 2013 and 2012, appropriated expenses were within the authorized spending authority. For the years ended June 30, 2013 and 2012, the School had a total appropriation of $16,084,000 and $16,254,000, respectively. For years ended June 30, 2013 and 2012, the School’s appropriated funds consisted of $5,146,000 and $5,066,000, respectively, received from students that qualified for stipends from the College Opportunity Fund, $10,938,000 and $11,188,000, respectively, as fee-for-service contract revenue. All other revenues and expenses reported by the School represent nonappropriated funds and are excluded from the annual appropriations bill. Nonappropriated funds include tuition and fees, grants and contracts, gifts, indirect cost recoveries, auxiliary revenues and other revenue sources.