COLORADO RIVER Sf ORAGE PROJECT - usbr.gov and along the spillway training walls, Figure 10. ......
33
Transcript of COLORADO RIVER Sf ORAGE PROJECT - usbr.gov and along the spillway training walls, Figure 10. ......


Hydraulic Model Studiesof Crystal Dam Spillway and Outlet Works, Colorado River Storage Project
I 7. AUTHORIS) 8. PERFORMING ORGANIZATION
REPORT NO.
P. H. Burgi and S. Fujimoto REC-ERC-73-22
9. PERFORMING ORGANIZAT ION N A M E AND ADDRESS 10 WORK UNIT NO.
Engineering and Kesearch Center 11. CONTRACT OR SRANT NO.
Bureau of Reclamatior: Denver, Colorado 80225
13. TYPE O F REPORT AND PERIOD COVERED
2. SPONSORING AGENCY NAME AND ADDRESS
same 14. SPONSORING AGENCY CODE
i' -- I
5. SUPPLEMENTARY NOTES
6. ABSTRACT
Hydraulic model studies were made to determine the flow characterinicsof the Crystal Dam spillway, plunge pool, and outlet works. The initial flip bucket spillway was tested, and the bucketexit modified by extending the 15-foot (4.57-meter) radius beyond the bucket invert to a 4 1 tangent at the bucket IIp. The modified bucket was required to adequately flip the spillway jet into the plunge pool. A 15-foot (4.57-meter! high deflector wall was placed at thedownstream end of the excavated rock pl~~nge pool to deflect the high energy spillway jet from the 3 to 1 riprapped slope leading to the downstream river channel. A vortex appearing in the preliminary horizontal bellmouth transition design from the intake towers to the 54-inch (1,371-mm) outlet works conduits was eliminated by raising the floor of the intake tower closer to the invert of the bellmouth. This design was later improved by using one intake tower for both outlet conduits placed at the same elevation. Discharge coefficients are given for both the spillway and the submerged 48-inch (1,219-rim) jet-flow gates.
-,
-.
17. KEY WORDS A N D DOCUMENT ANALYSIS
0 . DESCRIPTORS--/ hydraulic models/ vortices/ hydraulics/ cavitation/ p i e d 'outlet work;/ plunge basins riprap/ flip buckets1 'spillways/ bellrnouths/ dircharge coefficients/ head losses/ *model studied submerge1 flow/ submerged orifices
b . IDENTIFIERS--/ *jet-flow gates; Crystal Dam, CO
. ~
c. COSATI Field/Group 13M 18. DISTRIBUTION STATEMENT 19. SECURITY C L A S S . 21. NO. OF PAC
ITHIS REPORT) Avol loble from the Nation01 Technical lnform.otion Se:vice. Operations UNCLASSIFIED 24 Divis ion. Springfield. Virginia 22151. 20. SECURITY CLASS 2 2 . PRICE
. ITHIS PACE1 ! UNCLASSIFIED I

OF CRYSTAL DAM SPILLWAY . -
AND OUTLET-FORKS COLORADO RIVER S f ORAGE PROJECT
by P.H. Burgi
i
S. Fujimoto
December 1973
Hydraulics Branch Division of General Research Engineerin and Research Center \\ 7 Denver, Co orado
UNITED STATES DEPARTMENT OF THE INTERIOR * BUREAU OF RECLAMATION
. . ~ . . . , .. . . , . ..
Section, and reviewed by W. E. Wagner, Chief, Hydraulia Branch. The authors acknowledge the cooperation of the Hydraulic Strucures Branch, Division of Design, in developing recommendations presented herein. The mntribution of the Division of General Research shops in their accurate and rapid construction of the models i s also acknowledged. Photography was by W. M. Batts, General Services Branch.
.

. . . . . . . . . . . . . . . . . . . . . . . . . . . . . . . Results 1 Application . . . . . . . . . . . . . . . . . . . . . . . . . . . . . :s 1
. . . . . . . . . . . . . . . . . . . . . . . Introduction . . . . ; 1 . . . . . . . . . . . . . . . . . . . . . . . . . . Model Investigations 1
. . . . . . . . . . . . . . . . . . . The Spillway and Plunge Pool Model 1 . . . . . . . . . . . . . . . . . . . . . . . . . . Spillway'Studies 3
The spillway profile . . . . . . . : . . . . . . . . . . . . . . . . " 3 . . . . . . . . . . . . Reservoir approach conditions . . . . . . . 1 3 . . . . . . . . . . . . . . . . . . . . . . . . . Piernose design 4 a
. . . . . . . . . . . . . . . . . . . . . . . Flip~bucket l ! . . . . . . :.a
4 ' I ....
. . . . . . . . . . . . . . . . . . . . . . . . . Plunge Pool Studies 8
. . . . . . . . . . . . . . . . . . Initial and recommended designs '? 8 . . . . . . . . . . . . . . . . . . . . . . . . . . Impact pressures 12
. . . . . . . . . . . . . . . . . . . . . . . . . . . Outlet Works 12
The 1.13.60 model (preliminary design) . . . . . . . . . . . . . . . . . 14 . . . . . . . . . . . . . . . . The 1.19.85 model (recommended design) 14
. . . . . . . . . . . . . . . . . . . . . . . . . Vortex formation 14 . . . . . . . . . . . . . . . . . . . . Conduit bellmouth entrances 17
Bellmouth Head Loss Coefficients for Preliminary and Recommended . . . . . . . . . . . . . . . . . . . . . . . . . . . Intake Towers 17
. . . . . . . . . . . . . . . . . . . . Preliminary intake tower design 17 . . . . . . . . . . . . . . . . . . Recommended intake tower design 19 .... .. .... Cavitation of the jet-flow gate . . . . . . . . . . . . . . . . . . . . 20
. . . . . . . . . . . . . . Effect of submergence upon energy dissipation 21 . . . . . . . . . . . . . . . . . . . Jet-flow gate discharge coefficient 23
LIST OF FIGURES
Figure
Crystal Dam features . . . . . . . . . . . . . . . 1 to 36-scale spillway model
Model construction . . . . . . . . . . Spillway discharge versus head on spillway crest Water manometer pressures on spillway surface Depth of spillway jet . . . . . . . . . Initial reservoir approach . . . . . . . .
. . . . . . Improved reservoir approach Progressive pier designs . . . . . . . . Spillway pier design . . . . . . . . . . The spillway jet . . . . . . . . . . . Plunge pool designs . . . . . . . . . .

Figure
13 14 15 16 17 18 19 20 21 22 23 24
25 26 27 28 29 30
CONTENTS-Continued
Page
Improved water surface with modified plunge pool (Figure 128) . . . . . . 10 3 to 1 riprap slope (I-yard riprap) . . . . . . . . . . . . 3 to 1 riprap s lo~e with 15foot deflector wall!l/4-yard riprap) . Model ~ i u n ~ e ~ d o l piezometer locations . . . . . . . . . . . . . . 12 Plunge pool floor impact pressures . . . . . . . . . . . . . . . . 13
. . . . . . . . . . . . . Plunge pool floor impact pressure cell tram 14 Intake tower designs . . . . . . . . . . . . . . . . . . . . . 15 Outlet works model layout (preliminary design) . . . . . . . . . . . . 16 Vortex in horizontal outlet conduit . . . . . . . . . . . . Bellmouth~rofilesand~ressuredistributions . ! . . . . . . . ~ x t r a ~ o l a t i d model data (intake towers) . . . . . . . . . . . . . . 18 Typical cavitation cloud hwnstream from a submerged jet-flow
gate (gate 75 percent open) . . . . . . . . . . . . . . . . . . 2 i ode1 iet-flow qate . . . . . . . . . . . . . . . . . . . . . . 21 M . . . . . . . . . . . . Plunge pool pier configurations for outlet works '22
. . . . . . . . Jet-flow gate submergence (gates discharging 875 6 s eacn) 22 .. Discharge coefficient r': . .
. . . . . . . . . . . . . . Gate loss coefficient versus qate opening 23 . . . . . . . . . . . . . . . . ~t iet-tlow oate z3

This investigation verifies the hydraul~c design of the Crystal Dam spillway plunge pool, and outlet works. The coefficient of discharge of the outlet works was determined for the spillway and for the submerged jet-flow gates.
RESULTS
1. The recommended spillwa;, with a 15-foot (4.57-meter) radius bucket extended beyond the bucket invert to a 4:l tangent at the bucket lip, operates satisfactorily for all discharges. The 4 to 1 slope on the soillway bucket lip i s required to adequdtely flip the spillway jet into the plunge pool.
2. Because of the proximity of the spillway to the upstream right abutment, flow over the right side of the spillway is somewhat rough for discharges greater than 30.000 cfs (850 meter3/sec). The recommended design shows a considerable improve- ment over the initial design, Figures 7 and 8.~ 1 3. The eliptical pier developed during the model study provides excellent flow conditions around the pier and along the spillway training walls, Figure 10.
4. To protect the 3 to 1 ri,~rap slope at the downstream end of the plunge pool, a 15-foot (4.57-meter) high deflactor wall with a 1:4 batter i s needed on the floor of the plunge pool, Figure 16. The riprap slope should start 2 feet (0.61-meter) below the top of the wall.
5. A spillway discharge of 42,350 cfs (1,171 meters3/sec) i s attained at the design head of 16 feet (4.88 metersl, Figure 4.
6. At design discharge the spillway jet impinges on the plunge pool floor approximately 278 feet (84.73 meters) from the axis of the dam.
7. The preliminary location of the bellmouth transi- tion from the vertical intake tower to the outlet mnduit resulted in a violent vortex in the bellmouth entrance, Figure 21. This vortex was eliminated by '
raising the floor of the intake tower closer to the bellmouth invert, Figure 19.
8. The recommended single-intake tower system Operates satisfactorily.
9. A minimum submergence of 13 feet (3.96 meters) at 60 percent gate opening i s required to
tion for the submerged jet to prevent extreme water surface disturbance in the plunge pool.
APPLICATION
In general, results of this iyestigation apply to the structure studied. However, designs were developed which may be applicable to similar structures.
INTRODUCTION
Crystal Dam, Figure 1, i s on the Gunnison River 6 miles (9.65 km) downstream from Morrow Point Dam and 14 miles (22.53 km) east of Montrose, Cob. Construction of Crystal Dam will complete the Cure- canti Unit of the Colorado River Storage Project.
The dam =~rl-rec~rk!::Z%l serve in a regulating capacity for Morrow Point :and Blue Mesa Dams, ~ '-
releasing a relatively constant discharge downstream. The 164.1-foot (50.02-meter) long flip-bucket spillway will have a design capacity of 41,350 cfs (1,171;y meters3/sec). Tflo 48.inch (1.219-mm) jet-flow gates will control river releases through the outlet works. The powerplant will have one 28,000kilowatt generating unit.
MODEL INVESTIGATIONS
The Spillway and Plunge Pool Model
The spillway model, constructed to a scale of 1:36. included 400 feet (122 meters) of the upstream reservoir, the concrete arch dam, and 800 feet 1244 meters) of the downstream river channel. Figure 2. The flip-bucket spillway was constructed of high-density (6 Ib/cu foot) polyurethane and milled and sanded to the desired profile, Figure 3A. Twenty piezometers were installed in the model spillway along two radial lines to measure pressures on the spillway flow surface. The canyon topography was constructed in the model from 25-foot (7.62-meter) interval field contours. The scaled contours were cut from wood, placed in the model. and covered with metal lath. The lath was covered with approximately 314 inch (19 mm) of cement mortar, ,; Figure 38. Three pipes representing the penstock and two intake towers for the outlet works were connected between the reservoir head box and the powerplant in the tailbox. A tailgate assembly and sand trap were used to control the downstream tailwater elevation and mllect eroded pea gravel. Water was supplied to the
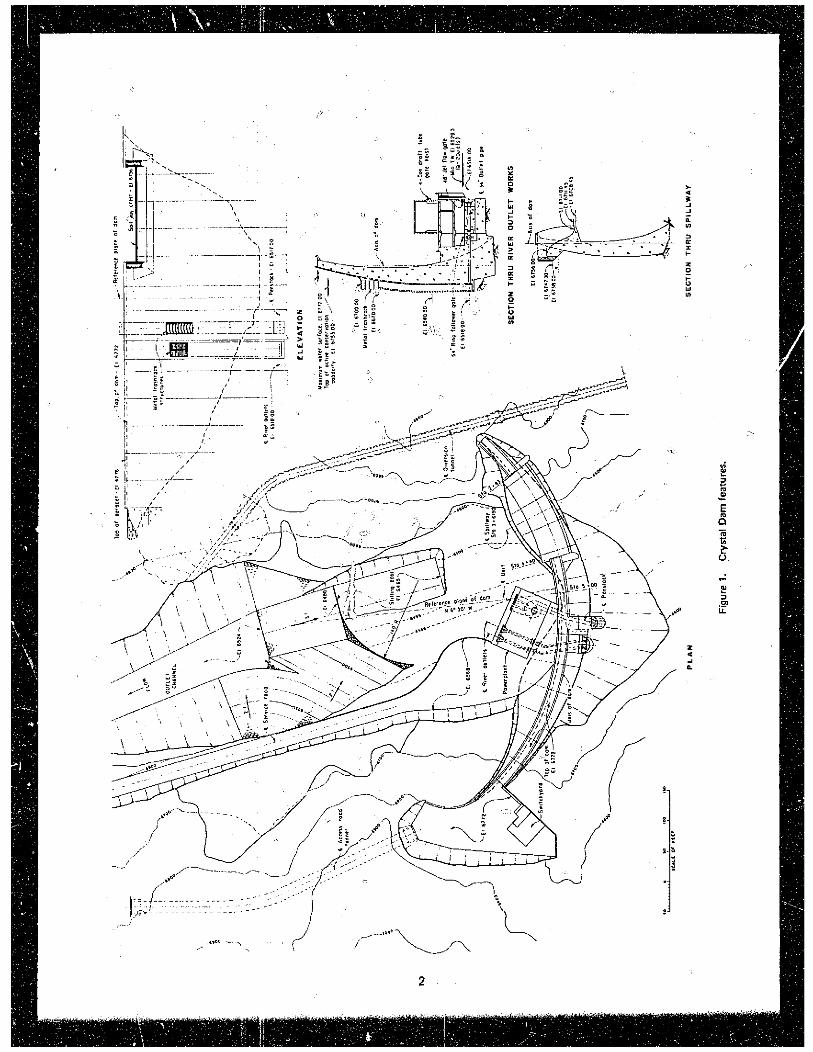
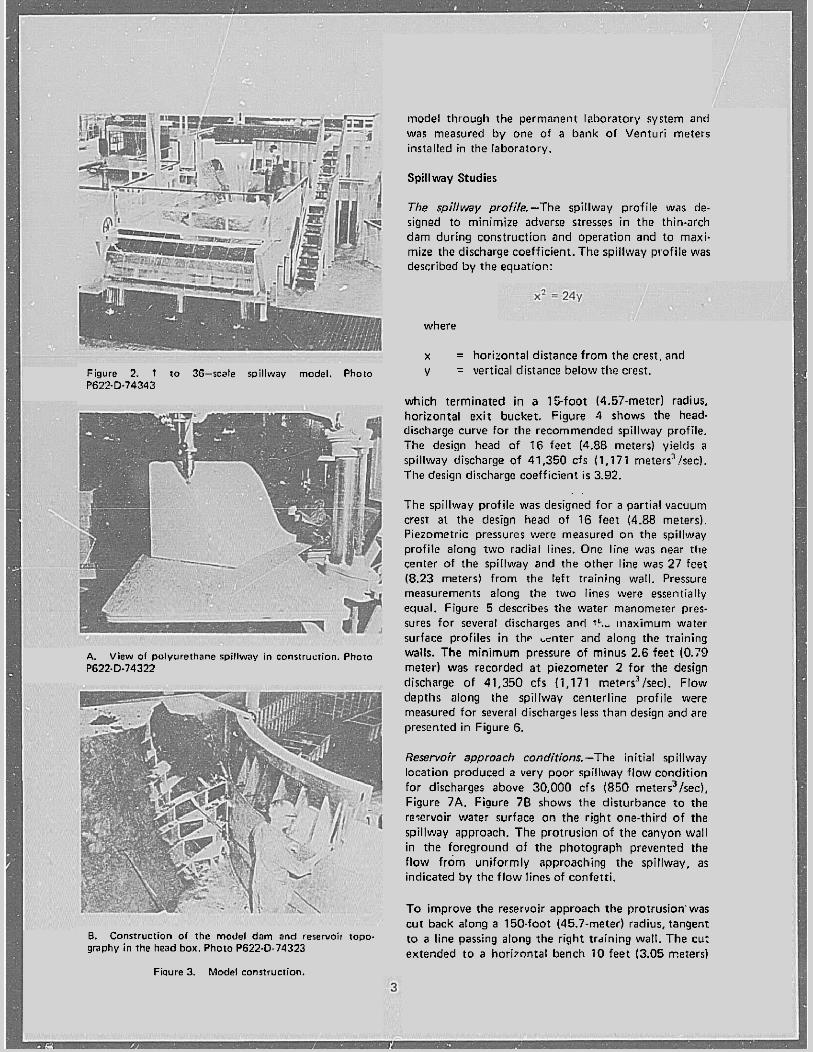
Figure 2. 1 ro 36-scale r~illway model. Photo P622.D-74343
A. View of polyurethane spillway in canrtrucfion. Photo P622-D-74322
8. Construction of the model dam and reservoir topo. graphy in the head box. Photo P622-0.74323
Fisure 3. Model construction.
model through the permanent laboratory system and was measured by one of a bank of Venturi meters installed in the laboratory.
Spillway Studies
The spillway profile.-The spillway profile was de- signed to minimize adverse stresses i n the thin-arch dam during construction and operation and to maxi. mize the discharge coefficient. The spillway profile was described by the equation:
where
x = horizontal distance from the crest, and y = vertical distance below the crest.
which terminated i n a lCrfoot (4.57-meter) radius, horizontal exit bucket. Figure ? shows the head- discharge curve for the recommended spillway profile. The design head of 16 feet (4.88 mcters) yields a spillway discharge of 41,350 cfs (1,171 meters3!secl. The design discharge coefficient i s 3.92.
. .
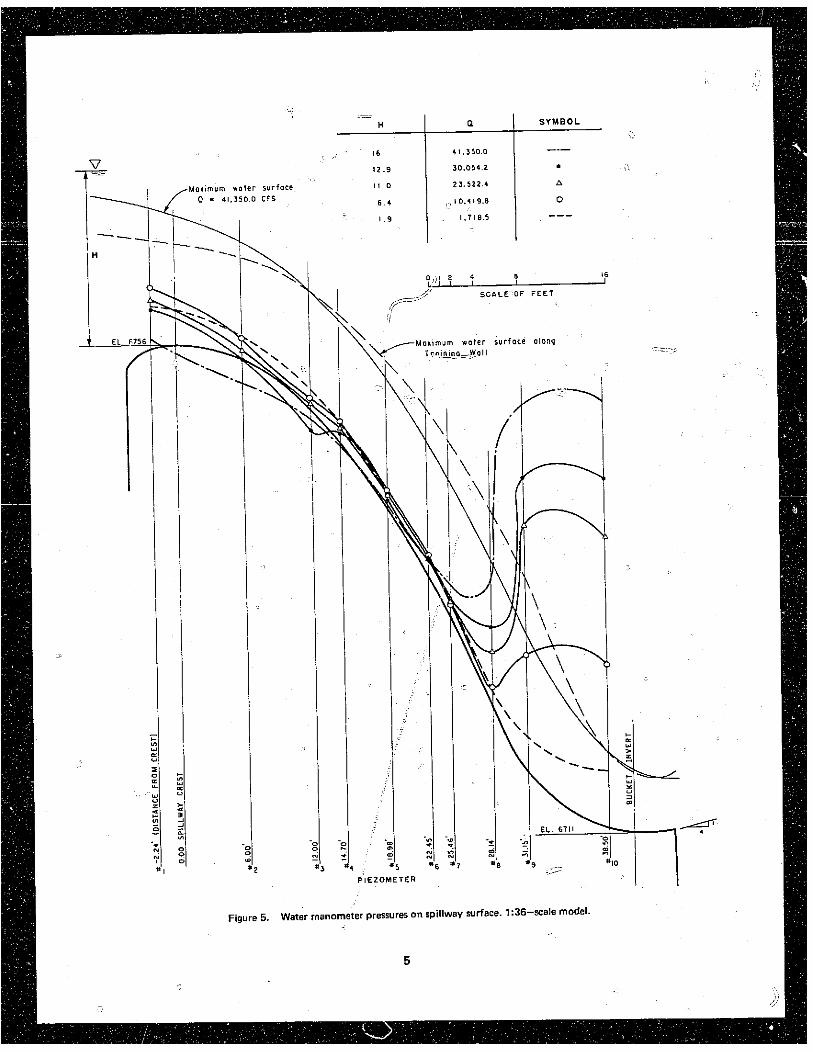
The spillway profile was designed for a partial vacuum crest at the design head of 16 feet (4.88 meters). Piezometric pressures were measured on the spillway profile along two radial lines. One line was near the center of the spillway and the other line was 27 feet (8.23 meters1 from the left training wall. Pressure measurements along the two lines were essentially equal. Figure 5 describes the water manometer pres- sures for several discharges and 75- ~naximum water surface profiles in t h ~ enter and along the training walls. The minimum pressure of minus 2.6 feet (0.79 meter) was recorded at piezometer 2 for the design discharge of 41.350 cfs (1.171 meters3 lsecl. Flow depths along the spillway centerline profile were measured for several discharges less than design and are presented in Figure 6.
Reservoir approach conditions.-The initial spillway location produced a very poor spillway flow condition for discharges above 30.000 cfs (850 meters3/sec). Figure 7A. Figure 78 shows the disturbance t o the reqervoir water surface on the right one-third o f the spillway approach. The protrusion of the canyon wall in the foreground of the photograph prevented the flow from uniformly approaching the spillway, as indicated by the f low lines of confetti.
To improve the reservoir approach the protrusion'was cut back along a 150-foot (45.7-meter) radius, tangent to a line passing along the right trdining wall. The cu: extended t o a horizontal bench 10 feet (3.05 meters)
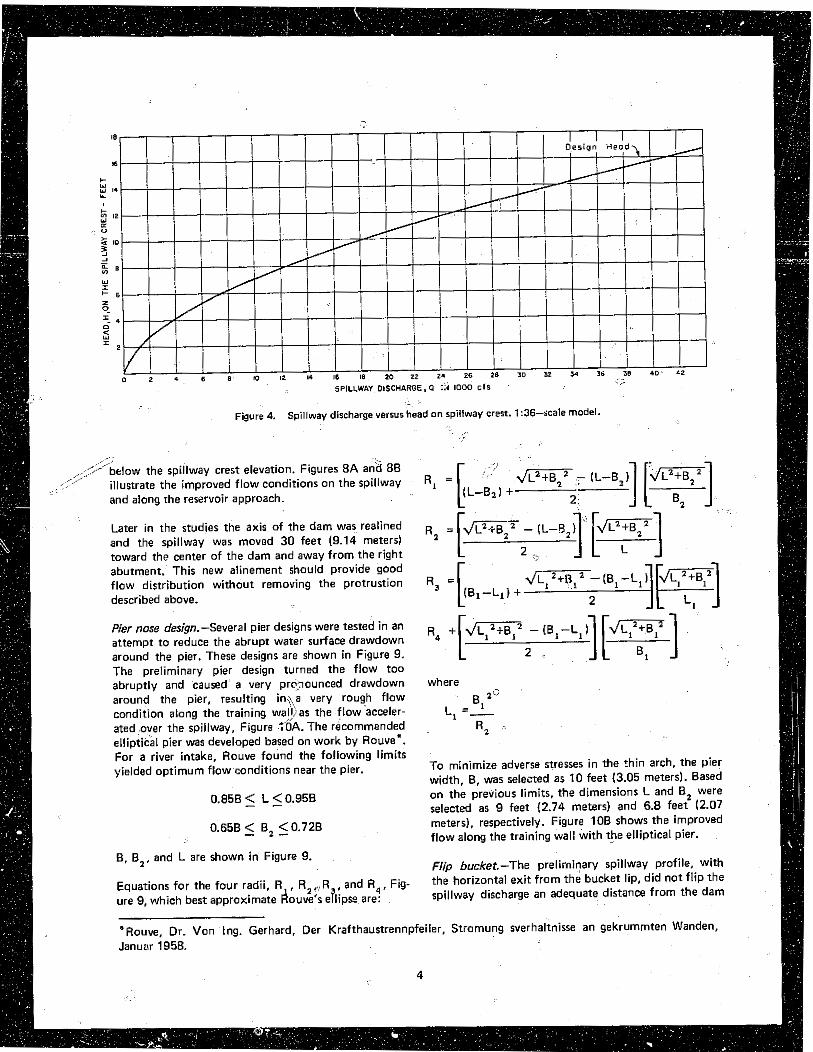
Figure 4. Sp~llway dlrcharge versus head on spillway crest. 1.36-acale model.
,. ,;./ below the spillway crest elevation. Figures 8A an2 88
' ,
, . illustrate the improved o w conditions on the spillway RI = [ . . .. , and along rhe reservoir approach. (L-Bzl +
2:
Later in the studies the axis of the dam was realined and the spillway was moved 30 feet (9.14 meters) toward the center of the dam and away from the right abutment. This new alinement should provide good flow distribution without removing the protrustion described above.
Pier nose design.-Several pier designs were tested in an attempt to reduce the abrupt water surface drawdown around the pier. These designs are shown in Figure 9. The preliminary pier design turned the flow too abruptly and caused a very prc.~ounced drawdown around the pier, resulting in*\a very rough flow condition along the training wal$as the flowacceler- ated oyer the spillway, Figure ;CIA. The recommended elliptical pier was developed based on work by Rouve". For a river intake, Rouve found the following limits yielded optimum flow conditions near the pier.
where
8, Z d L =-
1
R 2
To minimize adverse stresses in the thin arch, the pier width, 8, was selected as 10 fee t (3.05 meters). Based on the previous limits, the dimensions L and B, were selected as 9 feet (2.74 meters) and 6.8 feet (2.07 meters), respectively. Figure 100 shows the improved flow along the training wall with the elliptical pier.
B, 0,. and L are shown in Figure 9. Flip bucket.-The preliminary spillway profile, with
Equations for the four radii. R , R,, R ,and R,, Fig- the horizontal exit from the bucket lip, did not flip the
ure 9, which best approximate douve's eflipre are: spillway discharge an adequate distance from the dam
"Rouve, Dr. Von Ing. Gerhard. Der Krafthaustrennpfeiler. Stromung sverhaltnisse an gekrummten Wanden, Januar 1958.
4
- - H Q SYMBOL
I I
Water rnanomCtei pressures on spillwey surface. 1 :36-xale model. Figure 5.


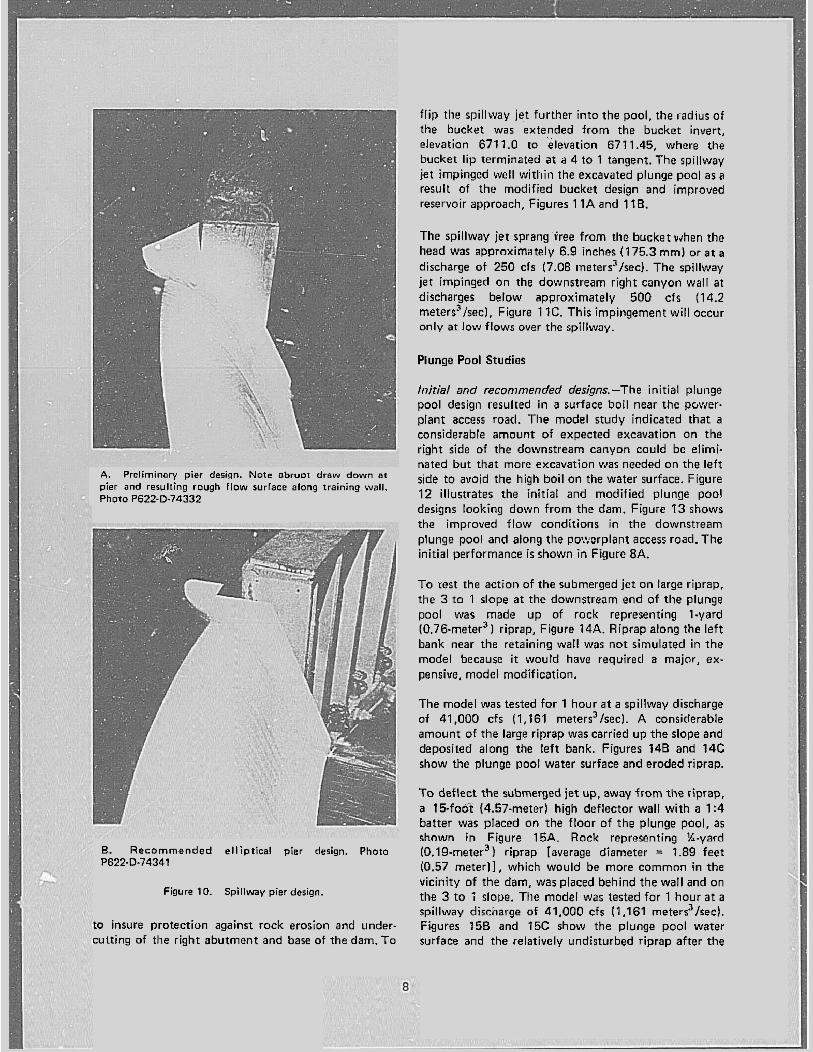
A. Prelimhaw ~ i e r desim. Note obruot draw down a t . . pier and resulting rough flow surface along training wall. Photo P622-1374332
B. Recommended elliptical pier design. Photo P622-D-74341
Figure 10. Spillway pier design.
to insure protection against rock erosion and under- cutting of the right abutment and base of the dam. To
flip the spillway jet further into the pool, the radius of the bucket was extended from the bucket invert, elevation 671 1.0 to 'elevation 671 1.45. where the bucket lip terminated at a 4 to 1 tangent. The spillway jet impinged well within the excavated plunge pool as a result of the modified bucket design and improved reservoir approach, Figures 11A and 11B.
The spillway jet sprang iree from the bucket when the head was approximately 6.9 inches (175.3 mm) orat a
discharge of 250 cfs (7.08 meters"sec). The spillway jet impinged on the downstream right canyon wall at discharges below approximately 500 cfs (14.2 meters3/sec). Figure 11C. This impingement will occur only at low flows over the spillway.
Plunge Pool Studies
Initial and recommended designs.-The initial plunge pool design resulted in a surface boil near the pcwer- plant access road. The model study indicated that a considerable amount of expected excavation on the right side of the downstream canyon could be elimi- nated but that more excavation was needed on the left side to avoid the high boil on the water surface. Figure 12 illustrates the initial and modified plunge pool designs looking down from the dam. Figure 13 shows the improved flow conditions in the downstream plunge pool and along the pozcrplant access road. The initial performance i s shown in Figure 8A.
To lest the action of the submerged jet on large riprap. the 3 to 1 slope at the downstream end of the plunge pool was made up of rock representing 1-yard (0.76-meter3 ) riprap. Figure 14A. Riprap along the left bank near the retaining wall was not simulated in the model because it would have required a major, ex- pensive, model modification.
The model was tested for 1 hour a t a spillway discharge of 41.000 cfs (1,161 meters3/sec). A considerable amount of the large riprap was carried up the slope and deposited along the left bank. Figures 148 and 14C show the plunge pool water surface and eroded riprap.
To deflect the submerged j e t up, away from the riprap. a 1Bfoot (4.57-meter) high deflector wall with a 1:4 batter was placed on the floor of the plunge pool, as shown in Figure 15A. Rock representing %-yard (0.19-meter" riprap [average diameter = 1.89 feet (0.57 meter)], which would be more commnn in the vicinity of the dam, was placed behind the wall and on the 3 to i sloDe. The model was tested for 1 hour at a spillway discharge of 41,000 cfr (1.161 meters3/sec). Figures 158 and 15C show the plunge pool water surface and the relatively undisturbed riprap after the
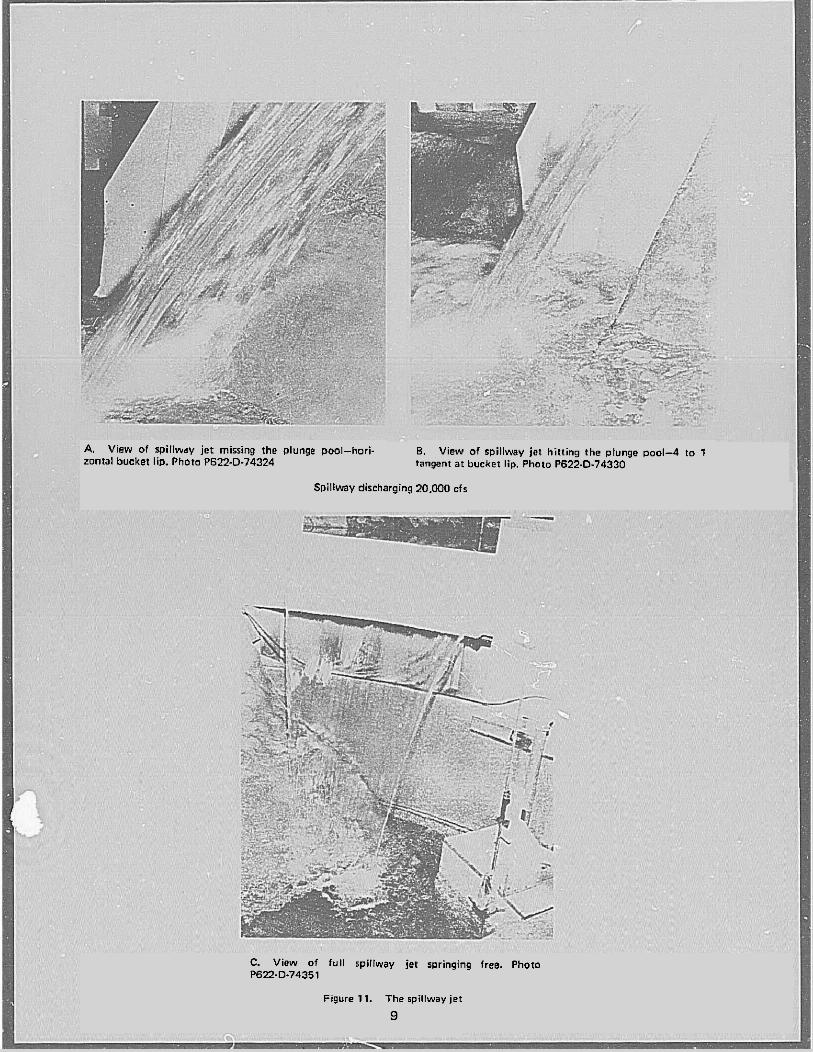
A. View of spillwdy jet missing the Plunge pool-hori- zontal bucket lip. Photo P622-D-74324
B. View of spillway jet hitting the plunge pool-4 to 1 tangent at bucket lip. Photo P622-0-74330
Spillway discharging 20.030 cfr
C. View of full spillway jet springing free. Photo P622-0.74351
Figure 11. The spillway jet
9

A. View from the dam looking toward the downstream end 0. View from the dam looking toward the downstream end of the plunge pad. Init ial design. Note excaviltion of riqht of the plunge pool. Modified design. Note the decreased canyon wall. Photo P622-13.74333 excavation on the right side and modified left bank
alincment.Photo P622.D-74335
Figure 12. Plunge pool designs.
Spillway discharging 41,350 cfs. Photo P622-0.74334
Figure 13. Improved wzter surface with modified Olunge pool (Figure 1281.

A. View of 3 t o 1 slope before the test. The rock A. View of 3 to 1 slope and 15foot deflector wall b f o re represents l-yard riprap. Photo P622-D-24336 the test. The rock represents 114-yard riprap. Photo
P622.D.74339
I
Access Road Fg!?;: ,, . . . .-, ......
:: i.":" ,<><?~'' :
.+. , .,,,~* ,.<.
. 9 : . ., ~ ~
I ? ~ , , . t> . .;':, .. . .,, ... ,:7~:,.:>;...' ~' . . , ' 5 . ,,,. . ,:.,~, ..' ~. . . . I ' - 0-, . , . . . , , . .... ; , ....... r n- . .<
., ., . .... ... P~ . : .,-, --@<. . ... , ,.?.<kS . -' -~-,%:, :, ''.:<.7: .,,:+ ; ~, ., , ,.?,: ,:, _-: . . ... >;.% ... '-;*.3.:!L :!.r,.. .. .
",;',..:', ~ : . 2 ,,; :"? ..-,* ; - ' ' . ' >?
... .. ./: ' '. . ,. ~ . ' . . : 'J?' .. . . . . . * *Li,, +tz&mdr'5&&&&g2 0. Spillwdy discharging 41.000 cfs. Photo P622-D-74340
B. Spillwav discharging 41.000 cfs. Photo P622-D-74337
C. View of 3 t o 1 slope after the test showing very little C. View of the 3 to 1 slope after the test. Note how some movement of the riprap material. Photo P622-D.74342 riprap has been moved to the top of the slope. Photo P622-D-74338
Figure 15. 3 to 1 riprap slope with l 5 f o n t deflector wall Figure 14. 3 to 1 riprapslope (I-yard riprapl. (114-yard riprap).
11

1-hour test. The high boil near the powerplant access road in Figure B is due to the steep concrete slope in the model represented by the dark concrete in Figure 15A.
The recommended design for the side slope behind the deflector wall ranges from 3 to 1 to 2 to 1, as shown in Figure 1. The access road will be located some 60 feet (18.3 meters) further from the plunge pool and 5 feet (1.5 meters) higher than the design tested, Figure 15. Although this configuration was not tested because of insufficient space in the model, the increased size of the plunge pool should be more than adequate to contain the energy of the spillway jet.
For small spillway discharges there i s a tendency for rock to be pulled over the deflector wall into the plunge pool. Therefore, i t is recommended that the riprap slope start 2 fee t (0.6 meter) below the top of the deflector wall.
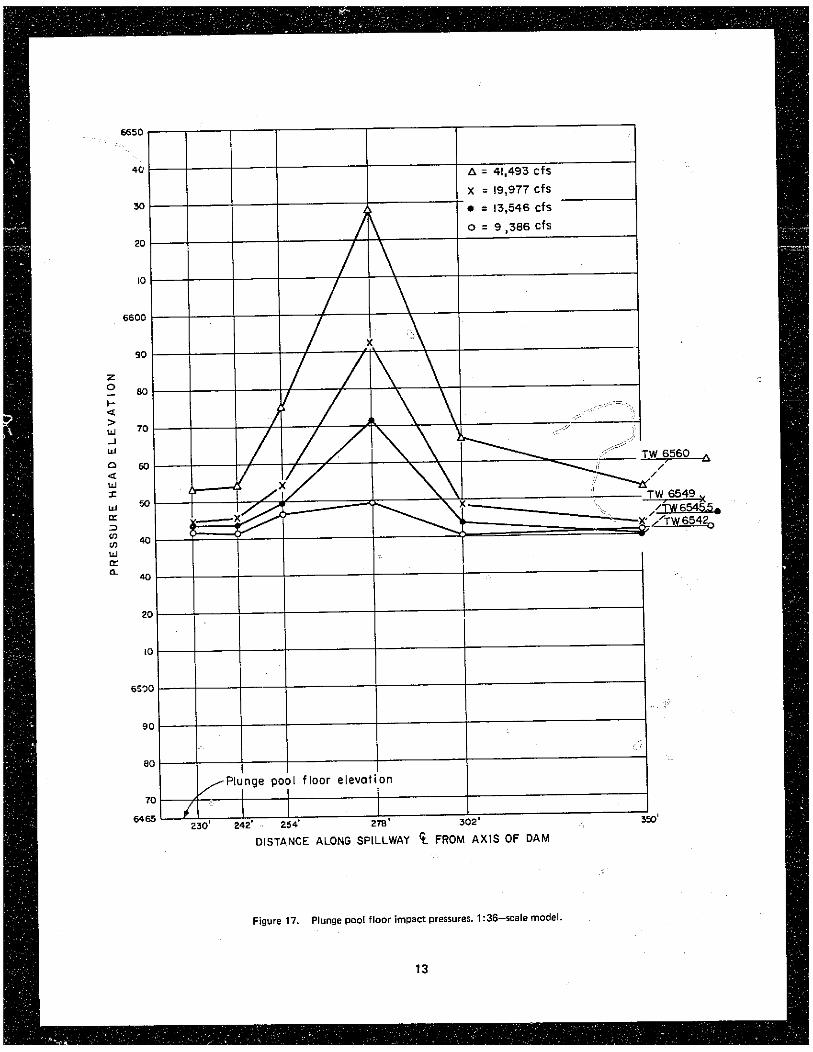
lmpacr pressures.-To measure the impact pressures on the floor of the plunge pool, a grid of 16 piezometers was placed in an area 48 feet (14.6 meters) wide by 144 feet (43.9 meters) long, as shown in Figure 16. Maximum pressures (water manometer) were recorded for several discharges and corresponding tailwaters. The equipressure (equielevation) lines in Figure 16 indicate plunge pool floor pressures for Q = 41,500 cfs (1,174 meters3/sec) with the recommended spillway bucket lip. Figure 17 illustrates the observed pressures on the plunge pool floor along the spillway centerline. Six more piezometers were later placed on the floor in a 3foot (0.9-meter) by 6-foot (l.&meterl area on the spillway centerline 278 feet (84.7 meters) from the axis of the dam, where the highest impact pressures were observed. These piezometers were equipped with pressure cells immediately below the floor of the plunge pool. Dynamic pressures were recorded for several discharges. The highest average value observed on the six pressure cells for a discharge of 41,OCil cfs (1,161 meters3/sec). represented a total pressure head of 147 feet (44.8 meters), or elevation 6612, Figure 18. The maximum instantaneous pressure represented an elevation of 6766, the reservoir elevation for a discharge near 41,000 d s (1,161 meters3/sec). This would indicate that at times the instantaneous energy level on the floor of the plunge pool reaches the potential energy level of the reservoir. The normal operating discharge of the river outlet
works will be 1,600 cfs (45.3 meters31sec) with the Outlet Works reservoir surface elevaticn ranging from the top of
inactive conservation storage, elevation 6700 to eleva- The river outlet works consists of two 54-inch tion 6755. Since the centerline elevation of the (1,371.6.mml diameter, approximately 120-foot conduits and jet-flow gates is 6518, the gates will (36.6-meter) long conduits which run through the dam operate under a minimum submergence of 11 feet and powerplant. These outlet conck'itsare controlled by (3.35 meters).
CRYSTAL D b M SPILLWbY AND OUTLET WORKS
Figure 16. Model plunge pool piezomerer locations. 1 :36-scale model
48-inch (1,219.2-mm) diameter jet.flow gates located at the downstream end of each conduit. Figure 1.
In the preliminary design, each conduit had i t s own vertical intake tower located on the upstream face of the dam. The two intake towers were 160 fee t (48.8 meters) in height with a 7.5-foot (2.29-meter) radius semicircular cross section. This design was later changed to a single 11.0-foot (3.35-meter) radius semicircular intake tower with tw? 54-inch (1,371.6mm) diameter outlet conduits at the base. Figure 19.

Q = 41,WOcfr Tailwater elevation 6565 278feet from axis of dam
Figure 18. Plunge pool floor impsn prerrure cell trace. 1 :36-scale model.
The 1: 13.60 model lr~reliminary design1.-The model for-the preliminary design was built to a scale ratio of 1:13.60 so that available 3.53inch (89.7-mm) diam- eter model jet-flow gates could be used to represent the 484nch (1,219.2-mml diameter prototype gates. The two %-inch (i.371.6-mm) diameter conduits and one of the 7.5-foot (2.29-meter) radius, semicircular, verti- cal intake towers were modeled with Cinch (101.6.mm) pipes and a 6.62-inch (168.2-mm) radius model silo. One of these pipes was made of plastic and the other was made of sheet metal. The plastic model conduit included a bellmouth entrance and upstream from the model conduit the vertical, semicircular cross.sectional intake tower was built to simulate the prototype configuration. Only the lower 68 feet (20.7 meters) of the intake tower were constructed in the model and connected to the water supply pipe at an approximate elevation of 6586. The other conduit was connected directly to the water supply pipe. Figure 20 illustrates the model tes t facility.
The jet-flow gates were installed in a box 12 feet (3.66 meters) square by 12 feet (3.66 meters) deep to study the submerged conditions of the gates. A false retaining wall and a false bottom were installed to simulate the spillway plunge pool into which the outlet works discharges. A valve on the tailbox outlet pipe con- trolled the tailwater level. Water was supplied to the model by a portable centrifugal pump through an %inch (203.2-mm) diameter pipe. A calibrated 4-318. inch (I 11.1-mm) diameter orifice meter was installed in the Sinch (203.2-mm) pipe to measure the discharge rate. Piezometers were. installed at reference stations in the intake tower, upstieam from the jet-flow gate. and at points within the bellmouth entrance to the conduit where low pressures were anticipated. The pressures
cury manometers. The tailwater elevation was meas. ured using a staff gage attached to the inside wall of the tailbox.
The 1: 19.85 model (recommended design).-The 6.62.inch (168.2-mm) model, semicircular intake tower used for the preliminary design was also utilized for the 11.0-foot (3.35-ml radius, single, intake tower system. Since thls resulted in a change in the prototype tower radius from 7.50 feet to 11.0 feet, the model scale was changed accordingly from 13.6 to 19.85.To model the two 54-inch (1.371.6-mrnl conduits. 2.75- inch (69.85-mm) diameter, standard plastic pipe was used.
Piezometers were installed at reference stations Pi and PC in the intake tower and a t the downstream end of each conduit similar to the earlier model, Figure 20. The resulting pressures were measured by the afore- mentioned pot-type mercury manometer.
Calibrated 4-318-inch (1 11.13.mm) and 2-318-inch (60.66-mml diameter orifices were used to measure the small discharges.
To regulate the flow in each conduit, the downstream end of each 2-314-inch (69.85mm) conduit was con- nected to the previously used 3.53-inch (89.7mm) jet-flow gates.
Vortex formath-The flow in the preliminary intake tower design was not stable, especially in the bell- mouth transition from the intake tower to the conduit, as shown in Figure 21A. A violent vortex originated near the floor of the intake tower and developed in the bellmouth entrance to the conduit. A piezometer probe was placed in the core of the vortex by drilling a hole in the rear of the intake tower at the centerline elevation of the conduit. A pressure cell recorded model pressures of minus 23 feet (7.01 meters). indicating that the vortex core was at or near vapor pressure for a model discharge of 1.71 cfs (0.05 meter3/sec). Pressures along the bellmouth flow surface were unsteady and pressure fluctuations as large as 200 feet (61 meters) prototype were recorded. The vortex formed near the entrance to t h e conduit and reached to the downstream end, Figure 218.
To prevent this unstable flow condition, the floor of the intake tower was raised from elevation 6510.5 to elevation 6513.5, which decreasedethe area available for circulatlon, Flgure 19. This allowed enough remain- ing space for the bulkhead gate seals on the upstream face of the bellmouth entrance.

P L A N
3
ELEVATION PRELIMINARY INTAKE RECOMMENDED INTAKE
CRYSTAL DAM SPILLWAY a OUTLET WORKS Figure 19. Intake tower designs.
15

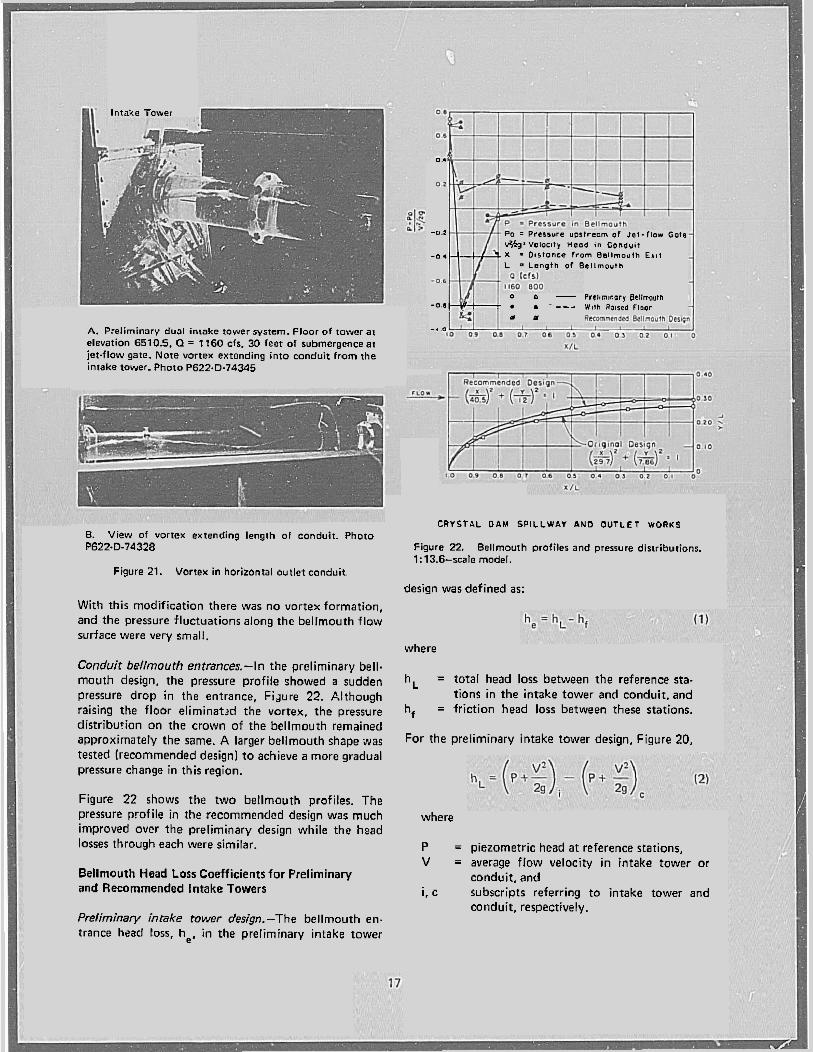
Intake Tower
A. Preliminary dual intake tower system. Floor of tower at elevation 6510.5. Q = 1160 cfr. 30 feet of submergence at iet.flow gate. Note vortex extending into conduit from The intake tower. Photo P622.D-74345
8. View of vortex extending length of conduit. Photo P622-0-74328
Figure 21. Vortex in horizontal outlet conduit.
With this modification there was no vortex formation, and the pressure fluctuations along the bellmouth f low surface were very small.
Conduit bellmouth entrances.-In the preliminary bell. mouth design, the pressure profile showed a sudden pressure drop in the entrance, Fijure 22. Although raising the floor eliminatrd the vortex, the pressure distribution on the crown of the bellmouth remained approximately the same. A larger bellmouth shape was tested (recommended design) t o achieve a more gradual pressure change in this region.
Figure 22 shows the two bellmouth profiles. The pressure profile in the recommended design was much improved ovcr the preliminary design while the head losses through each were similar.
Bellmouth Head Loss Coefficients for Preliminary and Recommended Intake Towers
Preliminary intake rower design.-The bellmouth en. trance head loss, he, in the preliminary intake tower
0 1
-0 1 PO ' Pressure matreom of , a t - r l o r t o t e +&:veloc~ly ~ e o a i n conduqt
-0 1 X = Dl.tonce from Ballmouth E I ~ I L - Lsnglh or B s l l m o ~ r n
o a - ~ r e ~ m n o r ~ B I I I ~ ~ ~ I ~ -0 8 . . --- W l f h R o l l e d Floor
@ ' - 4 0
C R Y S T A L D A M S P I L L W A Y AND O U T L E T WORKS
Figure 22. Bellmouth profiles and pressure distributions. 1: 13.6-scale model.
design was defined as:
where
h, = total head loss between the reference sta- tions in the intake tower and conduit, and
hf = friction head loss between these stations.
For the preliminary intake tower design, Figure 20,
where
P = piezometric head at reference stations, V = average f low velocity in intake tower or
conduit, and i. c subscripts referring t o intake tower and
conduit, respectively.
.. - prototype 'diecharge, 6, and the dtfference in
\ \.Sf, , - n I 0
piezometrlc haad beween the intake tower an3 the
condJt AP = Pi - PC hL = 0.33 (s)? + (z) I (3)
u = imdF -
Since Ac = 0.18 Ai
but 0, = Qc
therefore Vi = 0.18Vc
where A equals the conduit area based on the 4-inch (1%1.8.mrn) diameter, model conduit scaled to a 64.4-inch (1,382.mml prototype conduit diarn and (:Ii = 0.03 (z) C eter.
From equation (2) tho total headloss, hL, i s therefore,
o Single Conduit only Recommended Design . 3 Sinplo Conduit or both
c ~ n a u i t s flowing equally
. . I F T I
G R Y S T A C D A M S P I L L W A Y A N D OUTLET W O R K S ->
Plgure 23. Extrapolated modnl data llncok; t~werrl.
where
f = friction coefflc~ent. R = hydraulic radius. L = respectlve length, and D = diameter.
The f:ict~on head loss in the tower i s neglig~ble since the velocity head in the tower i s only 3 percent of the conduit velxity head. L and D in the model conduit are 47 Inches (1.19 meters) and 4 inches (0.10met~rJ. respectively. The friction coefficient, f, i s expressed by using Manning's n as follows:
Assurnirig a Manning's n of 0.008 for the Cinch (0.lOmeter) plastic conduit.
Substituting equations (4) and (5) into equation (1).
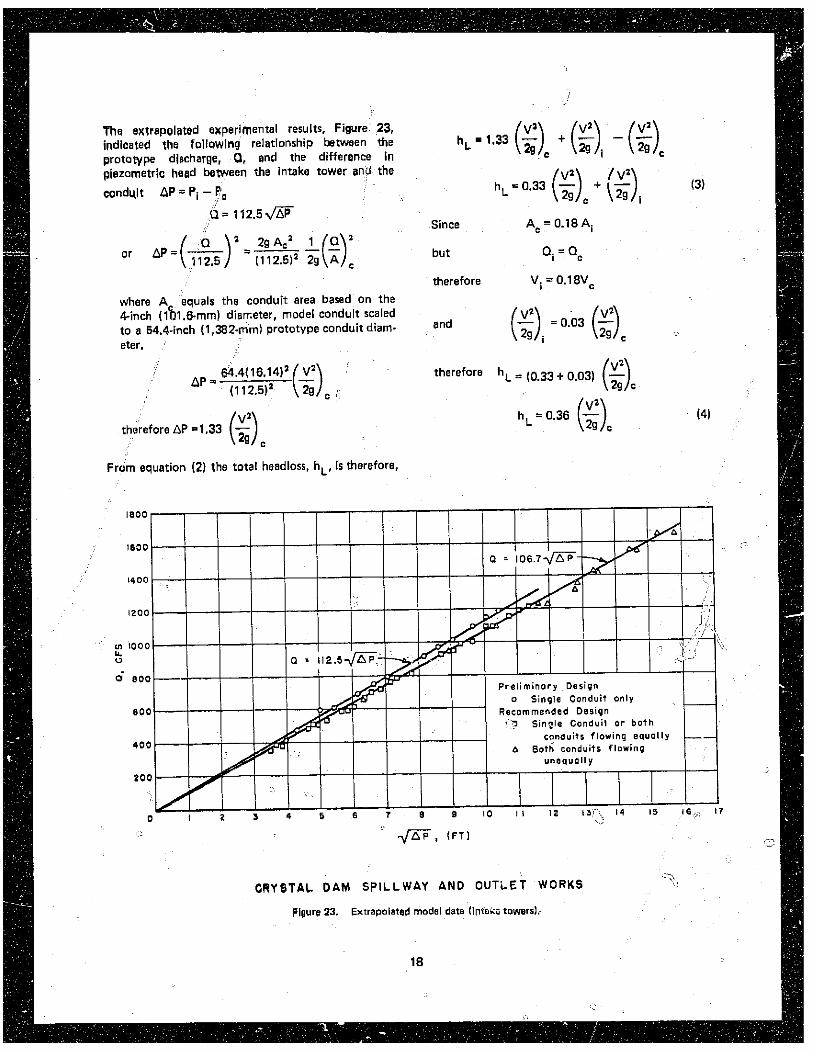
Recommended intake rower design.-The recom- mended design used the same bellmouth shape as the preliminary design. Extrapolated experimental results, Figure 23, indicated the following relationship between the conduit dixharge, Q ; Bnd the difference in piezometric head, AP = Pi -fit:
This relationship was derived by operating either
indicated that the total discharge through the intake tower equaled the sum of the two conduit discharges calculated from equation (7) whcn operating with unequal discharges through the conduits. Therefore. the total discharge,
where
APL = piezometric head difference between the reference stations in the intake tower and lefl>onduit, and
APR = piezometric head difference between the reference stations in the intake tower and right conduit.
From equation (71
where A, equals the conduit area based on the 2.72-inch (70mm) diameter model conduit scaled to a 54.0-inch (1,371.6-mm) prototype conduit diameter
The total head loss, hL, between reference stations in the intake tower and erther conduit is,
Equation (10) i s similar tg equation (4). The relation-
ship between the terms
Qi of the ratio -. However, in this Instance the ratlo -
Qc Q,
Under the same assumption of negligible tower loss and in this care substituting LC = 37 inches (940 mml and D, = 2.72 inches (70 mml and using Manning's n = 0.008,
Therefore. the entrance head loss i s determined to be,
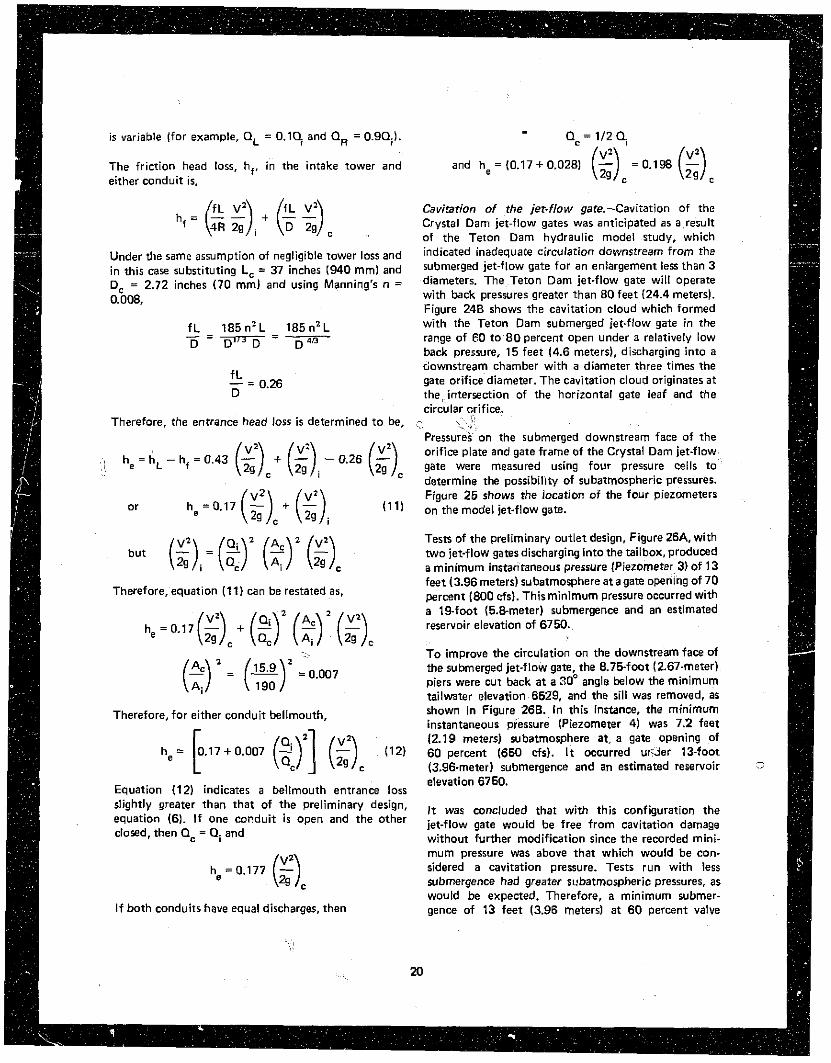
Cavitation of the jet-flow gate.-Cavitation of the Crystal Danr jet-flow gates was anticipated as a result of the Teton Dam hydraulic model nudy, which indicated inadequate circulation downstream from the submerged jet-flow gate for an enlargement less than 3 diameters. The Teton Dam jet-flow gate will operate with back pressures greater than 80 feet (24.4 meters). Figure 248 shows the cavitation cloud which formed with the Teton Dam submerged jet-flow gate in the range of EO to 80 percent open under a relatively low back pressure, 15 feet (4.6 meters), discharging into a downstream chamber with a diameter three times the gate orifice diameter. The cavitation cloud originates at the-intersection of the horizontal gate leaf and the circular c,rifice.
,:, \ , j: . .. Pressure; on the submerged downstream face of the orifice plate and gate frame of the Crystal Dam jet-flow
h = h - h =0.43 - ' l , e L f ( ( - O 6 ( gate were measured using four pressure cells to ' determine the oossibilirv of subatmos~heric Dressures. .. . .~~~~ Figure 26 shows the location of the four pierometers
or h. 0.17 (g). + (z), on the model jet.flow gate.
Tests of the preliminary outlet design. Figure 26A, with
but (g) = (:)2 (;)2 (s) two jet-flow gates discharging into the tailbox, produced 2s i C a minimum instantaneous pressure (Piezometer 3) of 13
Therefore, equation (11) can be restated as, feet (3.96 meters) subatmosphere at a gate open;ng of 70 percent (800 cfs). Thisminimum pressure occurred with
2 a l a foo t (5.Emeter) submergence and an estimated
he=O.17(&Jc+ (:)'(?) (g) reservoir elevation of 6750. C
To improve the circulation on the downstream face of
(:) = (-=)> =..0.007 the submerged jet-flow gate, the 8.75-foot (2.67-meter) piers were cut back at a 30' angle below the minimum tailwater elevation 6529. and the si l l was removed. as
Therefore, for either conduit bellmouth, shown in Figure 268. In this instance, the minimum instantaneous piessure (Piezometer 4) was 7.2 feet
[ (:)'I (:)c
(2.19 meters) subatmosphere at. a gate opening of he = 0.17 + 0.007 (12) 60 percent (650 cfs). It occurred u ~ i e r 13-foot
(3.96-meter) submergence and an estimated reservoir - \,
elevation 6750. Equation (12) indicates a bellmouth entrance loss
mum pressure was above that which would be con- sidered a cavitation pressure. Tests run with less submergence had greater subatmospheric pressures, as would be expected. Therefore, a minimum submer-
If both conduits have equal discharges, then gence of 13 feet (3.96 meters) at 60 percent valve
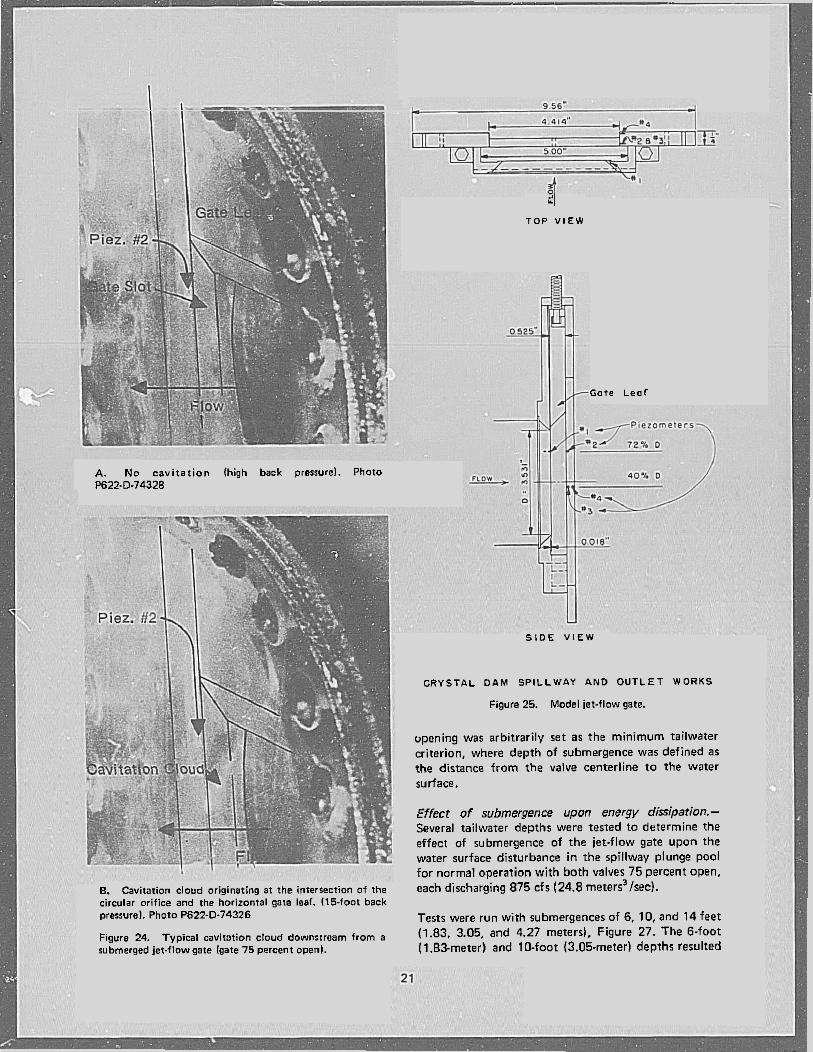
A. No cavi tat ion (high back prerrurel. Photo P622-D-74328
B. Cavitation cloud originating a t the intersection of the circular orifice and the horizontal gate leaf. 115-foot back prerrurel. Photo P622-0.74326
Figure 24. Typical cavitation cloud downstream from a submerged jet-flow gate (gate 75 percent open].
a1 T O P V l E W
G o t e Leaf
SiOE VlEW
CRYSTAL DAM S P I L L W A Y AND OUTLET WORKS
Figure 25. Model jet-flow gate.
opening was arbitrari ly set as the min imum tailwater criterion, where depth of submergence was defined as the distance f r o m the valve centerline t o the water surface.
Effect of submergence upon energy disipation.- Several tailwater depths were tested to determine the effect o f submergence o f the jet-flow gate upon the water surface disturbance in the spillway plunge pool f o r normal operation w i t h bo th valves 75 percent open, each discharging 875 cfs (24.8 rneters"sec).
Tests were run w i th submergences o f 6, 10, and 1 4 feet (1.83. 3.05, and 4.27 meters), Figure 27. The 6- foot (1.83meter) and 10-foot (3.05-meter) depths resulted

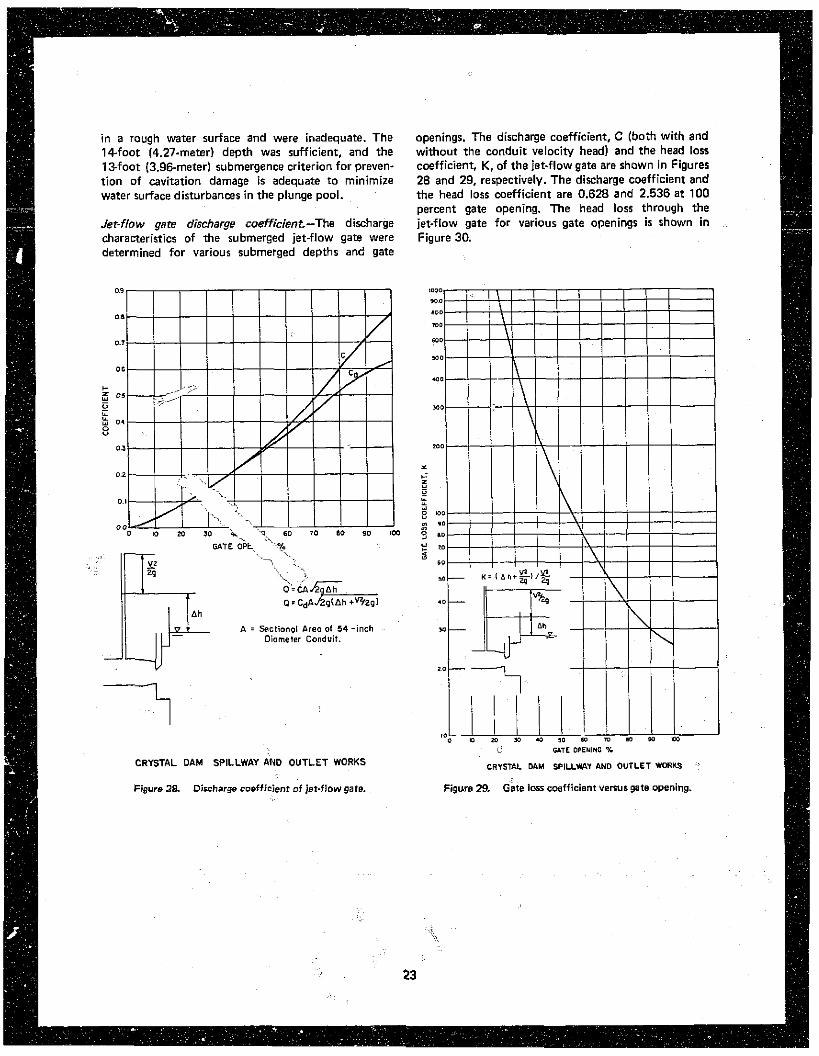
in a rough water surface and were inadequate. The 14-foot (4.27-meter) depth was sufficient, and the 13foot (3.96-meter) submergence criterion for preven- tion of cavitation damage i s adequate to minimize water surface disturbances in the plunge pool.
Jet-flow gate discharge coefficient.-The discharge characteristics of the submerGed jet-flow gate were determined for various submerged depths and gate
A = sectiond Areo of 54 -inch Diameter Conduit.
CRYSTAL DAM SPILLWAY AND OUTLET WORKS
Figure 28. Diecharge coefficient of jet-flow gats.
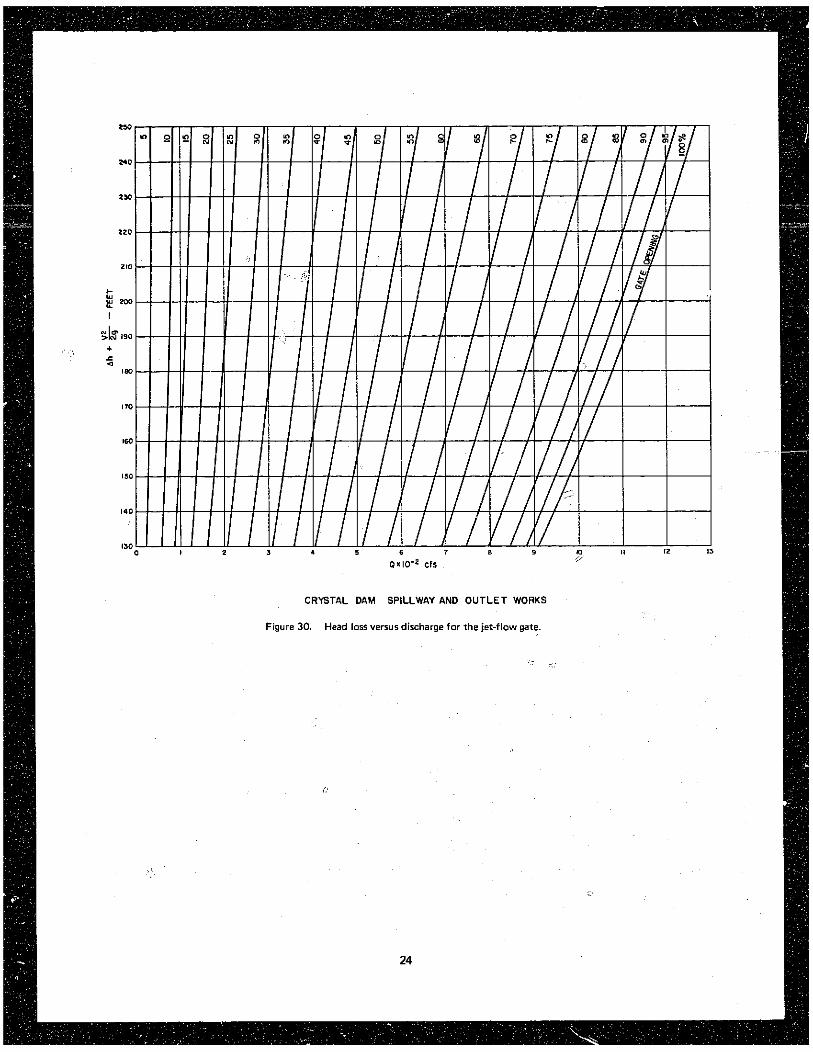
openings. The discharge coefficient, C (boih with and without the conduit velociw head) and the head loss coefficient, K, of the jet-flow gate are shown in Figures 28 and 29, respectively. The discharge coefficient and the head loss coefficient are 0.628 and 2.536 a t 100 percent gate opening. The head loss through the jet-flow gate for various gate openings is shown in Figure 30.
WTE OPEMINO %
CRYSTAL DAM SPILLWAY AND OUTLET WDRKS
Figure 29. Gate loss coefficient venusgafe opening.
......... Buww 01 R.dmmmia
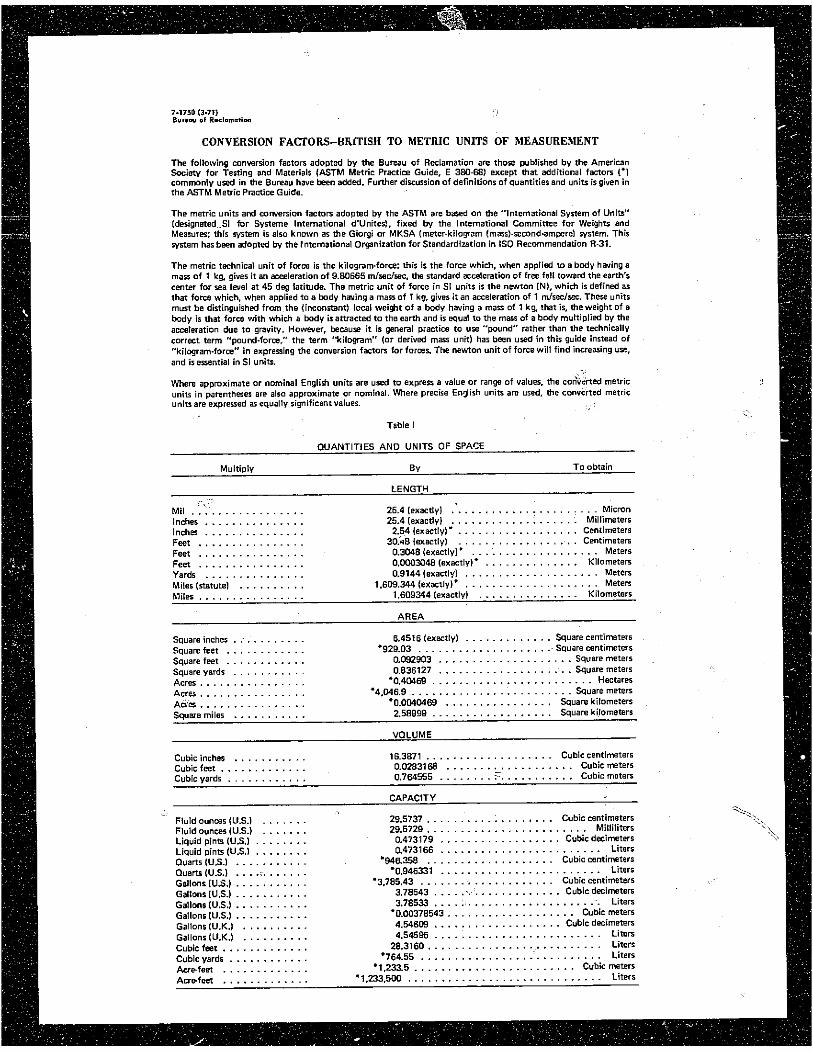
CONVERSION FAmORS-BRITISH TO METRIC UNITS OF MEASUREMENT
The metric units and cowerrion factors adopted by the ASTM are b& an me "lntemational System of Units"
un~uareexprerred ar equally r8gntfmcant valuer
Table I
OUANTITIES AND UNITS OF SPACE
, . ~.. . . . . . . . . . . . . . . . . . . . . . . Mil . . : . . . . . . . . . . . . . . 25.4 lexaetlyl Micmn . . . . . . . . . . . . . . . . . . . Inches . . . . . . . . . . . . . . . 25.4 lexactlyl Millimeters . . . . . . . . . . . . . . . . . . inche . . . . . . . . . . . . . . . 2.54 (exactlyl' Centimeters
Feet . . . . . . . . . . . . . . . . 30.48 1exa;tlyl . . . . . . Feet . . . . . . . . . . . . . . . . 0.3048 lexactlyl' . . . . Feet . . . . . . . . . . . . . . . . O.WO3048 (exaetlyl* . .
AREA
. . . . . . . . . . . . . Square inches . . . . . . . . . . . 5.4516 Iexactlyl Square centimeters Square feet . . . . . . . . . . . . '929.03 . . . . . . . . . . . . . . . . . . . . Square centimeters . . . . . . . . . . . . . . . . . . . . Square feet . . . . . . . . . . . . 0.092903 Square meters . . . . . . . . . . . . . . . . . . . . . Square yards . . . . . . . . . . . a935127 Square meterr Acres . . . . . . . . . . . . . . . . '0,40469 . . . . . . . . . . . . . . . . . . . . . . . . Hectares Acres . . . . . . . . . . . . . . . . '4.046.9. . . . . . . . . . . . . . . . . . . . . . . . Square meterr Aria . . . . . . . . . . . . . . . . .0.0MW69 Square kilometers . . . . . . . . . . . . . . . . . . . . . . . . . . . . . . . . . . Square miles . . . . . . . . . . . 2.58999 Square kilometers
. . . . . . . . . . . . . . . . . . . Cubic insher . . . . . . . . . . . 15.3871 Cubic sentimeterr . . . . . . . . . . . . . . . . . . . Cubic feet . . . . . . . . . . . . . 0.0283168 Cubic meters . . . . . . . . . . . . . . . . . . Cubic yards . . . . . . . . . . . . 0.784555 ?. Cubic - meters
CAPACITY
Gallons lUS.1 ... Gallonr 1U.S.l . .. Gallons (U.S.1 . . . Gallons lU.S.1 . . . Gallonr 1U.K.I . . Gallonr lU.K.1 . . Cubic feet . . . . . Cubic yards . . .. Asrefeat ..... Aaefeet .....
... Cubic centimeter6 . . . . . . . . Milliliters
. . . . Cubic decimeters
. . . . . . . . . . Li tan
. . . Cubic centimeters
. . . . . . . . . . Liters . . . Cubic cemimeterr . . . . Cubic decimeters
........:. Literr . . . . . . Cubic meterr
. . . . Cubic decimeters
. . . . . . . . . . Liters
. . . . . . . . . . Liters
. . . . . . Cubic meters
. . . . . . . . . . Liters

- n3Aod ............. - ................................ $
-&nimr. ....................... , .........--- - *=uw .................................. . csw1 ::::: ~wWn-w!vu qrYla601m...' ....................... m. FOB1 "!" CLulie 'WM
.A9tRN3 ONV XNU1OYL
4 s 9 = u 1 Is f&vw P W e l l l R L