Affordable VENUE Affordable in Quezon City Affordable Philippines

Colorado Commission on Affordable Health Care
2015 Report to the Colorado General
Assembly and Colorado Governor
November 13, 2015
CCAHC Report to the Colorado General Assembly and Governor’s Office | 2
Table of Contents
Letter from the Chairman ........................................................................................................... 3 Commission members ............................................................................................................... 5 I. Health Care in Colorado .......................................................................................................... 6
Legislative Charge — Senate Bill 14-187 ...................................................................................... 6 Legislative Charge (continued) ....................................................................................................... 7 Commission’s Framework to Identify and Prioritize Recommendations ........................................ 8 Timeline of Work ............................................................................................................................. 9
IV. Stakeholder Engagement ....................................................................................................10 V. Health Care Spending in Colorado .......................................................................................11
Defining Cost, Price, and Spending ............................................................................................. 11 Health Spending in Colorado: Research Analysis ....................................................................... 13 Expenditures by Types of Services .............................................................................................. 13 Growth in Expenditures by Types of Services ............................................................................. 15 Expenditures by Payer ................................................................................................................. 16 Spending by Disease or Condition ............................................................................................... 18 Spending by Age .......................................................................................................................... 19
VI. The Colorado Framework ....................................................................................................21 Accountable Care Collaborative ................................................................................................... 21 21st Century Care ......................................................................................................................... 21 Bridges to Care ............................................................................................................................. 22 Colorado Beacon Consortium (CBC) ........................................................................................... 22 Colorado’s Blue Ribbon Commission for Healthcare Reform ...................................................... 23 Implemented ................................................................................................................................. 23 Notable Spending Control Initiatives in Other States ................................................................... 29
VII. Next Steps ..........................................................................................................................31 Appendix A: Methods for Colorado Spending Analysis 2009 – 2013 .........................................32
CCAHC Report to the Colorado General Assembly and Governor’s Office | 3
Letter from the Chairman
November 13, 2015
Governor John Hickenlooper
Office of the Governor
Colorado Capitol
200 E Colfax Ave.
Denver, CO 80203
Senator Kevin Lundberg
Chairman, Senate Committee on Health
and Human Services
200 E Colfax Ave.
Denver, CO 80203
Representative Elizabeth McCann
Chairman, House Committee on Health,
Insurance, and Environment
200 E Colfax Ave.
Denver, CO 80203
Representative Dianne Primavera
Chairman, House Committee on Public
Health Care and Human Services
200 E Colfax Ave.
Denver, CO 80203
Gov. Hickenlooper, Sen. Lundberg, and Reps. McCann and Primavera,
Health care costs have been dramatically rising for the past two decades, in Colorado and
across our nation. Despite the progress made on expanding access to health care as well as
improving quality, rising costs are creating challenges for families, businesses, and public
agencies alike. Recognizing this problem — not only for everyday Coloradans, but also for our
state’s fiscal health — the Colorado General Assembly passed Senate Bill 14-187 and created
the Colorado Commission on Affordable Health Care.
Our mission from Day 1 has been to study this enduring problem, explore the root causes of
rising health costs in Colorado, and lay a framework for the important work we have to do in
2016. Our work complements the progress of past commissions and work, while also
deliberately focusing on cost containment.
In considering this matter it is important to note the complexity of the topic and the fact that
obvious potential actions may in fact not address any particular topic, or even make things
worse. This is also important to acknowledge that health care represents one-sixth of our
economy, and this is another clarion call for diligence and appropriate care.
This report — the result of more than a year’s worth of outreach, research, and expert testimony
— lays out the challenges Colorado faces today on health care spending, the primary drivers of
rising health costs, and several topics we will continue to grapple with in our second year. In
many ways this nonpartisan, comprehensive, and evidence-based analysis of the major drivers
of health care costs is a landmark resource for policymakers and others across the Centennial
State. However, this is only one step toward our goal of true cost containment.
We still have work to do to study the effectiveness of strategies for controlling health care costs
and propose collaborative solutions to address this problem. These challenges remain for our
second year of work, and we look forward to collaborating with the Colorado General Assembly
and the Governor’s Office to ensure we can accomplish our legislative mandate. Your
perspectives are essential to our ongoing work.

CCAHC Report to the Colorado General Assembly and Governor’s Office | 4
Please do not hesitate to provide us with any feedback.
Sincerely,
William N. Lindsay III
Chairman, Colorado Commission on Affordable Health Care
CCAHC Report to the Colorado General Assembly and Governor’s Office | 5
Commission members
Elisabeth Arenales of Denver, from an organization representing consumers and understands
consumers with chronic medical conditions
Jeffrey J. Cain, M.D., FAAFP, of Denver, a health care provider who is not employed by a
hospital and who is a physician recommended by a statewide society or association whose
membership includes at least one-third of the doctors of medicine or osteopathy licensed in the
state
Rebecca Cordes of Denver, representing large, self-insured Colorado businesses
Greg D’Argonne of Littleton, with expertise in health care payment and delivery
Steve ErkenBrack of Grand Junction, representing carriers offering health plans in the state
Ira Gorman, PT, PhD, of Evergreen, a health care provider who is not employed by a hospital
and is not a physician
Linda Gorman of Greenwood Village, a health care economist
Bill Lindsay (Chair/Planning Committee Chair) of Centennial, representing licensed health
insurance producers
Marcy Morrison of Manitou Springs, from an organization representing consumers
Dorothy Perry, PhD, of Pueblo, with expertise in public health and the provision of health care
to populations with low incomes and significant health care needs
Cindy Sovine-Miller (Vice-Chair) of Lakewood, representing small Colorado businesses
Christopher Gordon Tholen of Centennial, representing hospitals and recommended by a
statewide association of hospitals
Ex officio Commission members
Susan Birch, MBA, BSN, RN, Executive Director, Colorado Department of Health Care Policy
and Financing
Julie Krow, Deputy Executive Director for Community Partnerships, Colorado Department of
Human Services
Marguerite Salazar, Commissioner of Insurance, Colorado Department of Regulatory Agencies
Jay Want, M.D., representing the Colorado All Payer Claims Database
Larry Wolk, M.D., MPH, Executive Director, Colorado Department of Public Health and
Environment

CCAHC Report to the Colorado General Assembly and Governor’s Office | 6
The Mission of the Commission is to ensure that
Coloradans have access to affordable health care
in Colorado.
The Commission shall focus its recommendations
on evidence-based cost-control, access, and
quality improvement initiatives and the cost-
effective expenditure of limited state moneys to
improve the health of the state’s population.
Powers and Duties of the Commission:
Identify, examine, and report on cost
drivers for Colorado businesses,
individuals, Medicaid, and the uninsured.
Data analysis on evidence based
initiatives designed to reduce health care
costs while maintaining or improving
access to and quality of care.
Analyze the impact of increased
availability of information.
Review, analyze, and seek public input
on state regulations impacting delivery
and payment system innovations.
Analyze impact of out-of-pocket costs
and high-deductible plans.
Examine access to care and its impact
on health costs.
Review reports and studies for potential
information.
Report outcomes of the 208 Commission
Legislative Charge —
Senate Bill 14-187
I. Health Care in Colorado Health care spending has been rising as a
share of household income for decades, and is
projected to keep rising. This growing expense
squeezes families, particularly those struggling
to make ends meet.
Issues of health care costs and spending are
sometimes used interchangeable by
policymakers but have distinct meanings. While
much of the data analysis focuses on spending,
the work of the Commission will focus primarily
on cost — the price of that service, or the cost
or price of all of the services an individual uses
annually. This focus on cost will not be to the
exclusion of a focus on spending. The
increased attention to health care costs likely
reflects the recent trend of health insurance
premiums — the most visible indicator of health
care costs — growing at a much faster rate
than workers’ earnings.
Finding ways to stabilize health care costs — a
highly visible topic of discussion for individuals
and families, employers, state policymakers,
providers, and the media — is essential for our
state, now and for decades to come.
Improving efficiency and reducing costs in
health care in Colorado will require
extraordinary public leadership and a
commitment from the public and private
sectors. Leaders from all sectors will need to
work collaboratively to advocate for systemic
changes that improve the affordability of
essential health services for all Coloradans.
Total national spending on health care services and supplies — that is, by all people and
entities in the United States, governmental and nongovernmental — increased from 4.6 percent
of gross domestic product (GDP) in calendar year 1960 to 9.5 percent in 1985 and to 16.4
percent, about one-sixth of the economy, in 2013.1
1 Congressional Budget Office, The 2015 Long-Term Budget Outlook. http://www.cbo.gov/sites/default/files/114th-congress-2015-2016/reports/50250/50250-breakout-Chapter2-2.pdf
CCAHC Report to the Colorado General Assembly and Governor’s Office | 7
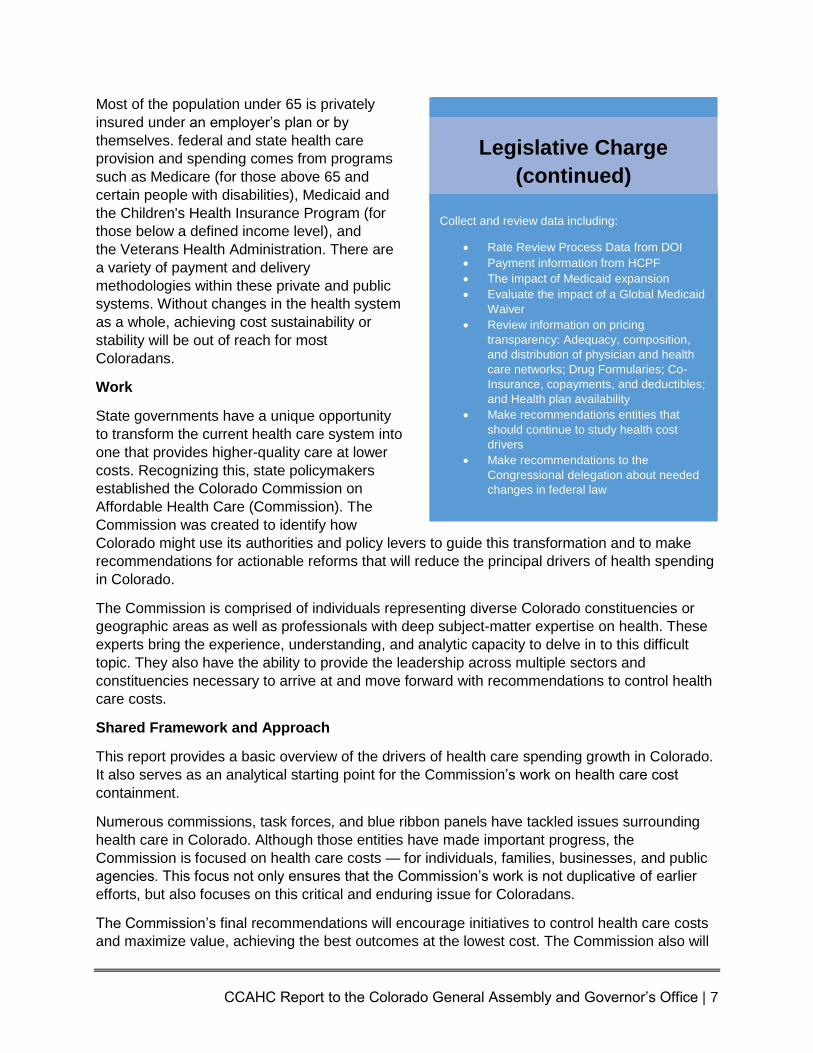
Collect and review data including:
Rate Review Process Data from DOI
Payment information from HCPF
The impact of Medicaid Expansion
Evaluate the impact of a Global
Medicaid Waiver
Review information on pricing
transparency: Adequacy, composition
and distribution of physician and health
care networks; Drug Formularies; Co-
Insurance, copayments and deductibles;
and Health plan availability
Make recommendations entities that
should continue to study health cost
drivers
Make recommendations to the
Congressional Delegation about needed
changes in federal law
Legislative Charge
(continued)
Collect and review data including:
Rate Review Process Data from DOI
Payment information from HCPF
The impact of Medicaid expansion
Evaluate the impact of a Global Medicaid
Waiver
Review information on pricing
transparency: Adequacy, composition,
and distribution of physician and health
care networks; Drug Formularies; Co-
Insurance, copayments, and deductibles;
and Health plan availability
Make recommendations entities that
should continue to study health cost
drivers
Make recommendations to the
Congressional delegation about needed
changes in federal law
Most of the population under 65 is privately
insured under an employer’s plan or by
themselves. federal and state health care
provision and spending comes from programs
such as Medicare (for those above 65 and
certain people with disabilities), Medicaid and
the Children's Health Insurance Program (for
those below a defined income level), and
the Veterans Health Administration. There are
a variety of payment and delivery
methodologies within these private and public
systems. Without changes in the health system
as a whole, achieving cost sustainability or
stability will be out of reach for most
Coloradans.
Work
State governments have a unique opportunity
to transform the current health care system into
one that provides higher-quality care at lower
costs. Recognizing this, state policymakers
established the Colorado Commission on
Affordable Health Care (Commission). The
Commission was created to identify how
Colorado might use its authorities and policy levers to guide this transformation and to make
recommendations for actionable reforms that will reduce the principal drivers of health spending
in Colorado.
The Commission is comprised of individuals representing diverse Colorado constituencies or
geographic areas as well as professionals with deep subject-matter expertise on health. These
experts bring the experience, understanding, and analytic capacity to delve in to this difficult
topic. They also have the ability to provide the leadership across multiple sectors and
constituencies necessary to arrive at and move forward with recommendations to control health
care costs.
Shared Framework and Approach
This report provides a basic overview of the drivers of health care spending growth in Colorado.
It also serves as an analytical starting point for the Commission’s work on health care cost
containment.
Numerous commissions, task forces, and blue ribbon panels have tackled issues surrounding
health care in Colorado. Although those entities have made important progress, the
Commission is focused on health care costs — for individuals, families, businesses, and public
agencies. This focus not only ensures that the Commission’s work is not duplicative of earlier
efforts, but also focuses on this critical and enduring issue for Coloradans.
The Commission’s final recommendations will encourage initiatives to control health care costs
and maximize value, achieving the best outcomes at the lowest cost. The Commission also will

CCAHC Report to the Colorado General Assembly and Governor’s Office | 8
make recommendations that impact the total cost of care, now and in the future. The
Commission’s final report and recommendations, due at the end of June 2017, will address
public systems as well as offer metrics to measure short and long-term success. In its analysis,
the Commission is looking at health care spending and costs from the beginning of life to the
end of life.
The Commission created the following framework to identify and prioritize recommendations.
Though the goal of the Com-mission is to reduce health care costs, the Commission will work to
ideally ensure that cost reductions do not come at the expense of access and quality, but at a minimum point out the possible tradeoffs.
The Commission recognizes that it
must look at the health drivers that
impact the total cost of care. There
are not simple solutions given the
interplay of public and private
systems and multiple payers.
The analysis of the fundamental
drivers of health care spending will
help inform the Commission’s
selection and prioritization of
recommendations. Thus far the
Commission has reviewed
analyses of state spending on
personal health care by type of
service, payer, and disease as
well as reviewed work and
recommendations of the 208
Commission. Additionally, the
Commission has looked at
Colorado compared to national
data and has not found much in
the way of Colorado-specific
details.
Driving absolute cost/ rate of
increase
Actionable
Impacts both public programs and
private markets
Growing/ future cost drivers
Can be evaluated/ measured
Commission’s Framework to Identify and Prioritize Recommendations

CCAHC Report to the Colorado General Assembly and Governor’s Office | 9
From this analysis, the Commission has determined key topic areas for further discussion:
Transparency
Workforce
Social Determinants
Incentive Mechanisms
Regulatory Costs
Administrative Costs
Payment & Delivery Reform
Market Competitiveness
Technology
The drivers of health care spending growth are complex and multi-faceted. Just as no single
driver is responsible for our high and rising health care costs, no single policy solution will be
adequate to meet this challenge. The Commission must take the time to carefully evaluate the
data and evidence to understand the effects of any of its final policy recommendations.
Timeline of Work
There are four phases to the work of the Commission. The Commission completed the
Organizational Phase which included the establishment of governing and decision-making
policies, and is in the midst of the Discovery & Assessment Phase.
The remainder of the Commission’s work will focus on developing recommendations for the
Colorado General Assembly and Governor’s Office based on further analysis of the information
gathered to-date, additional research and comparative models, and input from key stakeholders
and members of the public and professional community across Colorado.
CCAHC Report to the Colorado General Assembly and Governor’s Office | 10
IV. Stakeholder Engagement Statewide input forms the bedrock of the Commission’s work.
The Commission’s meetings are broadcast via ReadyTalk, a user friendly and reliable
technology, so that the public and Commissioner participation is not limited by the location of
the meetings in Denver. All Commission meetings are noticed a week prior on the website and
through an interested party listserv and all meetings have several opportunities for public
comment.
Following its first year of work, analyzing the fundamental drivers of health care spending and
hearing from experts, the Commission will create mechanisms to gather statewide feedback on
multiple relevant topics. The Commission distributed a questionnaire to health care stakeholders
and received a series of responses from ClinicNet, Colorado Academy of Family Physicians,
Colorado Association of Health Plans and AHIP, Colorado Business Group on Health, Colorado
Coalition for the Medically Underserved, Colorado Community Health Network, Colorado
Foundation for Universal Health Care, Colorado Hospital Association, Colorado Medical
Society, Colorado Nursing Association, Colorado Telehealth Network, COPIC, Health Care for
All, LiveWell, and PhRMA.
The questionnaire and responses can be found in the appendices. The Commissioners are
reviewing the submitted questionnaires and will invite stakeholders to provide additional
information and perspective as the Commission moves through its deliberations.
In an effort to build on this expert input, the Commission will conduct nine statewide community
meetings in early 2016 to gather reactions and feedback on its work and recommendations.
These meetings will be held in in Arapahoe County, Greeley, Colorado Springs, Alamosa, La
Junta, Grand Junction, Summit County, Denver, and Adams County. These meetings will not
only provide vital input to Commission’s work and recommendations to-date, but also build
support for and community ownership of its eventual recommendations.
This buy-in is essential to the Commission’s long-term success and its ability to meet its
legislatively mandated goals. These mechanisms include a questionnaire to key communities
and stakeholders, an electronic survey, working with key organizations and individuals that have
community standing and presence to do outreach, as well as using the new Commission
website to solicit feedback, www.colorado.gov/cocostcommission.

CCAHC Report to the Colorado General Assembly and Governor’s Office | 11
V. Health Care Spending in Colorado Spending on health care in the United States has increased dramatically over the past two
decades, and Colorado’s health care spending has mirrored that trend.
At the request of the Commission, the Colorado Health Institute (CHI) drew on a number of
resources to gather data and provide an analysis of spending on personal health care in
Colorado over the past two decades.
CHI provided analytical reports to the Commission that delved into spending by a number of
different criteria, including:
Spending by types of service, such as hospital care, physician care, pharmaceutical and
other durable medical products, home health care and many more.
Spending by types of payer, such as commercial insurance, public insurance programs
and out-of-pocket expenditures.
Spending by age group.
Spending on a per-capita basis over the years.
The information in this chapter is based on those analyses. The data shine a spotlight on where
each health dollar is going in Colorado, providing a foundational understanding as policymakers
target their efforts to rein in costs and spending in both private and public sector markets.
This data in partnership with literature reviews and stakeholder input will focus the work of the
Commission on areas of greatest cost by service, payer, disease or condition, and age. The
data that follow are based upon 2009-2013 data, which is the latest available.
Defining Cost, Price, and Spending
The Commission’s Research Committee spent time to reach agreement on how to define the
basic terms — price, cost, and spending — related to the work of the Commission and its
mission to analyze health care costs and make policy recommendations on how to lower those
costs. (See Figure 1.)
Cost: The resources it takes for health care suppliers to produce goods or services,
including labor, equipment, facilities, and administration.
Price: Amount received by health care suppliers in exchange for their goods or services.
When prices are higher than suppliers’ costs, profits are generated; when prices are
lower than suppliers’ costs, losses occur. These prices are paid by insurance premiums,
public sector programs, and consumers.
Spending: The price of the goods or services multiplied by the quantity purchased. This
means that both price and quantity impact total spending.

CCAHC Report to the Colorado General Assembly and Governor’s Office | 12
Figure 1.
Delving into these definitions reveals nuances. For instance, consumers face additional “costs”
besides what they pay for premiums or their out-of-pocket share. These include, among others,
transportation, lost wages, and the opportunity to spend their time and money on other goods or
services. Payers and employers also face additional costs, including administration.
Because there are little data on the cost of different products and services, the Commission has
focused its analysis on the spending side of the equation.
Understanding the relationship between price and quantity, meanwhile, is crucial to the policy
discussion. Although the price of a specialty drug may be $10,000 a dose, if only a few
Coloradans use it, cutting the price would do little to reduce health care spending here. On the
other hand, the price of a doctor’s office visit might be $100, but it is a service purchased
millions of times a year in Colorado.
It is important to note that the price may not always cover suppliers’ costs. When the price does
not cover costs, suppliers will lose money. They will have to cross subsidize from other
profitable service lines or take on debt to stay in business. However, when the price exceeds
costs, suppliers will make a profit. Prices that are “administered,” or set by payers without using
the market demand to set prices may or may not cover costs.
CCAHC Report to the Colorado General Assembly and Governor’s Office | 13
Health Spending in Colorado: Research Analysis
Personal health care expenditures in Colorado reached an estimated $36.3 billion in 2013.
That’s an increase of 327 percent over the past two decades, compared to 216 percent in the
United States. And spending in Colorado has more than doubled from 2000, when it stood at
$16.3 billion. Since 2000, cumulative inflation in Colorado has been much lower at
33.3 percent.2
Personal health care expenditures, unlike total health care expenditures, do not include items
such as research, structures, equipment, government public health activities, program
administration, and the net cost of private health insurance. It accounts for roughly 80 percent of
all health care spending.
CHI based its analyses on personal health care expenditures because the data from the U.S.
Centers for Medicare and Medicaid Services are the only data that are available at the state
level.
While personal health care expenditures have increased significantly in Colorado, however,
residents of many other states are spending more.
Colorado’s per capita personal health care spending of $5,994 in 2009 was the nation’s seventh
lowest. Utah was the lowest at $5,031 and most of the other states with relatively low spending
were also in the Intermountain West.
The District of Columbia had the highest per capita spending of $10,349, followed by
Massachusetts at $9,278.
Expenditures by Types of Services
Hospital care accounts for the greatest share of personal health care spending in Colorado. It
was an estimated $13.5 billion in 2013. This means that 37 cents of each dollar spent on
personal health care in Colorado went for hospital care in 2013. (See Figures 2 and 3).
Physician and clinical services came in second at $9.6 billion in 2013.
These two categories have been the top expenditures over the past two decades, and together
account for nearly two-thirds of annual personal health care spending in Colorado.
The prescription drugs and other non-durable category was third at $3.8 billion.
On the other end of the spectrum, home health care expenditures were $866 million, or two
cents of every dollar.
2 U.S. Bureau of Labor Statistics

CCAHC Report to the Colorado General Assembly and Governor’s Office | 14
Figure 2.
Source: National Health Expenditure Accounts, CMS, Office of the Actuary, 2011 and 2014
Figure 3.
Source: National Health Expenditure Accounts, CMS, Office of the Actuary, 2011 and 2014

CCAHC Report to the Colorado General Assembly and Governor’s Office | 15
Growth in Expenditures by Types of Services
While spending on personal health care services increased dramatically between 1991 and
2013, the state population grew by 56 percent during this time frame. But population growth
alone does not explain all of the increase in personal health care spending.
Spending per person has increased nearly 175 percent over the past two decades. In 1991,
personal health spending for each Coloradan was $2,511. By 2013, per capita spending was
$6,893. While the nominal increase in per capita personal health spending was 175 percent
during this time frame, Colorado’s per capita GDP grew in nominal terms by 132 percent. To put
these numbers in context, cumulative inflation was 84 percent.
Comparing three time periods — 2000 to 2005; 2005 to 2010; and 2010 to 2013 — finds that
the lowest annual growth rate occurred between 2010 and 2013, when it was 3.6 percent. The
highest was between 2000 and 2005, when it was 5.7 percent. (See Figure 4.)
Figure 4.
2000-2005 2005-2010 2010-2013
Average Annual Growth in Total Nominal Personal Health Care Services, Colorado
5.7% 4.5% 3.6%
Average Annual Inflation, Colorado 2.0% 2.2% 2.8%
Source: CHI estimates using data from the National Health Expenditure Accounts, CenCMS, 2011 and 2014.
There is not consensus on the reasons for the slowdown in growth in recent years. However,
likely factors include:
A weak economy, leading to reduced demand for services of all sorts.
Early or preliminary payment reform efforts implemented by the federal government that
changed the way in which Medicare compensated hospitals for hospital re-admissions.
Increases in hospitals’ productivity for certain conditions and movement to outpatient
care.
Changes made by health care providers’ practice behavior in anticipation of the
Affordable Care Act and other reforms.
The increased prevalence of high deductible plans, which lead to higher cost sharing
and put pressures on consumers to reduce their consumption of health care services.
Overall personal health care spending grew by 327 percent since 1991, but some services
experienced faster growth than others. (See Figure 5).
The home health category, for instance, posted the fastest growth. It increased 584 percent,
from $127 million in 1991 to $866 million in 2013. However, it’s important to note that home
health care is still the smallest category of spending, despite this rapid growth. This growth
reflects a shift away from more expensive institutional-based care.
Spending on the category called “other health, residential, and personal care” increased by 414
percent, the second-highest growth rate, reaching an estimated $2.1 billion in 2013.

CCAHC Report to the Colorado General Assembly and Governor’s Office | 16
The biggest expenditure categories — hospital services and physician and clinical services —
grew at a slower clip, with hospital services climbing 313 percent from $3.3 billion in 1991 to an
estimated $13.5 billion in 2013. The physician and clinical services category grew 321 percent
from $2.3 billion in 1991 to an estimated $9.6 billion in 2013.
Meanwhile, spending on nursing home care increased by 258 percent, making it the slowest
growing category. This trend reflects the U.S. Supreme Court’s 1999 ruling that people with
disabilities must reside in the community instead of institutions when certain conditions are met.
This also explains the increase in home health and personal health services over the same
timeframe. This illustrates how reducing utilization in one area of the health care economy can
increase utilization in others.
Figure 5.
Source: National Health Expenditure Accounts, CMS, Office of the Actuary, 2011 and 2014
Expenditures by Payer
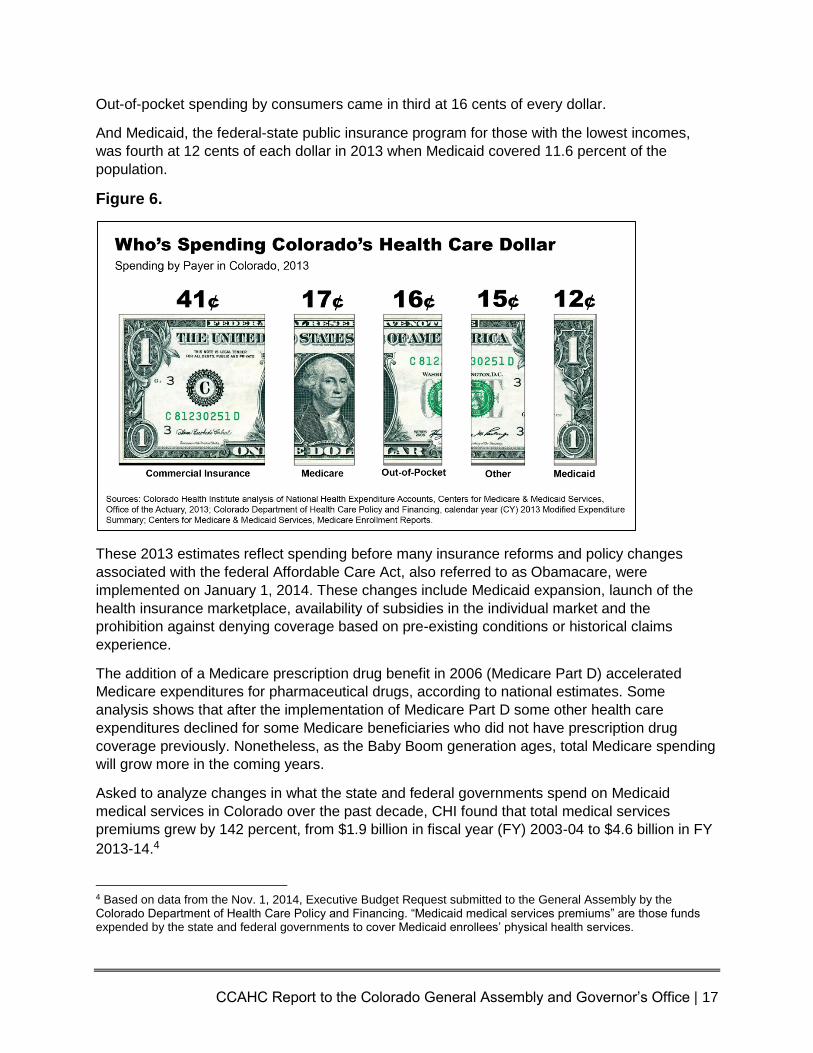
Commercial insurance is Colorado’s largest type of payer, accounting for 41 cents of each
expenditure dollar in 2013. (See Figure 6.) More than 60 percent of Coloradans were
commercially insured in 2013, according to the Colorado Health Access Survey (CHAS), either
by employer-sponsored insurance (52.6 percent) or through the individual market (8.2 percent).3
Medicare, the public insurance program for seniors and the disabled that is funded with federal
dollars, was Colorado’s next biggest payer. It accounted for 17 cents of each expenditure dollar
in 2013, but covered 11.4 percent of the population.
3 Colorado Health Access Survey 2015. Colorado Health Institute website. http://coloradohealthinstitute.org/uploads/downloads/2015_CHAS_for_Web_.pdf. Accessed Oct. 2, 2015.
CCAHC Report to the Colorado General Assembly and Governor’s Office | 17
Out-of-pocket spending by consumers came in third at 16 cents of every dollar.
And Medicaid, the federal-state public insurance program for those with the lowest incomes,
was fourth at 12 cents of each dollar in 2013 when Medicaid covered 11.6 percent of the
population.
Figure 6.
These 2013 estimates reflect spending before many insurance reforms and policy changes
associated with the federal Affordable Care Act, also referred to as Obamacare, were
implemented on January 1, 2014. These changes include Medicaid expansion, launch of the
health insurance marketplace, availability of subsidies in the individual market and the
prohibition against denying coverage based on pre-existing conditions or historical claims
experience.
The addition of a Medicare prescription drug benefit in 2006 (Medicare Part D) accelerated
Medicare expenditures for pharmaceutical drugs, according to national estimates. Some
analysis shows that after the implementation of Medicare Part D some other health care
expenditures declined for some Medicare beneficiaries who did not have prescription drug
coverage previously. Nonetheless, as the Baby Boom generation ages, total Medicare spending
will grow more in the coming years.
Asked to analyze changes in what the state and federal governments spend on Medicaid
medical services in Colorado over the past decade, CHI found that total medical services
premiums grew by 142 percent, from $1.9 billion in fiscal year (FY) 2003-04 to $4.6 billion in FY
2013-14.4
4 Based on data from the Nov. 1, 2014, Executive Budget Request submitted to the General Assembly by the Colorado Department of Health Care Policy and Financing. “Medicaid medical services premiums” are those funds expended by the state and federal governments to cover Medicaid enrollees’ physical health services.

CCAHC Report to the Colorado General Assembly and Governor’s Office | 18
Spending by Disease or Condition
While Colorado-specific data for spending by disease or condition are not available, the
Commission reviewed national data. Based on other analyses conducted by CHI, it is not
expected that the relative magnitude of spending by disease is substantially different in
Colorado than the rest of the country.
Circulatory conditions, the largest category at $235 billion, accounted for more than 13 percent
of national health care spending in 2010. (See Figure 7.) Ill-defined conditions, those not easily
diagnosed by a physician, and musculoskeletal conditions made up more than 10 percent each
of national health care spending.
Infectious diseases, meanwhile, were the third-smallest category of health care spending at
$58 billion. Pregnancy and childbirth were the lowest at $38 billion.
Figure 7. Medical Services Expenditures by Disease and Condition, U.S., 2010
Condition Annual spending
Circulatory $235 billion
Ill-defined conditions $207 billion
Musculosketal $170 billion
Respiratory $144 billion
Endocrine $126 billion
Nervous system $120 billion
Neoplasms $116 billion
Genitourinary $111 billion
Injury and poisoning $110 billion
Digestive $102 billion
Mental illness $79 billion
Other $70 billion
Infectious and parasitic diseases $58 billion
Skin $38 billion
Pregnancy and childbirth $38 billion
Prices and spending by condition have grown at uneven rates. (See Figure 8.) For example,
spending for circulatory diseases increased by 11 percent annually, but the average prices paid,
or reimbursement rates, went up by 5.6 percent annually. This most likely means that the
remaining increase in spending growth for circulatory diseases has been driven by higher use or
intensity of services, not by unit increases in reimbursement or price increases.
On the other hand, spending on childbirth complications increased by 4.1 percent, while the
prices, or rates paid, went up 4.6 percent. This most likely means that higher prices were the
major driver of increased spending in this area rather than increased demand.

CCAHC Report to the Colorado General Assembly and Governor’s Office | 19
Figure 8.
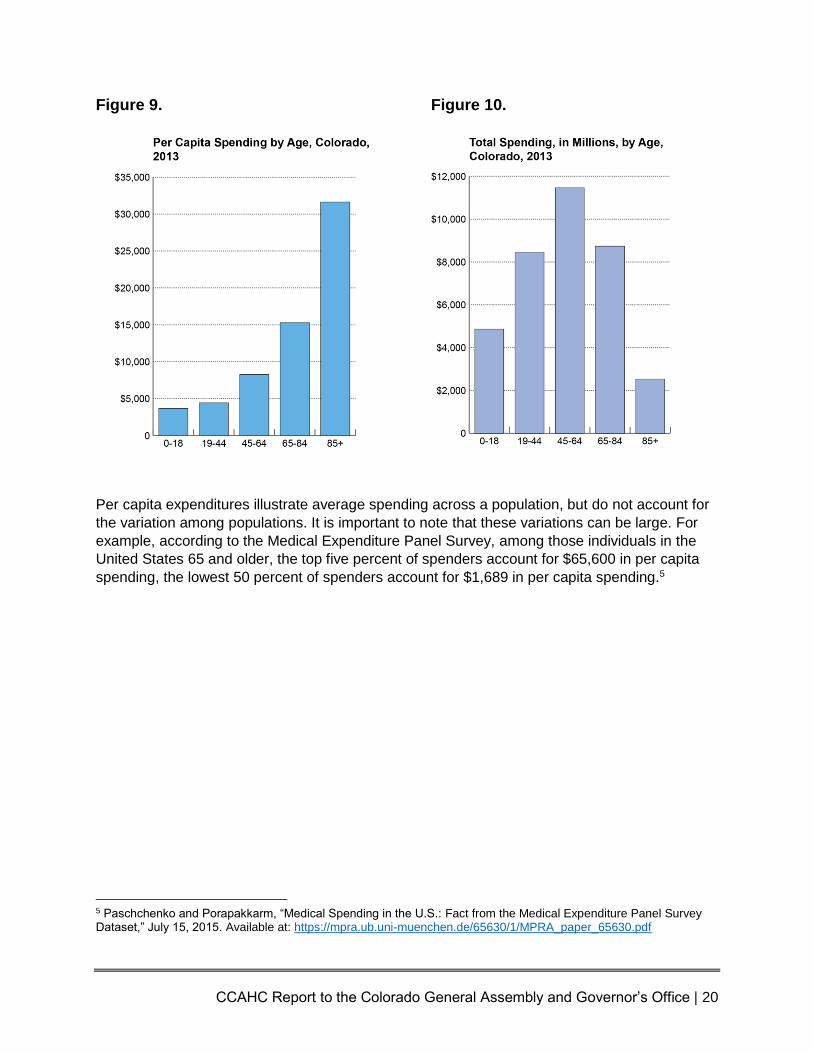
Spending by Age
Health care spending increases with age.
CHI estimated that spending for adults aged 85 and above was about $31,600 on a per capita
basis in 2013, nine times more than children ages 18 and under. (See Figure 9).
When analyzing the rate at which per capita spending increases, essentially telling us when
spending on health care really heads higher, the largest percentage increase — 107 percent —
was between the group aged 65 to 84 and the 85-plus age group.
But the 85-plus age group accounts for just a small share of Colorado’s population — and its
overall health care spending.
Nearly one-third of all health care spending was posted by the 45- to 64-year age group in 2013.
(See Figure 10). Next up was the 65- to 84-year age group at $8.7 billion.
CCAHC Report to the Colorado General Assembly and Governor’s Office | 20
Figure 9.
Figure 10.
Per capita expenditures illustrate average spending across a population, but do not account for
the variation among populations. It is important to note that these variations can be large. For
example, according to the Medical Expenditure Panel Survey, among those individuals in the
United States 65 and older, the top five percent of spenders account for $65,600 in per capita
spending, the lowest 50 percent of spenders account for $1,689 in per capita spending.5
5 Paschchenko and Porapakkarm, “Medical Spending in the U.S.: Fact from the Medical Expenditure Panel Survey Dataset,” July 15, 2015. Available at: https://mpra.ub.uni-muenchen.de/65630/1/MPRA_paper_65630.pdf

CCAHC Report to the Colorado General Assembly and Governor’s Office | 21
VI. The Colorado Framework Colorado, in many ways, has been a national leader in working to rein in health care costs and
spending. It has seen many efforts, some small and some sweeping, to tackle this challenge.
Although there are many programs underway in Colorado to address health care spending, this
is a survey of several programs in Colorado that have shown proven savings. These programs
hold lessons for policymakers moving forward.
Accountable Care Collaborative
Lead Organization: Colorado Department of Health Care Policy and Financing (HCPF) Time Frame: It began in 2011 and is ongoing. Funding Source: Medicaid Big Ideas: Seven Regional Care Collaborative Organizations (RCCOs) are responsible for coordinating care, developing networks, referring patients and reporting data. Medicaid clients assigned to the RCCOs are connected with a primary care medical home where they build a relationship with a provider. Payments are made on a fee-for-service basis, with participating RCCOs and providers getting a base payment plus incentive payments if they reach the program’s targets. Intended Results: Improve member health, improve the experience of members and providers, and contain costs. Key performance indicators include reducing emergency department use, cutting hospital readmissions within 30 days of discharge, using less high-cost imaging, and increasing well-child visits. Actual Results: There have been no savings from children. Participating adults at first used more emergency department care and imaging services and had higher hospital readmissions, but use decreased after six months of enrollment, suggesting a pent-up demand for services among newly insured clients. Savings: Net savings totaled between $29 million and $33 million in FY 2013-14. This is between 0.5 percent and 1 percent of total spending on Medicaid medical services premiums.
21st Century Care
Lead Organization: Denver Health Time Frame: Between 2012 and 2015 Funding Source: Federal Health Care Innovation Challenge Grant from the Centers for Medicare & Medicaid Services (CMS) Innovation Center Big Ideas: Establish a team-based, patient-centered medical home for 130,000 patients at Denver Health. The patients were placed into four tiers of services based on need. Services ranged from simple assistance, such as text message appointment reminders, to more complicated arrangements, such as integrated behavioral health services, complex care coordination, and care transition support, and specialized, high-intensity teams. Intended Results: Over the three-year grant period, Denver Health intended to save money by reducing in-patient and emergency department use; expanding access to care for 15,000 patients; improving overall population health for Denver Health patients. Actual Results: Preliminary results exceeded the access goal of 15,000 people. Among adult high-risk patients, inpatient use dropped. Access to primary care services for adults increased

CCAHC Report to the Colorado General Assembly and Governor’s Office | 22
slightly during this time frame as reported by the Healthcare Effectiveness Data and Information Set (HEDIS).6 Savings: According to an actuarial analysis conducted by Milliman, from November 2012 to December 2013, the program reduced total cost of care by 2 percent and Medicaid managed care spending declined by $6.7 million.7 These results are relative to the overall trend. The annual cost of the program moving forward is $2.8 million which does not include development or pre-existing infrastructure costs.
Bridges to Care
Lead Organization: Metro Community Provider Network Time Frame: Between 2013 and 2015 Funding Source: Healthcare Innovation Challenge Grant from the Centers for Medicare and Medicaid Innovation (CMMI) Big Ideas: Patients in two Aurora ZIP codes with more than three hospital visits in a six-month period were identified and enrolled in a home visit program that provided intensive care coordination, education and mental health services for eight weeks after a hospital admission or emergency room discharge. Intended Result: Better and more cost-effective care for frail seniors and people with disabilities. Actual Results: All users reduced the number of emergency department and hospital admissions. Mid- to high-utilizers saw the greatest decline. More than nine of 10 patients (94 percent) were successfully linked to primary care providers within 60 days after graduating from the program and 89 percent of those who lacked a primary care physician before the class had one after the class was over. Finally, 24 percent of the uninsured participants had health insurance by graduation.
Savings: $1.1 million over a six-month period.8
Colorado Beacon Consortium (CBC)
Lead Organization: Rocky Mountain Health Plans (lead), Quality Health Network, Mesa County Physicians Independent Practice Association, and St. Mary’s Hospital Time Frame: Between 2010 and 2012 Funding Source: U.S. Department of Health and Human Services Big Ideas: Use data to improve medical care in the Grand Junction area by investing in Quality Health Network’s existing health information exchange, allowing it to add new data sources, develop a regional data platform, and deploy high-value applications for community-wide interoperability. Intended Results: Improve quality of care for patients with asthma, diabetes, and heart disease. Reduce unnecessary emergency department visits and hospital admissions. Reduce
6 Colorado Medicaid HEDIS 2014 Results, Statewide Aggregate Report, December 2014. 7 Trend is considered the impact of inflation and policy changes absent the implementation of the initiative. To calculate savings relative to trend, Milliman assumed a 3.7 percent trend factor for Medicaid, consistent with annual rate setting practices. Denver Health’s 21st Century Care project is supported by Grant Number 1C1CMS331064 from the Department of Health and Human Services, Centers for Medicare & Medicaid Services. This analysis does not necessarily represent the official views of the U.S. Department of Health and Human Services or any of its agencies and was conducted by the awardee. Findings may or may not be consistent with or confirmed by the findings of the independent evaluation contractor. 8 Bridges to Care Program Evaluation Final Report. Prepared for Metro Community Providers Network by Smith and Lehman Consulting. Dec. 19, 2014.

CCAHC Report to the Colorado General Assembly and Governor’s Office | 23
health risks associated with obesity and depression. Strengthen a secure health information exchange at the community level. Actual Results: Increase in tobacco counseling, decrease in patients with high cholesterol. Quality Health Network has added three hospital system interfaces and two reference laboratory system interfaces, upgraded or improved four hospital systems, and successfully linked to more than 30 electronic medical record systems used by 150 providers. Savings: At least $3.1 million in hospital readmission spending for Medicaid adults and dual eligible patients (those eligible for both Medicare and Medicaid). Colorado Medicaid awarded $2.2 million in shared savings to CBC participants. Beacon practices, though, had mixed results, with a slight trend toward lower costs for providers 2011, but higher costs in 2012. The results
were inconclusive.9
Colorado’s Blue Ribbon Commission for Healthcare Reform
Recommendations from Colorado’s Blue Ribbon Commission for Healthcare Reform laid the groundwork for health reform in Colorado. Passed by the General Assembly in 2006, it was known as the 208 Commission because it was created by Senate Bill 06-208.10 It was charged with identifying strategies to expand health care coverage and reduce health care costs for Coloradans. Its final report went to lawmakers in January 2008.11
Many of the 208 Commission’s 32 recommendations have been put into practice, either through state action or federal law, notably the Affordable Care Act.
This section classifies each of the recommendations as implemented, partially implemented or not implemented. The classification is based on legislation that has been passed since the 208 Commission ended. (In some cases, sub-recommendations have different classifications, which are noted.)
The numbers on the main recommendations refer to the original sequence of the commission’s final report. The final report was not supported by all of the members of 208 Commission and included two minority reports.
Implemented
1. Slow the rate of growth of employer and private health insurance premiums by covering the uninsured and increasing Medicaid provider reimbursement rates as a means of minimizing cost-shifting. Partially implemented.
a. Reduce uncompensated care by covering at least 85 percent of the uninsured in Colorado. Partially implemented.
b. Reduce cost-shifting by increasing Medicaid provider reimbursements. Partially implemented.
2. Reduce employee health insurance premium costs. Not implemented.
9 Colorado Beacon Consortium Fact Sheet. Office of the National Coordinator for Health Information Technology. Oct. 25, 2012. http://www.healthit.gov/sites/default/files/beacon-factsheet-colorado.pdf 10 State of Colorado website. Blue Ribbon Commission for Healthcare Reform page. http://www.colorado.gov/208commission/ 11 State of Colorado website. Final Report. http://www.colorado.gov/cs/Satellite/BlueRibbon/RIBB/1201542097631

CCAHC Report to the Colorado General Assembly and Governor’s Office | 24
a. Require Colorado employers to establish at least a Section 125 premium-only plan that allows employees to purchase health insurance with pre-tax dollars. Not implemented.
b. Provide sliding scale subsidies for uninsured low-income workers below 400 percent of federal poverty level (FPL; i.e., annual income of about $80,000 for a family of four) to purchase their employer’s plan. Not implemented.
3. Reduce administrative costs. Partially implemented.
a. Require health insurers and encourage all payers in Colorado to use standard claims attachment requirements, eligibility and coverage verification systems, electronic ID cards and prior authorization procedures; and uniform insurance application forms. Adopt nationally-recognized standards that have been accepted by industry groups but not yet implemented. Partially implemented.
b. Combine administrative functions of public health insurance programs (such as Medicaid, CHP+, premium subsidy program, CoverColorado). Partially implemented.
c. Review regulatory requirements on third-party payers and providers with the goal of reducing administrative burden. Not implemented.
4. Increase use of prevention and chronic care management. Partially implemented. a. Where allowed by federal law, allow health insurance premiums to be reduced for
enrollees who engage in healthy behaviors. Partially implemented. b. Eliminate patient copayments for preventive care and reduce patient
copayments for chronic care management services. Partially implemented. c. Encourage employers to provide workplace wellness programs. Partially
implemented. d. Encourage individual responsibility for health, wellness and preventive behavior.
Implemented. e. Increase funding for local public health agencies in Colorado to perform such
functions as preventing disease and injury, assessing community health and promoting healthy behavior. Partially implemented.
5. Conduct a comprehensive review of current Colorado and national long-term care information to understand challenges and opportunities and identify appropriate strategies for reform. Implemented.
6. Improve end-of-life care. Partially implemented.
a. Develop strategies to foster clinically, ethically and culturally appropriate end-of-life care, including palliative and hospice care, based upon best scientific evidence. Partially implemented.
b. Ask patients, upon entry to a nursing home, home health agency or other critical point of access, to complete an advanced directive. Partially implemented.
7. Commission an independent study to explore ways to minimize barriers to such mid-level providers as advanced practice nurses, dental hygienists and others from practicing to the fullest extent of their licensure and training. Implemented.
8. Provide a medical home for all Coloradans. Partially implemented.
a. Enhance the provision, coordination and integration of patient-centered care, including “healthy handoffs.” Implemented.
b. Reimburse providers for care coordination and case management, particularly in the
CCAHC Report to the Colorado General Assembly and Governor’s Office | 25
Medicaid/CHP+ and CoverColorado programs. Partially implemented. c. Provide targeted case management services for Medicaid patients. Partially
implemented.
9. Support the adoption of health information technology. Implemented.
a) Support the creation of a statewide health information network, focusing on interoperability and building upon regional efforts already in place for sharing data among providers. Implemented.
b) Support the creation of an electronic health record for every Coloradan, with interoperability across health plans and hospitals systems and protections for patient privacy. Implemented.
10. Support the provision of evidence-based medicine. Partially implemented.
a. Adopt population-specific care guidelines and performance measures, where they exist, based on existing national evidence-based guidelines and measures, recognizing the importance of patient safety and best care for each patient. Partially implemented.
b. Develop a statewide system aggregating data from all payer plans, public and private. Implemented.
11. Pay providers based on quality. Partially implemented.
a. Pay providers based on their use of care guidelines, performance on quality measures, coordination of patient care and use of health information technology. Partially implemented.
12. Ensure that information on insurer and provider price and quality is available to all Coloradans and that it is easily accessible through a single entry point (e.g., a website). Partially implemented.
a. Make information on insurer and provider price and quality available to all Coloradans and that it is easily accessible through a single entry point. Partially implemented.
b. Require the Colorado Division of Insurance (DOI) to report annually to the legislature regarding financial information on licensed carriers and public programs, including medical loss ratios, administrative costs, etc., by line of business; require Medicaid, CHP+, CoverColorado and other public programs to provide DOI with this information; and require brokers to report their compensation to their clients. Not implemented.
13. Promote consumer choice and direction in the health care system. Partially implemented.
a. Provide a choice of Minimum Benefit Plans, including a Health Savings Account option, for all consumers purchasing in the individual insurance market. Implemented.
b. Create a Connector for individuals and employees. Implemented. c. Increase price and quality transparency. Partially implemented. d. Provide consumers with evidence-based medical information at the point of service
to aid in decision- making through patient-centered care. Partially implemented.
14. Examine and expand the efforts of Colorado communities that have been proven over the years to enhance quality and lower cost. Partially implemented.
15. Create a multi-stakeholder “Improving Value in Health Care Authority.” Partially implemented.
CCAHC Report to the Colorado General Assembly and Governor’s Office | 26
Before implementing the coverage expansions identified in Section 2, the state should establish an Improving Value in Health Care Authority to fundamentally realign incentives in the Colorado health care system to reduce costs and improve outcomes, and identify other means of containing systemic cost drivers. Implemented.
a. Give the Authority rule-making authority to implement the Commission’s recommendations regarding administrative simplification, health care transparency, design of the Minimum Benefit Package and the Consumer Advocacy Program. Partially implemented.
b. Direct the Authority to study and make recommendations to the governor, state legislature and rule- making agencies regarding prevention, end-of-life care, medical homes, health information technology, evidence-based medicine, and provider reimbursement. Partially implemented.
c. Direct the Authority to oversee development of a statewide system aggregating data from all payer plans, public and private, building upon regional systems, or efforts already taking place for sharing data among providers. Implemented.
d. The Authority also should be responsible for assessing and reporting on the effectiveness of reforms, especially their impact on vulnerable populations and safety net health care providers. Partially implemented.
e. Establish the Authority before embarking on the improvements to coverage and access. Implemented.
16. Require every legal resident of Colorado to have at least a Minimum Benefit Plan, with provisions to make the mandate enforceable. Implemented.
a. Require purchase of a Minimum Benefit plan (average monthly premium of approximately $200 for an individual). Implemented.
b. Design and periodically review the Minimum Benefit Plan through the “Improving Value Authority.” Not Applicable.
c. Provide an affordability exemption or consider another mechanism for addressing affordability, such as extending the premium subsidy program to a higher income level. Assuring affordability should include consideration of both premium and out-of-pocket costs. Implemented.
d. Enforce through tax penalty; automatically enroll those who are eligible into fully-subsidized public coverage programs. Partially implemented.
17. Implement measures to encourage employees to participate in employer-sponsored coverage. Not implemented.
a. Require Colorado employers to establish premium-only Section 125 plans that allow employees to purchase health insurance with pre-tax dollars. Not implemented.
b. Provide subsidies for uninsured low-income workers below 400 percent FPL (approximately $80,000 annual income for a family of four) to purchase their employer’s plan. Not implemented.
c. Enforce waiting periods (minimum periods of being uninsured) for eligibility for the premium subsidy program, to discourage employers and employees from dropping employer coverage to enroll in public programs; create exceptions for involuntary loss of coverage, COBRA coverage, or qualifying events, such as marriage or birth. Not implemented.
18. Assist individuals and small businesses and their employees in offering and enrolling in health coverage through creation of a “Connector.” Implemented.

CCAHC Report to the Colorado General Assembly and Governor’s Office | 27
19. Maximize access to/enrollment in private coverage for working lower-income Coloradans who are not offered coverage at the workplace. Implemented.
a. Provide premium subsidies to workers who are not offered coverage at the workplace who earn less than 300 percent FPL (approximately $60,000 annual income for a family of four) for purchase of private health insurance equivalent to CHP+ benefit package. Implemented.
b. Provide premium subsidies to individuals and families who earn between 300-400 percent FPL (between $60,000 and $80,000 annual income for a family of four) such that their premium cost of the Minimum Benefit Plan is no more than 9 percent of their income. (The same subsidy would be available to workers with access to coverage at the workplace.) Implemented.
c. To facilitate enrollment and reduce fraud, use auto enrollment strategies that use existing state data to determine subsidy eligibility (e.g., tax, wage, and nutrition program information). Implemented.
20. Require all health insurance carriers operating in Colorado to offer a Minimum Benefit Plan in the individual market. Partially implemented.
a. Require all health carriers offering health insurance in Colorado to offer a Minimum Benefit Plan in the individual market, with an emphasis on value-based and consumer-directed benefit design. Partially implemented.
21. Guarantee access to affordable coverage for Coloradans with health conditions (implement in conjunction with Recommendation 16). Implemented.
a. Require health insurance companies to issue coverage (guarantee issue) to any individual or family who applies for individual health insurance and who is not eligible for the restructured CoverColorado program due to a high-cost pre-existing condition (“qualified applicant”). Implemented.
b. Allow health insurance companies to set premiums for these individuals and families based on their age and geographic location; disallow the consideration of past and current health conditions. Implemented.
c. Restructure CoverColorado to cover those who apply for coverage, have a specified high-cost health condition as defined by the newly expanded program, and are not eligible for Medicaid, CHP+, or a premium subsidy. Not applicable under the ACA.
22. Merge Medicaid and CHP+ into one program for all parents, childless adults and children (excluding the aged, disabled and foster care eligibles). Partially implemented.
a. Pay health plans at actuarially-sound rates and providers at least CHP+ rates in the new program. Not implemented.
b. For all other Medicaid enrollees, ensure that physicians are reimbursed at least 75 percent of Medicare rates. Partially implemented.
c. Provide the CHP+ benefit and cost-sharing package, including dental, to enrollees in the new program. Provide access to a Medicaid supplemental package, including early and periodic screening, diagnosis and testing (EPSDT) for children, for those who need Medicaid services. Not Implemented.
d. Provide dental coverage up to $1,000 per covered person per year. Implemented. e. Require enrollment in managed care, where available.
CCAHC Report to the Colorado General Assembly and Governor’s Office | 28
23. Improve benefits and case management for the disabled and elderly in Medicaid. Implemented.
a. Encourage enrollment of the aged and disabled into integrated delivery systems that have incentives to manage and coordinate care. Implemented.
b. Promote care delivery in a consumer-directed, culturally competent manner to promote cost-efficiency and consumer satisfaction. Implemented.
c. Increase the number of people served by the home- and community-based programs equal to the number of people on the current waiting list for these services. Implemented.
d. Explore potential for further reforms to Medicaid, particularly for those who are disabled. Implemented.
24. Improve delivery of services to vulnerable populations. Partially implemented.
a. Create a Medicaid buy-in program for working disabled individuals. Implemented. b. Create a Medically-Correctable fund for those who can return to work or avoid
institutionalization through a one-time expense. Not implemented. c. Increase number of people served by the home- and community-based programs
equal to the number of people on the current waiting list for these services. Partially implemented.
d. Provide mental health parity in the Minimum Benefit Plan. Implemented. e. Establish a Medically-Needy or other catastrophic care program for those between
300-500 percent FPL ($30,000 to $50,000 annual income for an individual) to address the issue of people who have health insurance but do not have coverage for catastrophic events (fund at $18 million in state funds). Not implemented.
25. Expand eligibility in the combined Medicaid/CHP+ program to cover more uninsured low-income Coloradans. Partially implemented.
a. Expand Medicaid/CHP+ to cover all uninsured legal residents of Colorado under 205 percent FPL (approximately $42,000 annual income for a family of four). Partially implemented.
b. Expand CHP+ to cover children in families earning up to 250 percent FPL (approximately $51,000 annual income for a family of four). Implemented.
c. Provide assistance with premiums and co-payments to low-income, elderly Medicare enrollees up to 205 percent FPL (approximately $21,000 annual income for an individual). Implemented.
d. Restrict the expansion to adults with less than $100,000 in assets, excluding car, home, qualified retirement and educational accounts, and disability-related assets. Not implemented.
e. Work with the federal government to ensure federal funding for low-income childless adults; do not fund expansion through reduction of services to current Medicaid and CHP+ eligible people. Implemented.
26. Ease barriers to enrollment in public programs. Partially implemented.
a. Use automatic enrollment strategies to increase enrollment, reduce fraud and lower administrative costs; pursue presumptive eligibility where possible. Partially implemented.
b. Provide one-year continuous eligibility to childless adults, parents, and children in the newly merged Medicaid/CHP+ program. Partially implemented.
CCAHC Report to the Colorado General Assembly and Governor’s Office | 29
27. Enhance access to needed medical care, especially in rural Colorado where provider shortages are common. Partially implemented.
a. Continue to pay all qualified safety net providers enhanced reimbursement for serving Medicaid patients. Partially implemented.
b. Explore ways to minimize barriers to such mid-level providers as advanced practice nurses, dental hygienists, and others from practicing to the fullest extent of their licensure and training. Implemented.
c. Promote and build upon the existing statewide nurse advice line. Partially implemented.
d. Expand telemedicine benefits for Medicaid and CHP+ enrollees, especially in rural areas. Partially implemented.
e. Develop and expand mechanisms to recruit and retain health care workers who will provide services in underserved areas of Colorado, such as state-based loan repayment, loan forgiveness programs, tax credits, and other approaches. Implemented.
28. Create a Consumer Advocacy Program including an Ombudsman Program. Partially implemented.
a. Create a program that is independent and consumer-directed to guide people through the system, resolve problems, provide assistance with eligibility and benefit denials, help qualify people on Medicare for Medicaid, and help people qualify for SSI. Partially implemented.
29. Continue to explore the feasibility of giving Coloradans the option to enroll in coverage that will stay with them regardless of life changes, such as the Optional Continuous Coverage Portable Plan that the Commission modeled. Not implemented.
30. Continue to explore the feasibility of allowing employers to offer 24-hour coverage (e.g., all of an employee’s health needs, including health and workers compensation claims, are covered by a single insurer). Not implemented.
31. Adopt these recommendations as a comprehensive, integrated package but do so in stages, increasing efficiency and assuring access before expanding coverage. Partially implemented.
Notable Spending Control Initiatives in Other States
Innovative work is going on across the nation when it comes to health care. This list is a small sample of innovations occurring nationally, with an emphasis on initiatives that have generated the most savings. It includes a diverse array of ideas for both public and private coverage.
California Entity: California Public Employees’ Retirement System (CalPERS) Initiative: Reference pricing for hip and knee replacements. Procedures are fully covered up to the price that most providers charge, but patients pay the difference if they choose a more expensive provider. Findings: CalPERS in 2011 saved an estimated $2.8 million, or 0.26 percent of its total health care spending, for its Anthem enrollees. The limited savings resulted from the fact that few CalPERS enrollees have hip or knee replacements each year — between 450 and 500 — and these procedures account for only about 0.75 percent of CalPERS’s total spending.12
12 http://www.hschange.org/CONTENT/1397/#ib2

CCAHC Report to the Colorado General Assembly and Governor’s Office | 30
Massachusetts Entity: Blue Cross Blue Shield Massachusetts Initiative: Alternative Quality Contract (AQC). The five-year AQC provides rewards to 11 participating physician groups for controlling spending and improving the quality of care delivered to a designated panel of patients. Providers receive a global budget for the entire continuum of care. Findings: AQC patients with a primary care provider saved two percent in the first year and 10 percent by the fourth year compared with a control group. The positive results are because providers used lower cost methods of care and patients used less care.13 Arkansas Entity: Arkansas Medicaid Initiative: Bundled payments for five episodes of care: perinatal; attention deficit hyperactivity disorder; upper respiratory infection; total joint replacement for both hips and knees; and congestive heart failure. Providers share in both savings and excess costs. It is coupled with a medical home model. Findings: 73 percent of Medicaid providers Principle Accountable Providers and 60 percent of Blue Cross Blue Shield Principle Accountable Providers either improved their costs or remained in a commendable or acceptable cost range.14 Maryland Entity: State of Maryland Initiative: Maryland operates the nation’s only all-payer hospital rate regulation system. In this system, all third-party purchasers pay the same rate for hospital services. This is made possible by a Medicare waiver. Findings: The system has limited the growth of per-admission costs, but it has also created pressure to increase the volume of services.15 Illinois Entity: Illinois Department of Healthcare and Family Services Initiative: Illinois Medicaid Redetermination Project. Independent consultants were brought in to verify income, residency, and identity eligibility for all Medicaid applicants. Findings: Around 100,000 people were deemed ineligible, though the state will not save as much money as it had hoped because many of them were not using services.16 Indiana Entity: Indiana Medicaid Initiative: The Healthy Indiana Plan replaced traditional Medicaid in Indiana for all non-disabled adults between the ages of 19 and 64 with consumer-directed health plan options in 2008. Findings: Since 2008, emergency room use has been seven percent less compared with traditional Medicaid,17 preventive care use is similar to commercially-insured customers and more members choose generic drugs compared with the commercially-insured.18
13 https://www.bluecrossma.com/visitor/pdf/avalere-lessons-from-aqc.pdf 14 http://www.achi.net/Content/Documents/ResourceRenderer.ashx?ID=276 15 http://www.cms.gov/Newsroom/MediaReleaseDatabase/Fact-Sheets/2014-Fact-sheets-items/2014-01-10.html 16 https://www.illinoispolicy.org/more-than-100000-medicaid-enrollees-found-ineligible-for-the-program/ 17 Further research needs to be conducted to determine the extent to which co-pays have been collected and impacted utilization.
CCAHC Report to the Colorado General Assembly and Governor’s Office | 31
VII. Next Steps The Commission has covered a great deal of ground since its inception. From assessing the
progress Colorado has made to looking ahead at the most promising avenues for reform, 2015
has been a watershed year for the Commission. That said, the Commission still has a great deal
of work to do to meet its legislative mandate.
The health care arena continues to change at a very rapid pace across the nation and statewide
that the need for recommendations related to cost reduction are timelier now than ever.
In many ways, 2016 is the year the Commission moves beyond studies and seeks direct input
of all Coloradans. The Commission will build off the information received in the questionnaire
and plans to engage more constituents by conducting nine statewide community meetings in the
spring of 2016. The Commission’s statewide outreach meetings and listening sessions will
provide valuable and irreplaceable guidance as its work enters the homestretch. The values and
priorities of everyday Coloradans and health care professionals working on the front lines of
these issues will guide the Commission’s work and final report.
Alongside these outreach efforts, the Commission will continue its work on the identified topic
areas. The Commission and its staff will continue to research not only the challenges facing
Colorado families, businesses, and agencies, but also solutions identified through public
feedback and the Commission’s work.
The Commission’s ability to realize these plans and meet the promise of Senate Bill 14-187 will
depend on additional funding. The Commission’s work, as outlined in this report, is already
bearing fruit. The General Assembly’s commitment to Senate Bill 14-187 and the Commission,
will determine the scope and depth of its final recommendations.
18 https://myshare.in.gov/ISDH/LHDResource/Conference%20Materials/2015%20Public%20Health%20Nurse %20Conference%20Materials/2015%20PHN%20Conference%20Presentations/HIP%202.0.pdf

CCAHC Report to the Colorado General Assembly and Governor’s Office | 32
Appendix A: Methods for Colorado Spending Analysis 2009 –
2013
Colorado-specific data for spending on personal health care by type of service are available only through 2009, while national data are available through 2013.
In order to estimate Colorado spending between 2010 and 2013, CHI compared the extent to which Colorado per capita spending for each type of service exceeded or was below national per capita spending for the same service lines between 2007 and 2009. CHI then applied that difference to the national growth rate for each year between 2010 and 2013 to arrive at a Colorado growth rate.
For example, between 2007 and 2009, per capita spending in Colorado for physician and clinical services was 90.9 percent relative to the growth in national per capita spending. In estimating 2010 Colorado expenditures we applied 90.9 percent to the national growth rate of 2.5 percent to arrive at a Colorado growth rate of 2.2 percent.
After estimating per capita growth rates for each service line for each year, CHI multiplied by the Colorado population to arrive at total state spending.