![Machine Learning for High-Throughput Stress Phenotyping in ... · trichromatic (RGB) [20] imaging in conjunction with advanced autonomous vehicles, have truly ... velocity, and veracity](https://static.fdocuments.in/doc/165x107/5e6bf0eccd491a559a26c050/machine-learning-for-high-throughput-stress-phenotyping-in-trichromatic-rgb.jpg)
Color vision test for dichromatic and trichromatic …...Color vision test for dichromatic and...
15
Color vision test for dichromatic and trichromatic macaque monkeys Kowa Koida* # $ National Institute for Physiological Sciences, Okazaki, Aichi, Japan Electronics-Inspired Interdisciplinary Research Institute, Toyohashi University of Technology,Toyohashi, Aichi, Japan Isao Yokoi* # $ National Institute for Physiological Sciences, Okazaki, Aichi, Japan University for Advanced Studies (SOKENDAI), Okazaki, Aichi, Japan Gouki Okazawa # $ National Institute for Physiological Sciences, Okazaki, Aichi, Japan University for Advanced Studies (SOKENDAI), Okazaki, Aichi, Japan Akichika Mikami # $ Faculty of Rehabilitation, Chubu Gakuin University, Seki, Gifu, Japan Kanthi Arum Widayati # $ Department of Biology, Bogor Agricultural University, Bogor, Indonesia Shigehiro Miyachi # $ Primate Research Institute, Kyoto University, Inuyama, Aichi, Japan Hidehiko Komatsu # $ National Institute for Physiological Sciences, Okazaki, Aichi, Japan University for Advanced Studies (SOKENDAI), Okazaki, Aichi, Japan Dichromacy is a color vision defect in which one of the three cone photoreceptors is absent. Individuals with dichromacy are called dichromats (or sometimes ‘‘color- blind’’), and their color discrimination performance has contributed significantly to our understanding of color vision. Macaque monkeys, which normally have trichromatic color vision that is nearly identical to humans, have been used extensively in neurophysiological studies of color vision. In the present study we employed two tests, a pseudoisochromatic color discrimination test and a monochromatic light detection test, to compare the color vision of genetically identified dichromatic macaques (Macaca fascicularis) with that of normal trichromatic macaques. In the color discrimination test, dichromats could not discriminate colors along the protanopic confusion line, though trichromats could. In the light detection test, the relative thresholds for longer wavelength light were higher in the dichromats than the trichromats, indicating dichromats to be less sensitive to longer wavelength light. Because the dichromatic macaque is very rare, the present study provides valuable new information on the color vision behavior of dichromatic macaques, which may be a useful animal model of human dichromacy. The Citation: Koida, K., Yokoi, I., Okazawa, G., Mikami, A.,Widayati, K. A., Miyachi, S., & Komatsu, H. (2013). Color vision test for dichromatic and trichomatic macaque monkeys. Journal of Vision, 13(13):1, 1–15, http://www.journalofvision.org/13/13/1, doi:10.1167/13.13.1. Journal of Vision (2013) 13(13):1, 1–15 1 http://www.journalofvision.org/content/13/13/1 doi: 10.1167/13.13.1 ISSN 1534-7362 Ó 2013 ARVO Received May 3, 2013; published November 1, 2013 Downloaded From: https://jov.arvojournals.org/pdfaccess.ashx?url=/data/journals/jov/933542/ on 10/29/2018
Transcript of Color vision test for dichromatic and trichromatic …...Color vision test for dichromatic and...

Color vision test for dichromatic and trichromatic macaquemonkeys
Kowa Koida* # $
National Institute for Physiological Sciences, Okazaki,Aichi, Japan
Electronics-Inspired Interdisciplinary Research Institute,Toyohashi University of Technology, Toyohashi, Aichi,
Japan
Isao Yokoi* # $
National Institute for Physiological Sciences, Okazaki,Aichi, Japan
University for Advanced Studies (SOKENDAI), Okazaki,Aichi, Japan
Gouki Okazawa # $
National Institute for Physiological Sciences, Okazaki,Aichi, Japan
University for Advanced Studies (SOKENDAI), Okazaki,Aichi, Japan
Akichika Mikami # $Faculty of Rehabilitation, Chubu Gakuin University, Seki,
Gifu, Japan
Kanthi Arum Widayati # $Department of Biology, Bogor Agricultural University,
Bogor, Indonesia
Shigehiro Miyachi # $Primate Research Institute, Kyoto University, Inuyama,
Aichi, Japan
Hidehiko Komatsu # $
National Institute for Physiological Sciences, Okazaki,Aichi, Japan
University for Advanced Studies (SOKENDAI), Okazaki,Aichi, Japan
Dichromacy is a color vision defect in which one of thethree cone photoreceptors is absent. Individuals withdichromacy are called dichromats (or sometimes ‘‘color-blind’’), and their color discrimination performance hascontributed significantly to our understanding of colorvision. Macaque monkeys, which normally havetrichromatic color vision that is nearly identical tohumans, have been used extensively inneurophysiological studies of color vision. In the presentstudy we employed two tests, a pseudoisochromaticcolor discrimination test and a monochromatic lightdetection test, to compare the color vision of genetically
identified dichromatic macaques (Macaca fascicularis)with that of normal trichromatic macaques. In the colordiscrimination test, dichromats could not discriminatecolors along the protanopic confusion line, thoughtrichromats could. In the light detection test, the relativethresholds for longer wavelength light were higher in thedichromats than the trichromats, indicating dichromatsto be less sensitive to longer wavelength light. Becausethe dichromatic macaque is very rare, the present studyprovides valuable new information on the color visionbehavior of dichromatic macaques, which may be auseful animal model of human dichromacy. The
Citation: Koida, K., Yokoi, I., Okazawa, G., Mikami, A., Widayati, K. A., Miyachi, S., & Komatsu, H. (2013). Color vision test fordichromatic and trichomatic macaque monkeys. Journal of Vision, 13(13):1, 1–15, http://www.journalofvision.org/13/13/1,doi:10.1167/13.13.1.
Journal of Vision (2013) 13(13):1, 1–15 1http://www.journalofvision.org/content/13/13/1
doi: 10 .1167 /13 .13 .1 ISSN 1534-7362 � 2013 ARVOReceived May 3, 2013; published November 1, 2013
Downloaded From: https://jov.arvojournals.org/pdfaccess.ashx?url=/data/journals/jov/933542/ on 10/29/2018
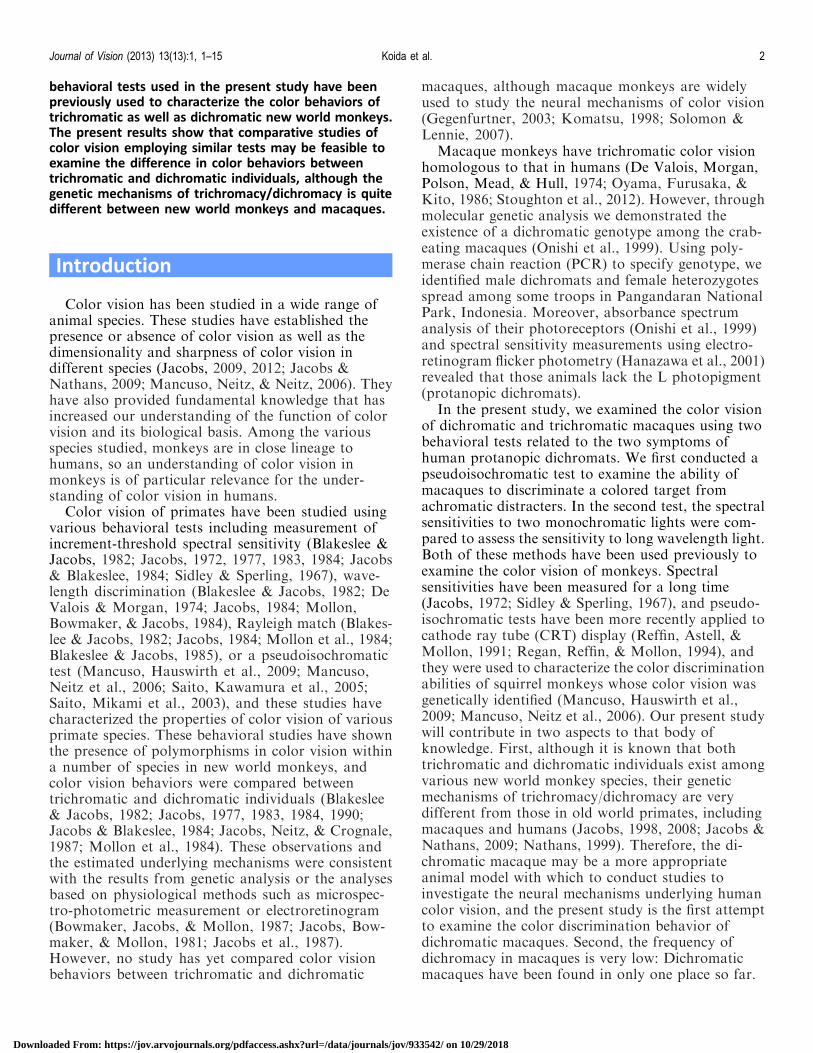
behavioral tests used in the present study have beenpreviously used to characterize the color behaviors oftrichromatic as well as dichromatic new world monkeys.The present results show that comparative studies ofcolor vision employing similar tests may be feasible toexamine the difference in color behaviors betweentrichromatic and dichromatic individuals, although thegenetic mechanisms of trichromacy/dichromacy is quitedifferent between new world monkeys and macaques.
Introduction
Color vision has been studied in a wide range ofanimal species. These studies have established thepresence or absence of color vision as well as thedimensionality and sharpness of color vision indifferent species (Jacobs, 2009, 2012; Jacobs &Nathans, 2009; Mancuso, Neitz, & Neitz, 2006). Theyhave also provided fundamental knowledge that hasincreased our understanding of the function of colorvision and its biological basis. Among the variousspecies studied, monkeys are in close lineage tohumans, so an understanding of color vision inmonkeys is of particular relevance for the under-standing of color vision in humans.
Color vision of primates have been studied usingvarious behavioral tests including measurement ofincrement-threshold spectral sensitivity (Blakeslee &Jacobs, 1982; Jacobs, 1972, 1977, 1983, 1984; Jacobs& Blakeslee, 1984; Sidley & Sperling, 1967), wave-length discrimination (Blakeslee & Jacobs, 1982; DeValois & Morgan, 1974; Jacobs, 1984; Mollon,Bowmaker, & Jacobs, 1984), Rayleigh match (Blakes-lee & Jacobs, 1982; Jacobs, 1984; Mollon et al., 1984;Blakeslee & Jacobs, 1985), or a pseudoisochromatictest (Mancuso, Hauswirth et al., 2009; Mancuso,Neitz et al., 2006; Saito, Kawamura et al., 2005;Saito, Mikami et al., 2003), and these studies havecharacterized the properties of color vision of variousprimate species. These behavioral studies have shownthe presence of polymorphisms in color vision withina number of species in new world monkeys, andcolor vision behaviors were compared betweentrichromatic and dichromatic individuals (Blakeslee& Jacobs, 1982; Jacobs, 1977, 1983, 1984, 1990;Jacobs & Blakeslee, 1984; Jacobs, Neitz, & Crognale,1987; Mollon et al., 1984). These observations andthe estimated underlying mechanisms were consistentwith the results from genetic analysis or the analysesbased on physiological methods such as microspec-tro-photometric measurement or electroretinogram(Bowmaker, Jacobs, & Mollon, 1987; Jacobs, Bow-maker, & Mollon, 1981; Jacobs et al., 1987).However, no study has yet compared color visionbehaviors between trichromatic and dichromatic
macaques, although macaque monkeys are widelyused to study the neural mechanisms of color vision(Gegenfurtner, 2003; Komatsu, 1998; Solomon &Lennie, 2007).
Macaque monkeys have trichromatic color visionhomologous to that in humans (De Valois, Morgan,Polson, Mead, & Hull, 1974; Oyama, Furusaka, &Kito, 1986; Stoughton et al., 2012). However, throughmolecular genetic analysis we demonstrated theexistence of a dichromatic genotype among the crab-eating macaques (Onishi et al., 1999). Using poly-merase chain reaction (PCR) to specify genotype, weidentified male dichromats and female heterozygotesspread among some troops in Pangandaran NationalPark, Indonesia. Moreover, absorbance spectrumanalysis of their photoreceptors (Onishi et al., 1999)and spectral sensitivity measurements using electro-retinogram flicker photometry (Hanazawa et al., 2001)revealed that those animals lack the L photopigment(protanopic dichromats).
In the present study, we examined the color visionof dichromatic and trichromatic macaques using twobehavioral tests related to the two symptoms ofhuman protanopic dichromats. We first conducted apseudoisochromatic test to examine the ability ofmacaques to discriminate a colored target fromachromatic distracters. In the second test, the spectralsensitivities to two monochromatic lights were com-pared to assess the sensitivity to long wavelength light.Both of these methods have been used previously toexamine the color vision of monkeys. Spectralsensitivities have been measured for a long time(Jacobs, 1972; Sidley & Sperling, 1967), and pseudo-isochromatic tests have been more recently applied tocathode ray tube (CRT) display (Reffin, Astell, &Mollon, 1991; Regan, Reffin, & Mollon, 1994), andthey were used to characterize the color discriminationabilities of squirrel monkeys whose color vision wasgenetically identified (Mancuso, Hauswirth et al.,2009; Mancuso, Neitz et al., 2006). Our present studywill contribute in two aspects to that body ofknowledge. First, although it is known that bothtrichromatic and dichromatic individuals exist amongvarious new world monkey species, their geneticmechanisms of trichromacy/dichromacy are verydifferent from those in old world primates, includingmacaques and humans (Jacobs, 1998, 2008; Jacobs &Nathans, 2009; Nathans, 1999). Therefore, the di-chromatic macaque may be a more appropriateanimal model with which to conduct studies toinvestigate the neural mechanisms underlying humancolor vision, and the present study is the first attemptto examine the color discrimination behavior ofdichromatic macaques. Second, the frequency ofdichromacy in macaques is very low: Dichromaticmacaques have been found in only one place so far.
Journal of Vision (2013) 13(13):1, 1–15 Koida et al. 2
Downloaded From: https://jov.arvojournals.org/pdfaccess.ashx?url=/data/journals/jov/933542/ on 10/29/2018
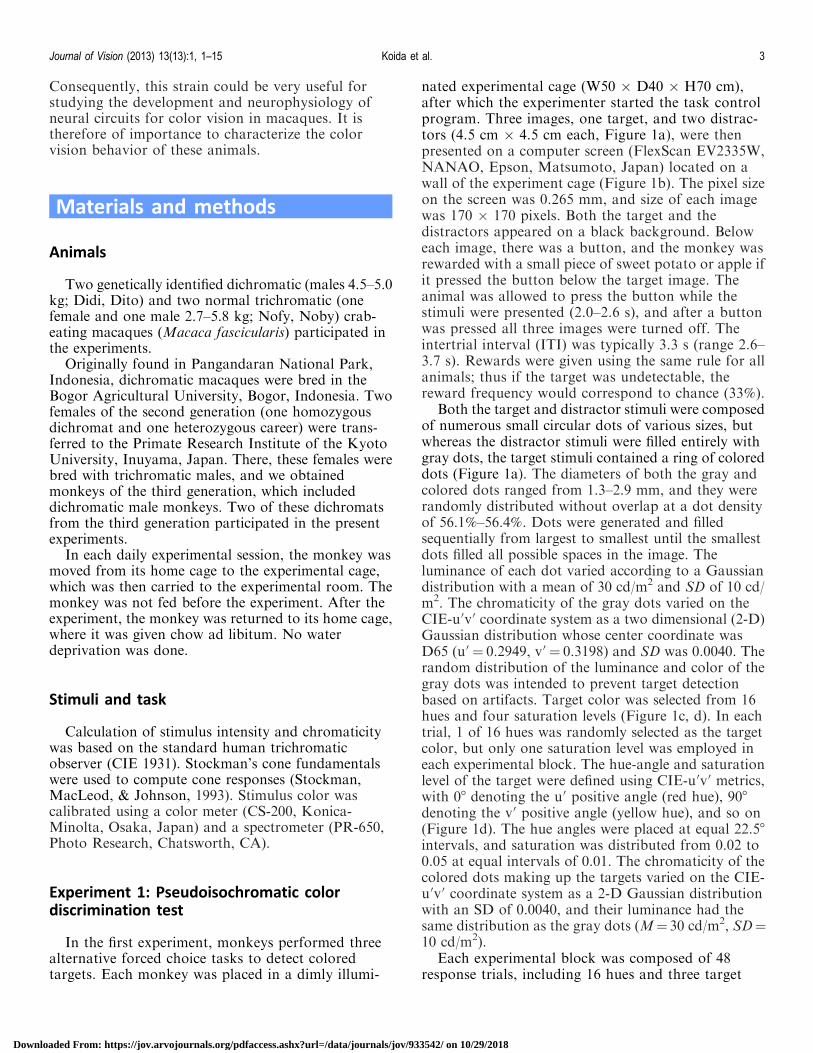
Consequently, this strain could be very useful forstudying the development and neurophysiology ofneural circuits for color vision in macaques. It istherefore of importance to characterize the colorvision behavior of these animals.
Materials and methods
Animals
Two genetically identified dichromatic (males 4.5–5.0kg; Didi, Dito) and two normal trichromatic (onefemale and one male 2.7–5.8 kg; Nofy, Noby) crab-eating macaques (Macaca fascicularis) participated inthe experiments.
Originally found in Pangandaran National Park,Indonesia, dichromatic macaques were bred in theBogor Agricultural University, Bogor, Indonesia. Twofemales of the second generation (one homozygousdichromat and one heterozygous career) were trans-ferred to the Primate Research Institute of the KyotoUniversity, Inuyama, Japan. There, these females werebred with trichromatic males, and we obtainedmonkeys of the third generation, which includeddichromatic male monkeys. Two of these dichromatsfrom the third generation participated in the presentexperiments.
In each daily experimental session, the monkey wasmoved from its home cage to the experimental cage,which was then carried to the experimental room. Themonkey was not fed before the experiment. After theexperiment, the monkey was returned to its home cage,where it was given chow ad libitum. No waterdeprivation was done.
Stimuli and task
Calculation of stimulus intensity and chromaticitywas based on the standard human trichromaticobserver (CIE 1931). Stockman’s cone fundamentalswere used to compute cone responses (Stockman,MacLeod, & Johnson, 1993). Stimulus color wascalibrated using a color meter (CS-200, Konica-Minolta, Osaka, Japan) and a spectrometer (PR-650,Photo Research, Chatsworth, CA).
Experiment 1: Pseudoisochromatic colordiscrimination test
In the first experiment, monkeys performed threealternative forced choice tasks to detect coloredtargets. Each monkey was placed in a dimly illumi-
nated experimental cage (W50 · D40 · H70 cm),after which the experimenter started the task controlprogram. Three images, one target, and two distrac-tors (4.5 cm · 4.5 cm each, Figure 1a), were thenpresented on a computer screen (FlexScan EV2335W,NANAO, Epson, Matsumoto, Japan) located on awall of the experiment cage (Figure 1b). The pixel sizeon the screen was 0.265 mm, and size of each imagewas 170 · 170 pixels. Both the target and thedistractors appeared on a black background. Beloweach image, there was a button, and the monkey wasrewarded with a small piece of sweet potato or apple ifit pressed the button below the target image. Theanimal was allowed to press the button while thestimuli were presented (2.0–2.6 s), and after a buttonwas pressed all three images were turned off. Theintertrial interval (ITI) was typically 3.3 s (range 2.6–3.7 s). Rewards were given using the same rule for allanimals; thus if the target was undetectable, thereward frequency would correspond to chance (33%).
Both the target and distractor stimuli were composedof numerous small circular dots of various sizes, butwhereas the distractor stimuli were filled entirely withgray dots, the target stimuli contained a ring of coloreddots (Figure 1a). The diameters of both the gray andcolored dots ranged from 1.3–2.9 mm, and they wererandomly distributed without overlap at a dot densityof 56.1%–56.4%. Dots were generated and filledsequentially from largest to smallest until the smallestdots filled all possible spaces in the image. Theluminance of each dot varied according to a Gaussiandistribution with a mean of 30 cd/m2 and SD of 10 cd/m2. The chromaticity of the gray dots varied on theCIE-u0v0 coordinate system as a two dimensional (2-D)Gaussian distribution whose center coordinate wasD65 (u0 ¼ 0.2949, v0 ¼ 0.3198) and SD was 0.0040. Therandom distribution of the luminance and color of thegray dots was intended to prevent target detectionbased on artifacts. Target color was selected from 16hues and four saturation levels (Figure 1c, d). In eachtrial, 1 of 16 hues was randomly selected as the targetcolor, but only one saturation level was employed ineach experimental block. The hue-angle and saturationlevel of the target were defined using CIE-u0v0 metrics,with 08 denoting the u0 positive angle (red hue), 908denoting the v0 positive angle (yellow hue), and so on(Figure 1d). The hue angles were placed at equal 22.58intervals, and saturation was distributed from 0.02 to0.05 at equal intervals of 0.01. The chromaticity of thecolored dots making up the targets varied on the CIE-u0v0 coordinate system as a 2-D Gaussian distributionwith an SD of 0.0040, and their luminance had thesame distribution as the gray dots (M¼ 30 cd/m2, SD¼10 cd/m2).
Each experimental block was composed of 48response trials, including 16 hues and three target
Journal of Vision (2013) 13(13):1, 1–15 Koida et al. 3
Downloaded From: https://jov.arvojournals.org/pdfaccess.ashx?url=/data/journals/jov/933542/ on 10/29/2018

positions, and the number of target positions wasbalanced across three possible locations in each block.If the monkey made an incorrect response, a trial withthe same target was repeated once, but the response inthe repeated trial was not included in the subsequentanalysis. The animals freely watched the screen, so thevisual distance was not fixed, but it was usuallybetween 10 and 30 cm. The number of trials theanimals performed in a daily session ranged from 50to 600. The number of trial repetitions for eachstimulus ranged from 9 to 56, and the median for each
monkey was 19 (Didi), 29 (Dito), 28 (Nofy), and 33(Noby).
Experiment 2: Detection test formonochromatic lights
In the second experiment, monkeys performed alight detection task (Figure 2a). The stimulus was asingle circular light with a diameter of 8 mm. Thestimulus light was produced by either an orange light
Figure 1. Stimuli used in Experiment 1 (pseudoisochromatic test). (a) Example of a stimulus used for Experiment 1. Each stimulus
consisted of three images, one target (center image in this example), and two distractors. Both the target and the distractors were
composed of small circular gray dots with varying luminance, but only the target contained a colored ring. (b) Photograph showing
the inside of the experiment cage. Stimuli were presented on a computer screen located on one wall, with three response buttons
located just below the images. A piece of sweet potato or apple was presented in a tray at the bottom when the monkey made a
correct response. (c) The color of the target ring was determined from the CIE u0v0 chromaticity diagram. Sixteen evenly distributed
hues were used (open circles with dots). Here only the most saturated colors are shown. A dot at the center denotes the neutral
background color. A blue triangle indicates the color gamut of the display. (d) Chromaticity coordinates for all 64 target colors, which
consisted of 16 hues and four saturation levels (crosses). Circles indicate the standard deviation of the color jittering of the target.
Journal of Vision (2013) 13(13):1, 1–15 Koida et al. 4
Downloaded From: https://jov.arvojournals.org/pdfaccess.ashx?url=/data/journals/jov/933542/ on 10/29/2018

emitting diode (LED, 592 nm, HWHM 8 nm) or ared solid-state laser (660 nm, HWHM 4 nm, Figure2b), which were situated within an integrating sphere.To improve uniformity, a white diffuser was placedat the aperture of the integrating sphere, which alsocontained a white LED (CIE x ¼ 0.3611, y ¼ 0.3814)with a broad spectrum (Figure 2b) that was alwayson, making the background luminance of the diffuser2.0 cd/m2. The inside of the experiment cage was verydimly illuminated, and the animals could easilyrecognize the location of the stimulus from the whitebackground. The orange or red light, flickering at 10Hz, was added to the white background light andwas presented for 1000 ms. The flickering was addedto facilitate detection. The monkey was rewardedwhen it pressed the button below the stimulus whilethe orange or red flickering light was on. The ITI wastypically 3.3 s (range, 2.7–3.9 s). If the monkey madeno response, the ITI was shortened and thesubsequent stimulus was displayed with an averageITI of 1.2 s. The animal’s behavior was carefullymonitored, and when the animal did not look at thescreen for several seconds, the experimenter sus-pended the experiment-control program to reduce theunintended miss responses. The effect of thissuspension was not dependent on the specific stimulibecause the suspension was made solely based on themonkey’s behavior and not on the stimulus present-ed. Furthermore, the next stimulus was randomlyselected by the computer, and the experimenter couldnot know the stimulus that would be presented whenthe task is restarted. Both the intensity and the
wavelength of the target stimulus were randomlyselected from five levels of orange light (0.12, 0.50,2.0, 8.0, 32.0 mW/sr/m2 in radiance, or 0.06, 0.25,1.0, 4.0, 16.0 cd/m2 in luminance) and four levels ofred light (0.75, 3.0, 12.0, 48.0 mW/sr/m2 in radiance,or 0.03, 0.13, 0.50, 2.0 cd/m2 in luminance). Theintensity of the stimulus light was controlled by theelectrical current. Rod photoreceptors may havemade some contribution to the stimulus detection,because the luminances of the stimulus and back-ground were relatively low. However, this would notaffect our main conclusion, if the difference in thesensitivities is observed between trichromats anddichromats. It should be explained only by thepresence or absence of L cones. The animalsperformed between 50 and 300 trials daily. Thenumber of trial repetitions for each stimulus rangedfrom 13 and 50, and the median for each monkeywas 30 (Didi), 40 (Dito), 26 (Nofy) and 49 (Noby).
Training
The animals were initially trained to associate abutton press with a reward. Subsequent training foreach experiment was as follows.
For the color discrimination task (Experiment 1),the colored ring of the target stimulus initially had alarge luminance contrast and highly saturated colors.The colors of the targets were yellow, green, blue,and purple, which do not overlap with any dichro-matic confusion lines. Gradually, the luminance
Figure 2. Stimuli used in Experiment 2 (light detection task). (a) The target color was displayed through the aperture of an integrating
sphere. Red (660 nm) light is presented in this example (arrow). (b) Spectra of the two monochromatic lights used in Experiment 2.
Peaks were at 660 nm (red) and 592 nm (orange). Spectrum of white background LED light is also shown (gray line) that was installed
in the integrating sphere and was turned on throughout the experiment. In addition, cone fundamentals in humans (red [L], green
[M], and blue [S] thin lines) and estimated spectrum of the hybrid M cone of dichromats (Mþ 6), in which the peak is shifted 6 nm
toward longer wavelengths (Onishi et al., 1999) are shown.
Journal of Vision (2013) 13(13):1, 1–15 Koida et al. 5
Downloaded From: https://jov.arvojournals.org/pdfaccess.ashx?url=/data/journals/jov/933542/ on 10/29/2018
contrast was reduced, while the color was kept thesame, and jittering of the color and the luminance ofeach circular dot was added. Thereafter, the colorcontrast was gradually reduced from a CIE-u 0v 0
distance of 0.07 to a distance of 0.02. The final colorcontrast (0.02) was the same as the most desaturatedstimuli used in the main experiment. Training tookone week.
For the detection task (Experiment 2), a brightorange (.10 cd/m2, or 20 mW/sr/m2) or red (.2 cd/m2,or 48 mW/sr/m2) target light was used initially, andthen the luminance was gradually reduced to estimatethe detection threshold. This took about eight days.The animals were then trained for 2 days to perform thedetection task using the method of constant stimuliwith the same set of stimuli used in the mainexperiment. Following this training, the main experi-ment was conducted.
All the experiments were approved by the ethicscommittee of the Primate Research Institute ofKyoto University, where all of the experiments wereperformed. All procedures for animal care andexperimentation were in accordance with the U.S.National Institutes of Health Guide for the Care andUse of Laboratory Animals (1996) and adhere to theARVO Statement for the Use of Animals in Ophthal-mic and Visual Research.
Results
Experiment 1: Pseudoisochromatic colordiscrimination test
Color discrimination performance was comparedbetween dichromatic and trichromatic monkeys. Foreach target color, the error rate is shown as thediameter of a circle in Figure 3. We expected that thedichromats would make errors more frequently andconsistently along the color confusion line, while thetrichromats would not. We first focused on the huedependency of the errors. For both dichromatstested, numerous errors were observed in thehorizontal direction on the CIE-u 0v 0 chromaticitydiagram (red and cyan hues) (Figure 3a, b). Even forhighly saturated colors, corresponding to outerpositions in the diagram, their performance was atthe chance level (67% error, filled symbols; p . 0.05,Fisher’s exact test). The center of the error distribu-tion was displaced slightly downward from the 08 to1808 line, and errors were more frequently observedin the lower half of the diagram. Comparing therightward (red hue) and leftward (cyan hue) direc-tions, errors were observed more frequently in theleftward direction. This asymmetry will be considered
in the Discussion. Very small numbers of errors wereobserved in directions other than horizontal (e.g., 458to 1358, orange-green hue, or 2258 to 3158, blue-purple hue). For these other hue directions, evencolors with low saturation, corresponding to innerpositions in the diagram, yielded only small numbersof errors, which were significantly lower than chance(open symbols; p , 0.05, Fisher’s exact test). Whenwe compared the monkeys’ discrimination perfor-mances along the color confusion lines with those ofthe two major types of dichromatic humans, namelyprotanope and deuteranope, it was clear that thedirection where the animals made frequent errors wasmore consistent with the human protanopic confu-sion line than the deuteranopic one (Figure 3; Smith& Pokorny, 1975).
The results obtained with the trichromatic monkeysdiffered considerably from those of the dichromats.For trichromats, error responses were observed over abroad range of hue directions, with the highest errorrates reaching the chance level for low-saturationcolors (Figure 3c, d): 112.58 and 1358 (green hue) formonkey Nofy (Figure 3c) and 2258 and 2708 (blue hue)for monkey Noby (Figure 3d). These directions werenot consistent between the two animals and did notcorrespond to any color confusion lines in dichromatichumans. In both trichromats, better performance wasconsistently observed for reddish hues (right side ofthe diagram) than for cyanish hues (left side ofdiagram). Potential causes of this bias will beconsidered in the Discussion.
To quantitatively evaluate the difference in themonkeys’ performance, we computed and comparedthe discrimination threshold across different hues,which is an effective way to highlight the differencebetween dichromats and trichromats (Mancuso,Hauswirth et al., 2009; Mancuso, Neitz et al., 2006).To compute discrimination thresholds, we firstcalculated the psychometric function for each hueusing the least squares fit of the cumulative Gaussianfunction for the data, after which the discriminationthreshold was determined as the saturation levelwhere the performance corresponded to 67% correctresponses (Figure 3e). Fitting and threshold calcula-tions were made on the log CIE-u 0v 0 distance. Whenthe monkey did not make an error at any saturationlevel (e.g., yellow hue for monkey Didi, Figure 3a),the fitting failed, and we instead assigned theminimum threshold observed for other hues. Com-parison of the threshold between dichromats andtrichromats showed clear dissociation (Figure 3f).The dichromats exhibited noticeable threshold ele-vation in two hue directions, whereas the trichromatsdid not. The hue angles where elevated thresholdswere observed were 08 and 1808 (red and cyan hue,respectively) that seem to better correspond to the
Journal of Vision (2013) 13(13):1, 1–15 Koida et al. 6
Downloaded From: https://jov.arvojournals.org/pdfaccess.ashx?url=/data/journals/jov/933542/ on 10/29/2018

protanopic confusion line (4.18 and 184.18) than withthe deuteranopic confusion line (170.68 and 350.68).
We quantitatively estimated the confusion anglefrom the color discrimination thresholds for all testedhue directions through least square fitting using the n-th power of the cosine function with four freeparameters: phase, multiplier, amplitude, and offset.The phases of the best-fitted function for the dichromatswere�1.788 for Didi and�0.888 for Dito. These valuesare more similar to the angle of the protanopicconfusion line (4.18) than to the deuteranopic line(�9.48), which confirms the aforementioned observa-tions.
Experiment 2: Detection test formonochromatic lights
Detection performance was measured as a functionof luminance range from 0.12 to 48.0 mW/sr/m2
(Figure 4a through d). To examine the difference inthe response quantitatively, we performed a general-ized multiregression analysis, and determined thedetection threshold for each light. Maximum likeli-hood fitting of the logistic equation as a function ofthe log luminance was performed using the glmfitcommand in MATLAB. Fitting was performedseparately for each target color; thus both theintercept and slope coefficients were estimatedindependently. For better fitting, the upper and lowerlimits of the function were not assigned 0 and 1;instead minimum and maximum observed responserates for each animal were used as asymptotes, takinginto account the floor and ceiling of the response.The same asymptotes were settled for both the redand orange lights. Although three monkeys mostlymissed targets with low luminance, one monkeyresponded to many (about 40%) of the low lumi-nance targets, and detection performance for lowluminances did not reach zero (Dito, Figure 4b). Thismonkey also made many responses before stimulusonset. After the fitting, the threshold was determinedas the luminance corresponding to the response levelat the midpoint between the upper and lowerextremes, and the observed thresholds were distrib-uted from 0.5 to 25 mW/sr/m2 (Figure 4e). Theabsolute values of these thresholds differed amongthe animals and stimuli. Inferring from a protanopichuman observer, one might expect that loss ofsensitivity to long wavelength light might result in ahigher threshold for both the orange and red lights indichromats, as compared to trichromats. However noconsistent elevation in absolute threshold was ob-served with dichromatic macaques. This is likely dueto the fact that the absolute threshold depends on thecriteria or behavioral strategy of each monkey. We
therefore focused on the relative threshold betweenthe orange and red lights, because the red targetwould induce a larger elevation in detection thresh-old than the orange light. The relative thresholdbetween stimuli showed clear segregation betweengroups.
To illustrate the relative threshold for each animal,the threshold for the red light was normalized to thatfor the orange light (Figure 4f). Both dichromatsshowed a higher relative threshold than the trichro-mats. To assess the significance of the differencebetween the two groups, the thresholds were esti-mated separately for different experiment sessions(small symbols in Figure 4f), which revealed asignificant difference between the two groups (p ,0.01, t test).
Discussion
In the present study, we compared the color visionof dichromatic and trichromatic macaque monkeysusing two behavioral tests. These tests have beenused previously to characterize the color visionbehavior of normal macaques as well as trichromaticand dichromatic new world monkeys, but this is thefirst attempt to characterize the color vision behaviorof dichromatic macaques. The present results showthat comparative studies of color vision employingsimilar tests may be feasible to examine the differencein color behaviors between trichromatic and dichro-matic individuals, although the genetic mechanismsof trichromacy/dichromacy is quite different betweennew world monkeys and macaques. In addition, thedichromatic macaque is very rare, with only onestrain being confirmed so far. Thus the present studyprovides valuable information on the color visionbehavior of dichromatic macaques, which has thepotential to be a useful animal model of humandichromacy.
We compared color discrimination performancebetween trichromatic and dichromatic (protanopic)genotypes in macaque monkeys and found clearsegregation between two groups. The dichromatsshowed color confusion along the protanopic confu-sion line in a pseudoisochromatic color discrimina-tion test, while the trichromats did not (Experiment1). In addition, when we compared the animals’sensitivity to two monochromatic lights, the dichro-mats showed lower relative sensitivity to long-wavelength light than did the trichromats. Theseresults are consistent with the two major difficultiesreported in human protanopes (Ruddock, 1991;Sharpe, Stockman, Jagle, & Nathans, 1999; Wyszecki& Stiles, 1982). In the context of our earlier genetic
Journal of Vision (2013) 13(13):1, 1–15 Koida et al. 7
Downloaded From: https://jov.arvojournals.org/pdfaccess.ashx?url=/data/journals/jov/933542/ on 10/29/2018

Figure 3. Color discrimination performance of two dichromats (a, b) and two normal trichromats (c, d) in Experiment 1. Error
response rates are indicated by the size of the red circles at the point corresponding to the chromaticity coordinates of the target
color. Significant deviation from chance (0.67) is shown by an open circle ( p , 0.05, Fisher’s exact test); otherwise the circle is filled.
Magenta lines denote the protanopic color confusion lines in humans. One line (middle one) passes through the neutral point.
�
Journal of Vision (2013) 13(13):1, 1–15 Koida et al. 8
Downloaded From: https://jov.arvojournals.org/pdfaccess.ashx?url=/data/journals/jov/933542/ on 10/29/2018

Figure 4. Detection of two monochromatic lights by two dichromats (a, b) and two normal trichromats (c, d) in Experiment 2. The
relationship between the radiance and the response rates, together with the fitted logistic functions for the red (circles and solid line)
and orange (diamonds and dotted line) targets are shown. (e) Detection thresholds for orange and red stimuli for two dichromats
(circles) and two normal trichromats (triangles) were determined using the midpoint of the fitted functions. (f) Relative thresholds of
the orange and red lights for each monkey. Small symbols indicate the relative thresholds estimated separately from the different
experimental sessions. An asterisk indicates significant difference ( p , 0.05, t test).
Green lines denote the deuteranopic color confusion lines. Protanopic confusion lines gradually converge as they move to the right;
ultimately, they will converge into a point, the protanopic confusion point, beyond the boundary of this Figure. Deuteranopic
confusion lines converge gradually as they move to the left. (e) Relationship between the saturation level and the rate of correct
responses by monkey Nofy for four hue angles (red: 08, yellow: 908, cyan: 1808, violet: 2708). Shown are rates of correct responses
with error bars of the 95% confidence interval plotted in relation to the saturation level and fitted psychometric functions. The
saturation level was determined as the CIE- u0v0 distance from the neutral point. A horizontal gray line indicates chance level (0.33).
(f) Color discrimination threshold for each hue angle. Arrowheads indicate the angle of the confusion lines for protanopes (P) and
deuteranopes (D).
Journal of Vision (2013) 13(13):1, 1–15 Koida et al. 9
Downloaded From: https://jov.arvojournals.org/pdfaccess.ashx?url=/data/journals/jov/933542/ on 10/29/2018

analysis (Onishi et al., 1999) and electroretinogrammeasurements (Hanazawa et al., 2001), the presentresults add behavioral evidence indicating thatgenotypically identified protanopic macaques doindeed manifest protanopic phenotypes. In thefollowing sections, however, we will consider severalfactors that may have affected the monkeys’ behaviorand obscured the results.
Advantages of dichromacy and disadvantages oftrichromacy
One confounding result was that trichromats madenumerous errors in the color discrimination task(Experiment 1). In fact, the average performance ofthe trichromats was not better than that of thedichromats; the mean accuracy of the two groupsacross all color sets was the same (82% and 82% fordichromats, 81% and 84% for dichromats). Since it isinevitable that errors would be made by dichromatsaround the confusion hues, our finding that theiraverage performance is the same as that of thetrichromats seems curious.
The observed performance similarity cannot beexplained by a difference in training because thenumber of training days and time course of trainingwas the same for all animals. Assuming that colordiscrimination along the confusion line is very difficultfor the dichromats, these animals may be motivated todiscriminate other hues, even at low saturation levels,to compensate for the inevitable loss of reward aroundthe confusion line. This compensatory effect mighthave balanced the mean performance between thedichromats and trichromats. Consistent with thatidea, we observed that the dichromats exhibitedexcellent discrimination among yellow and blue hues(top and bottom directions in Figure 3a, b), even atthe very beginning of the experiment, whereas theperformance of the trichromats gradually improved asthe experiment progressed (see Appendix).
One might be concerned that in Experiment 1, someanimals would learn to use the spatial distribution ofindividual phosphors on the screen as the cue if theanimals were allowed to get very close to the screenand dichromatic monkeys may have used such cue.We think it is highly unlikely that the animals haveused the information of the spatial distribution ofindividual phosphors to perform the task. First, thesize of a single pixel was 0.265 mm (96 dots per inch[dpi]), and each phosphor (red, green, and blue) hasthree times finer resolution (288 dpi), too fine to berecognized. Second, even if each phosphor wererecognizable, this would result in only a very slightpositional shift of the colored pixels relative to thegray pixels. Such a positional shift in the phosphors
would provide no information toward solving the taskbecause each dot is randomly positioned within eachimage.
One possible explanation for the performancesimilarity is the lack of color masking in dichromats.In the present study, color jittering in the stimulus andgray background dots would work as noise and shoulddeteriorate discrimination performance. However, nomasking effect due to color jittering along the L-Mcone axis was detectable in dichromats, which wouldbenefit the performance of those animals. This issimilar to results obtained from human dichromats,who exhibit an advantage with control Ishihara plates(plates 18–21 in the 10th Edition, London: KaneharaShuppan). In these plates, the figural element is easilyseen by dichromats through activation of S cones, butis not readily seen by most trichromats due to maskingby strong L/M signals.
Finally, the excellent color discrimination by di-chromats of yellow and blue hues may be an ordinarycharacteristic of dichromats, attributable to processingin the central nervous system. To solve the colordiscrimination task in the present study, some spatialgrouping or integration of color signals and compar-ison between the target and distractors is required, andthis likely involves color processing at the cortical level.Although this is speculation, the dichromats maydevote more resources to processing the residual colorsignal, namely the yellow-blue signal, assuming thatboth trichromats and dichromats have the sameneuronal resources for color information processing inthe cortex. As a result, the dichromats may acquiresuperior color discrimination for yellow and blue hues.
There are reports showing advantages of dichro-macy over trichromacy for some behaviors (Morgan,Adam, & Mollon, 1992; Saito, Mikami et al., 2005;Sharpe, de Luca, Hansen, Jagle, & Gegenfurtner,2006). In those experiments, the advantage wasobserved when subjects were detecting targets definedby luminance and were breaking color-camouflage(Morgan et al., 1992; Saito, Mikami et al., 2005), andit was explained by the greater capacity of protanopesto use luminance cues (Sharpe et al., 2006). However,the task and stimuli in those studies were verydifferent from those in our present experiments. Theadvantage of dichromatism for color discriminationwill be an important topic of future research, and thedichromatic macaque strain may be a useful resourcefor conducting such studies.
Applicability of humans’ color-matchingfunction
Another confounding result in trichromats is thenonuniformity of the color discrimination threshold,
Journal of Vision (2013) 13(13):1, 1–15 Koida et al. 10
Downloaded From: https://jov.arvojournals.org/pdfaccess.ashx?url=/data/journals/jov/933542/ on 10/29/2018

as shown in Experiment 1. Given that the CIE-u 0v 0
color space reflected the metrics of human colordiscrimination performance (Wyszecki & Stiles,1982), color discrimination thresholds for differenthues were expected to be uniform. However, weobserved a consistent tendency for the thresholdaround reddish hues to be lower than around otherhues. The stimuli used in the present study weredetermined based on their chromaticity and lumi-nance, which are based on human standard observ-ers. Although macaque monkeys have photoreceptorshomologous to humans, and much primate researchhas adopted the color space determined for humans,some differences have also been reported. In ma-caques, for example, the L : M cone ratio and theequiluminance point along the red-green line isdifferent from those in humans (typical M ¼ 1.8 inMacaca fascicularis vs. M ¼ 2.0 in humans, rangingfrom 0.3 to 19.0; Albrecht, Jagle, Hood, & Sharpe,2002; Bowmaker & Dartnall, 1980; Brainard, Cal-derone, Nugent, & Jacobs, 1999; Carroll, McMahon,Neitz, & Neitz, 2000; Carroll, Neitz, & Neitz, 2002;Cicerone & Nerger, 1989; Dartnall, Bowmaker, &Mollon, 1983; de Vries, 1949; Hagstrom, Neitz, &Neitz, 1998; Hofer, Carroll, Neitz, Neitz, & Williams,2005; Kremers, Scholl, Knau, Berendschot, Usui, &Sharpe, 2000; Kremers, Usui, Scholl, & Sharpe, 1999;Rushton & Baker, 1964; Yamaguchi, Motulsky, &Deeb, 1997). In addition, the relative sensitivity tolong wavelength light is weaker in macaques (Deeb,Diller, Williams, & Dacey, 2000; Dobkins, Thiele, &Albright, 2000). However, it is unlikely such speciesdifferences are the cause of the observed nonunifor-mity in discrimination thresholds. Even if the L : Mcone ratios did significantly differ across species, thiswould only affect the discrimination threshold alongthe L-M axis, which would result in nonuniformthresholds elliptically elongated or contracted alongthe L-M axis. Contrary to this expectation, however,the observed color discrimination threshold did notelongate along a particular axis, but asymmetricallyrose at specific angles (Figure 3c, d). It has also beenreported that the retinal densities of S cones differbetween macaques and humans (Calkins, 2001). Thiswould predict shifts in the discrimination thresholdalong the S-cone axis, but again the observedthresholds did not show this tendency. It is thereforeunlikely that the present results can be explainedbased on retinal architecture.
A discrepancy between the results expected fromthe standard luminous function and the trichromat’sperformance was also observed in Experiment 2. Ifdetection performance reflects luminous efficiency,their relative threshold would be 12.0. However,observed thresholds in the trichromats significantlydiffered from the prediction. One possibility is that the
better performance with the red light might reflect thecharacteristics of the incremental threshold. In thepresent experiment, white light (2.0 cd/m2) was addedas a pedestal for the target; thus the incrementaldetection threshold was measured in the detectiontask. The spectral sensitivity determined by theincremental threshold is known to differ from thestandard luminous function, which is derived fromflicker photometry (King-Smith & Carden, 1976). Inthe experiment measuring the incremental thresholdon a white background, the amount of added colorsignal will help the detection of the target, even if theluminance contrast is insufficient for the detection. Inaddition, the color signal will change the saturation ofthe stimulus color, which may in turn affect theperceived brightness of the stimulus, regardless of theluminance change. Such extra brightness is related tothe Helmholtz-Kohlraush effect (Wyszecki & Stiles,1982) and may result in deviation of the stimulusdetectability from what would be expected based onthe standard luminous function.
Another potential problem with using the humancolor-matching function is that the density of themacular pigment differs between macaques andhumans. In humans, it is distributed from 0 to 1.2density units at a peak absorbance wavelength of 460nm (Wyszecki & Stiles, 1982), and 0.35 density unitswas assumed for the standard observer when thecolor matching function was derived (Stockman etal., 1993). On average, the density of the macularpigment in macaques appears to be slightly higherthan in humans: It ranged from 0.42 to 1.0, and threeout of four monkeys had densities between 0.42 and0.46 (Snodderly, Auran, & Delori, 1984). If weassume that the pigment density in macaque is twotimes greater than in humans, the consequence wouldbe a 1-nm increase in the confusion spectrumcalculated by modulating the cone fundamental(Stockman et al., 1993). This would result in a 58clockwise rotation of the confusion line in thechromaticity diagram, which would give betteragreement to the performance of the dichromats inExperiment 1 than the original confusion angle (4.18).The effect of macular density on Experiment 2 wasnegligible, as the stimuli were long wavelength lightsin which no macular absorption was made. Theseconsiderations also indicate that the human color-matching function is a reasonable approximationwith which to describe the color vision behavior ofmacaque monkeys.
Asymmetry in color confusion
In the dichromats, we found an asymmetry of colorconfusion in Experiment 1 (Figure 3a, b), such that the
Journal of Vision (2013) 13(13):1, 1–15 Koida et al. 11
Downloaded From: https://jov.arvojournals.org/pdfaccess.ashx?url=/data/journals/jov/933542/ on 10/29/2018

distribution of errors was slightly wider and the errorrates were higher around cyan hues (1808) than aroundthe red hues (08). Because the chromaticity of the cyanand red target hues is symmetrically located withrespect to the neutral point, the asymmetry of theerror distribution between cyan and red cannot besimply ascribed to a difference in color signalsbetween two opposite directions. One might argue thatthe asymmetry is related to the convergence of theconfusion lines. It is known that the confusion linesare distributed radially from their convergence points.For protanopes, the convergence point is located inthe far red chromaticity (Smith & Pokorny, 1975);consequently, the confusion lines would be morespread for cyan hues than red hues. But although thisradial effect might be a potential cause of asymmetry,the convergence of the confusion lines is negligiblewithin our stimulus range (Figure 3a through d), andthe spread of the color confusion lines is nearlysymmetrical with respect to the neutral point. Anotherpotential cause of the observed asymmetry betweenthe red and cyan directions is the polarity of theluminance contrast for the dichromats. Because theluminance cue received by protanopic observersdepends solely on M-cone outputs, red targets willbecome darker than the gray background, whereascyan targets will become brighter than the graybackground. This is because the luminance of thetarget and background were matched to the luminousfunction of a standard trichromatic observer in whomboth L and M cones are present. Such asymmetry inthe luminance contrast could potentially be related tothe asymmetry of the color discrimination perfor-mance in the dichromats. The luminance contrastdetermined by the Michelson contrast between themost saturated cyan target and the background, or themost saturated red target and background, were 0.055and 0.062, respectively. The larger contrast for redtargets may have enabled better color discriminationperformance in that direction in the dichromats.
Keywords: dichromacy, color vision, macaque mon-key, behavioral experiment
Acknowledgments
The authors would like to thank Chihiro Hira-matsu and Naokazu Goda for their help in startingthis project, Morio Togawa and Masahiro Takagi fortechnical assistance, Hiroo Imai for the moleculargenetic analysis, and Shintaro Funahashi for pro-viding the experimental cage with the feeding system.This work was supported by the CooperationResearch Program of the Primate Research Institute,Kyoto University. KAW was supported by the
Directorate of Higher Education of Indonesia. HKwas supported by a Grant-in-Aid on InnovativeAreas ‘‘Shitsukan’’ (No. 22135007) from the Ministryof Education, Culture, Sports, Science and Technol-ogy (MEXT), Japan.
*KK and IY contributed equally to this work.Corresponding authors: Hidehiko Komatsu and KowaKoida.Email: [email protected]; [email protected]: Division of Sensory and Cognitive Informa-tion, National Institute for Physiological Sciences,Myodaiji, Okazaki-shi, Aichi, Japan.
References
Albrecht, J., Jagle, H., Hood, D. C., & Sharpe, L. T.(2002). The multifocal electroretinogram (mfERG)and cone isolating stimuli: Variation in L- and M-cone driven signals across the retina. Journal ofVision, 2(8):2, 543–558, http://www.journalofvision.org/content/2/8/2, doi:10.1167/2.8.2. [PubMed][Article]
Blakeslee, B., & Jacobs, G. H. (1982). Color vision inthe spider monkey (Ateles). Folia Primatologica,38(1–2), 86–98.
Blakeslee, B., & Jacobs, G. H. (1985). Color vision inthe ring-tailed lemur (Lemur catta). Brain, Behaviorand Evolution, 26(3–4), 154–166.
Bowmaker, J. K., & Dartnall, H. J. (1980). Visualpigments of rods and cones in a human retina.Journal of Physiology, 298, 501–511.
Bowmaker, J. K., Jacobs, G. H., & Mollon, J. D.(1987). Polymorphism of photopigments in thesquirrel monkey: A sixth phenotype. Proceedings ofthe Royal Society of London. Series B, 231(1264),383–390.
Brainard, D. H., Calderone, J. B., Nugent, A. K., &Jacobs, G. H. (1999). Flicker ERG responses tostimuli parametrically modulated in color space.Investigative Ophthalmology & Visual Science, 40.2840–2847, http://www.iovs.org/content/40/12/2840.[PubMed] [Article]
Calkins, D. J. (2001). Seeing with S cones. Progress inRetinal and Eye Research, 20, 255–287.
Carroll, J., McMahon, C., Neitz, M., & Neitz, J.(2000). Flicker-photometric electroretinogram esti-mates of L : M cone photoreceptor ratio in menwith photopigment spectra derived from genetics.Journal of the Optical Society of America. A, Optics,Image Science, and Vision, 17, 499–509.
Carroll, J., Neitz, J., & Neitz, M. (2002). Estimates of
Journal of Vision (2013) 13(13):1, 1–15 Koida et al. 12
Downloaded From: https://jov.arvojournals.org/pdfaccess.ashx?url=/data/journals/jov/933542/ on 10/29/2018

L : M cone ratio from ERG flicker photometry andgenetics. Journal of Vision, 2(8):1, 531–542, http://www.journalofvision.org/content/2/8/1, doi:10.1167/2.8.1. [PubMed] [Article]
Cicerone, C. M., & Nerger, J. L. (1989). The relativenumbers of long-wavelength-sensitive to middle-wavelength-sensitive cones in the human foveacentralis. Vision Research, 29, 115–128.
Dartnall, H. J., Bowmaker, J. K., & Mollon, J. D.(1983). Human visual pigments: Microspectropho-tometric results from the eyes of seven persons.Proceedings of the Royal Society of London. SeriesB, 220, 115–130.
De Valois, R. L., & Morgan, H. C. (1974). Psycho-physical studies of monkey vision. II. Squirrelmonkey wavelength and saturation discrimination.Vision Research, 14(1), 69–73.
De Valois, R. L., Morgan, H. C., Polson, M. C., Mead,W. R., & Hull, E. M. (1974). Psychophysical studiesof monkey vision. I. Macaque luminosity and colorvision tests. Vision Research, 14(1), 53–67.
de Vries, H. (1949). The heredity of the relativenumbers of red and green receptors in the humaneye. Genetica, 24, 199–212.
Deeb, S. S., Diller, L. C., Williams, D. R., & Dacey, D.M. (2000). Interindividual and topographical var-iation of L : M cone ratios in monkey retinas.Journal of the Optical Society of America. A, Optics,Image Science, and Vision, 17, 538–544.
Dobkins, K. R., Thiele, A., & Albright, T. D. (2000).Comparison of red-green equiluminance points inhumans and macaques: evidence for different L :M cone ratios between species. Journal of theOptical Society of America. A, Optics, ImageScience, and Vision, 17, 545–556.
Gegenfurtner, K. R. (2003). Cortical mechanisms ofcolour vision. Nature Reviews Neuroscience, 4(7),563–572.
Hagstrom, S. A., Neitz, J., & Neitz, M. (1998).Variations in cone populations for red-green colorvision examined by analysis of mRNA. Neuro-report, 9, 1963–1967.
Hanazawa, A., Mikami, A., Sulistyo Angelika, P.,Takenaka, O., Goto, S., Onishi, A., Koike, S.,Yamamori, T., Kato, K., Kondo, A., Suryobroto,B., Farajallah, A., & Komatsu, H. (2001). Elec-troretinogram analysis of relative spectral sensitiv-ity in genetically identified dichromatic macaques.Proceedings of the National Academy of Sciences,USA, 98, 8124–8127.
Hofer, H., Carroll, J., Neitz, J., Neitz, M., & Williams,D. R. (2005). Organization of the human trichro-
matic cone mosaic. Journal of Neuroscience, 25,9669–9679.
Jacobs, G. H. (1972). Increment-threshold spectralsensitivity in the squirrel monkey. Journal ofComparative and Physiological Psychology, 79(3),425–431.
Jacobs, G. H. (1977). Visual sensitivity: Significantwithin-species variations in a nonhuman primate.Science, 197(4302), 499–500.
Jacobs, G. H. (1983). Within-species variations invisual capacity among squirrel monkeys (Saimirisciureus): Sensitivity differences. Vision Research,23(3), 239–248.
Jacobs, G. H. (1984). Within-species variations invisual capacity among squirrel monkeys (Saimirisciureus): Color vision. Vision Research, 24(10),1267–1277.
Jacobs, G. H. (1990). Discrimination of luminance andchromaticity differences by dichromatic and trichro-matic monkeys. Vision Research, 30(3), 387–397.
Jacobs, G. H. (1998). A perspective on color vision inplatyrrhine monkeys. Vision Research, 38(21),3307–3313.
Jacobs, G. H. (2008). Primate color vision: A com-parative perspective. Visual Neuroscience, 25(5–6),619–633.
Jacobs, G. H. (2009). Evolution of colour vision inmammals. Philosophical Transactions of the RoyalSociety of London. Series B, Biological Sciences,364(1531), 2957–2967.
Jacobs, G. H. (2012). The evolution of vertebrate colorvision. Advances in Experimental Medicine andBiology, 739, 156–172.
Jacobs, G. H., & Blakeslee, B. (1984). Individualvariations in color vision among squirrel monkeys(Saimiri sciureus) of different geographical origins.Journal of Comparative Psychology, 98(4), 347–357.
Jacobs, G. H., Bowmaker, J. K., & Mollon, J. D.(1981). Behavioural and microspectro-photometricmeasurements of colour vision in monkeys. Nature,292(5823), 541–543.
Jacobs, G. H., & Nathans, J. (2009). The evolution ofprimate color vision. Scientific American, 300(4),56–63.
Jacobs, G. H., Neitz, J., & Crognale, M. (1987). Colorvision polymorphism and its photopigment basis ina callitrichid monkey (Saguinus fuscicollis). VisionResearch, 27(12), 2089–2100.
King-Smith, P. E., & Carden, D. (1976). Luminanceand opponent-color contributions to visual detec-tion and adaptation and to temporal and spatial
Journal of Vision (2013) 13(13):1, 1–15 Koida et al. 13
Downloaded From: https://jov.arvojournals.org/pdfaccess.ashx?url=/data/journals/jov/933542/ on 10/29/2018

integration. Journal of the Optical Society ofAmerica, 66(7), 709–717.
Komatsu, H. (1998). Mechanisms of central colorvision. Current Opinion in Neurobiology, 8(4), 503–508.
Kremers, J., Scholl, H. P., Knau, H., Berendschot, T.T., Usui, T., & Sharpe, L. T. (2000). L/M coneratios in human trichromats assessed by psycho-physics, electroretinography, and retinal densitome-try. Journal of the Optical Society of America. A,Optics, Image Science, and Vision, 17, 517–526.
Kremers, J., Usui, T., Scholl, H. P., & Sharpe, L. T.(1999). Cone signal contributions to electroretino-grams [correction of electrograms] in dichromatsand trichromats. Investigative Ophthalmology &Visual Science, 40(5), 920–930, http://www.iovs.org/content/40/5/920. [PubMed] [Article]
Mancuso, K., Hauswirth, W. W., Li, Q., Connor, T. B.,Kuchenbecker, J. A., Mauck, M. C., Neitz, J., &Neitz, M. (2009). Gene therapy for red-greencolour blindness in adult primates. Nature, 461,784–787.
Mancuso, K., Neitz, M., & Neitz, J. (2006). Anadaptation of the Cambridge Colour Test for usewith animals. Visual Neuroscience, 23, 695–701.
Mollon, J. D., Bowmaker, J. K., & Jacobs, G. H.(1984). Variations of colour vision in a new worldprimate can be explained by polymorphism ofretinal photopigments. Proceedings of the RoyalSociety of London. Series B, 222(1228), 373–399.
Morgan, M. J., Adam, A., & Mollon, J. D. (1992).Dichromats detect colour-camouflaged objects thatare not detected by trichromats. Proceedings of theRoyal Society of London. Series B, 248, 291–295.
Nathans, J. (1999). The evolution and physiology ofhuman color vision: Insights from moleculargenetic studies of visual pigments. Neuron, 24, 299–312.
Onishi, A., Koike, S., Ida, M., Imai, H., Shichida, Y.,Takenaka, O., Hanazawa, A., Komatsu, H.,Mikami, A., Goto, S., Suryobroto, B., Farajallah,A., Varavudhi, P., Eakavhibata, C., Kitahara, K.,& Yamamori, T. (1999). Dichromatism in macaquemonkeys. Nature, 402, 139–140.
Oyama, T., Furusakwa, T., & Kito, T. (1986). Colorvision tests of Japanese and rhesus monkeys. InD. M. Taub, & F. A. King (Eds.). Currentperspectives in primate biology. New York: VanNostrand Reinhold.
Reffin, J. P., Astell, S., and Mollon, J. D. (1991). Trialsof a computer-controlled colour vision test thatpreserves the advantages of pseudoisochromaticplates. In B. Drum, J. D. Moreland, & A. Serra
(Eds.), Colour vision deficiencies X (Vol. 54, pp. 69–76). Dordrecht, Netherlands: Kluwer.
Regan, B. C., Reffin, J. P., & Mollon, J. D. (1994).Luminance noise and the rapid determination ofdiscrimination ellipses in colour deficiency. VisionResearch, 34(10), 1279–1299.
Ruddock, K. H. (1991). Psychophysics of inheritedcolour vision deficiencies. In D. H. Foster (Ed.),Inherited and acquired colour vision deficiencies:Fundamental aspects and clinical studies (pp. 4–37).Houndmills, Basingstoke, UK: Macmillan Press.
Rushton, W. A., & Baker, H. D. (1964). Red/greensensitivity in normal vision. Vision Research, 4, 75–85.
Saito, A., Kawamura, S., Mikami, A., Ueno, Y.,Hiramatsu, C., Koida, K., . . . (2005). Demonstra-tion of a genotype-phenotype correlation in thepolymorphic color vision of a non-callitrichine NewWorld monkey, capuchin (Cebus apella). AmericanJournal of Primatology, 67, 471–485.
Saito, A., Mikami, A., Hasegawa, T., Koida, K.,Terao, K., Koike, S., Onishi, A., Takenaka, O.,Teramoto, M., & Mori, Y. (2003). Behavioralevidence of color vision deficiency in a protano-malia chimpanzee (Pan troglodytes). Primates, 44,171–176.
Saito, A., Mikami, A., Kawamura, S., Ueno, Y.,Hiramatsu, C., Widayati, K. A., . . . (2005).Advantage of dichromats over trichromats indiscrimination of color-camouflaged stimuli innonhuman primates. American Journal of Prima-tology, 67, 425–436.
Sharpe, L. T., de Luca, E., Hansen, T., Jagle, H., &Gegenfurtner, K. R. (2006). Advantages anddisadvantages of human dichromacy. Journal ofVision, 6(3):3, 213–223, http://www.journalofvision.org/content/6/3/3, doi:10.1167/6.3.3. [PubMed] [Article]
Sharpe, L. T., Stockman, A., Jagle, H., and Nathans, J.(1999). Opsin genes, cone photopigments, colorvision, and color blindness. In K. R. Gegenfurtner& L. T. Sharpe (Eds.), Color vision: From genes toperception. New York: Cambridge UniversityPress.
Sidley, N. A., & Sperling, H. G. (1967). Photopicspectral sensitivity in the rhesus monkey. Journal ofthe Optical Society of America, 57(6), 816–818.
Smith, V. C., & Pokorny, J. (1975). Spectral sensitivityof the foveal cone photopigments between 400 and500 nm. Vision Research, 15, 161–171.
Snodderly, D. M., Auran, J. D., & Delori, F. C. (1984).The macular pigment. II. Spatial distribution inprimate retinas. Investigative Ophthalmology &
Journal of Vision (2013) 13(13):1, 1–15 Koida et al. 14
Downloaded From: https://jov.arvojournals.org/pdfaccess.ashx?url=/data/journals/jov/933542/ on 10/29/2018

Visual Science, 25(6), 674–685, http://www.iovs.org/content/25/6/674. [PubMed] [Article]
Solomon, S. G., & Lennie, P. (2007). The machinery ofcolour vision. Nature Review Neuroscience, 8(4),276–286.
Stockman, A., MacLeod, D. I., & Johnson, N. E.(1993). Spectral sensitivities of the human cones.Journal of the Optical Society of America, A, 10,2491–2521.
Stoughton, C. M., Lafer-Sousa, R., Gagin, G., &Conway, B. R. (2012). Psychophysical chromaticmechanisms in macaque monkey. Journal ofNeuroscience, 32(43), 15216–15226.
Wyszecki, G., & Stiles, W. S. (1982). Color science:Concepts and methods, quantitative data and for-mulae (2nd ed.). New York: Wiley.
Yamaguchi, T., Motulsky, A. G., & Deeb, S. S. (1997).Visual pigment gene structure and expression inhuman retinae. Human Molecular Genetics, 6, 981–990.
Appendix
Time course of color discriminationperformance
Color discrimination performance in Experiment 1was analyzed separately for the first and second half ofthe trials for each stimulus. The results are shown inFigure 5, which is formatted as in Figure 3. It should benoted that saturated stimuli were frequently tested atthe beginning of the experiment. Consequently, theborder session separating the two halves differs acrossstimuli. The difference in the performance between thetwo halves was obvious for the trichromats but was notas clear for the dichromats. Nevertheless, the huedependencies of the errors were consistent between thetwo halves. The relatively stable performance of thedichromats indicates that the color discriminationperformance for hues remote from the color confusionline was not the result of the training in the currentexperiments.
Figure 5. Color discrimination performance of first (top) and second (bottom) half of the trials. Format is same as in Figure 3.
Journal of Vision (2013) 13(13):1, 1–15 Koida et al. 15
Downloaded From: https://jov.arvojournals.org/pdfaccess.ashx?url=/data/journals/jov/933542/ on 10/29/2018