Color Reduction in Hand-drawn Persian Carpet Cartoons...
13
Journal of AI and Data Mining Vol 6, No 1, 2018, 47-58 Color Reduction in Hand-drawn Persian Carpet Cartoons before Discretization using image segmentation and finding edgy regions M. Fateh 1* and E. Kabir 2 1. Department of Computer Engineering, Shahrood University of Technology, Shahrood, Iran, 2. Department of Electrical and Computer Engineering, Tarbiat Modarres University, Tehran, Iran. Received 03 March 2016; Accepted 06 March 2017 *Corresponding author: [email protected] (M. Fateh). Abstract In this paper, we present a method for color reduction in Persian carpet cartoons which increases both the speed and accuracy of editing. Carpet cartoons are in two categories: machine-printed and hand-drawn. Hand-drawn cartoons are divided into two groups: before and after discretization. The purpose of this work is color reduction in hand-drawn cartoons before discretization. The proposed algorithm consists of the following steps: image segmentation, finding the color of each region, color reduction around the edges and final color reduction with C-means. The proposed method requires knowing the desired number of colors in any cartoon. In this method, the number of colors is not reduced to more than about 1.3 times of the desired number. Automatic color reduction is done in such a way that the final manual editing done to reach the desired colors is very easy. Keywords: Color Reduction, Hand-drawn Cartoons, Segmentation, C-means, Persian Carpet. 1. Introduction True color images typically contain thousands of colors, and 24 bits are assigned to each pixel. Display, storage, transmission, and processing of these images are problematic. For this reason, color quantization is commonly used as a pre- processing step for various images. Applications of color quantization in image processing include: compression [1], segmentation [2], text detection [3], color-texture analysis [4], watermarking [5], and content-based retrieval [6]. The purpose of this research work is to reduce the number of colors in a hand-drawn carpet cartoon into a preset value. Color quantization has many techniques in RGB, HSV, HSL, and other color spaces [7, 8]. The RGB color space was used in the current work. The process of color quantization is comprised of two steps: palette design (selection of a small set of original image colors) and pixel mapping (replacing image colors with the color palette) [9]. Color quantization methods can be classified into two groups: image-independent method that determines a fixed palette regardless of any specific image [10] and image-dependent methods that determine an adaptive palette. The aim is to reduce the number of colors in the image with minimal distortion [9]. In another classification, quantization methods can be categorized into pre-clustering or divisive and post-clustering [1]. Pre-clustering methods are essentially based on the statistical analysis of the color distribution. They start with a single cluster that contains all colors of the image. This cluster is divided into K ones [9]. Known divisive methods include octree [11], median-cut [12], variance-based [13], center-cut [14], binary splitting [15], and rwm-cut 1 [16]. Agglomerative pre-clustering methods begin with N clusters that are the total number of colors in the image. These clusters are then joined until K clusters remain [17, 18]. Post-clustering methods first determine a basic palette and then improve it iteratively. These methods yield fetter results at the cost of increased computational time. These methods are dependent 1 radius weighted mean cut
Transcript of Color Reduction in Hand-drawn Persian Carpet Cartoons...

Journal of AI and Data Mining
Vol 6, No 1, 2018, 47-58
Color Reduction in Hand-drawn Persian Carpet Cartoons before
Discretization using image segmentation and finding edgy regions
M. Fateh
1* and E. Kabir
2
1. Department of Computer Engineering, Shahrood University of Technology, Shahrood, Iran,
2. Department of Electrical and Computer Engineering, Tarbiat Modarres University, Tehran, Iran.
Received 03 March 2016; Accepted 06 March 2017
*Corresponding author: [email protected] (M. Fateh).
Abstract
In this paper, we present a method for color reduction in Persian carpet cartoons which increases both the
speed and accuracy of editing. Carpet cartoons are in two categories: machine-printed and hand-drawn.
Hand-drawn cartoons are divided into two groups: before and after discretization. The purpose of this work
is color reduction in hand-drawn cartoons before discretization. The proposed algorithm consists of the
following steps: image segmentation, finding the color of each region, color reduction around the edges and
final color reduction with C-means. The proposed method requires knowing the desired number of colors in
any cartoon. In this method, the number of colors is not reduced to more than about 1.3 times of the desired
number. Automatic color reduction is done in such a way that the final manual editing done to reach the
desired colors is very easy.
Keywords: Color Reduction, Hand-drawn Cartoons, Segmentation, C-means, Persian Carpet.
1. Introduction
True color images typically contain thousands of
colors, and 24 bits are assigned to each pixel.
Display, storage, transmission, and processing of
these images are problematic. For this reason,
color quantization is commonly used as a pre-
processing step for various images. Applications
of color quantization in image processing include:
compression [1], segmentation [2], text detection
[3], color-texture analysis [4], watermarking [5],
and content-based retrieval [6]. The purpose of
this research work is to reduce the number of
colors in a hand-drawn carpet cartoon into a preset
value.
Color quantization has many techniques in RGB,
HSV, HSL, and other color spaces [7, 8]. The
RGB color space was used in the current work.
The process of color quantization is comprised of
two steps: palette design (selection of a small set
of original image colors) and pixel mapping
(replacing image colors with the color palette) [9].
Color quantization methods can be classified into
two groups: image-independent method that
determines a fixed palette regardless of any
specific image [10] and image-dependent methods
that determine an adaptive palette. The aim is to
reduce the number of colors in the image with
minimal distortion [9].
In another classification, quantization methods
can be categorized into pre-clustering or divisive
and post-clustering [1]. Pre-clustering methods are
essentially based on the statistical analysis of the
color distribution. They start with a single cluster
that contains all colors of the image. This cluster
is divided into K ones [9]. Known divisive
methods include octree [11], median-cut [12],
variance-based [13], center-cut [14], binary
splitting [15], and rwm-cut1 [16]. Agglomerative
pre-clustering methods begin with N clusters that
are the total number of colors in the image. These
clusters are then joined until K clusters remain
[17, 18].
Post-clustering methods first determine a basic
palette and then improve it iteratively. These
methods yield fetter results at the cost of increased
computational time. These methods are dependent
1 radius weighted mean cut

Fateh & Kabir/ Journal of AI and Data Mining, Vol 6, No 1, 2018.
48
on the initial conditions; therefore, the initial
palette is first constructed by a pre-clustering
method and the result is improved by a post-
clustering method [19]. Clustering algorithms
utilized for color quantization includes C-means
[20-22], min-max [23], competitive learning [24,
25], fuzzy c-means [26, 27], BIRCH [28], self-
organizing map [29, 30], and divisive hierarchical
clustering [31].
Some color reduction methods exploit the local
properties around a pixel to find its color more
precisely. Ant colony and self-growing and self-
organized neural gas are examples of optimization
methods utilized for this purpose [29, 32, and 33].
Patterns in a Persian carpet cartoon consist of uni-
color parts or regions; therefore, segmentation-
based methods are the best choices for color
reduction in these cartoons. In what follows, some
image segmentation methods are briefly
explained.
Segmentation methods based on boundaries and
edges work on the discontinuity of pixels whereas
region-based methods work on similarity [34].
Also, there are hybrid methods derived from
integration of the region-based and edge-based
method information [35]. In this research work, a
hybrid method is used.
From the perspective of user's assistance, there are
three ways to set a color palette depending on the
application: 1) the palette is found without
knowing any default number of colors, 2) number
of desired colors is set by the user, 3) the palette is
provided by the user. In all three ways, several
methods for color reduction and quantization have
been proposed [19, 28]. In our work, the number
of colors is preset by the user.
Considering that the color reduction of carpet
cartoons is a new topic, in this paper, a brief
description of this topic is provided in Section 2.
In Section 3, the proposed method is described. In
Section 4, the details of dataset are described.
Then in Section 5, the experimental results are
analyzed and a comparison with the results
obtained by commercial software is provided.
Finally, in Section 6, the conclusion is derived.
2. Principles of automatic reading of carpet
cartoons
Carpet cartoons are divided into two categories: a)
hand-drawn by traditional methods, and b)
machine-printed by computerized methods.
Hand-drawn cartoons are divided into two
categories: a) before discretization, and b) after
discretization. Two samples of carpet cartoons
before and after discretization are shown in
figure1. The design of a carpet cartoon after
discretization is done on a graph paper.
(a)
(b)
Figure 1. (a) Typical carpet cartoons before
discretization; (b) Typical carpet cartoons after
discretization.
The purpose and innovation of this work is the
color reduction of hand-drawn carpet cartoons
before discretization, which has never been done
before, in order to ease the production of digital
cartoons. The production of digital cartoons is of
great help in establishing carpet cartoon libraries,
preservation and restoration of old carpet
cartoons, and automatic discretization and semi-
automatic editing of cartoons.
The main concern in color reduction in
conventional images is the minimization of a
perceived difference between the original and
quantized images. A typical conventional carpet
cartoon has a palette of 10 to 15 colors. The main
concern here is to have pure uni-color regions,
while the fact that the quantized color of a region
is close to the desired one is of less importance.
There are some commercial software products
available, which assist the designer in the process
of developing a carpet cartoon. However, this
process is still very time- consuming and
expensive. In the Iranian market, Booria [36] and
Nqshsaz [37] are the most important commercial
products for designing carpet cartoons. These
applications reduce the number of colors to 256

Fateh & Kabir/ Journal of AI and Data Mining, Vol 6, No 1, 2018.
49
perfectly. However, a further reduction in colors
to tens of colors makes errors-hard to fix
manually.
In the recent years, some algorithms have been
proposed for color reduction in carpet cartoons
[19, 38-40]. However due to the challenging
problems, in particular for hand-drawn cartoons,
the results are far from satisfactory. For example,
color reduction with optimized C-means method
[19] on part of a hand-drawn cartoon is shown in
section 5 (Figure 17).
As shown in figure 2, there are two main
problems to reduce color in hand-drawn carpet
cartoons.
1- Varying saturation of a specific color
in different parts of a hand-drawn
cartoon.
2- Scanning with 256 or more colors. The method proposed in this paper tries to solve
both problems.
Figure 2. A typical hand-drawn carpet cartoon before
discretization scanned by 300 dpi.
3. Proposed algorithm The proposed algorithm consists of the following
steps. 1) Image segmentation: in this step, edge
detection is performed using Canny operator and
edge linking is done where every closed boundary
makes a separate segment. The resulting regions
are of two kinds, edgy regions around the pattern
edges, and plain regions including intra-pattern
and background regions. 2) Finding the color of
each plain region. 3) Color reduction of edgy
regions with connected components labeling. 4)
Final color reduction with C-means: in this step,
color reduction with high accuracy is performed.
Color reduction steps in hand-drawn carpet
cartoons are shown in figure 3.
In what follows, we describe the details of each
color reduction step.
3.1. Image segmentation
In this step, color image is converted to grayscale,
and edges are detected by canny operator (Figure
4).
In figure 4, some of the image boundaries have
rupture. This rupture will cause a problem in area
separation. Therefore, it is required to decrease
the boundary ruptures. Then the intensity of pixels
bigger than zero will be replaced by 255. Edge
linking is carried out by blurring on image of
edges. In continuation, the boundaries with one
horizontal and vertical pixel distance will be
connected till the image area separation gets done
clearly and completely (Figure 5).
Figure 3. Proposed steps for color reduction in before-
discretization carpet cartoons.
Figure 4. Edge detection by Canny operator on carpet
cartoon in figure 2.
Figure 5. Blurring on edge image in figure 4.
Pattern boundaries are shown in white in figure 6.
The image segmentation steps are shown in figure
7.
Image segmentation
Finding edgy and plain regions
Each plain region
Color reduction of edgy regions
Final color reduction by C-means

Fateh & Kabir/ Journal of AI and Data Mining, Vol 6, No 1, 2018.
50
3.2. Finding color of each plain region
In this step, the color of each plain region is
determined by the average color of its pixels for
one time. If the difference between the average
color and the color of any pixel is more than 10,
that pixel is excluded and the average color of the
remaining pixels is taken as the color of that
region.
Figure 6. Final result of finding edgy regions, shown in
white.
Figure 7. Steps of image segmentation.
After determining the color of each region, the
number of colors in the image could be up to the
number of plain regions. Using C-means
algorithm, the number of palette colors is reduced
to three times the number of colors preset by the
user. The color distance between any region color
and the palette colors is calculated. If this value is
less than 15, the palette color is given to that
segment; otherwise, the color does not change.
Figure 8. Finding color of each plain region in figure 2;
and color reduction from 550 to 30 by C-means
algorithm.
3.3. Color reduction of edgy regions
After finding the colors of plain regions, the
colors of edgy regions are determined by a
connected component labeling described in figure
9. In what follows, the basis of this method is
described.
Image segmentation methods are divided into
three groups:
Thresholding Methods
Boundary/Edge-based methods
Region-based methods The purpose of all these methods is segmentation
with a high accuracy. However, it might be caused
by problems in segmentation [34]:
The segmented region might be
smaller or larger than the actual one.
The edges of the segmented region
might not be connected.
Pseudo-edges are created and real
edges are missing. In many segmentation methods based on the
threshold, the threshold is determined by both
general and local. The method does not have a
high accuracy, because determining the exact
threshold is difficult. But instead, the method has
a high speed.
In edge-based methods, the number of regions is
assumed to be equal to the number of closed
borders. Also the gradient and laplacian algorithm
is used to identify the boundary [34].
Accuracy of region-based methods is useful for
segmentation. In these methods, similar regions
are connected according to criteria such as color,
texture and intensity. In this section, region
growing and clustering are common methods. In
this paper, segmentation around the edge is done
by region-based methods with connected
components labeling.
In this method, the Euclidian color distances of
each pixel from neighboring pixels, are compared
with a threshold value. If this distance is less than
the threshold, the color of the neighboring pixel is
replaced with the color of the central one.
A 5 by 5 window is considered and the threshold
value is set by (1) where decreases as physical
distance increases.
215*e
x y
thershold
(1)
In the above equation, x and y are the Euclidian
distance of the neighboring pixel from the central
one. Note that after this step, there is another one
to reduce the color. Therefore, the threshold value
is considered small.
Converting color image to grayscale
Edge detection by canny operator
Edge linking by blurring
Edge linking by connecting to each
other

Fateh & Kabir/ Journal of AI and Data Mining, Vol 6, No 1, 2018.
51
Figure 10 shows a sample of color reduction for
edgy regions.
3.4. Final color reduction by C-means
algorithm
At the end, color reduction for the entire image is
done by C-means. To ensure that the desired
colors are preserved, color reduction is limited to
40-50% more than the desired number of colors,
preset by the user.
The final result of color reduction is shown in
figure 11. In this figure, the colors should be
reduced to 16, while to keep the desired colors,
the algorithm is set for 24 colors.
Figure 9. Flowchart for color reduction of edgy regions.
Figure 10. Color reduction of edgy regions of figure 2.
3.4. Final color reduction by C-means
algorithm
At the end, color reduction for the entire image is
done by C-means. To ensure that the desired
colors are preserved, color reduction is limited to
40-50% more than the desired number of colors,
preset by the user.
The final result of color reduction is shown in
figure 11. In this figure, the colors should be
reduced to 16, while to keep the desired colors,
the algorithm is set for 24 colors.
Moving pixel-to-pixel
Checking neighboring pixels color
Calculating color difference between
neighboring pixels from central pixel
Color difference is
less than threshold?
Tag neighboring pixel is replaced
with the tag central pixel
All pixels
were
reviewed?
Calculate color average value in pixels
with same tag
Determine final color palette
according to color average value
Yes
No
Tag neighboring pixel does
not change
Yes
No

Fateh & Kabir/ Journal of AI and Data Mining, Vol 6, No 1, 2018.
52
Figure 11. Final reduction of colors for image of
figure 2.
4. Dataset
Dataset for carpet cartoons was collected during
five years from different sources [36, 37, 41]. In
this work, 170 pieces of 17 carpet cartoons were
used. The cartoons were from Kerman, Isfahan,
Tabriz, Kashan and Qom.
Size of each piece is between 300 by
300 and 1000 by 1000 pixels.
The cartoons were scanned with 300
dpi.
Color space of carpet cartoons is
RGB.
The number of colors in each piece is
between 7 and 15. 90 pieces were used during the design of the
method, and the remaining 80 pieces were used
for the test. The ground truths for the test set were
made by labeling the pixels in a semi-automatic
manner, and were used to evaluate the proposed
method.
As noted in Section 2, some pixels, about 5% of
the total ones, are wrong in the original cartoons.
In the proposed method, each region is
homogeneous. Hence, the pixel color is corrected.
However, if the correction does not happen, the
error is not caused by the algorithm, and therefore
is ignored.
5. Qualitative evaluations of results
In this Section, the results of the proposed method
are examined on different carpet cartoons and
compared with some conventional methods for
color reduction. In our method, the final colors
and number of colors are not exactly the same as
the desired ones, so a quantitative evaluation is
difficult. In this comparison, replacing the original
colors with the similar ones is not considered as
fault.
Color reduction for a sample image of the test set
is shown in figure 12. The image has 522 * 524
pixels. The ground truth has 13 colors.
(a)
(b)
Figure 12. (a) A piece of a 13-color hand-drawn carpet
cartoon before-discretization. (b) Resulting image
produced with 18 colors.
Layer Pilot is general-purpose commercial
software for color reduction of typical images.
Color reduction in this software is semi-automatic
[42]. In this software, the desired palette is
specified by the user. The result of the color
reduction by Layer Pilot is shown in figure 13.
Our proposed algorithm is customized for carpet
cartoons, and therefore, outperforms general-
purpose software like Layer Pilot.
Part of a hand-drawn cartoon from Kerman with
15 colors is shown in figure 14.a. The colors are 5
kinds of greens, 2 gray, 2 kinds of blues, black,
white, red, yellow, orange and beige. In this
figure, the colors should be reduced to 15, while
not to miss any desired color; the algorithm is set
for 21 colors. If the colors are reduced to 15,
errors resulting from merging similar colors are
created. The color reduction into 15 is shown in

Fateh & Kabir/ Journal of AI and Data Mining, Vol 6, No 1, 2018.
53
figure 14.b. The color reduction into 21 is shown
in figure 14.c.
Figure 13. Result of color reduction by Layer Pilot on
figure 12.
For error analysis of figure14.b, each region is in
white in figure15. In this figure, the grade color is
known with the number of color. For example,
dark blue and bright blue are known with blue 1
and blue 2. As seen, yellow and orange, 2 greens,
white and part of beige are merged and 3 original
colors are missed. Also, green 1 and white and
part of gray 2, parts of green 2 and green 3 and
gray 1 are merged. Gray 2 is divided into 2 colors
and beige into 3 colors. In the proposed algorithm,
to ensure that the desired colors are preserved,
color reduction is limited to 40% more than the
original number of colors.
For error analysis of figure14.c, each color is
shown in figure16 by color white. As you can see,
white and part of gray 2, parts of green 2 and gray
2 are merged and one color is removed. Also,
gray1 and 2, green 1, 2 and 5 are divided into 2
colors and beige is divided into 3 colors. Dividing
one color into 2 colors or more is not considered
as error.
(a) (b) (c)
Figure 14. (a) A piece of a 15-color hand-drawn carpet cartoon. (b) Resulting image produced with 15 colors. (c)
Resulting image produced with 21 colors.
(3) blue 2 (2) blue 1 (1) black

Fateh & Kabir/ Journal of AI and Data Mining, Vol 6, No 1, 2018.
54
(6) parts of gray 2 (5) gray 1 (4) red
(9) parts of green 1 (8) merging yellow and orange (7) merging green 1, white and parts of gray 2
(12) green 5 (11) green 4 (10) merging parts of green 2, green 3 and
gray 1
(15) major part of beige (14) merging white and part of beige (13) parts of beige
Figure 15. Each color of figure 14b is shown in white, separately.

Fateh & Kabir/ Journal of AI and Data Mining, Vol 6, No 1, 2018.
55
(3) blue 2 (2) blue 1 (1) black
(6) part of gray 1 (5) part of gray 1 (4) red
(9) yellow (8) merging white and part of gray 2 (7) part of gray 2
(12) part of green 1 (11) part of green 1 (10) orange
Fateh & Kabir/ Journal of AI and Data Mining, Vol 6, No 1, 2018.
56
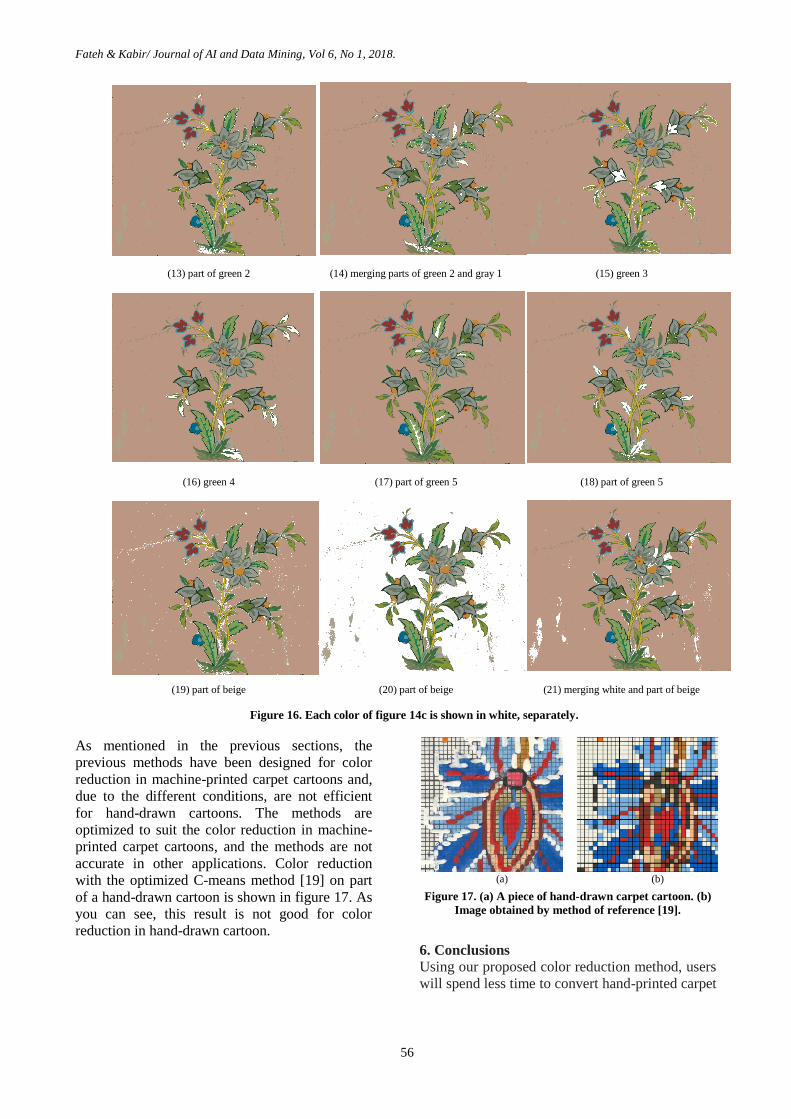
(15) green 3 (14) merging parts of green 2 and gray 1 (13) part of green 2
(18) part of green 5 (17) part of green 5 (16) green 4
(21) merging white and part of beige (20) part of beige (19) part of beige
Figure 16. Each color of figure 14c is shown in white, separately.
As mentioned in the previous sections, the
previous methods have been designed for color
reduction in machine-printed carpet cartoons and,
due to the different conditions, are not efficient
for hand-drawn cartoons. The methods are
optimized to suit the color reduction in machine-
printed carpet cartoons, and the methods are not
accurate in other applications. Color reduction
with the optimized C-means method [19] on part
of a hand-drawn cartoon is shown in figure 17. As
you can see, this result is not good for color
reduction in hand-drawn cartoon.
(a) (b)
Figure 17. (a) A piece of hand-drawn carpet cartoon. (b)
Image obtained by method of reference [19].
6. Conclusions
Using our proposed color reduction method, users
will spend less time to convert hand-printed carpet

Fateh & Kabir/ Journal of AI and Data Mining, Vol 6, No 1, 2018.
57
cartoons, before discretization, into digital carpet
cartoons.
Our method consists of several steps,
experimentally tuned for the problem in hand.
Performance of the method would have been very
low if not using an appropriate technique in each
step. Hence, in every part of the work, a technique
is used highly appropriate for the carpet cartoons.
Steps of our method included image
segmentation, finding the color of each plain
region, color reduction of edgy regions with
connected components labeling, and final color
reduction with C-means.
In our method, the final colors and number of
colors were not exactly the same as the desired
colors. Since the quantitative evaluation was
difficult, the qualitative evaluation of the results
was selected.
References [1] Brun, L. & Tr´emeau, A. (2002). Digital Color
Imaging Handbook. CRC Press, pp. 589–638.
[2] Deng, Y. & Manjunath, B. (2001). Unsupervised
Segmentation of Color-Texture Regions in Images and
Video. IEEE Trans. on Pattern Analysis and Machine
Intelligence, vol. 23, no. 8, pp. 800–810.
[3] Sherkat, N., Allen, T. & Wong, S. (2005). Use of
Colour for Hand-Filled Form Analysis and
Recognition. Pattern Analysis and Applications, vol. 8,
no. 1, pp. 163–180.
[4] Sertel, O., Kong, J., Catalyurek, U. V., Lozanski,
G., Saltz, J. H. & Gurcan, M. N. (2009).
Histopathological Image Analysis Using Model-Based
Intermediate Representations and Color Texture:
Follicular Lymphoma Grading. Journal of Signal
Processing Systems, vol. 55 no.1, pp. 169–183.
[5] Kuo, C.-T. & Cheng, S.-C. (2007). Fusion of Color
Edge Detection and Color Quantization for Color
ImageWatermarking Using Principal Axes Analysis.
Pattern Recognition, vol. 40, no. 12, pp. 3691–3704.
[6] Deng, Y., Manjunath, B., Kenney, C., Moore, M. &
Shin, H. (2001). An Efficient Color Representation for
Image Retrieval. IEEE Trans. on Image Processing,
vol. 10, no. 1, pp. 140–147.
[7] Kaur, E. N. & Kaur, E. S. (2015). Color Image
Reduction using Genetic Algorithm. International
Journal of Electronics Communication and Computer
Engineering, vol. 6, no. 2, pp. 319-323.
[8] El-Said, S. A. (2015). Image quantization using
improved artificial fish swarm algorithm. Soft
Computing, vol. 19, no. 9, pp. 2667–2679.
[9] Celebi, M. E. (2011). Improving the Performance
of K-Means for Color Quantization. Image and Vision
Computing, vol. 29, no. 4, pp. 260–271.
[10] Mojsilovic, A. & Soljanin, E. (2001). Color
Quantization and Processing by Fibonacci Lattices.
IEEE Trans. On Image Processing, vol. 10, no. 11, pp.
1712–1725.
[11] Gervautz, M. & Purgathofer, W. (1988) A Simple
Method for Color Quantization: Octree Quantization.
New Trends in Computer Graphics, Springer-Verlag,
pp. 219–231.
[12] Heckbert, P. (1982). Color Image Quantization for
Frame Buffer Display. ACM SIGGRAPH Computer
Graphics, vol. 16, no. 3, pp. 297–307.
[13] Wan, S., Prusinkiewicz, P. & Wong, S. (1990).
Variance-Based Color Image Quantization for Frame
Buffer Display. Color Research and Application, vol.
15, no. 1, pp. 52–58.
[14] Joy, G. & Xiang, Z. (1993). Center-Cut for Color
Image Quantization. The Visual Computer, vol. 10, no.
1, pp. 62–66.
[15] Orchard, M. & Bouman, C. (1991). Color
Quantization of Images. IEEE Trans. on Signal
Processing, vol. 39, no. 12, pp. 2677–2690.
[16] Yang, C.-Y. & Lin, J.-C. (1996). RWM-Cut for
Color Image Quantization. Computers and Graphics,
vol. 20, no. (4), pp. 577–588.
[17] Kanjanawanishkul, K. & Uyyanonvara, B. (2005).
Novel Fast Color Reduction Algorithm for Time-
Constrained Appli-cations. Journal of Visual
Communication and Image Representation, vol. 16, no.
3, pp. 311–332.
[18] Brun, L. & Mokhtari, M. (2000). Two High Speed
Color Quantization Algorithms. in: Proc. of the 1st Int.
Conf. on Color in Graphics and Image Processing, pp.
116–121.
[19] Izadipour, A. & Kabir, E.A. (2010). A method for
automatic printing carpet map reading and comparing
to C-means clustering. Iranian Journal of Electrical and
Computer Engineering, vol. 8, no. 1, pp. 49-56.
[20] Huang, Y.-L. & Chang, R.-F. (2004). A Fast
Finite-State Algorithm for Generating RGB Palettes of
Color Quantized Images. Journal of Information
Science and Engineering, vol. 20, no. 4, pp. 771–782.
[21] Hu, Y.-C. & Lee, M.-G. (2007) K-means Based
Color Palette Design Scheme with the Use of Stable
Flags. Journal of Electronic Imaging, vol. 16, no. 3, pp.
003–033.
[22] Hu, Y.-C. & Su, B.-H. (2008). Accelerated K-
means Clustering Algorithm for Colour Image
Quantization. Imaging Science Journal, vol. 56, no. 1,
pp. 29–40.
[23] Xiang, Z. (1997) Color Image Quantization by
Minimizing the Maximum Intercluster Distance. ACM
Trans. On Graphics, vol. 16, no. 3, pp. 260–276.
[24] Celebi, M. E. (2009). An Effective Color
Quantization Method Based on the Competitive

Fateh & Kabir/ Journal of AI and Data Mining, Vol 6, No 1, 2018.
58
Learning Paradigm. in: Proc. of the 2009 Int. Conf. on
Image Processing, Computer Vision, and Pattern
Recognition, pp. 876–880,.
[25] Celebi, M. E. & Schaefer, G. (2010). Neural Gas
Clustering for Color Reduction. in: Proc. of the 2010
Int. Conf. on Image Processing,Computer Vision, and
Pattern Recognition, pp. 429–432.
[26] Izakian, Z. & Mesgari, M. S. (2015). Fuzzy
clustering of time series data: A particle swarm
optimization approach. Journal of AI and Data Mining,
vol. 3, no. 1, pp. 39-46.
[27] Schaefer, G. & Zhou, H. (2009). Fuzzy Clustering
for Colour Reduction in Images. Telecommunication
Systems, vol. 40, no. 1, pp. 17–25.
[28] Bing, Z., Junyi, S. & Qinke, P. (2004). An
Adjustable Algorithm for Color Quantization. Pattern
Recognition Letters, vol. 25, no. 16, pp. 1787–1797.
[29] Papamarkos, N., Atsalakis, A.E. &
Strouthopoulos, C.P. (2002). Adaptive color reduction.
IEEE Transaction on systems, vol. 32, no. 1, pp. 44-56.
[30] Chang, C.-H., Xu, P., Xiao, R. & Srikanthan, T.
(2005). New Adaptive Color Quantization Method
Based on Self-Organizing Maps. IEEE Trans. on
Neural Networks, vol. 16, no. 1, pp. 237–249.
[31] Celebi, M. E., Wen, Q. & Hwang, S. (2015). An
effective real-time color quantization method based on
divisive hierarchical clustering. Journal of Real-Time
Image Processing, vol. 10, no. 2, pp. 329-344.
[32] Atsalakis, A. & Papamarkos, N. (2006). Color
reduction and estimation of the number of dominant
colors by using a self-growing and self-organized
neural gas. Engineering Applications of Artificial
Intelligence 19, pp. 769–786.
[33] Ghanbarian, A. T., Kabir, E. & Charkari, N. M.
(2007). Color reduction based on ant colony. Pattern
Recognition Letters, vol. 28, no. 12, pp. 1383–1390.
[34] Zuva, T., Olugbara, O. O., Ojo, S. O., Ngwira &
S. M. (2011). Image Segmentation, Available
Techniques, Developments and Open Issues. Journal
on Image Processing and Computer Vision, vol. 2, no.
3, pp. 20-29.
[35] Wang, Y., Guo, Q. & Zhu, Y. (2007). Medical
image segmentation based on deformable models and
its applications. Springer, pp. 209-260.
[36] Booria CAD/CAM Systems, (2017), retrieved
from http://www.booria.com/index-fa.html .
[37] Naqshsaz Software, (2017), retrieved from
http://naqshsaz.persianblog.ir/ .
[38] Fateh, M., Kabir, E. & Nili Ahmadabadi, M.
(2011). Color reduction for machine-printed carpet
pattern by reinforcement learning. Iranian Journal of
Electrical and Computer Engineering, vol. 9, no. 3, pp.
133-142.
[39] Fateh, M. & Kabir, E. (2012). Automatic reading
of hand-painted carpet patterns. Iranian Journal of
Computational Intelligence in Electrical Engineering,
vol. 3, no. 2, pp. 15-30.
[40] Iran Carpet Company, (2014), retrieved from
www.irancarpet.ir .
[41] Carpet museum of Iran, (2014), retrieved from
http://carpetmuseum.ir/home.htm .
[42] Color quantization software, (2014), retrieved
from http://www.colorpilot.com/layer.html .
نشرهی هوش مصنوعی و داده کاوی
و یافتن بندی تصویر گذاری به کمک ناحیههپیش از نقط ایرانی های دستی فرشکاهش رنگ در نقشه
نواحی مرزی
2احسان اله کبیر و *،1منصور فاتح
.ایرانشاهرود، ، دانشگاه صنعتی شاهرود، دانشکده کامپیوتر1
.ایران، تهران، دانشگاه تربیت مدرس، دانشکده مهندسی برق و کامپیوتر2
32/30/0302 ؛ پذیرش 30/30/0302 ارسال
چکیده:
های فررش را افریایش های فرش پارسی ارائه شده است. این کاهش رنگ، سررتت و دترت ویررایش نقشرهدر این مقاله، روشی برای کاهش رنگ در نقشه
ورذاری ققسرز ورذاری و پرا اط نق ههای دسرتی بره دو ورروه پرزش اط نق هی چاپی و دستی هستند. نقشرههای فرش شامل دو دستهقشهن دهد.می
وذاری است. الگوریت پزشرنهادی اط مرالرل طیرر قشر زل های فرش پزش اط نق هی روشی جهت کاهش رنگ در نقشههدف اط این مقاله، ارائه شوند.می
قعرداد ،در روش پزشرنهادی. مزرانگزن-C ها و کاهش رنگ نهایی برا روشاطراف لبهبندی قصویر، یافتن رنگ هر نالزه، کاهش رنگ در شده است: بخش
های قعززن شرده قوسرط کراربر برابر قعداد رنگ 0.0های نهایی لداتل شود. در این روش، قعداد رنگقوسط کاربر به الگوریت داده میهای هر نقشه رنگ
.لاصل کار به صورقی است که ویرایش دستی برای رسزدن به قعداد رنگ اصلی بسزار آسان استهستند.
.مزانگزن، فرش پارسی-Cبندی، های دستی، بخشکاهش رنگ، نقشه :کلمات کلیدی