Color for Visualization, Maureen Stone CS512,...
18
Color for Visualization, Maureen Stone CS512, 11/1/2018 ©2016, 17, 18 Tableau Software Inc. All rights reserved. 1 Color Roadmap Color Vision Specifying RGB Color Color Design for VIS Color Vision Deficiencies Maureen Stone [email protected] research.tableau.com Physical World Visual System Lights, objects Eye, optic nerve, visual cortex Image credits: Dave Connolly, Magden Army Medical Center Fundamental difference: Shape from Color Lightness information Color information Color vision: Encoding light Light Retina: Cone cells (3 types) To brain (3 signals) 2 for color 1 for lightness Energy (many wavelengths) Light: Energy at different wavelengths Spectral Distribution, or Spectrum Infrared Ultraviolet Encoding functions: Cone response Three cones (S, M, L) S M L Infrared Ultraviolet
Transcript of Color for Visualization, Maureen Stone CS512,...
Color for Visualization, Maureen Stone CS512, 11/1/2018
©2016, 17, 18 Tableau Software Inc. All rights reserved. 1
Color Roadmap
Color Vision
Specifying RGB Color
Color Design for VIS
Color Vision Deficiencies
Maureen [email protected]
Physical World Visual System
Lights, objects Eye, optic nerve, visual cortex
Image credits: Dave Connolly, Magden Army Medical Center
Fundamental difference: Shape from Color
Lightness information Color information
Color vision: Encoding light
Light
Retina: Cone cells (3 types)
To brain (3 signals)
2 for color1 for lightness
Energy (many wavelengths)
Light: Energy at different wavelengths
Spectral Distribution, or Spectrum
InfraredUltraviolet
Encoding functions: Cone response
Three cones (S, M, L)
S M L
InfraredUltraviolet
Color for Visualization, Maureen Stone CS512, 11/1/2018
©2016, 17, 18 Tableau Software Inc. All rights reserved. 2
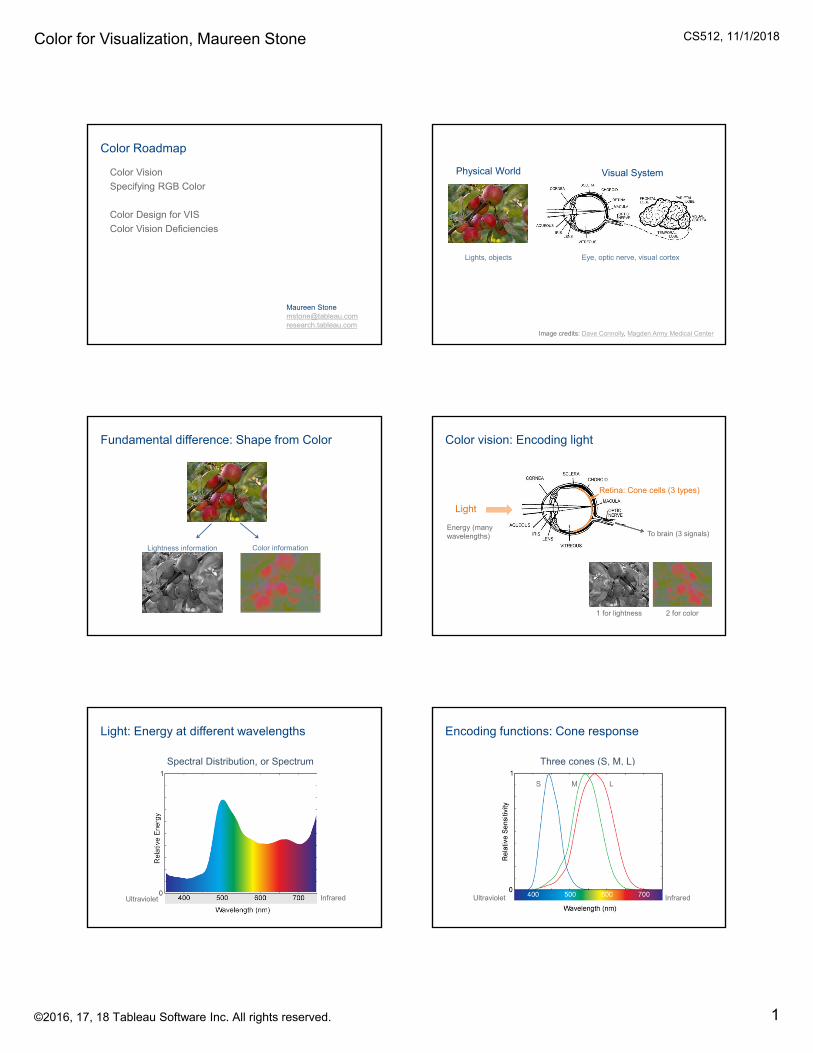
Light Retina: (Cone cells)
3 signals
Encoded light: Lightness + differences
red - green
blue - yellow
All three combined for lightness L
R-G
B-Y
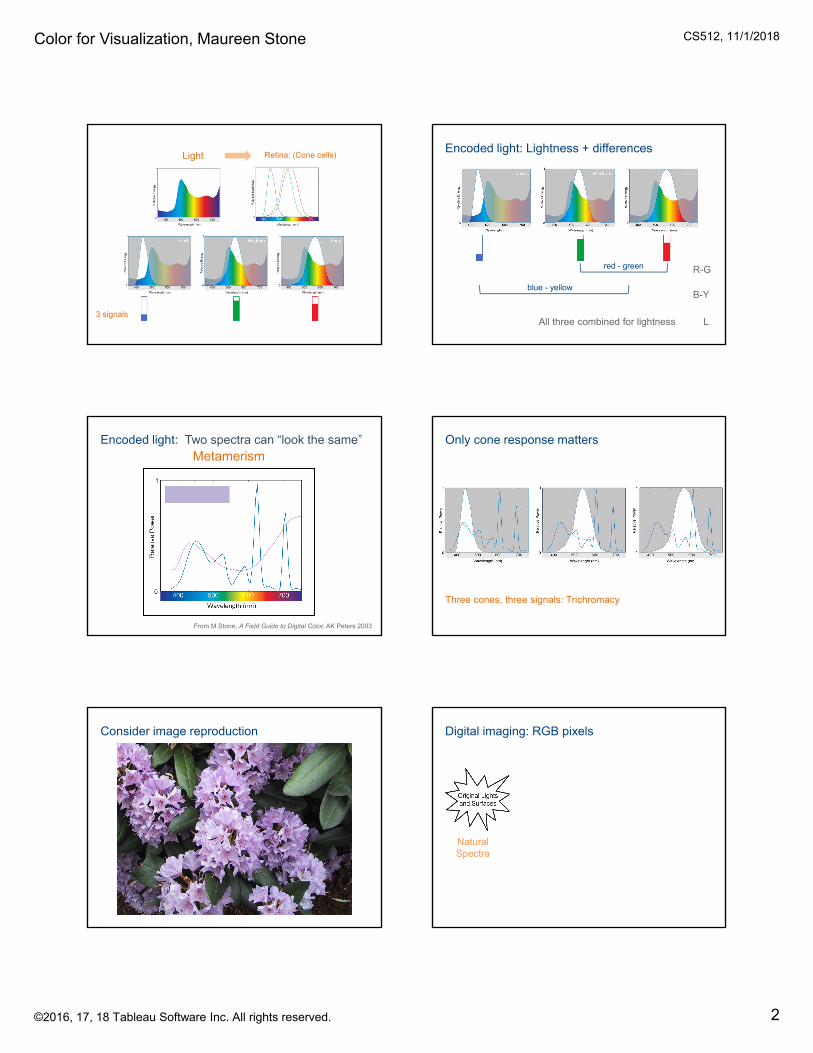
Encoded light: Two spectra can “look the same”
From M.Stone, A Field Guide to Digital Color, AK Peters 2003
MetamerismOnly cone response matters
Three cones, three signals: Trichromacy
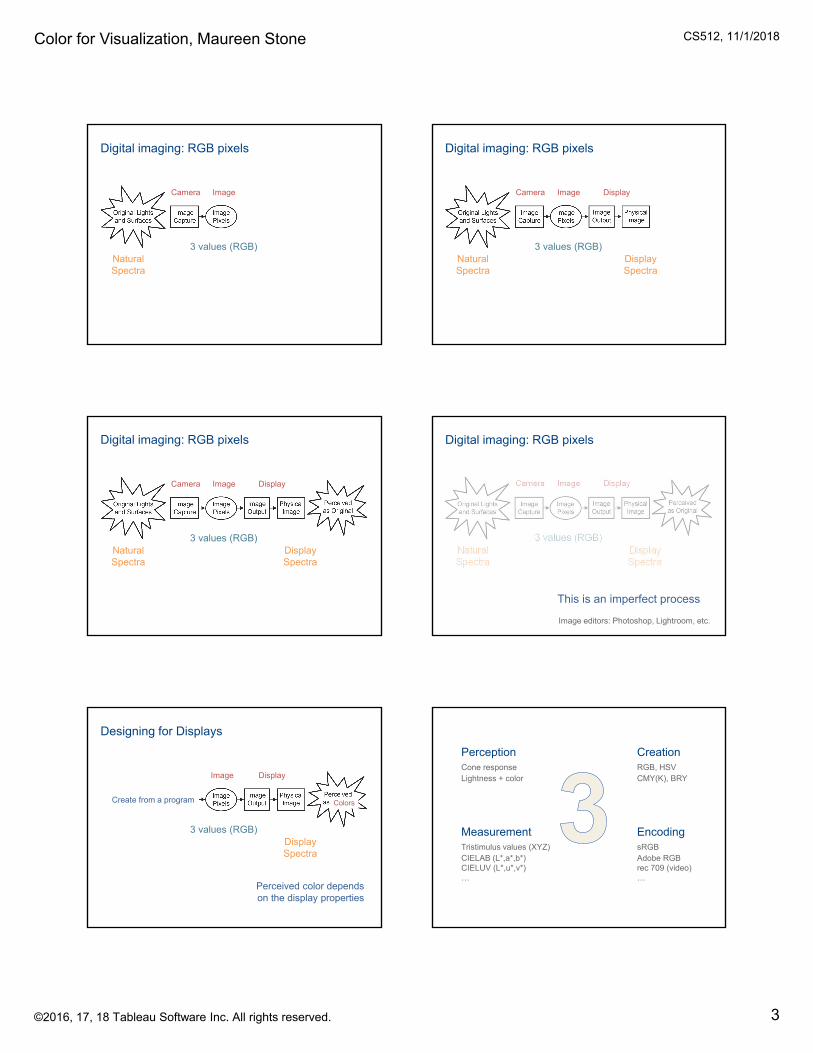
Consider image reproduction Digital imaging: RGB pixels
Camera Image Display
Natural Spectra
Display Spectra
3 values (RGB)
Color for Visualization, Maureen Stone CS512, 11/1/2018
©2016, 17, 18 Tableau Software Inc. All rights reserved. 3
Digital imaging: RGB pixels
Camera Image Display
Natural Spectra
Display Spectra
3 values (RGB)
Digital imaging: RGB pixels
Camera Image Display
Natural Spectra
3 values (RGB)Display Spectra
Digital imaging: RGB pixels
Camera Image Display
Natural Spectra
Display Spectra
3 values (RGB)
Digital imaging: RGB pixels
Camera Image Display
Natural Spectra
Display Spectra
3 values (RGB)
This is an imperfect process
Image editors: Photoshop, Lightroom, etc.
Display Spectra
Designing for Displays
Image Display
3 values (RGB)
Create from a program Colors
Perceived color dependson the display properties
PerceptionCone responseLightness + color
CreationRGB, HSVCMY(K), BRY
MeasurementTristimulus values (XYZ)CIELAB (L*,a*,b*)CIELUV (L*,u*,v*)…
EncodingsRGBAdobe RGBrec 709 (video)…
Color for Visualization, Maureen Stone CS512, 11/1/2018
©2016, 17, 18 Tableau Software Inc. All rights reserved. 4
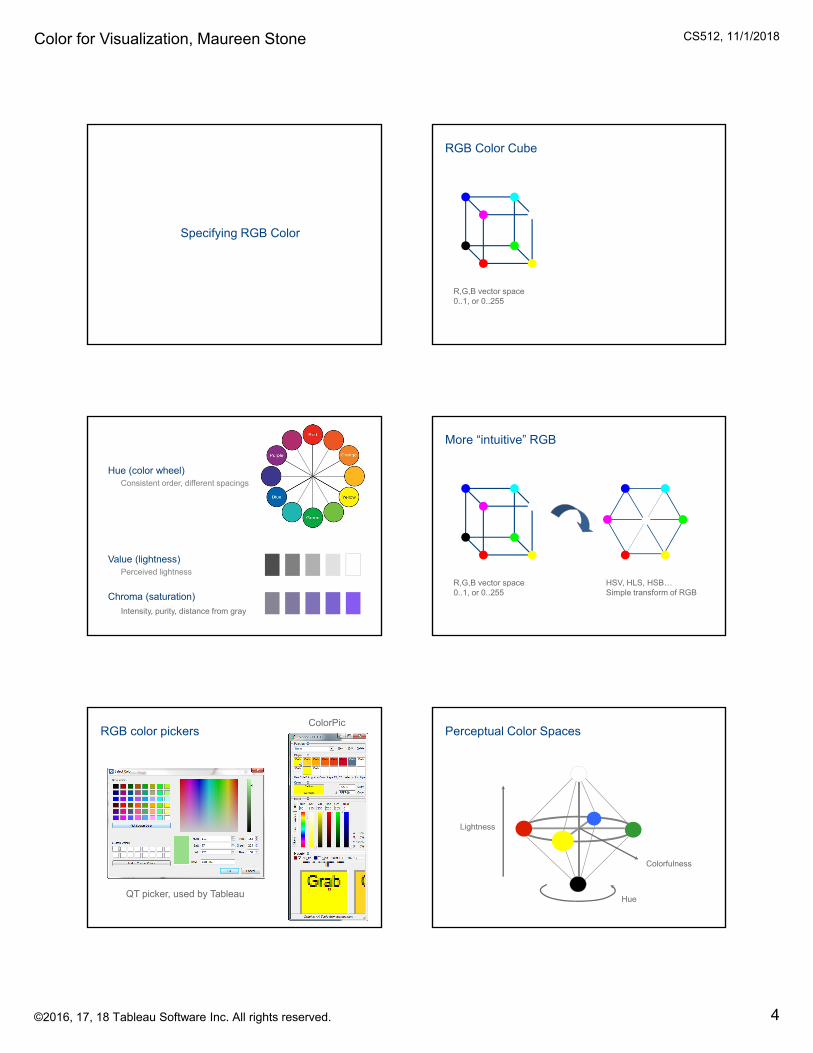
Specifying RGB Color
RGB Color Cube
R,G,B vector space0..1, or 0..255
Chroma (saturation)
Intensity, purity, distance from gray
Hue (color wheel)Consistent order, different spacings
Value (lightness)Perceived lightness
More “intuitive” RGB
R,G,B vector space0..1, or 0..255
HSV, HLS, HSB…Simple transform of RGB
RGB color pickers
QT picker, used by Tableau
ColorPicPerceptual Color Spaces
Lightness
Hue
Colorfulness
Color for Visualization, Maureen Stone CS512, 11/1/2018
©2016, 17, 18 Tableau Software Inc. All rights reserved. 5
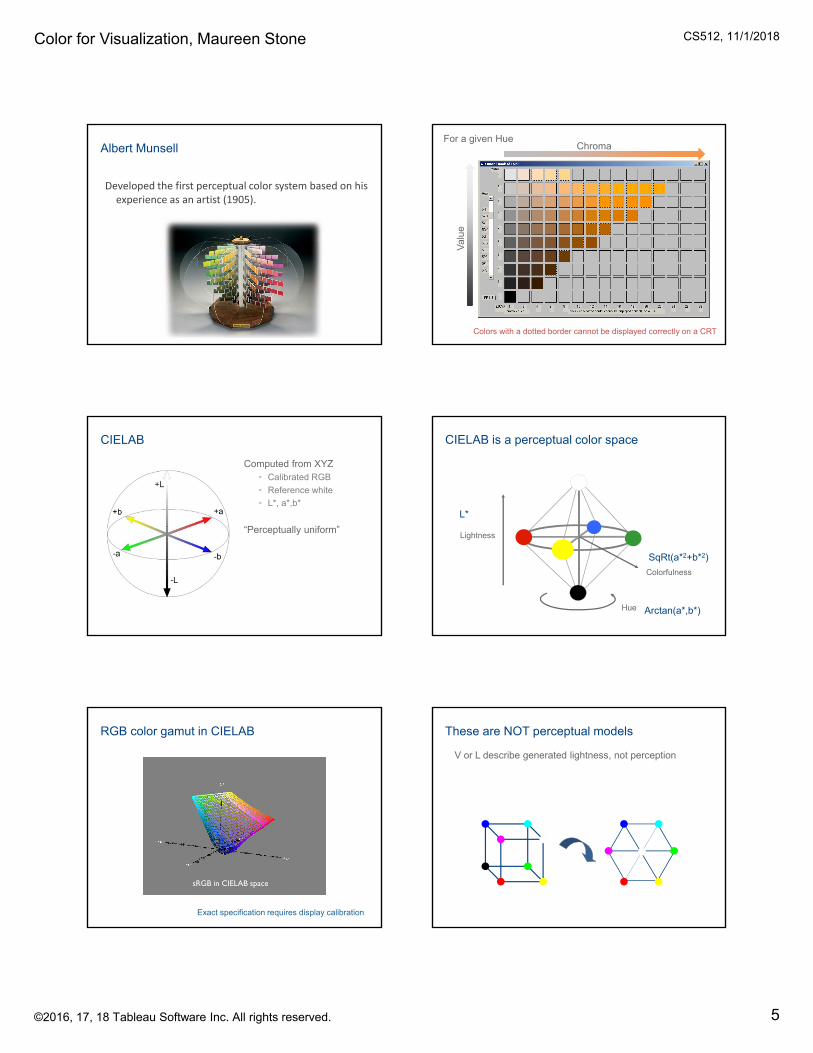
Albert Munsell
Developed the first perceptual color system based on his experience as an artist (1905).
Chroma
Val
ue
For a given Hue
Colors with a dotted border cannot be displayed correctly on a CRT
CIELAB
Computed from XYZ• Calibrated RGB
• Reference white
• L*, a*,b*
“Perceptually uniform”
CIELAB is a perceptual color space
Lightness
Hue
Colorfulness
L*
Arctan(a*,b*)
SqRt(a*2+b*2)
RGB color gamut in CIELAB
sRGB in CIELAB space
Exact specification requires display calibration
These are NOT perceptual models
V or L describe generated lightness, not perception
Color for Visualization, Maureen Stone CS512, 11/1/2018
©2016, 17, 18 Tableau Software Inc. All rights reserved. 6
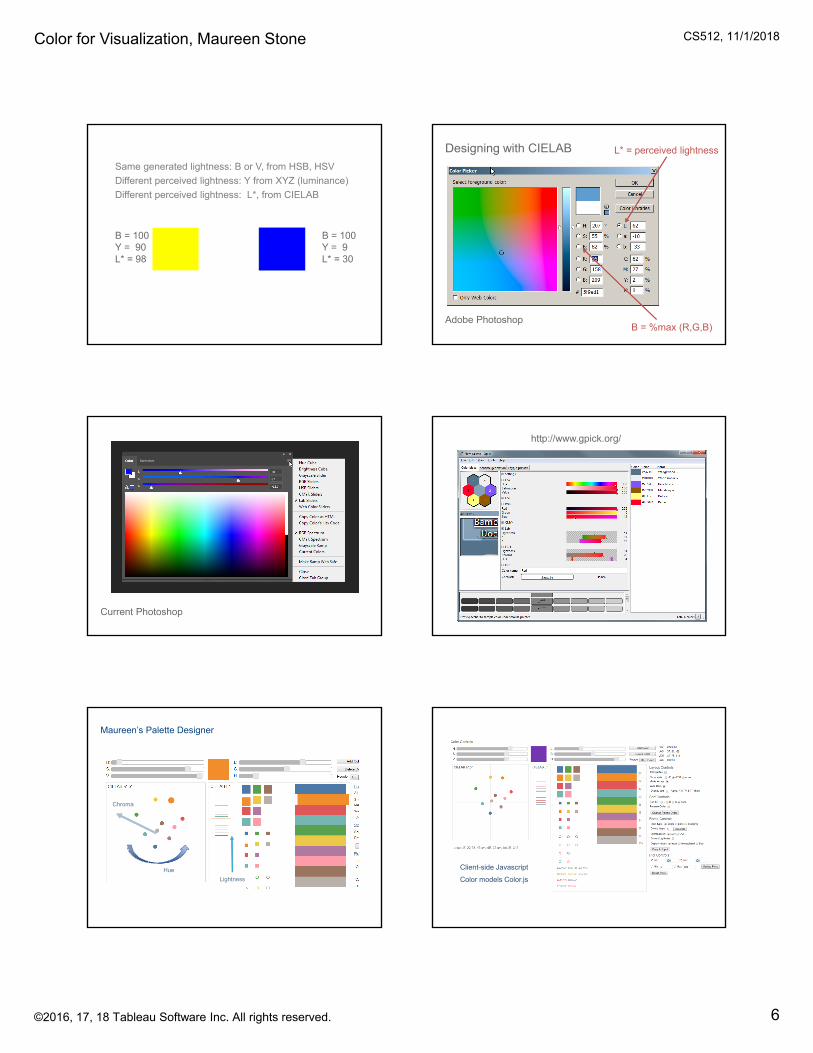
Same generated lightness: B or V, from HSB, HSV
Different perceived lightness: Y from XYZ (luminance)
Different perceived lightness: L*, from CIELAB
B = 100Y = 90L* = 98
B = 100Y = 9L* = 30
L* = perceived lightness
B = %max (R,G,B)
Designing with CIELAB
Adobe Photoshop
Current Photoshop
http://www.gpick.org/
Maureen’s Palette Designer
Hue
Chroma
Lightness
Client-side Javascript
Color models Color.js
Color for Visualization, Maureen Stone CS512, 11/1/2018
©2016, 17, 18 Tableau Software Inc. All rights reserved. 7
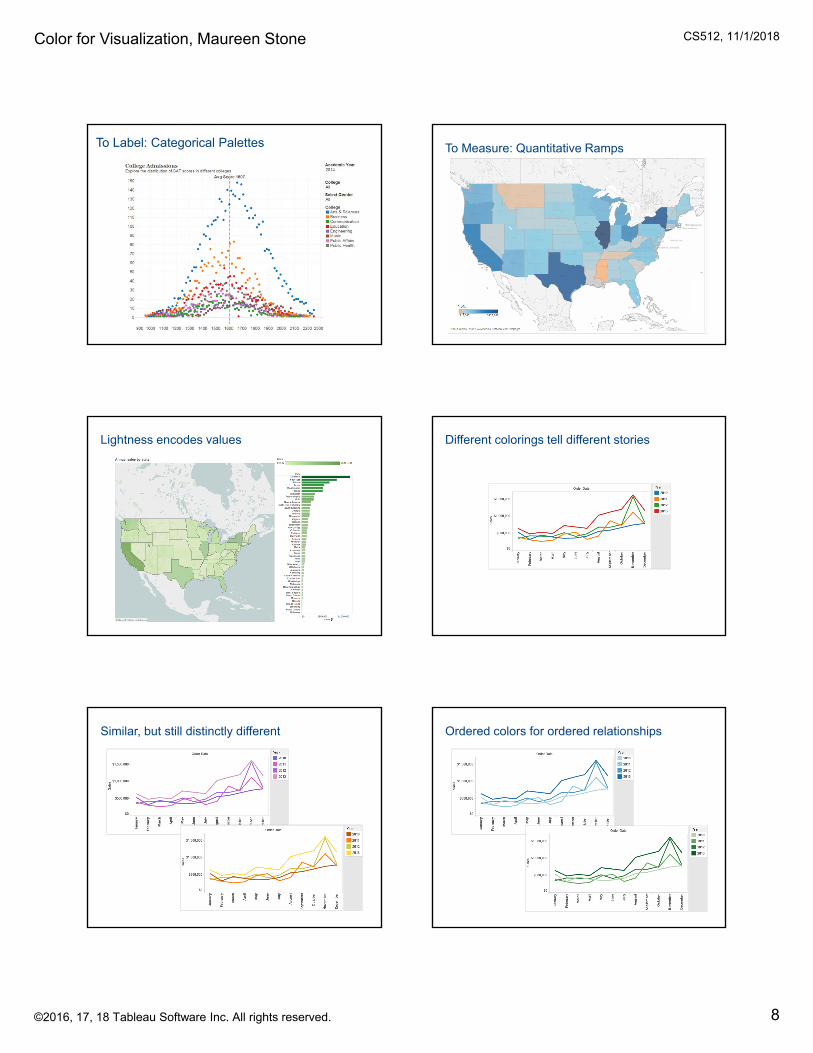
Mantis Shrimp
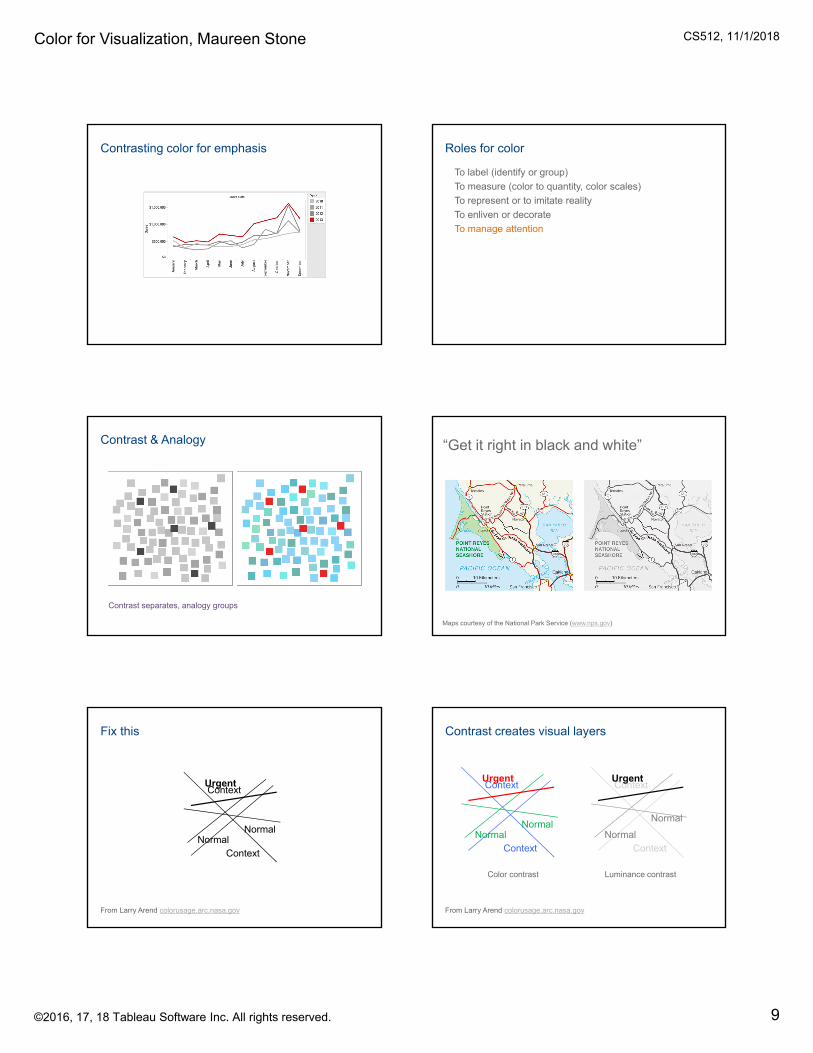
PerceptionCone responseLightness + color
CreationABCDEFGHIJKLMNO,
…
MeasurementTristimulus values (XYZ)CIELAB (L*,a*,b*)CIELUV (L*,u*,v*)…
EncodingsRGBAdobe RGBrec 709 (video)…
Questions on part 1?
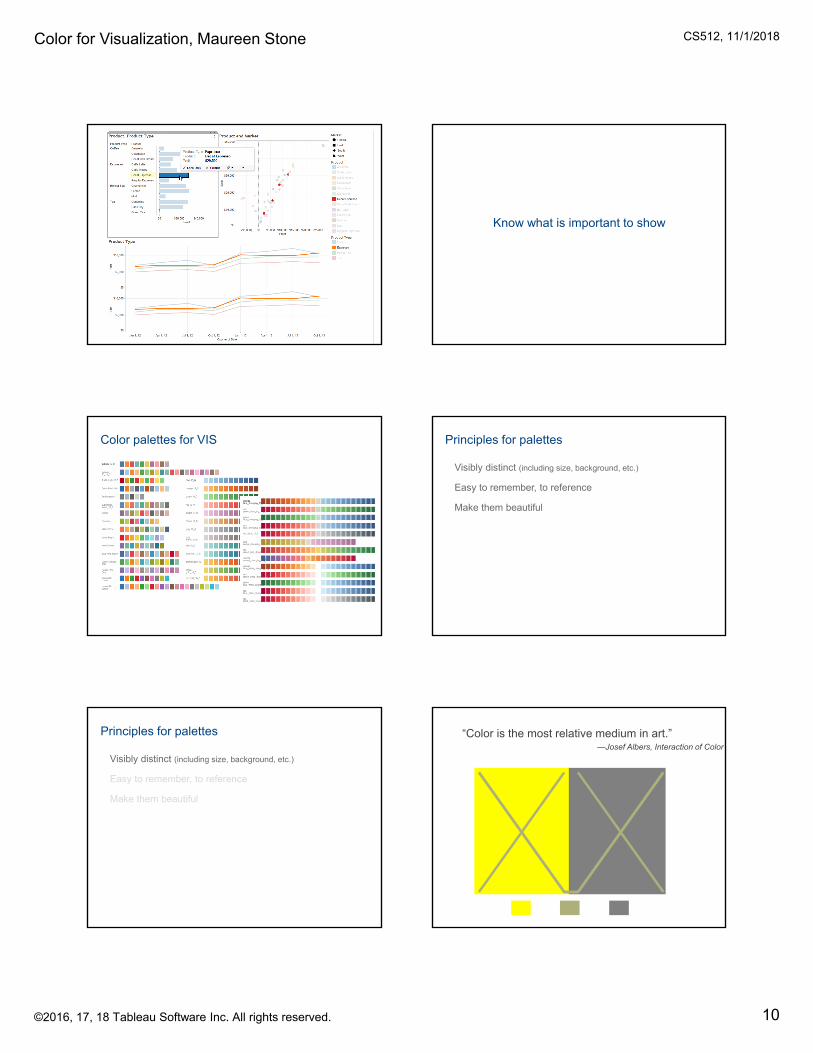
“… avoiding catastrophe becomes the first principle in bringing color to information:
Above all, do no harm.”
—E. R. Tufte
If you can’t use color wisely,it is best to avoid it entirelyAbove all, do no harm
Tufte’s fundamental uses
To label (identify or group)
To measure (color to quantity, color scales)
To represent or to imitate reality
To enliven or decorate
Color for Visualization, Maureen Stone CS512, 11/1/2018
©2016, 17, 18 Tableau Software Inc. All rights reserved. 8
To Label: Categorical Palettes To Measure: Quantitative Ramps
Lightness encodes values Different colorings tell different stories
Similar, but still distinctly different Ordered colors for ordered relationships
Color for Visualization, Maureen Stone CS512, 11/1/2018
©2016, 17, 18 Tableau Software Inc. All rights reserved. 9
Contrasting color for emphasis Roles for color
To label (identify or group)
To measure (color to quantity, color scales)
To represent or to imitate reality
To enliven or decorate
To manage attention
Contrast & Analogy
Contrast separates, analogy groups
Maps courtesy of the National Park Service (www.nps.gov)
“Get it right in black and white”
Fix this
From Larry Arend colorusage.arc.nasa.gov
Context
ContextNormal
Urgent
Normal
Contrast creates visual layers
Context
ContextNormal
Urgent
From Larry Arend colorusage.arc.nasa.gov
Context
ContextNormal
Urgent
NormalNormal
Color contrast Luminance contrast
Color for Visualization, Maureen Stone CS512, 11/1/2018
©2016, 17, 18 Tableau Software Inc. All rights reserved. 10
Know what is important to show
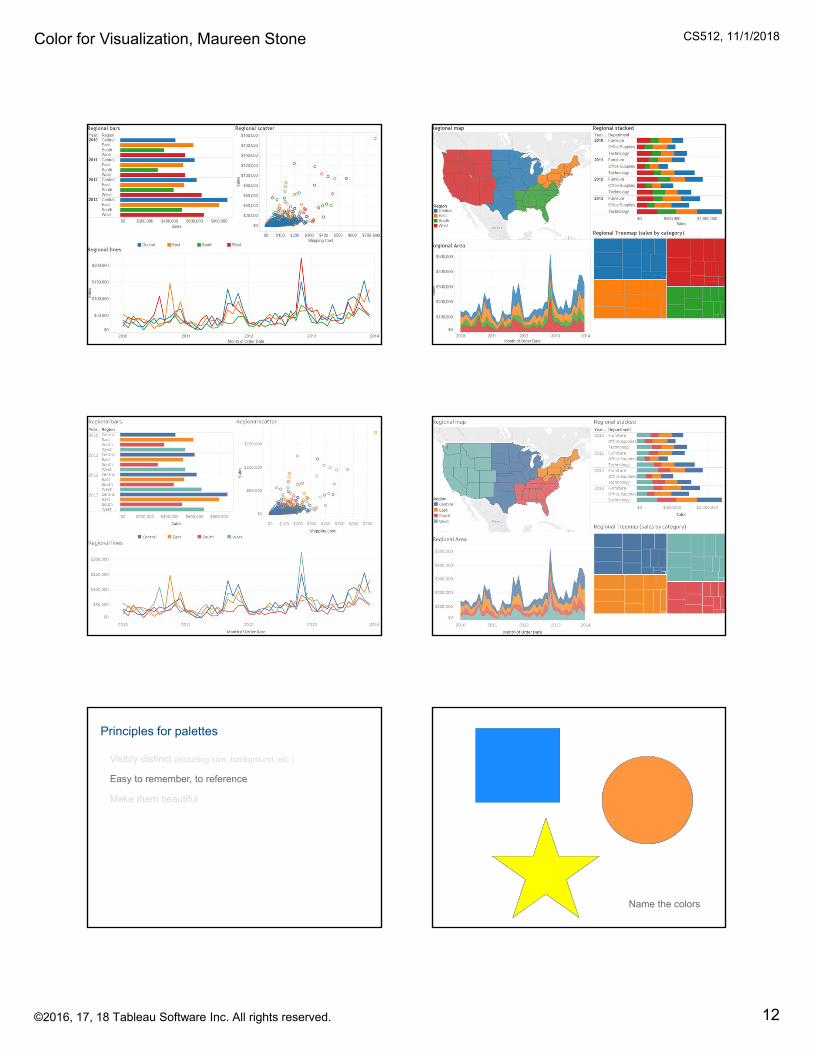
Color palettes for VIS Principles for palettes
Visibly distinct (including size, background, etc.)
Easy to remember, to reference
Make them beautiful
Principles for palettes
Visibly distinct (including size, background, etc.)
Easy to remember, to reference
Make them beautiful
“Color is the most relative medium in art.” —Josef Albers, Interaction of Color
Color for Visualization, Maureen Stone CS512, 11/1/2018
©2016, 17, 18 Tableau Software Inc. All rights reserved. 11
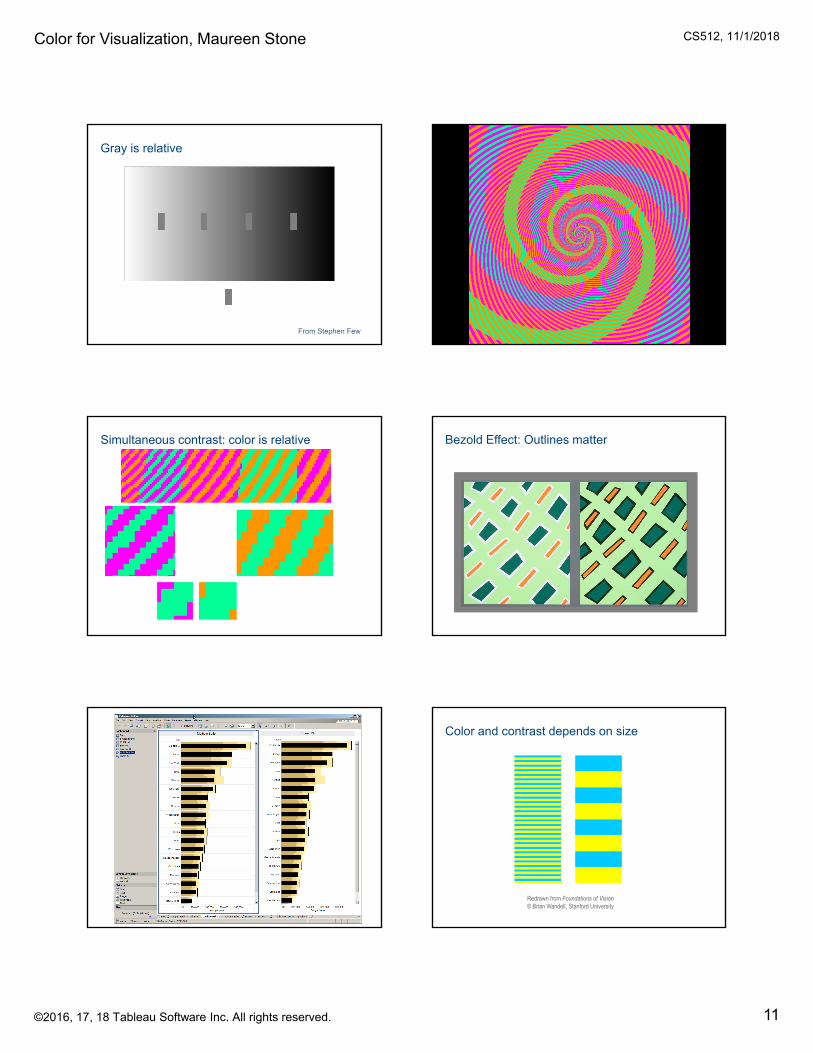
Gray is relative
From Stephen Few
Simultaneous contrast: color is relative Bezold Effect: Outlines matter
Color and contrast depends on size
Redrawn from Foundations of Vision© Brian Wandell, Stanford University
Color for Visualization, Maureen Stone CS512, 11/1/2018
©2016, 17, 18 Tableau Software Inc. All rights reserved. 12
Principles for palettes
Visibly distinct (including size, background, etc.)
Easy to remember, to reference
Make them beautiful
Name the colors
Color for Visualization, Maureen Stone CS512, 11/1/2018
©2016, 17, 18 Tableau Software Inc. All rights reserved. 13
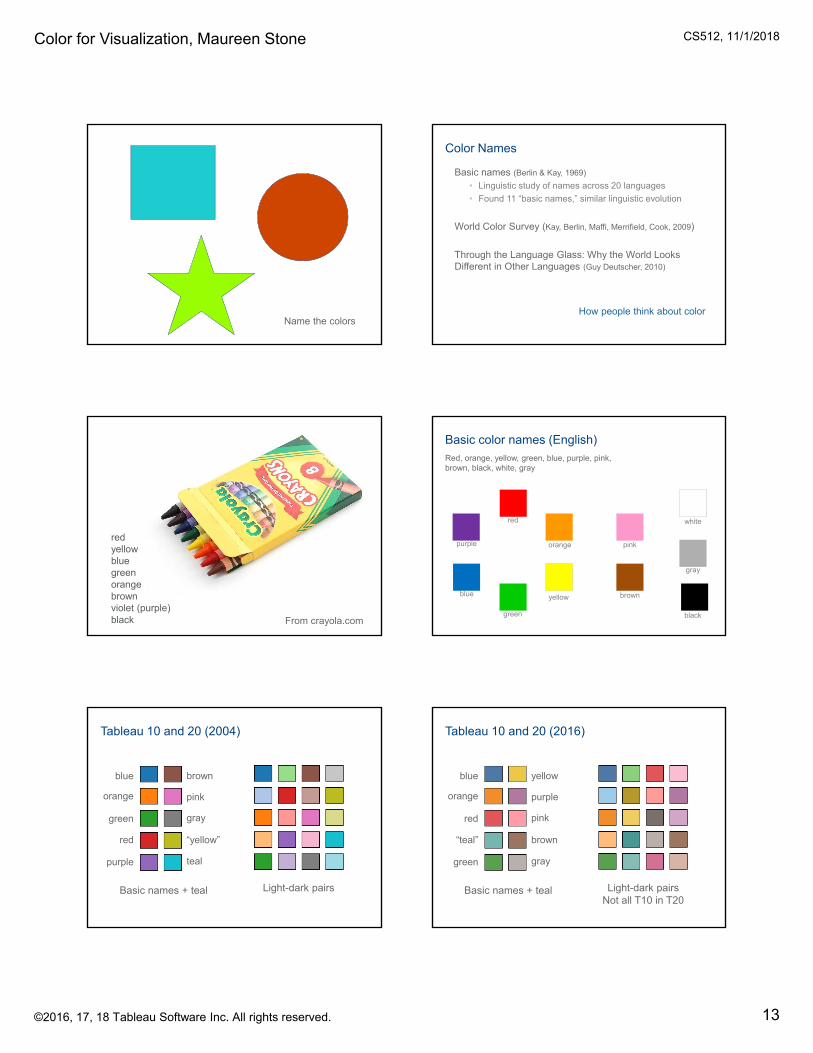
Name the colors
Color Names
Basic names (Berlin & Kay, 1969)
• Linguistic study of names across 20 languages
• Found 11 “basic names,” similar linguistic evolution
World Color Survey (Kay, Berlin, Maffi, Merrifield, Cook, 2009)
Through the Language Glass: Why the World Looks Different in Other Languages (Guy Deutscher, 2010)
How people think about color
redyellowbluegreenorangebrownviolet (purple)black From crayola.com
Basic color names (English) Red, orange, yellow, green, blue, purple, pink, brown, black, white, gray
green
red
blue
purple pinkorange
yellow brown
gray
white
black
Tableau 10 and 20 (2004)
blue
orange
“yellow”
gray
teal
brown
red
purple
green
pink
Basic names + teal Light-dark pairs
Tableau 10 and 20 (2016)
blue
orange
brown
pink
gray
yellow
“teal”
green
red
purple
Basic names + teal Light-dark pairsNot all T10 in T20
Color for Visualization, Maureen Stone CS512, 11/1/2018
©2016, 17, 18 Tableau Software Inc. All rights reserved. 14
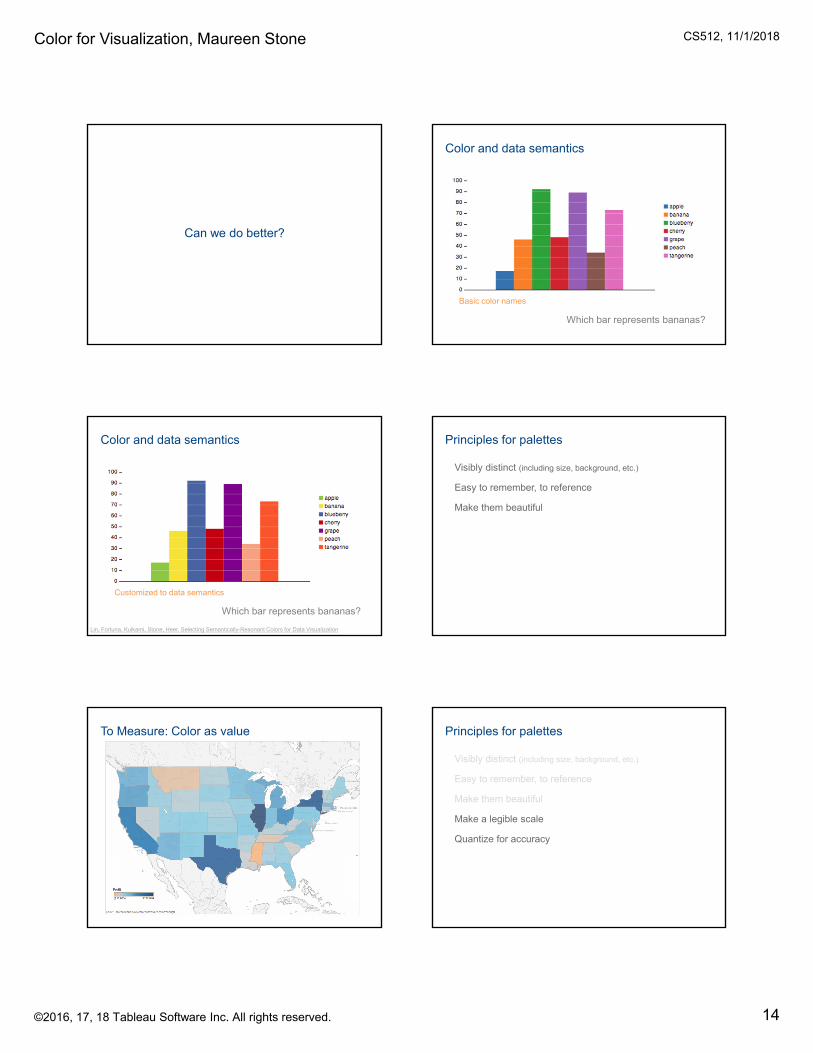
Can we do better?
Color and data semantics
Which bar represents bananas?
Basic color names
Color and data semantics
Which bar represents bananas?
Lin, Fortuna, Kulkami, Stone, Heer. Selecting Semantically-Resonant Colors for Data Visualization
Customized to data semantics
Principles for palettes
Visibly distinct (including size, background, etc.)
Easy to remember, to reference
Make them beautiful
To Measure: Color as value Principles for palettes
Visibly distinct (including size, background, etc.)
Easy to remember, to reference
Make them beautiful
Make a legible scale
Quantize for accuracy
Color for Visualization, Maureen Stone CS512, 11/1/2018
©2016, 17, 18 Tableau Software Inc. All rights reserved. 15
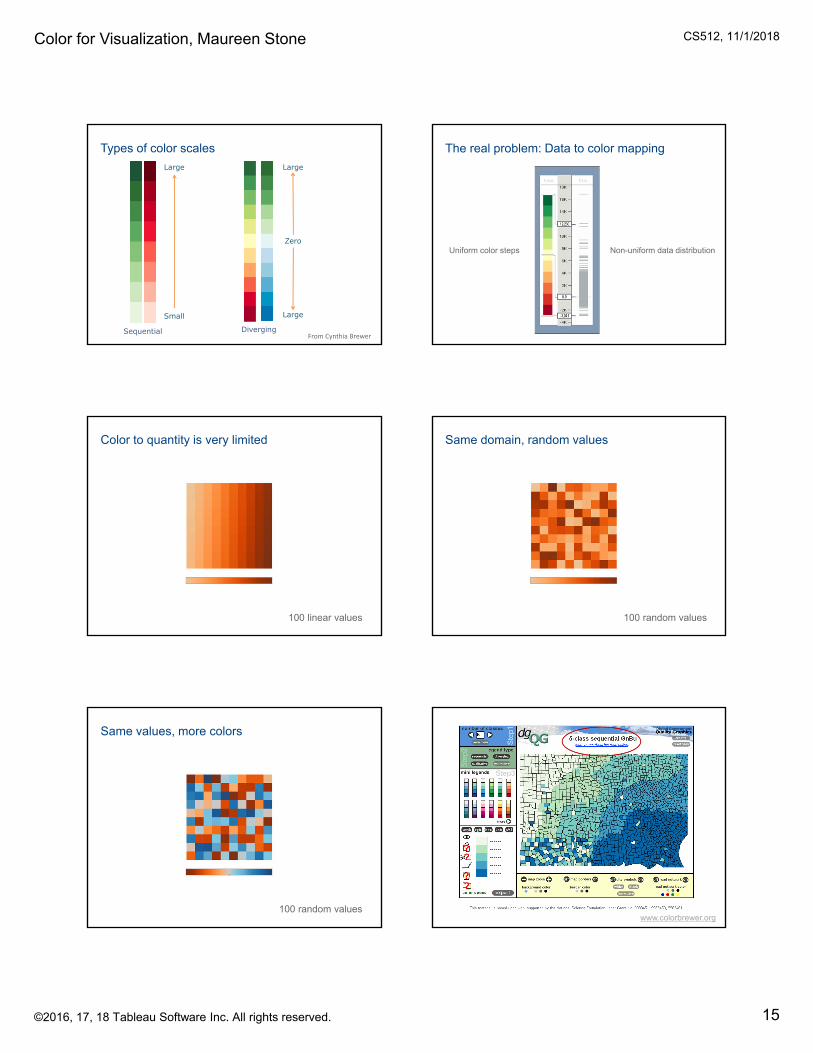
Types of color scales
From Cynthia Brewer
Large
Small
Large
Large
Zero
Sequential Diverging
The real problem: Data to color mapping
Uniform color steps Non-uniform data distribution
Color to quantity is very limited
100 linear values
Same domain, random values
100 random values
Same values, more colors
100 random valueswww.colorbrewer.org
Color for Visualization, Maureen Stone CS512, 11/1/2018
©2016, 17, 18 Tableau Software Inc. All rights reserved. 16
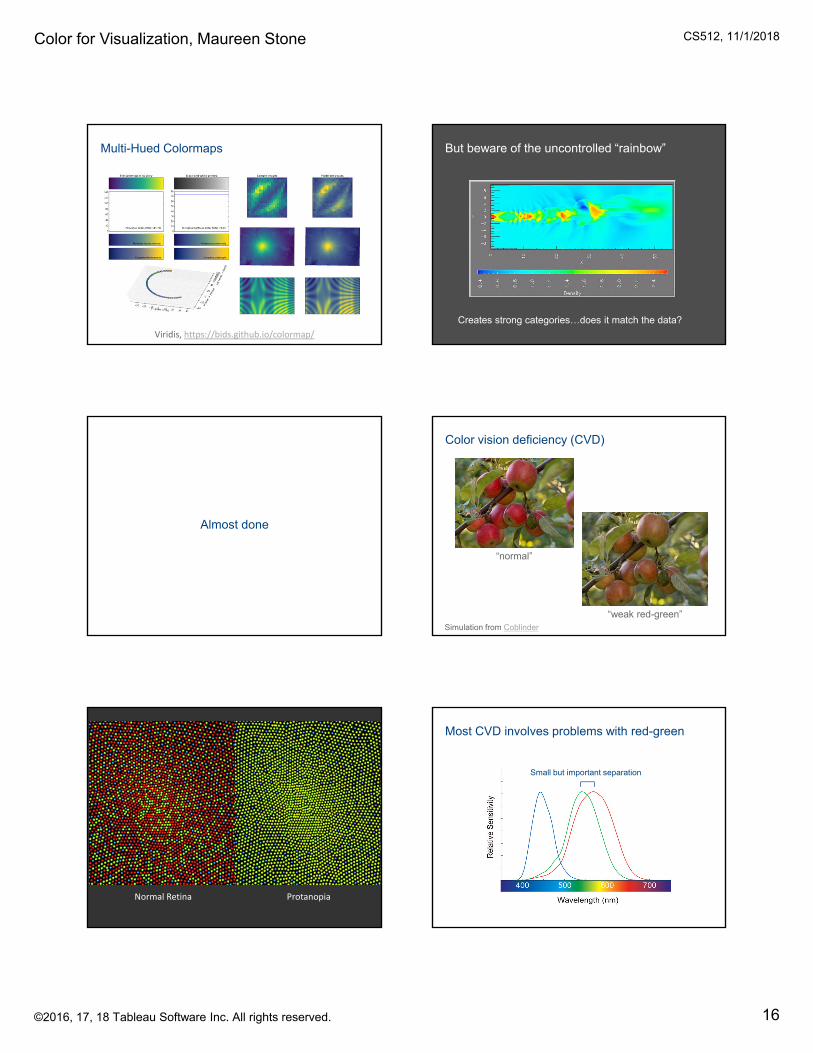
Multi-Hued Colormaps
Viridis, https://bids.github.io/colormap/
But beware of the uncontrolled “rainbow”
Creates strong categories…does it match the data?
Almost done
Color vision deficiency (CVD)
“normal”
“weak red-green”Simulation from Coblinder
Normal Retina Protanopia
Most CVD involves problems with red-green
Small but important separation
Color for Visualization, Maureen Stone CS512, 11/1/2018
©2016, 17, 18 Tableau Software Inc. All rights reserved. 17
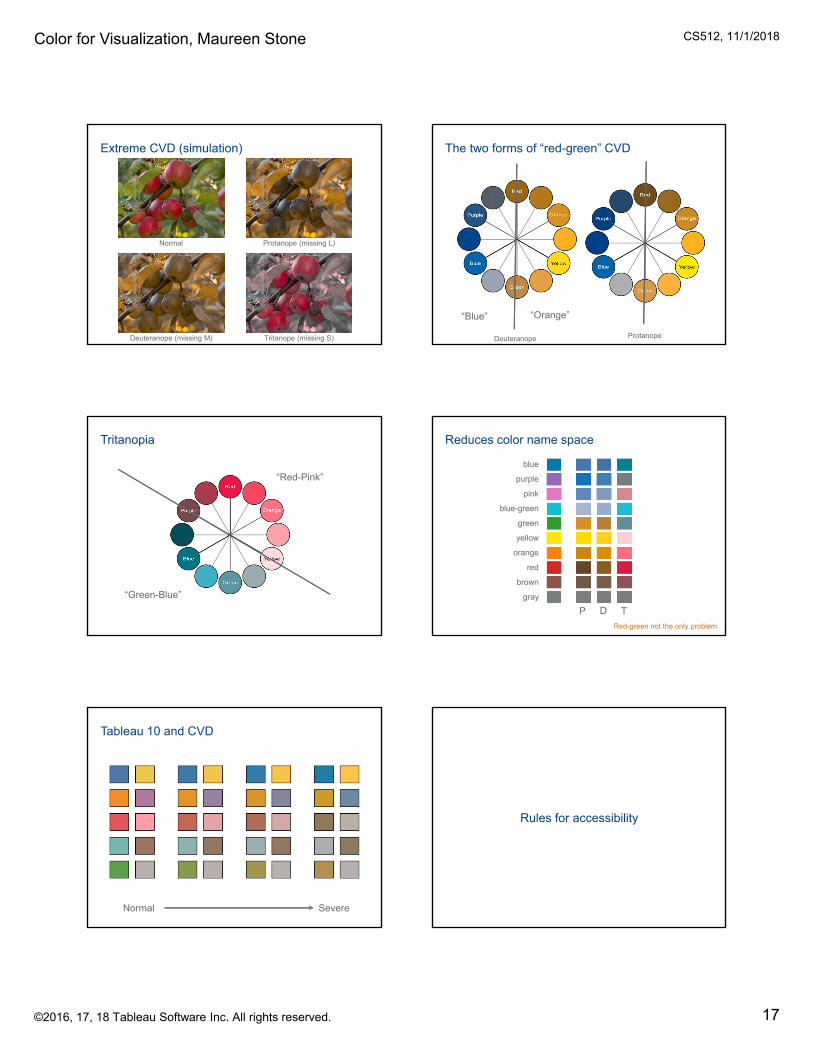
Extreme CVD (simulation)
Normal
Deuteranope (missing M) Tritanope (missing S)
Protanope (missing L)
The two forms of “red-green” CVD
Deuteranope Protanope
“Blue” “Orange”
Tritanopia
“Green-Blue”
“Red-Pink”
Reduces color name space
blue
purple
pink
blue-green
green
yellow
orange
red
brown
gray
P D T
Red-green not the only problem
Tableau 10 and CVD
Normal Severe
Rules for accessibility
Color for Visualization, Maureen Stone CS512, 11/1/2018
©2016, 17, 18 Tableau Software Inc. All rights reserved. 18
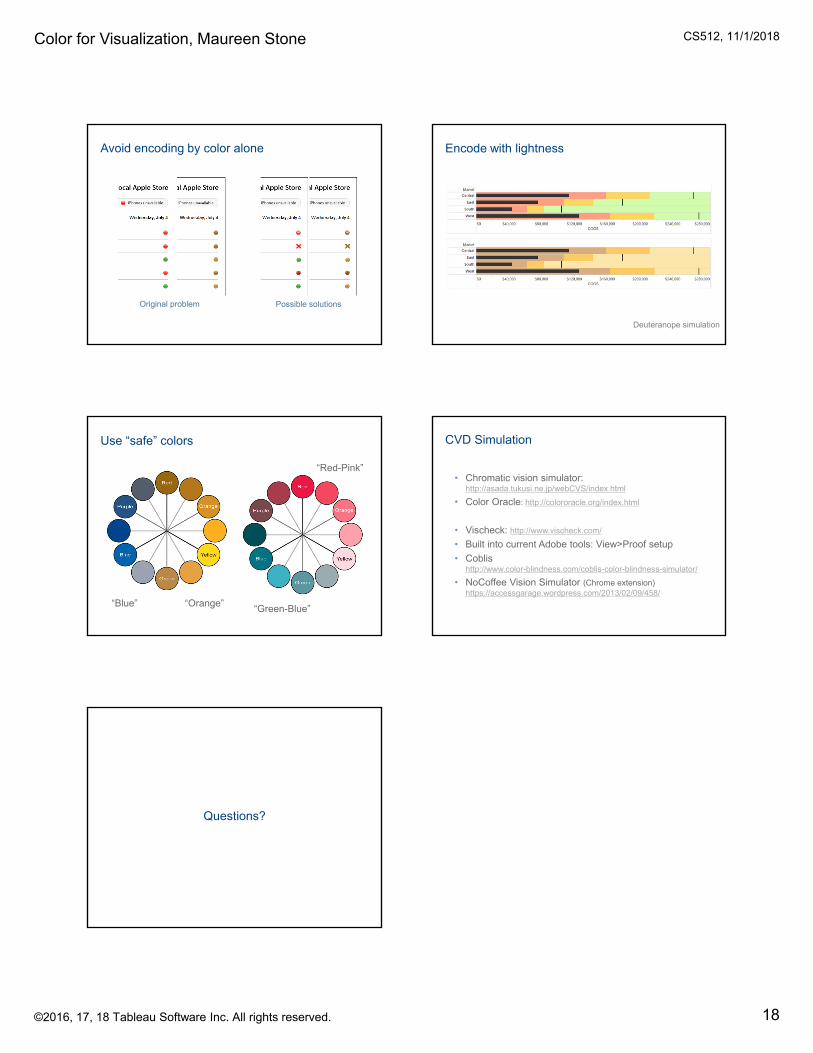
Avoid encoding by color alone
Original problem Possible solutions
Encode with lightness
Deuteranope simulation
Use “safe” colors
“Blue” “Orange”“Green-Blue”
“Red-Pink”
CVD Simulation
• Chromatic vision simulator: http://asada.tukusi.ne.jp/webCVS/index.html
• Color Oracle: http://colororacle.org/index.html
• Vischeck: http://www.vischeck.com/
• Built into current Adobe tools: View>Proof setup
• Coblishttp://www.color-blindness.com/coblis-color-blindness-simulator/
• NoCoffee Vision Simulator (Chrome extension)https://accessgarage.wordpress.com/2013/02/09/458/
Questions?