Colombians in Boston - 2017
12
Colombians in Boston Vivian Gutierrez de Pineres, a U.S. Air Guard recruit originally from Colombia, takes the Oath of Allegiance to the United States on July 20, 2016 in Tucson, Arizona, making her a naturalized citizen (U.S. Air Force Photo by Maj. Gabe Johnson, ANG Public Affairs).
-
Upload
boston-redevelopment-authority -
Category
Government & Nonprofit
-
view
8 -
download
0
Transcript of Colombians in Boston - 2017

Colombians
in Boston
Vivian Gutierrez de Pineres, a U.S. Air Guard recruit originally from Colombia, takes the Oath of Allegiance to
the United States on July 20, 2016 in Tucson, Arizona, making her a naturalized citizen (U.S. Air Force Photo by
Maj. Gabe Johnson, ANG Public Affairs).
The Boston Planning & Development Agency
We strive to understand the current environment of the city to produce quality research and targeted
information that will inform and benefit the residents and businesses of Boston. Our Division conducts
research on Boston’s economy, population, and commercial markets for all departments of the BPDA,
the City of Boston, and related organizations.
The information provided in this report is the best available at the time of its publication. All or partial
use of this report must be cited.
Citation
Please cite this publication as: Boston Planning & Development Agency Research Division, April 2017
Information
For more information about research produced by the Boston Planning & Development Agency, please
see the BPDA Research website: http://www.bostonplans.org/research-maps/research/research-
publications
Requests
Research inquiries can be made through the BPDA research website: http://www.bostonplans.org/
research-maps/research/research-inquiries
Director Alvaro Lima Deputy Director Jonathan Lee Research Manager Christina Kim
Research Division
Senior Researcher Economist
Matthew Resseger
Senior Researcher Demographer
Phillip Granberry
Research Associate
Kevin Kang
Research Assistants
Kevin Wandrei
Avanti Krovi
Interns Ian Whitney Juan Rodriguez Cyan O’Garro
Data Notes
Unless otherwise noted data for this report come from the U.S. Census Bureau, 2011-2015 American Community Survey, Public Use Microdata Sample (PUMS), BPDA Research Division Analysis.
Percentages may not sum to 100% due to rounding.
“Latino includes people who 1. self-describe their ethnicity as “Hispanic or Latino”, or 2. were born in Brazil, or 3. wo self-describe their ancestry as Brazilian.
3 | bostonplans.org
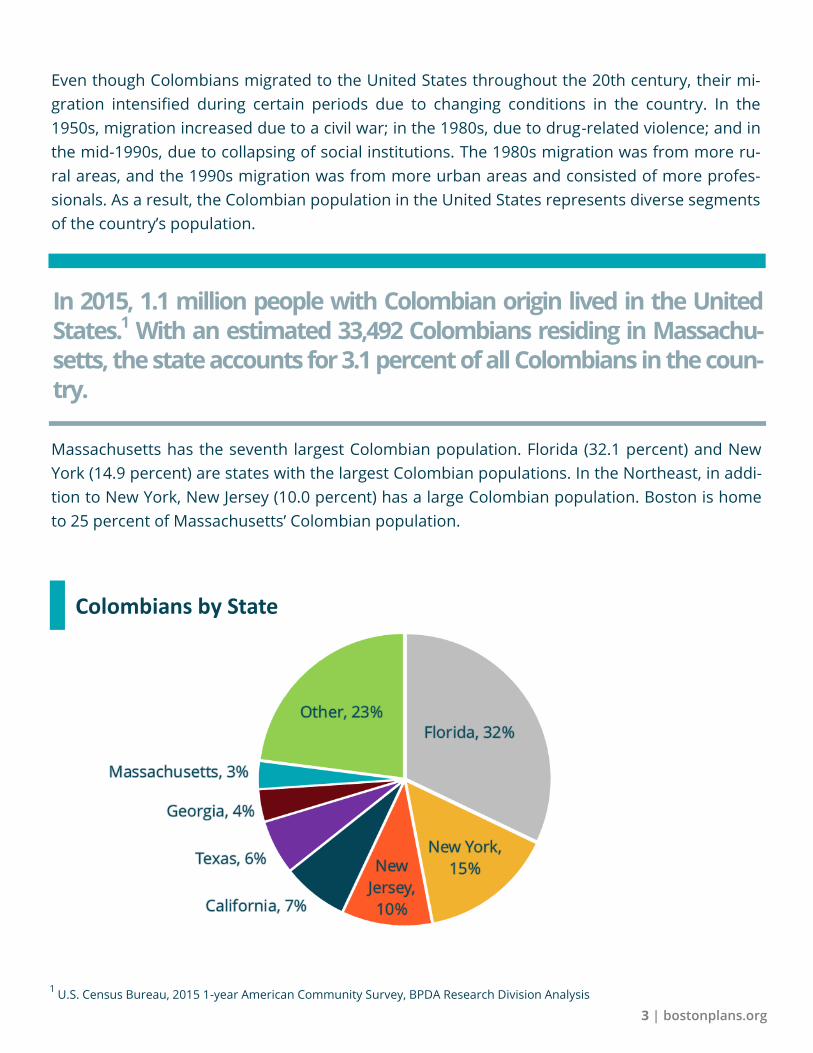
In 2015, 1.1 million people with Colombian origin lived in the United States.1 With an estimated 33,492 Colombians residing in Massachu-setts, the state accounts for 3.1 percent of all Colombians in the coun-try.
Even though Colombians migrated to the United States throughout the 20th century, their mi-
gration intensified during certain periods due to changing conditions in the country. In the
1950s, migration increased due to a civil war; in the 1980s, due to drug-related violence; and in
the mid-1990s, due to collapsing of social institutions. The 1980s migration was from more ru-
ral areas, and the 1990s migration was from more urban areas and consisted of more profes-
sionals. As a result, the Colombian population in the United States represents diverse segments
of the country’s population.
Massachusetts has the seventh largest Colombian population. Florida (32.1 percent) and New
York (14.9 percent) are states with the largest Colombian populations. In the Northeast, in addi-
tion to New York, New Jersey (10.0 percent) has a large Colombian population. Boston is home
to 25 percent of Massachusetts’ Colombian population.
Colombians by State
1 U.S. Census Bureau, 2015 1-year American Community Survey, BPDA Research Division Analysis
4 | Latinos In Boston
Colombians in Boston
According to the 2010 Census, Boston had 6,649 Colombian residents, up from 4,677 in the
2000 Census. The American Community Survey reports that Boston’s Colombian population
grew by 2015 to 8,440 (+/-2,676).2 Accounting for 6 percent of all Latinos in Boston, Colombians
are the fourth largest Latino population in the city. Other large Latino populations include Puer-
to Ricans (28 percent), Dominicans (24 percent), Salvadorans (11 percent), and Mexicans (5 per-
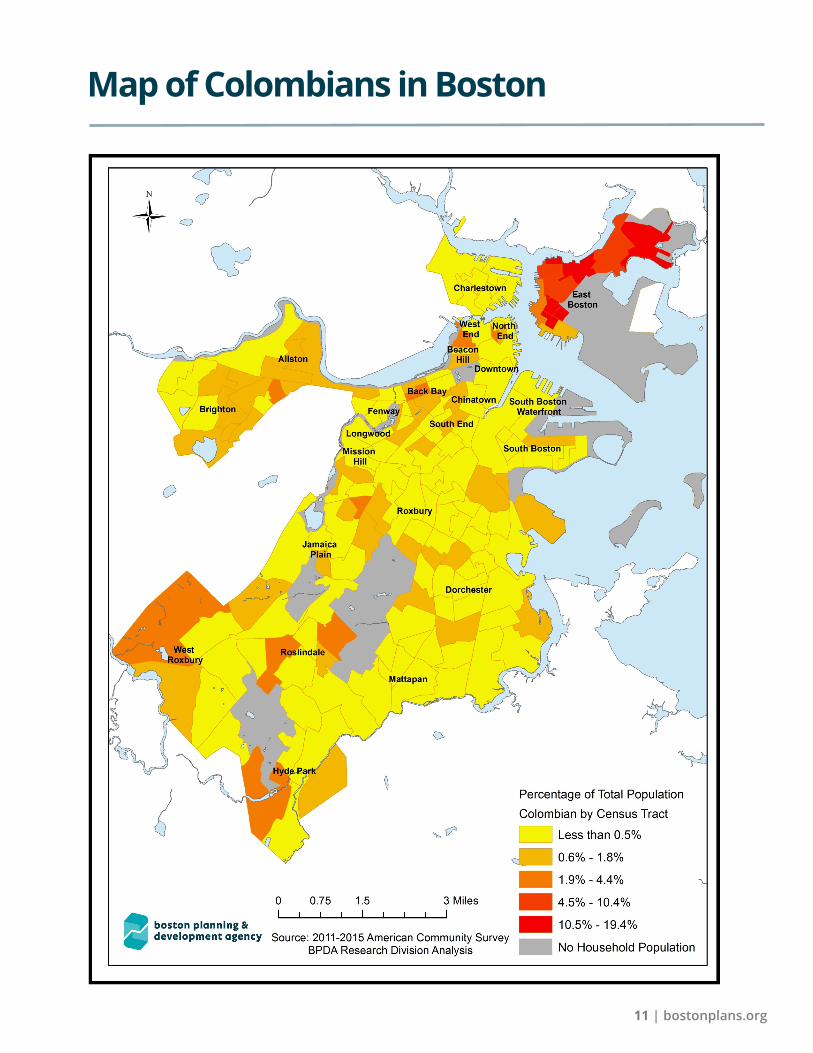
cent). Colombians are concentrated in East Boston (61 percent), and smaller shares live in
Brighton (4 percent), Dorchester (4 percent), and Hyde Park (4 percent).3
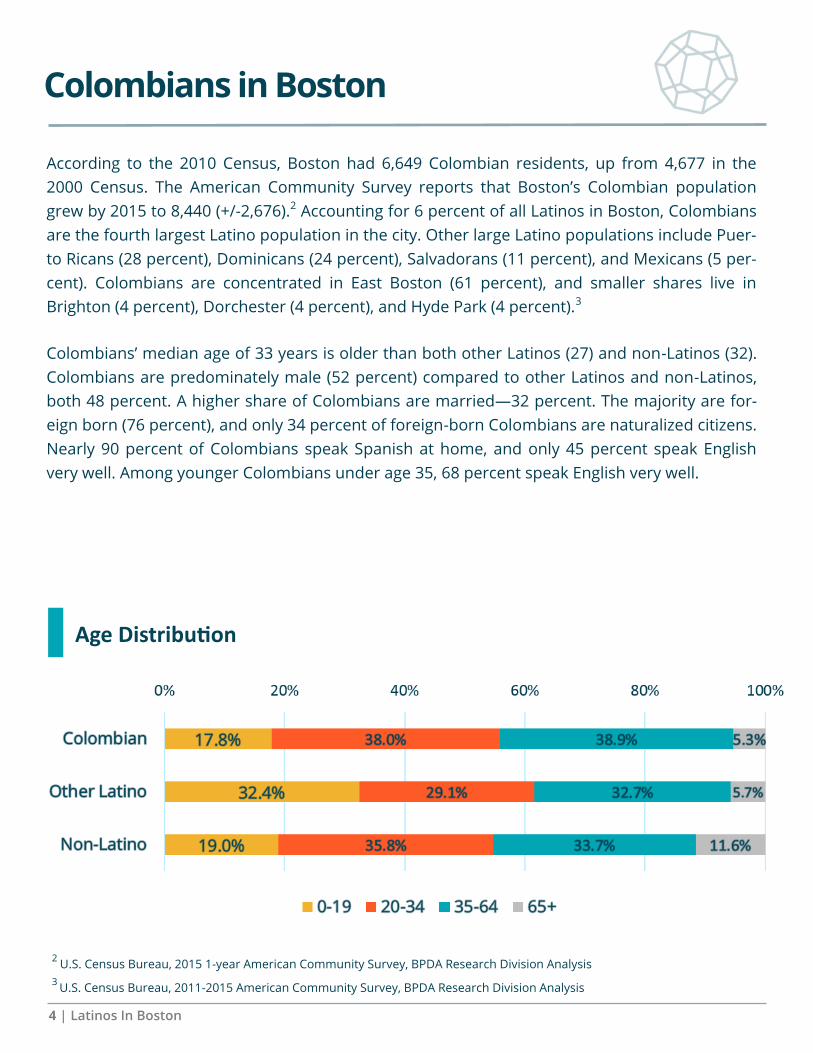
Colombians’ median age of 33 years is older than both other Latinos (27) and non-Latinos (32).
Colombians are predominately male (52 percent) compared to other Latinos and non-Latinos,
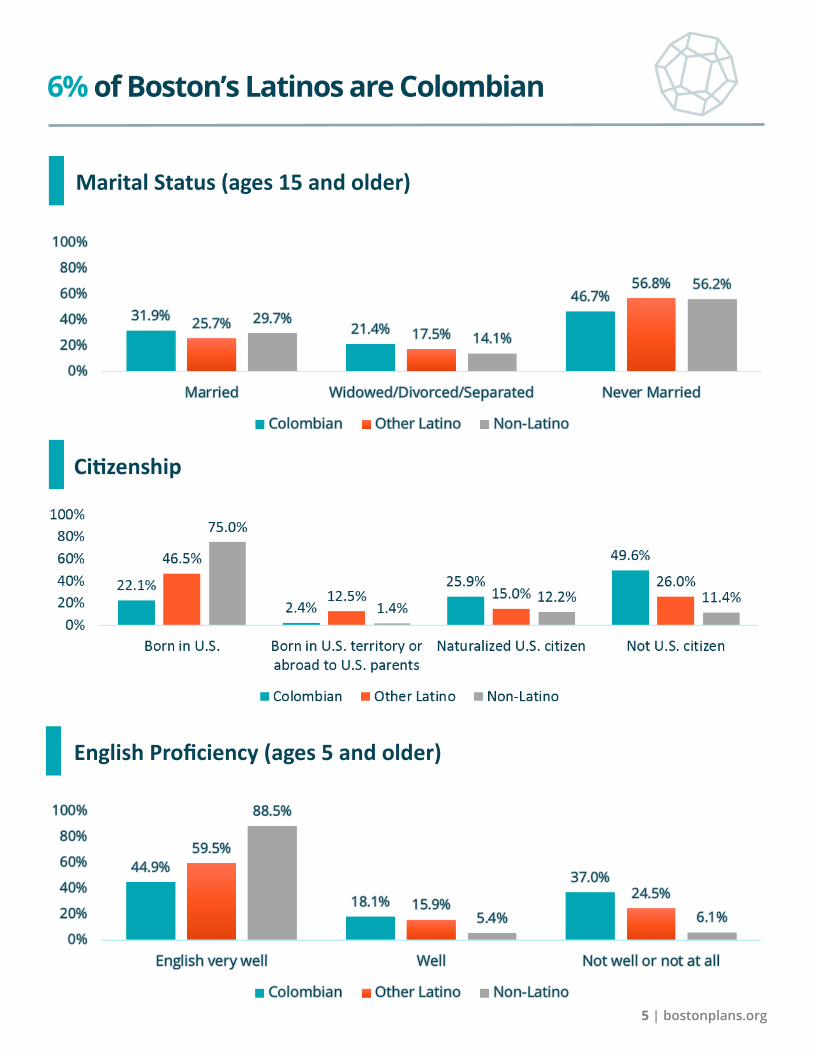
both 48 percent. A higher share of Colombians are married—32 percent. The majority are for-
eign born (76 percent), and only 34 percent of foreign-born Colombians are naturalized citizens.
Nearly 90 percent of Colombians speak Spanish at home, and only 45 percent speak English
very well. Among younger Colombians under age 35, 68 percent speak English very well.
Age Distribution
2 U.S. Census Bureau, 2015 1-year American Community Survey, BPDA Research Division Analysis
3 U.S. Census Bureau, 2011-2015 American Community Survey, BPDA Research Division Analysis
5 | bostonplans.org
Citizenship
English Proficiency (ages 5 and older)
Marital Status (ages 15 and older)
6% of Boston’s Latinos are Colombian

6 | Latinos In Boston
Workforce
Educational Attainment | The educational attainment of Colombians varies widely among
individuals. About a quarter of adult Colombians have not completed high school, but another
quarter of adult Colombians have a Bachelor’s degree or higher.
Educational Attainment (ages 25 and older)
Labor Force Participation | A much higher share of adult Colombians participate in the
labor force—80 percent compared to 66 percent for other Latinos (66 percent) and 68 percent
for non-Latinos. Labor force participation is higher for Colombian men than women (82 percent
vs. 78 percent).
Commute | A smaller share of Colombians (28 percent) work outside of Suffolk County
than other Latinos (30 percent) and non-Latinos (33 percent). Colombians (56 percent) are more
likely to travel to work by public transportation than other Latinos (43 percent) or non-Latinos
(32 percent).
School Enrollment | Colombians make up about one percent of both Boston residents en-
rolled in pre-kindergarten through twelfth grade, and Boston residents enrolled in college or
university.
Employment | About 8 percent of employed Colombians are self-employed, a higher share
than other groups. Over 57 percent of employed Colombians work in service occupations, and
only 8 percent work in managerial and professional occupations.

7 | bostonplans.org
Occupations of Employed Workers
76% of Colombians are employed
Employment Type ages 16 and older)

8 | Latinos In Boston
Standard of Living
Approximately 22 percent of Colombians live below the Census poverty line, a lower share com-
pared to other Latinos. Only 26 percent of Colombians have achieved a middle class standard of
living. A family income four times the poverty line is used as a proxy for a middle-class standard
of living. The actual income needed to achieve this standard depends on family composition. For
a two-person family in 2015, the poverty line is $15,391, and a middle class income would need
to be at least $61,564. The median household income for Colombian-headed households is
$48,903. Despite median incomes that may be considered lower middle class, a high share (14
percent) of Colombians do not have health insurance, perhaps because of the high rate of self-
employment.
Colombians are less likely to own their own home (13 percent), than other Latinos (17percent)
and non-Latinos (37 percent).4 More than half of Colombian households (53 percent) are hous-
ing burdened and pay more than 30 percent of their income in housing costs. Just 46 percent of
Colombian households own a car, a lower share than other Latinos (58 percent) and non-Latinos
(66 percent).
Approximately 57 percent of Colombian households are families and the average household
size is 2.7, larger than the average for non-Latinos, 2.1.
Poverty Rates
4 The ACS excludes households that are vacant, being bought, occupied without rent payment, have no household income or are group quarters when reporting owner/renter costs as a percentage of household income. Therefore, the sum of housing–burdened and non-housing-burdened households may not add exactly to the total number of homeowners/renters.
Percent of Poverty Line

9 | bostonplans.org
22% of Colombians in Boston live in poverty
Tenure and Housing Burden
Median Household Income
Household Type

10 | Latinos In Boston
The 2011-2015 American Community Survey estimates 1,345 Colombian children reside in Bos-
ton. A smaller share of Colombian households include children compared to other Latinos– 31
percent compared to 43 percent. Even though 78 percent of Colombian children are native
born, 83 percent have at least one foreign-born parent. Colombian children are less likely to
live in poverty (34 percent), and over 99 percent of Colombian children have health insurance.
Parent Nativity
Child Poverty
Colombian Children
11 | bostonplans.org
Map of Colombians in Boston

Latinos in Boston
Puerto Ricans
Dominicans
Salvadorans
Colombians
Mexicans
Guatemalans
Brazilians
Research Division
June, 2017