Colloidal Gels Formed by Dilute Aqueous Dispersions of Surfactant ...
24
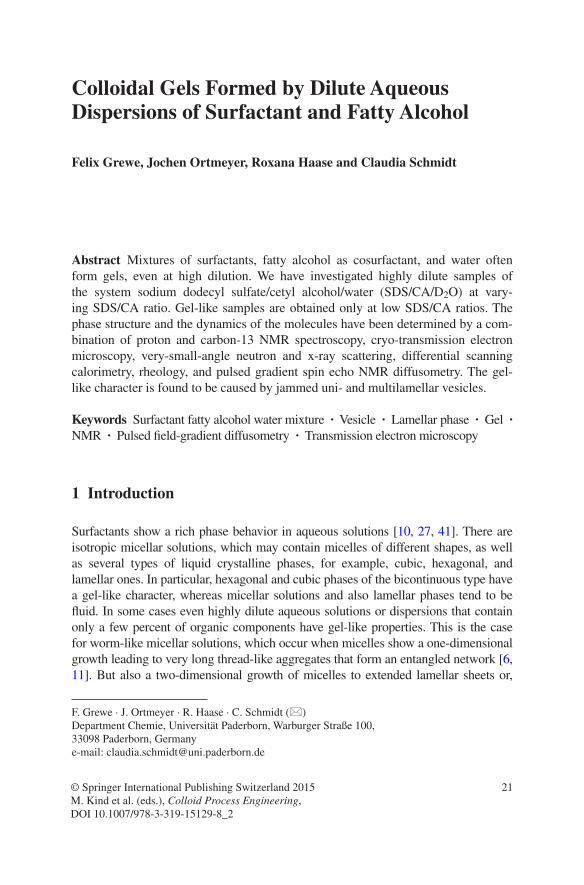
21 Colloidal Gels Formed by Dilute Aqueous Dispersions of Surfactant and Fatty Alcohol Felix Grewe, Jochen Ortmeyer, Roxana Haase and Claudia Schmidt © Springer International Publishing Switzerland 2015 M. Kind et al. (eds.), Colloid Process Engineering, DOI 10.1007/978-3-319-15129-8_2 Abstract Mixtures of surfactants, fatty alcohol as cosurfactant, and water often form gels, even at high dilution. We have investigated highly dilute samples of the system sodium dodecyl sulfate/cetyl alcohol/water (SDS/CA/D 2 O) at vary- ing SDS/CA ratio. Gel-like samples are obtained only at low SDS/CA ratios. The phase structure and the dynamics of the molecules have been determined by a com- bination of proton and carbon-13 NMR spectroscopy, cryo-transmission electron microscopy, very-small-angle neutron and x-ray scattering, differential scanning calorimetry, rheology, and pulsed gradient spin echo NMR diffusometry. The gel- like character is found to be caused by jammed uni- and multilamellar vesicles. Keywords Surfactant fatty alcohol water mixture · Vesicle · Lamellar phase · Gel · NMR · Pulsed field-gradient diffusometry · Transmission electron microscopy 1 Introduction Surfactants show a rich phase behavior in aqueous solutions [10, 27, 41]. There are isotropic micellar solutions, which may contain micelles of different shapes, as well as several types of liquid crystalline phases, for example, cubic, hexagonal, and lamellar ones. In particular, hexagonal and cubic phases of the bicontinuous type have a gel-like character, whereas micellar solutions and also lamellar phases tend to be fluid. In some cases even highly dilute aqueous solutions or dispersions that contain only a few percent of organic components have gel-like properties. This is the case for worm-like micellar solutions, which occur when micelles show a one-dimensional growth leading to very long thread-like aggregates that form an entangled network [6, 11]. But also a two-dimensional growth of micelles to extended lamellar sheets or, F. Grewe · J. Ortmeyer · R. Haase · C. Schmidt (*) Department Chemie, Universität Paderborn, Warburger Straße 100, 33098 Paderborn, Germany e-mail: [email protected]
Transcript of Colloidal Gels Formed by Dilute Aqueous Dispersions of Surfactant ...
21
Colloidal Gels Formed by Dilute Aqueous Dispersions of Surfactant and Fatty Alcohol
Felix Grewe, Jochen Ortmeyer, Roxana Haase and Claudia Schmidt
© Springer International Publishing Switzerland 2015 M. Kind et al. (eds.), Colloid Process Engineering, DOI 10.1007/978-3-319-15129-8_2
Abstract Mixtures of surfactants, fatty alcohol as cosurfactant, and water often form gels, even at high dilution. We have investigated highly dilute samples of the system sodium dodecyl sulfate/cetyl alcohol/water (SDS/CA/D2O) at vary-ing SDS/CA ratio. Gel-like samples are obtained only at low SDS/CA ratios. The phase structure and the dynamics of the molecules have been determined by a com-bination of proton and carbon-13 NMR spectroscopy, cryo-transmission electron microscopy, very-small-angle neutron and x-ray scattering, differential scanning calorimetry, rheology, and pulsed gradient spin echo NMR diffusometry. The gel-like character is found to be caused by jammed uni- and multilamellar vesicles.
Keywords Surfactant fatty alcohol water mixture · Vesicle · Lamellar phase · Gel · NMR · Pulsed field-gradient diffusometry · Transmission electron microscopy
1 Introduction
Surfactants show a rich phase behavior in aqueous solutions [10, 27, 41]. There are isotropic micellar solutions, which may contain micelles of different shapes, as well as several types of liquid crystalline phases, for example, cubic, hexagonal, and lamellar ones. In particular, hexagonal and cubic phases of the bicontinuous type have a gel-like character, whereas micellar solutions and also lamellar phases tend to be fluid. In some cases even highly dilute aqueous solutions or dispersions that contain only a few percent of organic components have gel-like properties. This is the case for worm-like micellar solutions, which occur when micelles show a one-dimensional growth leading to very long thread-like aggregates that form an entangled network [6, 11]. But also a two-dimensional growth of micelles to extended lamellar sheets or,
F. Grewe · J. Ortmeyer · R. Haase · C. Schmidt (*) Department Chemie, Universität Paderborn, Warburger Straße 100, 33098 Paderborn, Germanye-mail: [email protected]

22 F. Grewe et al.
more commonly, to closed aggregates called vesicles may cause gel-like rheological properties [17]. The rheology of vesicles and disks and its relationship to the micro-structure of the phases has been reviewed recently by Gradzielski [18].
The shape of surfactant aggregates depends on the spontaneous curvature of the amphiphilic layer which is controlled by the surfactant packing parameter [23]
which characterizes the shape of a surfactant. A denotes the effective cross-sec-tional area of the hydrophilic headgroup, and V and l are the volume and length of the hydrophobic tail, respectively. Thus by choosing both the types and amounts of surfactants and cosurfactants in a formulation the phase structure and hence the rheological properties, which play an important role in processing and application of surfactant systems, can be tuned.
In the formulation of pharmaceutical and cosmetic lotions and creams mix-tures of surfactants and fatty alcohols are often employed. Due to the large pack-ing parameter of the long-chain alcohol molecules bilayer structures are formed in these systems, for which stable gels may be found even at high dilution. According to the gel-network model by Eccleston [12] lamellar structures, in which layers of water alternate with bilayers of the amphiphiles, are an essential component. The lamellar structures may coexist with crystalline phases and bulk water. A compari-son of the lamellar spacings with the rheological properties indicates that thicker interlamellar water layers lead to higher viscosities since the volume ratio of the lamellar phase to the continuous aqueous phase increases with the entrapment of water between the bilayers, resulting in higher viscosities [12].
In this chapter the structure of a dilute gel-forming ternary model system con-sisting of surfactant, fatty alcohol, and water, which has been investigated by com-plementary experimental methods, is presented. The combination of rheology, differential scanning calorimetry (DSC), nuclear magnetic resonance (NMR), scatter-ing experiments, and electron microscopy yields a fairly complete structural model and the identification of the essential features that are responsible for the gel char-acter. A particularly versatile technique for the investigation of colloidal surfactant systems is NMR, by which different aspects including chemical composition, phase behavior, molecular dynamics, and diffusion can be studied. Another example for the application of NMR in colloid science is the investigation of the organic layers on colloidal particles, cf. the chapter by Zellmer and Garnweitner on “Small-molecule Stabilization Mechanisms of Metal Oxide Nanoparticles” in this volume or Ref. [24].
2 The Model System SDS/CA/Water
The ternary system consisting of the anionic surfactant sodium dodecyl sulfate (SDS), 1-hexadecanol (cetyl alcohol, CA), and D2O was used as an example for structural investigations with different methods [16, 19]. The corresponding system
(1)P =V
Al,
23Colloidal Gels Formed by Dilute Aqueous Dispersions …
with H2O as solvent is known to forms gels at high dilution and its phase behavior has been studied before [14, 15]. The SDS/CA/water system was chosen to keep the model as simple as possible although it is well known that mixtures of fatty alcohols, for example, of CA and stearyl alcohol (SA), yield more stable gels [1].
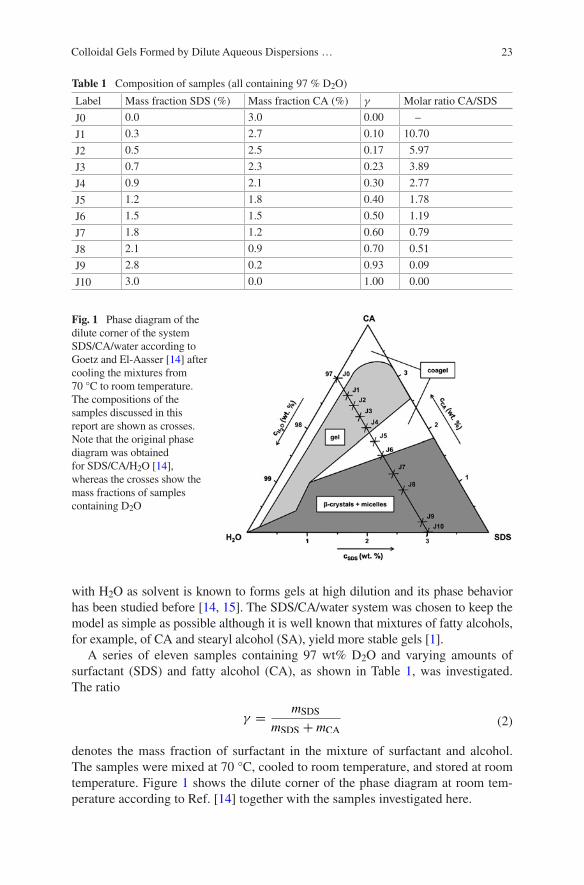
A series of eleven samples containing 97 wt% D2O and varying amounts of surfactant (SDS) and fatty alcohol (CA), as shown in Table 1, was investigated. The ratio
denotes the mass fraction of surfactant in the mixture of surfactant and alcohol. The samples were mixed at 70 °C, cooled to room temperature, and stored at room temperature. Figure 1 shows the dilute corner of the phase diagram at room tem-perature according to Ref. [14] together with the samples investigated here.
(2)γ =mSDS
mSDS + mCA
Table 1 Composition of samples (all containing 97 % D2O)
Label Mass fraction SDS (%) Mass fraction CA (%) γ Molar ratio CA/SDS
J0 0.0 3.0 0.00 –
J1 0.3 2.7 0.10 10.70
J2 0.5 2.5 0.17 5.97
J3 0.7 2.3 0.23 3.89
J4 0.9 2.1 0.30 2.77
J5 1.2 1.8 0.40 1.78
J6 1.5 1.5 0.50 1.19
J7 1.8 1.2 0.60 0.79
J8 2.1 0.9 0.70 0.51
J9 2.8 0.2 0.93 0.09
J10 3.0 0.0 1.00 0.00
Fig. 1 Phase diagram of the dilute corner of the system SDS/CA/water according to Goetz and El-Aasser [14] after cooling the mixtures from 70 °C to room temperature. The compositions of the samples discussed in this report are shown as crosses. Note that the original phase diagram was obtained for SDS/CA/H2O [14], whereas the crosses show the mass fractions of samples containing D2O
24 F. Grewe et al.
Of the innumerable surfactant/alcohol/water systems studied in the past, mainly two others will be drawn on for comparison. The first one is the sys-tem SDS/CA-SA/water studied by Awad and coworkers [1] at a water concen-tration of 89 wt%. These authors used a fatty alcohol mixture with a mass ratio CA:SA = 1:1.18. The second system, investigated by Schipunov [38], contains a varying ratio of the surfactant N-(2-hydroxyethyl)dodecane amide (CMEA) and the fatty alcohol CA, about 90 wt% water, and 1 wt% of the additional surfactant sodium-2-[2-dodecoxyethoxy]-ethyl-sulfate (SLES). We will refer to this system as the CMEA/CA/water system.
3 Phase Behavior
Based on the phase diagram reported by Goetz and El-Aasser for the system SDS/CA/H2O [14], shown in Fig. 1, samples J1–J4 are expected to be gels, samples J5 and J6 to form a coagel (mixture of gel and alcohol crystals), and samples J7–J9 to contain both micelles and crystals. J10 is a micellar solution of SDS. This will be investigated in the following by different methods. It must be pointed out that the samples may be out of equilibrium. The phases and their structures can be metasta-ble. They may exist for very long times but ageing phenomena may occur as well.
3.1 Macroscopic Appearance
Fatty alcohols are almost insoluble in water. Thus, sample J0 is an unstable disper-sion, which separates into an almost neat water phase and white solid alcohol crys-tals floating on the surface. Samples J1–J8 are white and completely opaque. The ones with higher SDS content (J7 and J8) separate within one week into a clear solution at the bottom and a white phase on top. Sample J9 is almost clear and shows birefringence on shaking, whereas J10 is a clear solution of SDS micelles.
3.2 Rheological Properties
The viscosity of the samples decreases with increasing surfactant (SDS) mass fraction γ in the SDS/CA mixture. At a shear rate of 1 s−1 the samples with the highest CA con-tent (J1–J3 of the gel region) have a steady-state viscosity of about 10 Pa s; the value for sample J4 is already about 50 % lower and the viscosity decreases further with increasing γ. For samples J1–J6 the steady-state viscosity was measured as a function of shear rate in the range of 1–10 s−1 and the samples were found to be shear-thinning.
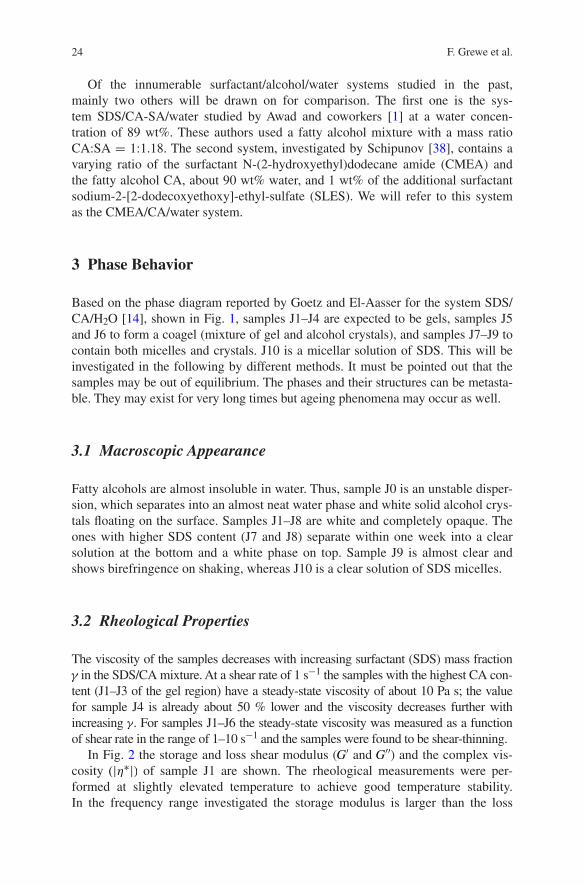
In Fig. 2 the storage and loss shear modulus (G′ and G′′) and the complex vis-cosity (|η∗|) of sample J1 are shown. The rheological measurements were per-formed at slightly elevated temperature to achieve good temperature stability. In the frequency range investigated the storage modulus is larger than the loss
25Colloidal Gels Formed by Dilute Aqueous Dispersions …
modulus and both moduli show only a weak frequency dependence. This behav-ior is characteristic of a gel. Samples J1–J5 show a similar behavior. Thus, rheo-logically all these samples are gels. Samples J1 and J2 have the highest storage modulus of all samples (2000 Pa s at a frequency of 1 Hz). Amplitude sweep experiments, in which the complex modulus is measured as a function of deforma-tion, show that both the extent of the linear viscoelastic regime and the cross-over point of G′ and G′′ decrease with increasing SDS content. In other words, the gels with a higher CA/SDS ratio are stronger.
3.3 Thermal Phase Transitions
Since samples were prepared by cooling from 70 °C some of them, in particular the gel-like ones, are in a quenched non-equilibrium state. For the formation and for the long-term stability of these quenched structures the dynamic state of the molecules is important. The alkyl chains of the fatty alcohol and of the surfactant can be in a frozen or in a mobile state. Transitions between phases differing in alkyl chain dynamics can be revealed by DSC measurements. Before presenting the thermal transitions of the SDS/CA/water samples the phase behavior of fatty alcohols, the major component of the gel-like samples, will be reviewed briefly.
The polymorphism of fatty alcohols has been known for a long time. Three phases have been reported [2, 9, 26, 34, 35]. At high temperatures a hexagonal or rotator phase may exist, which is ususally denoted by α but also by R′
II [33] because of its similarity to the RII phase of n-alkanes. At lower temperatures an orthorhombic phase (β or β1) or a monoclinic phase (γ or β2) is found for alco-hols with odd or even number of carbon atoms, respectively. The transition tem-peratures depend on the purity of the samples; hydration, in particular, causes a stabilization of the α phase by shifting the melting temperature upwards and at the same time lowering the transition temperature to the low-temperature phase [14, 26]. For cetyl alcohol of high purity only a single peak is seen in calorimet-ric measurements upon heating; the transition at 322.2 K may be close to a triple
Fig. 2 Storage modulus, loss modulus, and complex viscosity of sample J1 at 30 °C
26 F. Grewe et al.
point of the melt and the two crystalline phases β and α [34]. On cooling, however, at first the transparent crystals of the α phase separate from the melt before the opaque crystals of the β phase appear at lower temperature [26]. Thus two peaks can be seen by differential scanning calorimetry (DSC) upon cooling.
The crystalline phases consist of stacked bilayers of alcohol molecules, which are either in a tilted (γ ) or perpendicular orientation (α and β) with respect to the plane of the bilayers. A similar stacking of bilayers is found in lamellar liquid crystals but in this case the structure is swollen in a one-dimensional fashion by water and/or oil. Depending on whether the surfactant and cosurfactant chains are in a conformationally disordered molten or an extended rigid state, the lyotropic liquid crystalline phase is called Lα or Lβ phase, respectively. The Lβ phase is also known as gel phase. This nomenclature is also used for lipids. Concerning the sur-factant/fatty alcohol/water systems considered here, it must be pointed out that the swelling of α crystals with water results in an Lβ phase.
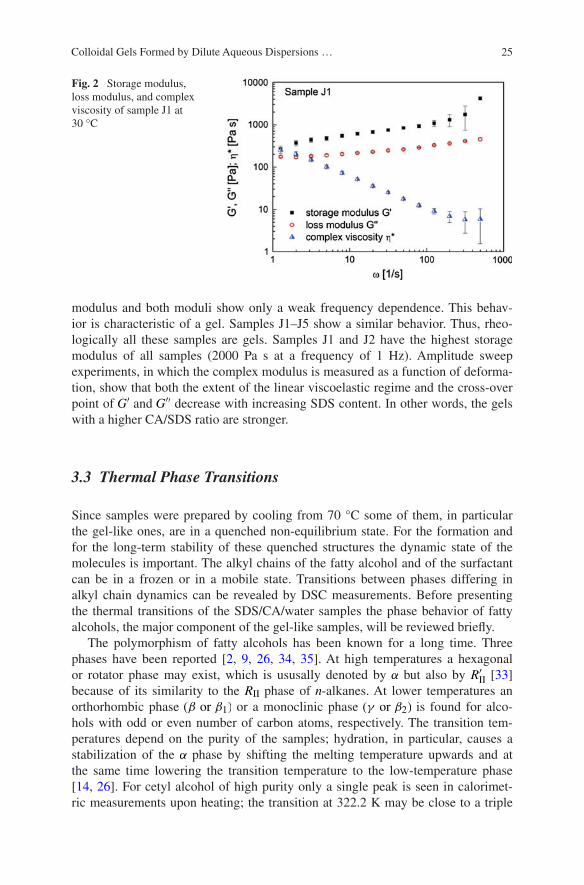
Using DSC, one or two transitions are found for the dilute aqueous dispersions of fatty alcohol/surfactant mixtures, depending on the mass fraction of the sur-factant γ. This is shown in Fig. 3 for the system SDS/CA/D2O (97 wt% D2O). The transition temperatures depicted in Fig. 3 correspond to the peak tempera-tures of the second heating run after a previous heating and cooling cycle. It must be emphasized that the dispersions are not in thermodynamic equilibrium and plots as the one in Fig. 3 do not represent a phase diagram. Qualitatively the same behavior, namely, two transitions at low surfactant content which merge into only one transition at higher surfactant content, is found when CA is replaced by the shorter myristyl alcohol (n-tetradecanol) [19] and also in the system CMEA/CA/water [38].
The transitions of neat CA (measured upon cooling where the α modification is formed) are shown as dotted lines in Fig. 3. The two transitions observed for the dispersion with γ = 0 (SDS-free) correspond to those of hydrated CA and are assigned to the β-to-α transition and to the melting point of the α phase. When
Fig. 3 Transition temperatures obtained by DSC for the samples of Table 1. The dotted lines represent the transition temperature (41.5 °C) and the melting point (48.7 °C) of neat CA

27Colloidal Gels Formed by Dilute Aqueous Dispersions …
SDS is added the β-to-α transition is no longer seen, probably because it is shifted to even lower temperatures. The main effects of replacing more and more CA by SDS are (i) a decreasing temperature of the melting transition of CA α crystals due to the incorporation of some SDS molecules, and (ii) an additional phase transi-tion at higher temperatures, which is assigned to the melting of a water- swollen phase of bilayers consisting of CA and SDS. Due to the immobility of the chains (cf. Sect. 4) this new phase is a gel phase, Lβ. Its melting point decreases with increasing SDS mass fraction. The decrease of both transition temperatures upon addition of SDS can be explained by the higher mobility of the shorter SDS chains. Based on the low transition enthalpy of the transition at lower temperature, which was not observed at all for some samples of the system containing myristyl alcohol, we may conclude that only a small amount of the alcohol-rich phase with the low melting point is present. Whether or not this crystalline phase is present may depend on the conditions of sample preparation.
Although the transition temperatures of the CMEA/CA/water system [38] exhibit a striking similarity there is also one difference in comparison to SDS/CA/water. By polarizing microscopy and Raman microscopy the low-temperature transition of CMEA/CA/water could be assigned to the melting of needle-shaped CMEA-rich crystals. In other words, the surfactant, not the alcohol is the main component of the crystals with the low melting temperature. The high content of CMEA in these crystals is probably due to the poor solubility of this surfactant in water, in contrast to SDS. For CMEA/CA/water the transition at higher tem-perature coincides with the disappearance of vesicle-like structures, which show Maltese crosses in polarizing microscopy with crossed polarizers and are rich in CA according to Raman microscopy. The small amount of SLES present in the CMEA/CA/water system may control the phase behavior to a large extent by play-ing a role similar to SDS. The influence of SLES is also evident from the presence of the high temperature transition of the CMEA/CA/water system in the absence of CMEA. In SDS/CA/water (cf. Fig. 3) this transition is absent at γ = 0 since no surfactant is present.
Based on the properties described so far, samples J1–J3 can be clearly consid-ered as gels, samples J4–J6 are less well defined and samples J7–J8 macroscopi-cally separate into two phases consisting of micelles and crystals. Sample J9 may contain very few dispersed crystals, while J10 is a one-phase micellar solution.
4 NMR
NMR spectroscopy on 1H, 2H, and 13C nuclei offers many possibilities to study gel-like systems. Both high-resolution and solid-state NMR can be used to obtain complementary information. In addition, diffusion measurements by pulsed field gradient NMR can be employed to study structural aspects.
28 F. Grewe et al.
4.1 1H NMR Spectroscopy
High-resolution proton NMR spectroscopy can be used to obtain an overview on the phase behavior. The linewidth and the presence or absence of peaks provides information on the dynamic state of the chain molecules. As an example, the pro-ton spectra of the different samples of SDS/CA/D2O obtained at 30 and 70 °C, which are shown in Fig. 4, are discussed [19]. The signal of D2O, which has a temperature dependent resonance frequency, was used as lock signal and chemical shift reference. Therefore the other signals have temperature-dependent chemical shifts. The signal intensities of all spectra are scaled to obtain equal heights of the large CH2 peaks, which occur at about 1.3 and 1.7 ppm in the spectra at 30 and 70 °C, respectively.
The top rows in each set show the spectra of an aqueous solution containing 3 wt% SDS (sample J10 with γ = 1), which is well above the critical micelle con-centration of 0.2 wt% [5]. Most of the methylene groups have similar chemical shifts and contribute to one single unresolved peak but the signals of the methyl group and the α- and β-methylene groups are well resolved J multipletts. The high resolution proves that the aggregates are small and have short correlation times of rotation.
A comparable resolution is found for both SDS and CA signals when only a small fraction of SDS is replaced by CA (sample J9 at 30 °C as well as samples J9 and J8 at 70 °C). These are the transparent samples. Since pure CA is insol-uble in water, yielding no signal for sample J0 (spectrum not shown), the pres-ence of highly resolved CA signals in samples J9 and J8 makes evident that CA is incorporated into the SDS micelles, which are small and rotating quickly. As the fraction of CA is increased the signals broaden at first, indicating a growth of the aggregates, which leads to a loss of their rotational freedom (J8–J6 at 30 °C). The growth of the aggregates is due to a change in curvature resulting from the increase of the average surfactant packing parameter P [23] as more and more of the anionic surfactant SDS, which has a large effective head group, is replaced by CA, which has a very small headgroup.
As γ is further decreased the signals disappear almost completely (J4–J1 at 30 °C) due to chain freezing. The poor signal-to-noise ratio observed for the sam-ples in the gel regime shows that only a very small fraction of the chains is not frozen. Furthermore, the shape of the CH2 peak of samples J8–J3 indicates the presence of several phases in which the components have slightly different chemi-cal shifts. This proves the multi-phase structure also of mixtures which do not show a macroscopic phase separation.
The comparison of the spectra at 30 and 70 °C shows that samples with high γ show almost no temperature dependence, whereas a large increase in the signal intensity is found at higher temperature for the samples with higher CA content (low γ), indicating that most alkyl chains have melted. The melting sets in at 55 °C at the lower phase transition observed by DSC, but only for a small fraction of the chains. Most chains begin to melt at the upper transition. However, even at 70 °C

29Colloidal Gels Formed by Dilute Aqueous Dispersions …
not all of the theoretical signal intensity is found either due to incomplete melt-ing or macroscopic phase separation which leads to accumulation of some com-ponents outside of the active volume of the NMR coil. For the CMEA/CA/water
Fig. 4 1H NMR spectra at 30 (top) and 70 °C (bottom). Within each series of spectra the mass fraction of SDS (γ as given in Table 1) decreases from top to bottom

30 F. Grewe et al.
system at γ = 0.4 it was also found that very little signal can be detected at the lower phase transition and most of the proton signals appear only above the upper phase transition temperature [38].
4.2 13C Spectroscopy
Proton NMR is a tool that is easy to use for the investigation of mobile compo-nents and the detection of chain melting but its use for a more detailed investi-gation of the rigid fraction is limited to a line width or second moment analysis in order to compare completely immobilized chains from rotating ones in rotator phases [4]. Complementary information on the solid fraction can be obtained by high resolution solid-state NMR which is routinely available for 13C, using magic angle spinning (MAS), cross polarization (CP), and dipolar decoupling of protons [37, 39]. The large chemical shift range of 13C yields well resolved spectra with signals from the different components. Hence, the presence or absence of compo-nents in solids and solid-like phases can be determined. Moreover, the signals of all-trans chains and disordered chains, which are separated by about 2–3 ppm due to the γ-gauche effect can be distinguished [22].
Both for the SDS/CA/water and the CMEA/CA/water systems, the all-trans signal disappears above the upper phase transition temperature. The signal of disordered chains is usually of lower intensity since cross-polarization, which requires a dipolar coupling between 1H and 13C nuclei, is less efficient for mobile chains. Cross-polarization breaks down completely for liquid-like chains with isotropic mobility since the dipolar coupling is averaged to zero. Highly mobile chains can be observed better by using direct carbon excitation instead of cross-polarization.
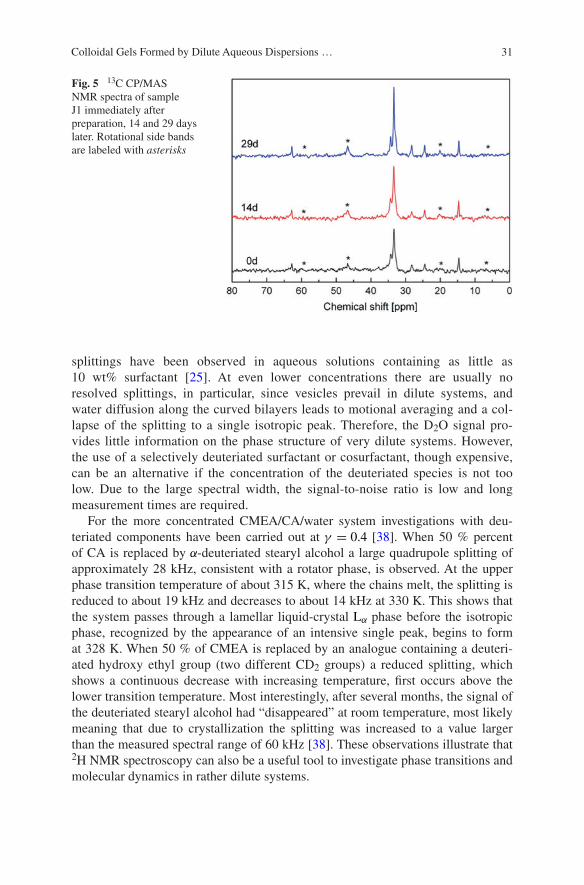
13C NMR spectroscopy can also be used to investigate the long-term stability of gels. Since the gels are often metastable, a common ripening or ageing effect is the formation of crystals. As an example, in Fig. 5 13C CP/MAS NMR spectra of sample J1 of the SDS/CA/water system immediately after preparation as well as 14 and 29 days later are shown. The increase of the cross-polarized signal result-ing from rigid chains is clearly recognized.
4.3 2H NMR Spectroscopy
2H NMR spectroscopy using D2O as a probe is widely used to study the phase behavior of more concentrated surfactant systems [7, 41] but provides less information for very dilute systems, in which the residual quadrupole coupling resulting from the anisotropic motion of water molecules next to the bilayers is smaller than the line width. In favorable cases, when the domains of a lamel-lar phase are large and free of defects which lead to curved bilayers, quadrupole
31Colloidal Gels Formed by Dilute Aqueous Dispersions …
splittings have been observed in aqueous solutions containing as little as 10 wt% surfactant [25]. At even lower concentrations there are usually no resolved splittings, in particular, since vesicles prevail in dilute systems, and water diffusion along the curved bilayers leads to motional averaging and a col-lapse of the splitting to a single isotropic peak. Therefore, the D2O signal pro-vides little information on the phase structure of very dilute systems. However, the use of a selectively deuteriated surfactant or cosurfactant, though expensive, can be an alternative if the concentration of the deuteriated species is not too low. Due to the large spectral width, the signal-to-noise ratio is low and long measurement times are required.
For the more concentrated CMEA/CA/water system investigations with deu-teriated components have been carried out at γ = 0.4 [38]. When 50 % percent of CA is replaced by α-deuteriated stearyl alcohol a large quadrupole splitting of approximately 28 kHz, consistent with a rotator phase, is observed. At the upper phase transition temperature of about 315 K, where the chains melt, the splitting is reduced to about 19 kHz and decreases to about 14 kHz at 330 K. This shows that the system passes through a lamellar liquid-crystal Lα phase before the isotropic phase, recognized by the appearance of an intensive single peak, begins to form at 328 K. When 50 % of CMEA is replaced by an analogue containing a deuteri-ated hydroxy ethyl group (two different CD2 groups) a reduced splitting, which shows a continuous decrease with increasing temperature, first occurs above the lower transition temperature. Most interestingly, after several months, the signal of the deuteriated stearyl alcohol had “disappeared” at room temperature, most likely meaning that due to crystallization the splitting was increased to a value larger than the measured spectral range of 60 kHz [38]. These observations illustrate that 2H NMR spectroscopy can also be a useful tool to investigate phase transitions and molecular dynamics in rather dilute systems.
Fig. 5 13C CP/MAS NMR spectra of sample J1 immediately after preparation, 14 and 29 days later. Rotational side bands are labeled with asterisks
32 F. Grewe et al.
4.4 Rheo-NMR Spectroscopy
In the dilute region of bilayer-forming systems vesicles are very common, in par-ticular when shear is applied during mixing. Vesicles also exist in the SDS/CA/water system, cf. Sect. 6. In more concentrated systems containing 35–60 wt% surfactant 2H NMR spectroscopy under shear, so-called rheo-NMR [8, 20], has been used to detect vesicles and their formation or destruction in situ [29, 30, 36]. At high water content, as mentioned before, there is neither a resolved splitting (for layered structures) nor a noticeable line-broadening (in the case of vesicles) and 2H rheo-NMR spectroscopy using D2O as probe molecule fails. Using deuteri-ated surfactant is no alternative in this case since the expected signal-to-noise ratio is very low and diffusion of the deuteriated species is too slow for vesicle forma-tion to have a significant effect on the spectral lineshape as the motional regime of τc ≈ 1/∆v (where τc denotes the correlation time of reorientations due to diffusion and ∆v is the quadrupole splitting) is not reached.
On the other hand, 1H NMR was found to be very sensitive to the structures in the dilute SDS/CA/water system and should provide information on the effect of shear in such dilute gel-forming systems. In particular, it should be possible to fol-low the processes of chain melting and freezing, which depend on the composition of the phases present and therefore on the mixing protocol. As a first step towards such investigations a prototype 1H rheo-probe was built as part of this project [19].
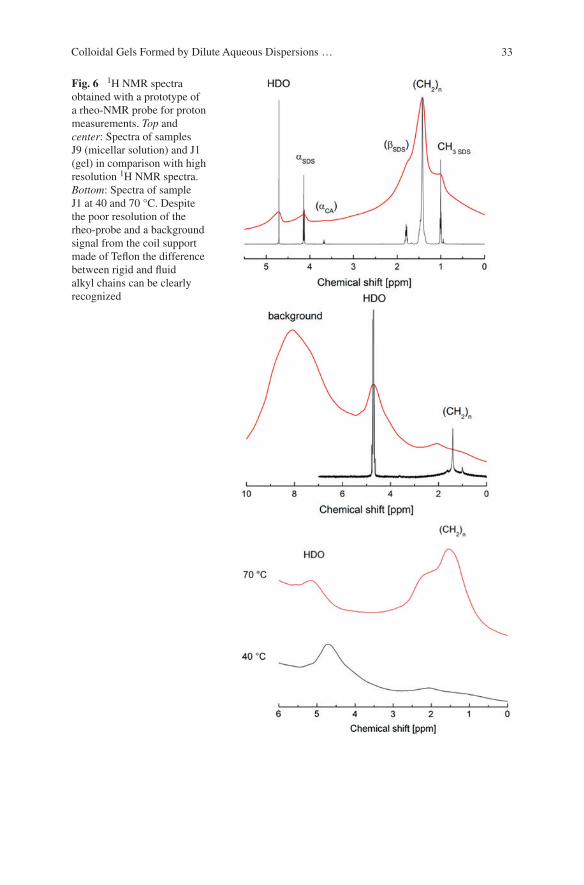
In Fig. 6 some spectra obtained with the 1H rheo-probe are shown [19]. In the top and center the spectra of samples J9 (micellar solution) and J1 (gel) in com-parison with the high-resolution spectra illustrate the limited resolution of the solid-state spectrometer used. Nevertheless, the liquid and gel samples can be dis-tinguished. Due to the low signal-to-noise ratio of the alkyl chain signal of the gel sample the peak resulting from residual protons in water and a background signal from the Teflon coil support appear enlarged. Nevertheless, as shown at the bottom of Fig. 6, the chain melting in the gel sample can be clearly detected with the rheo-probe. The very first experiments under shear have not yet shown a change of the NMR spectrum and further investigations at variable temperatures and composi-tions should be performed.
4.5 NMR Diffusometry
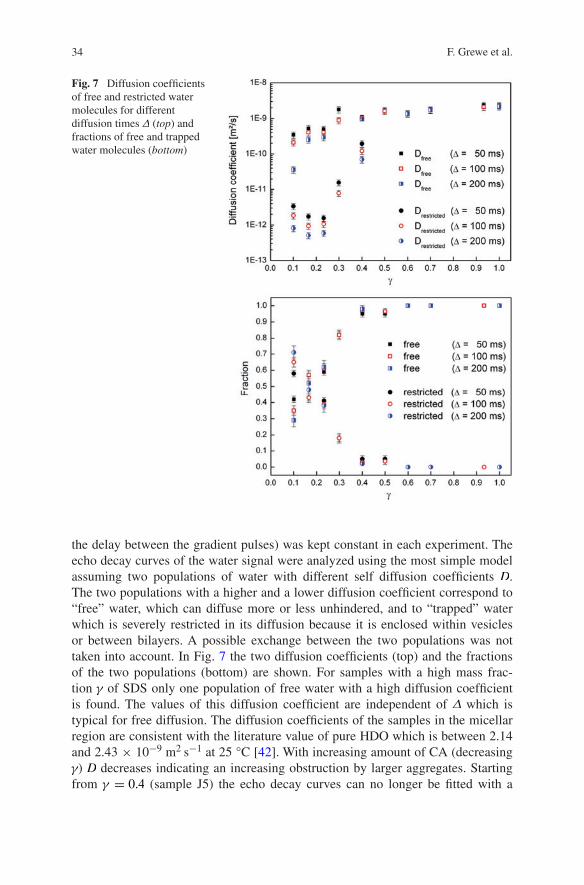
Pulsed field gradient NMR is an established tool for the investigation of self-diffu-sion, which is very sensitive to the structure of surfactant systems [3, 13, 31, 40]. As an example results obtained for the system SDS/CA/water are shown in Fig. 7. Previous investigations of this system by NMR diffusometry gave similar results [15]. The data presented in Fig. 7 were obtained from echo decay curves measured using the pulsed gradient spin echo technique [40] with trapezoidal magnetic field gradients of varying amplitude at 30 °C. The diffusion time ∆ (more precisely,
33Colloidal Gels Formed by Dilute Aqueous Dispersions …
Fig. 6 1H NMR spectra obtained with a prototype of a rheo-NMR probe for proton measurements. Top and center: Spectra of samples J9 (micellar solution) and J1 (gel) in comparison with high resolution 1H NMR spectra. Bottom: Spectra of sample J1 at 40 and 70 °C. Despite the poor resolution of the rheo-probe and a background signal from the coil support made of Teflon the difference between rigid and fluid alkyl chains can be clearly recognized
34 F. Grewe et al.
the delay between the gradient pulses) was kept constant in each experiment. The echo decay curves of the water signal were analyzed using the most simple model assuming two populations of water with different self diffusion coefficients D. The two populations with a higher and a lower diffusion coefficient correspond to “free” water, which can diffuse more or less unhindered, and to “trapped” water which is severely restricted in its diffusion because it is enclosed within vesicles or between bilayers. A possible exchange between the two populations was not taken into account. In Fig. 7 the two diffusion coefficients (top) and the fractions of the two populations (bottom) are shown. For samples with a high mass frac-tion γ of SDS only one population of free water with a high diffusion coefficient is found. The values of this diffusion coefficient are independent of ∆ which is typical for free diffusion. The diffusion coefficients of the samples in the micellar region are consistent with the literature value of pure HDO which is between 2.14 and 2.43 × 10⁻⁹ m2 s−1 at 25 °C [42]. With increasing amount of CA (decreasing γ) D decreases indicating an increasing obstruction by larger aggregates. Starting from γ = 0.4 (sample J5) the echo decay curves can no longer be fitted with a
Fig. 7 Diffusion coefficients of free and restricted water molecules for different diffusion times ∆ (top) and fractions of free and trapped water molecules (bottom)
35Colloidal Gels Formed by Dilute Aqueous Dispersions …
single diffusion coefficient and the apparent diffusion coefficients decrease with increasing diffusion time ∆, indicating restricted diffusion. In the gel regime, as γ gets smaller, diffusion gets slower and the fraction of slowly diffusing water mol-ecules (cf. bottom of Fig. 7) increases to more than 50 %.
5 Scattering Methods
Small angle X-ray and neutron scattering techniques also yield structural informa-tion. Small angle X-ray scattering (SAXS) can be used to obtain information on the period of layer stacking. The structures of crystals can be investigated with wide-angle X-ray diffraction. Small angle neutron scattering (SANS) can provide information on aggregate shapes.
5.1 SAXS
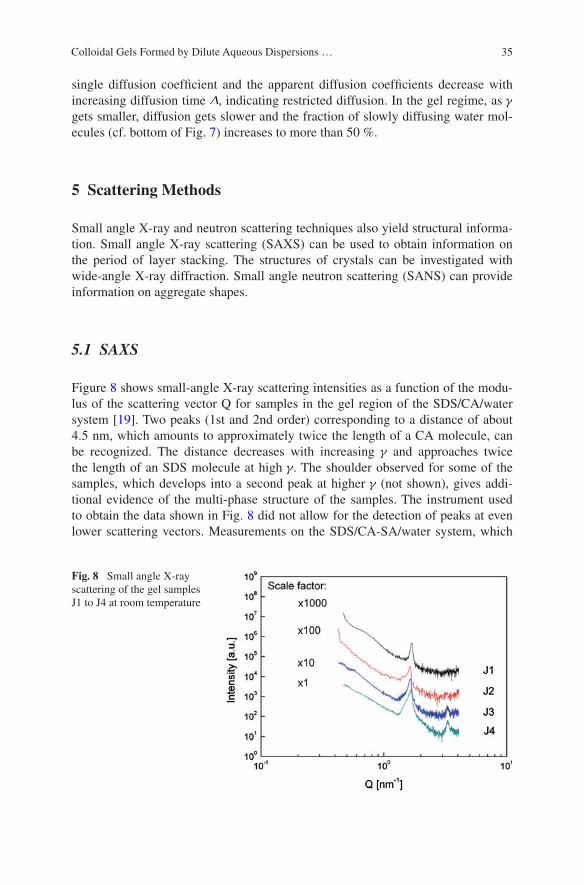
Figure 8 shows small-angle X-ray scattering intensities as a function of the modu-lus of the scattering vector Q for samples in the gel region of the SDS/CA/water system [19]. Two peaks (1st and 2nd order) corresponding to a distance of about 4.5 nm, which amounts to approximately twice the length of a CA molecule, can be recognized. The distance decreases with increasing γ and approaches twice the length of an SDS molecule at high γ. The shoulder observed for some of the samples, which develops into a second peak at higher γ (not shown), gives addi-tional evidence of the multi-phase structure of the samples. The instrument used to obtain the data shown in Fig. 8 did not allow for the detection of peaks at even lower scattering vectors. Measurements on the SDS/CA-SA/water system, which
Fig. 8 Small angle X-ray scattering of the gel samples J1 to J4 at room temperature
36 F. Grewe et al.
was investigated at a higher concentration (89 wt% water) have shown sev-eral orders of peaks at lower Q values corresponding to a lamellar order with a period of 26 nm [1]. The broad peaks which can be recognized in Fig. 8 below Q = 1 nm−1 and the increased intensities at the beginning of some curves may cor-respond to higher orders of lamellar correlation peaks.
5.2 Neutron Scattering
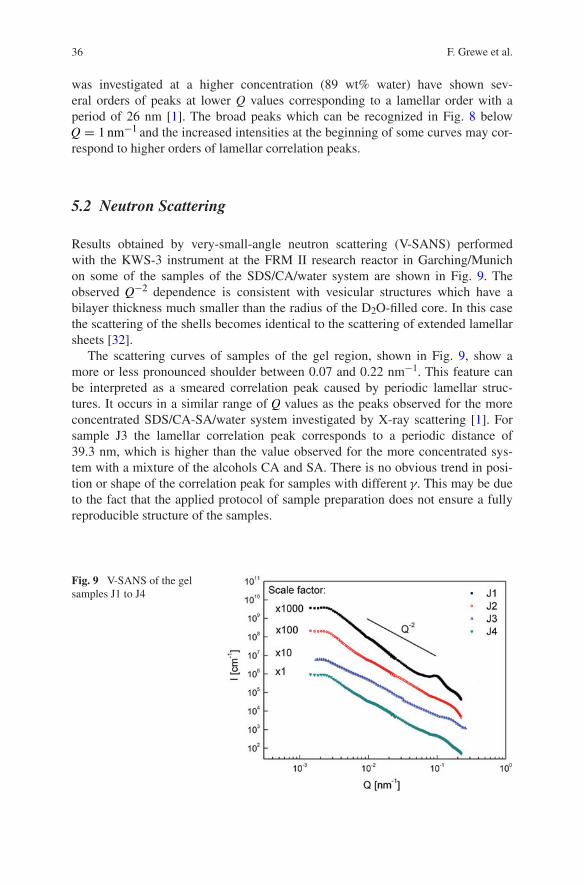
Results obtained by very-small-angle neutron scattering (V-SANS) performed with the KWS-3 instrument at the FRM II research reactor in Garching/Munich on some of the samples of the SDS/CA/water system are shown in Fig. 9. The observed Q−2 dependence is consistent with vesicular structures which have a bilayer thickness much smaller than the radius of the D2O-filled core. In this case the scattering of the shells becomes identical to the scattering of extended lamellar sheets [32].
The scattering curves of samples of the gel region, shown in Fig. 9, show a more or less pronounced shoulder between 0.07 and 0.22 nm−1. This feature can be interpreted as a smeared correlation peak caused by periodic lamellar struc-tures. It occurs in a similar range of Q values as the peaks observed for the more concentrated SDS/CA-SA/water system investigated by X-ray scattering [1]. For sample J3 the lamellar correlation peak corresponds to a periodic distance of 39.3 nm, which is higher than the value observed for the more concentrated sys-tem with a mixture of the alcohols CA and SA. There is no obvious trend in posi-tion or shape of the correlation peak for samples with different γ. This may be due to the fact that the applied protocol of sample preparation does not ensure a fully reproducible structure of the samples.
Fig. 9 V-SANS of the gel samples J1 to J4

37Colloidal Gels Formed by Dilute Aqueous Dispersions …
In addition to the lamellar correlation peak, a very weak shoulder can be seen between 0.9 × 10⁻² and 2.5 × 10⁻² m−1 in Fig. 9. This Q range corresponds to distances between 0.25 and 0.67 μm, which matches the most frequent vesicle diameters.
6 Transmission Electron Microscopy (TEM)
Sample images obtained by microscopic techniques provide the most direct infor-mation on sample structures. However, care must be taken not to interpret arti-facts resulting from sample preparation. Specimens for cryo-TEM must be very thin and vesicular structures with diameters larger than about 1 μm will collapse. Blotting leads to a change of concentration which may result in a change of aggre-gate structures.
In Fig. 10, cryo-TEM images of two samples of the SDS/CA/water system are shown. Because of the poor contrast, image tracing was used to visualize the most prominent features, which were statistically analyzed. Both samples, J3 of the gel region and J6 of the multiphase region, show vesicular structures. While those of
Fig. 10 Cryo-TEM images of sample J3 (gel) and J6 (multi-phase region) (top) and contours of the aggregates obtained by image tracing (bottom)
38 F. Grewe et al.
sample J3 appear only slightly darker than their surroundings and multiple layers can be recognized, the ones of sample J6 have much darker cores and usually only a single layer at the perimeter can be recognized.
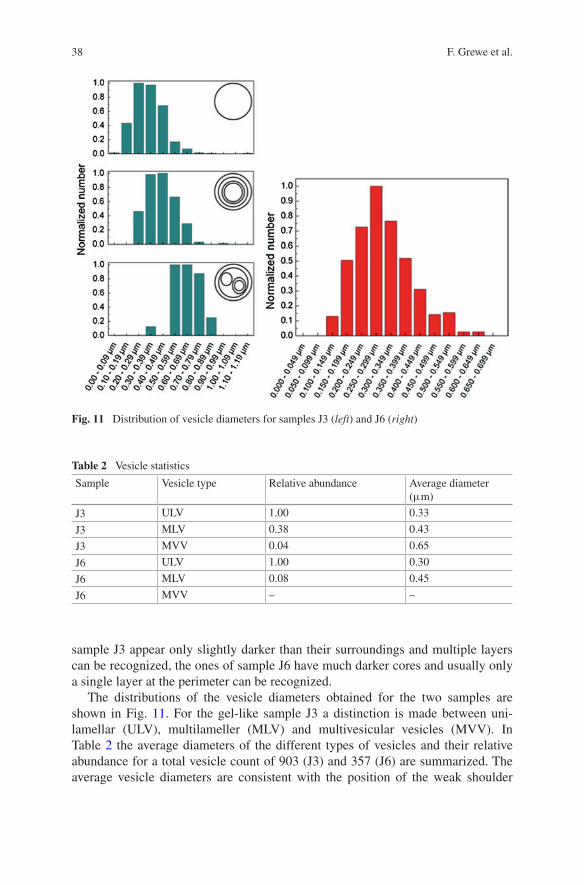
The distributions of the vesicle diameters obtained for the two samples are shown in Fig. 11. For the gel-like sample J3 a distinction is made between uni-lamellar (ULV), multilameller (MLV) and multivesicular vesicles (MVV). In Table 2 the average diameters of the different types of vesicles and their relative abundance for a total vesicle count of 903 (J3) and 357 (J6) are summarized. The average vesicle diameters are consistent with the position of the weak shoulder
Fig. 11 Distribution of vesicle diameters for samples J3 (left) and J6 (right)
Table 2 Vesicle statistics
Sample Vesicle type Relative abundance Average diameter (μm)
J3 ULV 1.00 0.33
J3 MLV 0.38 0.43
J3 MVV 0.04 0.65
J6 ULV 1.00 0.30
J6 MLV 0.08 0.45
J6 MVV – –

39Colloidal Gels Formed by Dilute Aqueous Dispersions …
observed at intermediate Q values by SANS. Figure 12 shows the distribution of the distance between bilayers in multilamellar vesicles. The lamellar distances determined by the analysis of the cryo-TEM images of sample J3 are in good agreement with the lamellar correlation peak observed by SANS corresponding to a periodic distance of 39.3 nm.
7 Discussion
The results found by different experimental methods for the SDS/CA/water sys-tem presented here and for similar systems provide evidence that the gel phases contain a large volume fraction of vesicles, which can be of the multilamellar type. The amphiphilic molecules which form the bilayers have frozen alkyl chains mak-ing the vesicles fairly rigid. The gel character does not result from a connected network as in the case of, for example, entangled worm-like micelles but from the jamming of the vesicles due to their large volume fraction. The gelling phenom-enon of vesicles is similar to the glass transition of colloidal dispersions which occurs at a volume fraction of about 58 % for hard spheres [21]. The gels dis-cussed here may contain additional crystals or planar lamellar structures as well, but their influence on the rheological properties is probably small. Such a gel state of densely packed multilamellar vesicles has also been reported, for instance, for a cat-anionic fluoro/hydrocarbon surfactant system [28].
In the following, the volume fraction of vesicles in the SDS/CA/water sys-tem is estimated in order to verify the gel model of jammed vesicles. Sample J3 with γ = 0.23 (cf. Table 1), for which the required experimental data are avail-able, will be considered. The two water populations found in the gel regime have been assigned to water that is trapped inside of vesicles or between bilayers and to almost pure water. The volume fractions of these two water populations can be estimated from
(3)φ(sample)bilayer = f φ
(ves)bilayer + (1− f )φ
(aq)bilayer,
Fig. 12 Distribution of distances between neighbouring bilayers in sample J3
40 F. Grewe et al.
where f and 1− f are the volume fractions of the vesicle “phase” and the con-tinuous water “phase”, while φ(sample)
bilayer, φ(ves)
bilayer, and φ(aq)bilayer
denote the volume frac-tions of bilayers in the whole sample, in the vesicle phase, and in the water phase, respectively. The total volume fraction of bilayers in the sample can be replaced by the combined volume fractions of SDS and CA if the small amounts of SDS and CA in the aqueous continuum and in crystals are neglected. With the densi-ties ρD2O = 1.1 g cm−3, ρSDS = 1.0 g cm−3, and ρCA = 0.81 g cm−3, the mass fractions given in Table 1 can be converted to volume fractions. For sample J3 a combined volume fraction of SDS and CA of 3.9 % results, which is taken as the average volume fraction of bilayers in the whole sample, φ(sample)
bilayer. Taking the
lamellar period of the crystals obtained by X-ray scattering as an estimate of the bilayer thickness, dbilayer = 4.5 nm, and the average distance of bilayers deter-mined by TEM as an estimate of the lamellar period, d = 61.1 nm, the volume fraction of bilayers in the vesicles is approximately φbilayer = dbilayer/d = 7.4%. Since the volume fraction of bilayers in the aqueous continuum is zero Eq. 3 yields f = 53%. Taking into account that part of the volume in the vesicle phase is occupied by bilayers, the fraction of water in the vesicle phase amounts to 51 %. This value can be compared with the fraction of trapped water determined by the diffusion experiments, which is about 40 % for sample J3 (cf. Fig. 7). Given the simplicity of the models used in fitting the diffusion data and for the structure the agreement with the calculated value is very good. Furthermore, the volume frac-tion of 53 % for the vesicles is quite close to the volume fraction of 58 % at which the colloidal glass transition of hard spheres is found. These findings support the model of jammed vesicles.
The large volume fraction of vesicles required for a gel to form can be achieved at a low combined volume fraction of surfactant and cosurfactant only if the dis-tance between single bilayers in multilamellar vesicles is sufficiently large. Hence, if the swelling of lamellar aggregates is not sufficient the aggregates will be too compact and their volume fraction will not be large enough to cause jamming. The comparison of the TEM images of samples J3 and J6 depicted in Fig. 10 suggests indeed that the vesicles of sample J6, which is not in the gel regime, have much more compact cores than the vesicles of the gel sample J3. From the diffusion results, which yield a very small fraction of only about 5 % of trapped water in sample J6, one may conclude that the vesicle cores of this sample consist mainly of bilayers and very little water. This structural difference is in good agreement with the different rheological properties of these two samples.
Different experimental techniques, such as the DSC and NMR investigations presented above, have shown that the gels contain bilayers with frozen alkyl chains. Rigid molecules are not only important for the rigidity of the vesicle mem-branes but also for the long-term stability of the metastable gels. If the mobility of the molecules forming the bilayers gets too high diffusion of the molecules will lead to the formation of the thermodynamically stable crystalline phases. A chain length mismatch of the alcohol molecules as in the commonly used mixtures of cetyl and stearyl alcohol helps to prevent crystallization [1].
41Colloidal Gels Formed by Dilute Aqueous Dispersions …
The DSC investigation of the SDS/CA/water and similar systems suggests that a large difference between the melting point of stable hydrated crystals and the melting point of the (metastable) Lβ phase is required for gels to form. If the difference in melting points is too small the Lβ structure cannot be quenched to temperatures sufficiently far below its own melting point and thermodynami-cally stable crystals will form instead. The formation of the gel phase appears to be kinetically controlled. On the other hand, it has also been suggested that the presence of larger fractions of the ionic surfactant leads to a higher ionic strength of the aqueous solution between the bilayers and therefore to a screening of their electrostatic repulsion and thus to a collapse of the bilayers, which enables the for-mation of crystals and leads to phase separation [14].
8 Conclusion
In order to obtain stable gels from aqueous dispersions of bilayer-forming surfactant/cosurfactant mixtures the following aspects should be considered. The formulation should form an Lβ phase with a high melting temperature. This requires the presence of sufficiently long alkyl chains. The chain melting tem-perature can be most easily determined by DSC or NMR measurements. For the bilayers to form vesicles a certain amount of surfactant is required to introduce some defects and to tune the bilayer curvature. A high degree of swelling of the bilayers with water must be possible in order to obtain a high volume fraction of aggregates, in which most of the water is trapped. This can be verified by NMR diffusometry. The chain melting temperature and the volume fraction of trapped water appear to be the most important parameters that should be optimized.
Acknowledgments We thank Vitaliy Pipich, Martin Schneider and Günter Goerigk for help with the neutron scattering experiments performed with the JCNS (Jülich Centre of Neutron Science) instrument KWS-3 at the FRM II research reactor in Garching/Munich, Frank Polzer for the cryo-TEM experiments, Daniel Topgaard and Stefanie Eriksson for help with the pulsed field gradient diffusometry performed at Lund University, Hans Egold and Karin Stolte for the high resolution proton NMR measurements, and the students Johannes Brinkmann, Svenja Marl, Dagmar Moritz, Matthias Hoffmann, Malte-Ole Schneemann, Alexei Schwarz, Nikolai Sitte, Viktor Warkentin, Daniel Wiegmann, and Martin Wiesing for their support. This project was funded by Deutsche Forschungsgemeinschaft, priority program SPP 1273.
References
1. Awad TS, Johnson ES, Bureiko A, Olsson U (2011) Colloidal structure and physical proper-ties of gel networks containing anionic surfactant and fatty alcohol mixture. J Dispersion Sci Technol 32:807–815
2. Abrahamsson S, Larsson G, von Sydow E (1980) The crystal structure of the monoclinic form of n-hexadecanol. Acta Cryst 13:770–774
42 F. Grewe et al.
3. Åslund I, Medronho B, Topgaard D, Söderman O, Schmidt C (2011) Homogeneous length scale of shear-induced multilamellar vesicles studied by diffusion NMR. J Magn Reson 209:291–299
4. Andrew ER (1950) Moleculer motion in certain solid hydrocarbons. J Chem Phys 18:607–618
5. Berr SS (1987) Solvent isotope effects on alkyltrimethylammonium bromide micelles as a function of alkyl chain length. J Phys Chem 91:4760–4765
6. Berret J-F (2004) Rheology of wormlike micelles: equilibrium properties and shear-banding transitions. In: Weiss RG, Terech P (eds), Molecular gels. Materials with self-assembled fibrillar networks. pp. 667-720
7. Blackburn JC, Kilpatrick PK (1992) Using deuterium NMR lineshapes to analyze lyotropic liquid crystalline phase transitions. Langmuir 8:1679–1687
8. Callaghan PT (1999) Rheo-NMR: nuclear magnetic resonance and the rheology of complex fluids. Rep Prog Phys 62:599–670
9. Chapman D (1956) Infra-red spectroscopy applied to studies of polymorphism. Spectrochim Acta 11:609–617
10. Chevalier Y, Zemb T (1990) Structure of micelles and microemulsions. Rep Prog Phys 53:279–371
11. Dreiss CA (2007) Wormlike micelles: where do we stand? Recent developments, linear rhe-ology and scattering techniques. Soft Matter 3:956–970
12. Eccleston GM (1990) Multiple-phase oil-in-water emulsions. J Soc Cosmet Chem 41:1–22 13. Ferreira TM, Bernin D, Topgaard D (2013) NMR studies of nonionic surfactants. Annu Rep
NMR Spectrosc 79:73–127 14. Goetz RJ, El-Aasser MS (1990) Dilute phase behavior of cetyl alcohol, sodium lauryl sulfate,
and water. Langmuir 6:132–136 15. Goetz RJ, Khan A, El-Aasser MS (1990) FT PGSE NMR investigations of the supramolecu-
lar structure of a dilute gel phase. J Colloid Interface Sci 137:395–407 16. Grewe F, Polzer F, Goerigk G, Topgaard D, Schmidt C Structure of dilute aqueous surfactant/
cosurfactant emulsions (in preparation) 17. Gradzielski M (2003) Vesicles and vesicle gels—structure and dynamics of formation. J Phys
Condens Matter 15:R655–R697 18. Gradzielski M (2011) The rheology of vesicle and disk systems—relations between macro-
scopic behaviour and microstructure. Curr Opin Colloid Interface Sci 16:13–17 19. Grewe F (2013) Structures of aqueous surfactant systems: a study of binary micellar solu-
tions and ternary surfactant/fatty alcohol/water emulsions. Doctoral thesis, Universität Paderborn
20. Grabowski DA, Schmidt C (1994) Simultaneous measurement of shear viscosity and director orientation of a side-chain liquid-crystalline polymer by rheo-NMR. Macromolecules 27:2632
21. Hunter GL, Weeks ER (2012) The physics of the colloidal glass transition. Rep Prog Phys 75:066501
22. Ishikawa S, Ando I (1992) Structural studies of dimyristoylphosphatidylcholine and di-stearoylphosphatidylcholine in the crystalline and liquid-crystalline states by variable- temperature solid-state high-resolution 13C NMR spectroscopy. J Mol Struct 271:57–73
23. Israelachivili JN, Mitchell DJ, Ninham BW (1976) Theory of self-assembly of hydrocarbon amphiphiles into micelles and bilayers. J Chem Soc Faraday Trans II 72:1525–1568
24. Kube M, Erler J, Peuker U, Schmidt C Thermal decomposition of ricinolic-acid-stabilized zinc oxide nanoparticles studied by FTIR and NMR spectroscopy (in preparation)
25. Kratzat K, Schmidt C, Finkelmann H (1994) A doubly branched nonionic oligooxyethylene V-amphiphile: effect of molecular geometry on liquid-crystalline phase behavior, 3. J Colloid Interface Sci 163:190–198
26. Lawrence ASC, Al-Mamun MA, McDonald MP (1967) Investigation of lipid-water system. Part 2. Effect of water on the polymorphism of long chain alcohols and acids. J Chem Soc Faraday Trans I 63:2789–2795
27. Laughlin RG (1994) The aqueous phase behavior of surfactants. Academic Press, London
43Colloidal Gels Formed by Dilute Aqueous Dispersions …
28. Long P, Hao J (2010) A gel state from densely packed multilamellar vesicles in the crystalline state. Soft Matter 6:4350–4356
29. Lukaschek M, Müller S, Hasenhindl A, Grabowski DA, Schmidt C (1996) Lamellar lyomesophases under shear as studied by deuterium nuclear magnetic resonance. Colloid Polym Sci 274:1–7
30. Müller S, Börschig C, Gronski W, Schmidt C, Roux D (1999) Shear-induced states of orien-tation of the lamellar phase of C12E4/water. Langmuir 15:7558–7564
31. Medronho B, Brown J, Miguel MG, Schmidt C, Olsson U, Galvosas P (2011) Planar lamel-lae and onions: a spatially resolved rheo-NMR approach to the shear-induced structural transformations in a surfactant model system. Soft Matter 7:4938–4947
32. McKelvey CA, Kaler EW (2002) Characterization of nanostructured hollow polymer spheres with small-angle neutron scattering (SANS). J Colloid Interface Sci 245:68–74
33. Métivaud V, Lefèvre A, Ventolà L, Négrier P, Moreno E, Calvet T, Mondieig D, Cuevas-Diarte MA (2005) Hexadecane (C16H34) + 1-hexadecanol (C16H33OH) binary system: crys-tal structures of the components and experimental phase diagram. Application to thermal protection of liquids. Chem Mater 17:3302–3310
34. Mosselmann C, Mourik J, Dekker H (1974) Enthalpies of phase change and heat capacities of some long-chain alcohols. Adiabatic semi-microcalorimeter for studies of polymorphism. J Chem Thermodynamics 6:477–487
35. Meyer JD, Reid EE (1933) Isomorphism and alternation in the melting points of the nor-mal alcohols, acetates, bromides, acids and ethylesters from C10 to C19. J Am Chem Soc 55:1574–1584
36. Medronho B, Shafaei S, Szopko R, Miguel MG, Olsson U, Schmidt C (2008) Shear-induced transitions between a planar lamellar phase and multilamellar vesicles: continuous versus discontinuous transformation. Langmuir 24:6480–6486
37. Pines A, Gibby MG, Waugh JS (1973) Proton-enhanced NMR of dilute spins in solids. J Chem Phys 59:569–590
38. Schipunov E (2014) Untersuchung strukturierter Tensidsysteme. Doctoral thesis, Universität Paderborn, 2013 (Der Andere Verlag)
39. Schaefer J, Stejskal EO (1975) Carbon-13 nuclear magnetic resonance of polymers spinning at the magic angle. J Am Chem Soc 98:1031–1032
40. Söderman O, Stilbs P (1994) NMR studies of complex surfactant systems. Prog Nucl Magn Reson Spectr 26:445
41. Tiddy GJT (1980) Surfactant-water liquid crystal phases. Phys Rep 57:1–46 42. Weingärtner H (1982) Self diffusion in liquid water—a reassessment. Zeitschr Phys Chem
132:129–140
http://www.springer.com/978-3-319-15128-1