![College Station Independent School District - …web.csisd.org/school_board/agendas/2016-2017/... · supports [PBIS] (such ... Kickoff teachers, Staff Time ... Survey results (parents,](https://static.fdocuments.in/doc/165x107/5b1e26d57f8b9ae90b8b54f3/college-station-independent-school-district-webcsisdorgschoolboardagendas2016-2017.jpg)
College Station Independent School District Budget For...
32
College Station Independent School District Budget For The 2009-2010 Fiscal Year Considered by Board of School Trustees August 17, 2009
Transcript of College Station Independent School District Budget For...

College StationIndependent School District
Budget
For The
2009-2010
Fiscal Year
Considered by Board of School TrusteesAugust 17, 2009

COLLEGE STATION INDEPENDENT SCHOOL DISTRICT
BOARD OF SCHOOL TRUSTEES
Ms. Charlotte Slack, President Mr. Randall Pitcock, Vice President
Dr. Valerie Jochen, Secretary Ms. Carol Barrett, Trustee
Ms. Mary Broussard, Trustee Mr. Paul Dorsett, Trustee
Dr. Garland Watson, Trustee
SUPERINTENDENT
Dr. Eddie Coulson
DEPUTY SUPERINTENDENTS
Greg McIntyre, Curriculum & Instruction Dr. Clark Ealy, Administrative Services
CHIEF FINANCIAL OFFICER
Amanda Dotson, CPA
2

COLLEGE STATION INDEPENDENT SCHOOL DISTRICT BUDGET FOR FISCAL YEAR 2009-2010
TABLE OF CONTENTS Page No. OVERVIEW Budget Overview 5 OFFICIAL BUDGET
Combined Budget of Revenues and Appropriations 10
Official Budget 11 REVENUE
Sources of Revenue 23
Tax Rate Summary and History 24
Impact of Proposed Tax Levy on Average Residence 25
Comparison of Tax Levy on Various Home Values 26
Certified Tax Roll Comparison 27 APPROPRIATIONS
Appropriations by Object Category – General Fund 29
Appropriations by Functional Category – General Fund 30 DEBT REQUIREMENTS
Debt Service Requirements 32
3

OVERVIEW
4

2009-2010 BUDGET OVERVIEW
One of the by-products of the budgeting process is the opportunity for the District to communicate to the community, staff and students some of the District’s strengths and challenges in an environment that promotes trust.
The District continues to experience growth in student enrollment and average daily attendance (ADA.) The preliminary enrollment projections for the 2009-2010 school year continue to trend upward. ADA for the 2008-2009 school year increased over the 2007-2008 school year by 5.79 percent. The District experienced an average annual rate of growth in ADA for the five year period beginning with the 2004-2005 school year and ending with the 2008-2009 school year of 4.10 percent. The chart below provides a visual depiction of the District’s ADA statistics for the past ten years.
Growth
Average Daily Attendance
6,000
6,500
7,000
7,500
8,000
8,500
9,000
9,500
98-9
9
00-0
1
02-0
3
04-0
5
06-0
7
08-0
9
School Year
5

Increasing enrollment can be seen as a signal that the community is a vibrant place where families want to reside. It also is an indicator that the constituents of College Station ISD want their children to be a part of the District. Every effort is made by the District to provide a safe and healthy learning environment that encourages academic, social and emotional success for each student.
The total taxable value of all property within the boundaries of the District continues to increase. The 2009 certified tax roll indicates that the freeze adjusted taxable value of property within the District increased by 6.09 percent over the same category in 2008. The District has experienced an average rate of increase in freeze adjusted taxable value of 9.77 percent over the previous five years. This is a key factor for the District to continue its ability to generate revenues to fund its debt service.
Property Values
Freeze Adjusted Taxable Property Values
1,5002,0002,5003,0003,5004,0004,5005,0005,5006,000
1999
2000
2001
2002
2003
2004
2005
2006
2007
2008
2009
Mill
ions
Tax Year
The budget development process has included the impact of House Bill 1, 79th Texas Legislature, 3rd Called Session. A major provision of House Bill 1 is the imposition of Target Revenue amounts for public school districts in Texas. General Fund revenues from state aid and local tax revenues are capped at the Target Revenue amount per student in weighted average daily attendance (WADA.) General Fund revenues are limited to the product of the Target Revenue amount multiplied by the number of students in weighted average daily attendance. If local property taxes are below that amount, the state provides funding to make up the difference. If local property taxes exceed that amount, a district must pay the excess back through recapture payments.
Legislative Scenario
6

House Bill 3646, 81st Texas Legislature provides an adjustment to the equalized wealth level at which districts are required to send Maintenance and Operations tax revenues outside the district in the form of recapture payments. This change results in a significant decrease in the district’s recapture payments during the 2009-2010 budget year. The implementation of House Bill 1 has provided the Board of Trustees with limited discretion in establishing the tax rate. The proposed tax rate for Maintenance and Operations of $1.00005 does not include an additional levy of $0.04 available under the provisions of House Bill 1.
The vision for the current budget development process has been to provide adequate resources to support the success of current students while at the same time placing the District in a financial position so that future growth needs can be met to support the success of future students.
Future Vision from a Budget Perspective
The need for future construction of new campuses continues to be a focus of the District. The construction of the District’s seventh elementary school, Creek View Elementary School, was completed in the 2008-2009 school year, along with the rebuild of the District’s oldest campus, College Hills Elementary School. Design for the District’s 2nd comprehensive high school, an eighth elementary school, and a transportation facility has begun since the successful passage of a $144.2 million bond election in May 2009. Past planning efforts have enabled The District to be positioned financially to address the budget needs presented by enrollment growth. The District has engaged in a planning process lead by the Long Range Educational Planning Committee resulting in recommendations that will enable the District to meet future needs resultant from continued growth in student enrollment.
The proposed budget provides an average salary increase to teachers, librarians, nurses, counselors, and speech pathologists of approximately 3 percent plus an additional $1,000 based on the requirements of House Bill 3646, 81st Texas Legislature. The budget proposal provides an increase in compensation for other employees based on 3 percent of current salary.
Human Resources
Student enrollment growth has created the need to add positions throughout the District. The proposed 2009-2010 budget provides funding for the staffing plan to meet the class size requirements in the elementary grade levels, and to meet identified needs in special areas. The proposed District budget includes a monthly contribution of $325 per employee toward the cost of the District’s group health insurance plan made available through the Texas Teacher Retirement System. This monthly contribution is available to employees regularly scheduled to work 20 or more hours per week.
7

8

OFFICIAL BUDGET
9

Special Capital Internal Debt TotalsGeneral Revenue Projects Proprietary Service Service Memorandum
Fund Funds Fund Funds Funds Fund OnlyESTIMATED REVENUESLOCAL/INTERMEDIATE
Property Tax $57,937,234 $0 $0 $0 $0 $14,678,417 $72,615,651Interest Earned 1,500,000 0 130,000 0 0 80,000 1,710,000Child Nutrition 2,234,600 0 0 0 0 2,234,600Co-Curricular 150,000 0 0 0 0 0 150,000Other Revenues 619,000 507,474 0 1,481,925 412,389 0 3,020,788 TOTAL LOCAL/INTERMED. 60,206,234 2,742,074 130,000 1,481,925 412,389 14,758,417 79,731,039
STATE SOURCES 0Available School Fund 2,408,749 0 0 0 0 0 2,408,749Technology Allotment 280,026 0 0 0 0 280,026Foundation School Fund 7,665,940 7,665,940TRS On-Behalf 3,049,053 0 0 0 0 0 3,049,053Other State Revenues 733,450 0 0 0 0 733,450 TOTAL STATE 13,123,742 1,013,476 0 0 0 0 14,137,218
FEDERAL SOURCESNational School Lunch/Breakfast 1,669,000 0 0 0 0 1,669,000Other Federal 0 205,527 0 0 0 0 205,527 TOTAL FEDERAL 0 1,874,527 0 0 0 0 1,874,527
TOTAL ESTIMATED REVENUES 73,329,976 5,630,077 130,000 1,481,925 412,389 14,758,417 95,742,784
APPROPRIATIONSPayroll Costs 62,001,110 2,223,341 287,815 1,042,761 0 0 65,555,027Contracted Services 5,937,456 190,616 183,500 47,850 3,800 0 6,363,222 Chapter 41 Recapture Payment 183,036 0 0 0 0 0 183,036Materials and Supplies 4,229,164 2,821,429 75,500 118,075 0 0 7,244,168Other Operating Costs 2,354,294 257,841 3,000 273,239 408,589 0 3,296,963Debt Service 381,671 0 0 0 0 13,840,964 14,222,635Capital Outlay 921,887 263,146 48,412,058 0 0 0 49,597,091 TOTAL APPROPRIATIONS 76,008,618 5,756,373 48,961,873 1,481,925 412,389 13,840,964 146,462,142
OTHER SOURCES (USES) 0 0 37,500,000 0 0 0 37,500,000
EXCESS (DEFICIENCY) (2,678,642) (126,296) (11,331,873) 0 0 917,453 (13,219,358)
EST. FUND BALANCE 09/01/2009 32,000,000 1,887,943 13,350,000 335,000 0 2,900,000 50,472,943
EST. FUND BALANCE 08/31/2010 $29,321,358 $1,761,647 $2,018,127 $335,000 $0 $3,817,453 $37,253,585
COLLEGE STATION INDEPENDENT SCHOOL DISTRICTCOMBINED BUDGET OF REVENUES AND APPROPRIATIONS
ALL FUND TYPESFOR THE FISCAL YEAR ENDING AUGUST 31, 2010
10

Special DebtGeneral Revenue Service
Fund Funds Fund Total
ESTIMATED REVENUES: 5700 Local Ad Valorem Property Taxes $57,937,234 $14,678,417 $72,615,651 Interest Earnings 1,500,000 80,000 1,580,000 Gate Receipts 150,000 150,000 Tuition 195,000 195,000 Child Nutrition 2,234,600 2,234,600 Rental Fees 54,000 54,000 Fees 35,000 35,000 Campus Activities 0 Miscellaneous Local 335,000 507,474 842,474
5700 Total Local 60,206,234 2,742,074 14,758,417 77,706,725
5800 State Available School Fund Revenue 2,408,749 2,408,749 Additional State Aid for Tax Red. 7,665,940 7,665,940 High School Allotment 704,550 704,550 Technology Allotment 280,026 280,026 TRS On-Behalf 3,049,053 3,049,053 Child Nutrition 28,900 28,900
5800 Total State 13,123,742 1,013,476 0 14,137,218
5900 Federal National School Lunch/Breakfast 1,669,000 1,669,000 USDA Commodities 205,527 205,527 Vocational 0 Other Federal 0
0
5900 Total Federal 0 1,874,527 0 1,874,527
5000 Total Estimated Revenues $73,329,976 $5,630,077 $14,758,417 $93,718,470
COLLEGE STATION INDEPENDENT SCHOOL DISTRICTOFFICIAL BUDGET
FOR FISCAL YEAR 2009-2010
11

Special Debt TotalFunction Object General Revenue Service All
Code Code Fund Funds Fund FundsAPPROPRIATIONS:Instruction: 11 Payroll Costs 6100 $42,862,860 $612,363 $0 $43,475,223 Contracted Services 6200 656,834 2,700 0 659,534 Supplies and Materials 6300 1,403,618 495,542 0 1,899,160 Other Operating Costs 6400 172,753 28,085 0 200,838 Debt Service 6500 0 0 0 0 Capital Outlay 6600 22,925 0 0 22,925Total Instruction 45,118,990 1,138,690 0 46,257,680
Instructional Resources and Media Services: 12 Payroll Costs 6100 830,464 0 0 830,464 Contracted Services 6200 47,133 1,750 0 48,883 Supplies and Materials 6300 49,570 57,649 0 107,219 Other Operating Costs 6400 4,465 500 0 4,965 Debt Service 6500 0 0 0 0 Capital Outlay 6600 114,819 20,896 0 135,715Total Instructional Resources/Media Services 1,046,451 80,795 0 1,127,246
Curriculum/Staff Dev.: 13 Payroll Costs 6100 445,330 0 0 445,330 Contracted Services 6200 58,631 2,500 0 61,131 Supplies and Materials 6300 113,001 18,046 0 131,047 Other Operating Costs 6400 277,264 93,450 0 370,714 Debt Service 6500 0 0 0 0 Capital Outlay 6600 0 0 0 0Total Curriculum/Staff Development 894,226 113,996 0 1,008,222
Instructional Leadership: 21 Payroll Costs 6100 1,249,922 0 0 1,249,922 Contracted Services 6200 29,210 9,270 0 38,480 Supplies and Materials 6300 77,108 2,575 0 79,683 Other Operating Costs 6400 38,116 2,060 0 40,176 Debt Service 6500 0 0 0 0 Capital Outlay 6600 0 0 0 0Total Instructional Leadership 1,394,356 13,905 0 1,408,261
COLLEGE STATION INDEPENDENT SCHOOL DISTRICTOFFICIAL BUDGET
FOR FISCAL YEAR 2009-2010
12

Special Debt TotalFunction Object General Revenue Service All
Code Code Fund Funds Fund Funds
COLLEGE STATION INDEPENDENT SCHOOL DISTRICTOFFICIAL BUDGET
FOR FISCAL YEAR 2009-2010
School Leadership: 23 Payroll Costs 6100 $3,629,127 $0 0 $3,629,127 Contracted Services 6200 28,110 0 0 28,110 Supplies and Materials 6300 64,958 14,220 0 79,178 Other Operating Costs 6400 51,222 17,700 0 68,922 Debt Service 6500 0 0 0 0 Capital Outlay 6600 0 0 0 0Total School Leadership 3,773,417 31,920 0 3,805,337
Guidance and Counseling: 31 Payroll Costs 6100 2,138,033 0 0 2,138,033 Contracted Services 6200 49,493 0 0 49,493 Supplies and Materials 6300 125,130 150 0 125,280 Other Operating Costs 6400 31,240 100 0 31,340 Debt Service 6500 0 0 0 0 Capital Outlay 6600 0 0 0 0Total Guidance and Counseling 2,343,896 250 0 2,344,146
Social Work Services: 32 Payroll Costs 6100 0 0 0 0 Contracted Services 6200 0 0 0 0 Supplies and Materials 6300 0 0 0 0 Other Operating Costs 6400 0 0 0 0 Debt Service 6500 0 0 0 0 Capital Outlay 6600 0 0 0 0Total Social Work Services 0 0 0 0
Health Services: 33 Payroll Costs 6100 797,618 0 0 797,618 Contracted Services 6200 19,128 0 0 19,128 Supplies and Materials 6300 16,675 250 0 16,925 Other Operating Costs 6400 5,536 0 0 5,536 Debt Service 6500 0 0 0 0 Capital Outlay 6600 0 0 0 0Total Health Services 838,957 250 0 839,207
13

Special Debt TotalFunction Object General Revenue Service All
Code Code Fund Funds Fund Funds
COLLEGE STATION INDEPENDENT SCHOOL DISTRICTOFFICIAL BUDGET
FOR FISCAL YEAR 2009-2010
Student Transportation: 34 Payroll Costs 6100 $2,090,579 $0 $0 $2,090,579 Contracted Services 6200 111,100 0 0 111,100 Supplies and Materials 6300 579,126 0 0 579,126 Other Operating Costs 6400 (336,644) 0 0 (336,644) Debt Service 6500 0 0 0 0 Capital Outlay 6600 0 0 0 0Total Student Transportation 2,444,161 0 0 2,444,161
Food Services: 35 Payroll Costs 6100 0 1,590,852 0 1,590,852 Contracted Services 6200 0 106,800 0 106,800 Supplies and Materials 6300 0 2,065,527 0 2,065,527 Other Operating Costs 6400 0 36,750 0 36,750 Debt Service 6500 0 0 0 0 Capital Outlay 6600 0 242,250 0 242,250Total Food Services 0 4,042,179 0 4,042,179
Co. & Extracurricular Activities: 36 Payroll Costs 6100 912,103 0 0 912,103 Contracted Services 6200 138,751 0 0 138,751 Supplies and Materials 6300 463,256 163,350 0 626,606 Other Operating Costs 6400 892,639 56,366 0 949,005 Debt Service 6500 0 0 0 0 Capital Outlay 6600 220,000 0 0 220,000Total Co. & Extracurricular Activities 2,626,749 219,716 0 2,846,465
General Administration: 41 Payroll Costs 6100 1,511,767 0 0 1,511,767 Contracted Services 6200 302,374 0 0 302,374 Supplies and Materials 6300 155,786 0 0 155,786 Other Operating Costs 6400 222,941 0 0 222,941 Debt Service 6500 0 0 0 0 Capital Outlay 6600 25,000 0 0 25,000Total General Administration 2,217,868 0 0 2,217,868
14

Special Debt TotalFunction Object General Revenue Service All
Code Code Fund Funds Fund Funds
COLLEGE STATION INDEPENDENT SCHOOL DISTRICTOFFICIAL BUDGET
FOR FISCAL YEAR 2009-2010
Plant Maintenance: 51 Payroll Costs 6100 $4,353,506 $0 $0 $4,353,506 Contracted Services 6200 3,331,879 67,596 0 3,399,475 Supplies and Materials 6300 752,012 0 0 752,012 Other Operating Costs 6400 375,830 1,200 0 377,030 Debt Service 6500 0 0 0 0 Capital Outlay 6600 279,143 0 0 279,143Total Plant Maintenance 9,092,370 68,796 0 9,161,166
Security and Monitoring: 52 Payroll Costs 6100 24,319 20,126 0 44,445 Contracted Services 6200 79,673 0 0 79,673 Supplies and Materials 6300 55,850 0 0 55,850 Other Operating Costs 6400 0 0 0 0 Debt Service 6500 0 0 0 0 Capital Outlay 6600 0 0 0 0Total Security and Monitoring 159,842 20,126 0 179,968
Computer Services: 53 Payroll Costs 6100 990,883 0 0 990,883 Contracted Services 6200 370,042 0 0 370,042 Supplies and Materials 6300 368,007 0 0 368,007 Other Operating Costs 6400 29,052 0 0 29,052 Debt Service 6500 0 0 0 0 Capital Outlay 6600 185,000 0 0 185,000Total Computer Services 1,942,984 0 0 1,942,984
Community Services: 61 Payroll Costs 6100 164,599 0 0 164,599 Contracted Services 6200 0 0 0 0 Supplies and Materials 6300 5,067 4,120 0 9,187 Other Operating Costs 6400 16,168 21,630 0 37,798 Debt Service 6500 0 0 0 0 Capital Outlay 6600 0 0 0 0Total Community Services 185,834 25,750 0 211,584
15

Special Debt TotalFunction Object General Revenue Service All
Code Code Fund Funds Fund Funds
COLLEGE STATION INDEPENDENT SCHOOL DISTRICTOFFICIAL BUDGET
FOR FISCAL YEAR 2009-2010
Debt Service: 71 Payroll Costs 6100 $0 $0 $0 $0 Contracted Services 6200 0 0 0 0 Supplies and Materials 6300 0 0 0 0 Other Operating Costs 6400 0 0 0 0 Debt Service 6500 381,671 0 13,840,964 14,222,635 Capital Outlay 6600 0 0 0 0Total Debt Service 381,671 0 13,840,964 14,222,635
Facilities Acquisition and Construction: 81 Payroll Costs 6100 0 0 0 0 Contracted Services 6200 0 0 0 0 Supplies and Materials 6300 0 0 0 0 Other Operating Costs 6400 0 0 0 0 Debt Service 6500 0 0 0 0 Capital Outlay 6600 75,000 0 0 75,000Total Facilities Acq./Construction 75,000 0 0 75,000
Contracted Instructional Services: 91 Payroll Costs 6100 0 0 0 0 Contracted Services 6200 183,036 0 0 183,036 Supplies and Materials 6300 0 0 0 0 Other Operating Costs 6400 0 0 0 0 Debt Service 6500 0 0 0 0 Capital Outlay 6600 0 0 0 0Total Contracted Instructional Services 183,036 0 0 183,036
Incremental Costs Chapter 36: 92 Payroll Costs 6100 0 0 0 0 Contracted Services 6200 0 0 0 0 Supplies and Materials 6300 0 0 0 0 Other Operating Costs 6400 0 0 0 0 Debt Service 6500 0 0 0 0 Capital Outlay 6600 0 0 0 0Total Incremental Costs Chapter 36 0 0 0 0
16

Special Debt TotalFunction Object General Revenue Service All
Code Code Fund Funds Fund Funds
COLLEGE STATION INDEPENDENT SCHOOL DISTRICTOFFICIAL BUDGET
FOR FISCAL YEAR 2009-2010
Payments to Fiscal Agent: 93 Other Operating Costs 6400 $78,712 $0 $0 $78,712Total Payments to Fiscal Agent 78,712 0 0 78,712
Payments to Other School Districts: 94 Contracted Services 6200 0 0 0 0Total Payments to Other School Districts 0 0 0 0
Payments to Juvenile Justice Programs: 95 Contracted Services 6200 0 0 0 0Total Payments to Juvenile Justice Programs 0 0 0 0
Payments to Charter Schools: 96 Contracted Services 6200 0 0 0 0Payments to Charter Schools 0 0 0 0
Payments to Tax Increment Fund: 97 Other Operating Costs 6400 495,000 0 0 495,000Payments to Tax Increment Fund 495,000 0 0 495,000
Payments to Tax County Appraisal District: 99 Other Operating Costs 6400 715,098 0 0 715,098Payments to County Appraisal District 715,098 0 0 715,098
Transfers In 7915 0 0 0 0Transfers Out 8911 0 0 0 0
Summary: Payroll Costs 6100 $62,001,110 $2,223,341 $0 $64,224,451 Contracted Services 6200 6,120,492 190,616 0 5,596,010 Supplies and Materials 6300 4,229,164 2,821,429 0 7,050,593 Other Operating Costs 6400 2,354,294 257,841 0 2,612,135 Debt Service 6500 381,671 0 13,840,964 14,222,635 Capital Outlay 6600 921,887 263,146 0 1,185,033 Transfers In 7900 0 0 0 715,098 Transfers Out 8900 0 0 0 0Total Estimated Appropriations/Transfers $76,008,618 $5,756,373 $13,840,964 $95,605,955
17

240 411 428 461 TotalChild High School Campus Special
Nutrition Technology Allotment Activity RevenueESTIMATED REVENUESLOCAL/INTERMEDIATE
Property Tax $0Interest Earned 0Child Nutrition $2,234,600 2,234,600Co-Curricular 0Other Revenues $507,474 507,474 TOTAL LOCAL/INTERMED. 2,234,600 0 0 507,474 2,742,074
STATE SOURCES 0Available School Fund 0Technology Allotment ($27.42/ADA) $280,026 280,026TRS On-Behalf 0Other State Revenues 28,900 $704,550 733,450 TOTAL STATE 28,900 280,026 704,550 0 1,013,476
FEDERAL SOURCESNational School Lunch/Breakfast 1,669,000 1,669,000Other Federal 205,527 205,527 TOTAL FEDERAL 1,874,527 0 0 0 1,874,527
TOTAL ESTIMATED REVENUES 4,138,027 280,026 704,550 507,474 5,630,077
APPROPRIATIONSPayroll Costs 1,590,852 612,363 20,126 2,223,341Contracted Services 174,396 9,270 6,950 190,616 Chapter 41 Recapture Payment 0Materials and Supplies 2,065,527 370,000 34,126 351,776 2,821,429Other Operating Costs 37,950 77,195 142,696 257,841Debt Service 0Capital Outlay 242,250 20,896 263,146 TOTAL APPROPRIATIONS 4,110,975 370,000 732,954 542,444 5,756,373
OTHER SOURCES (USES) 0
EXCESS (DEFICIENCY) 27,052 (89,974) (28,404) (34,970) (126,296)
EST. FUND BALANCE 09/01/2009 850,000 122,943 400,000 515,000 1,887,943
EST. FUND BALANCE 08/31/2010 $877,052 $32,969 $371,596 $480,030 $1,761,647
Special Revenue Funds
COLLEGE STATION INDEPENDENT SCHOOL DISTRICTCOMBINING BUDGET OF REVENUES AND APPROPRIATIONS
SPECIAL REVENUE FUNDSFOR THE FISCAL YEAR ENDING AUGUST 31, 2010
18

Board 2007 2009 TotalDirected Bond Bond CapitalProjects Projects Projects Projects
ESTIMATED REVENUESLOCAL/INTERMEDIATE
Property Tax 0Interest Earned 0 30,000 100,000 130,000Child Nutrition 0Co-Curricular 0Other Revenues $0 TOTAL LOCAL/INTERMED. 0 30,000 100,000 130,000
STATE SOURCES 0Available School Fund 0Technology Allotment 0TRS On-Behalf 0Other State Revenues 0 TOTAL STATE 0 0 0 0
FEDERAL SOURCESNational School Lunch/Breakfast 0Other Federal 0 TOTAL FEDERAL 0 0 0 0
TOTAL ESTIMATED REVENUES 0 30,000 100,000 130,000
APPROPRIATIONSPayroll Costs 287,815 287,815Contracted Services 183,500 183,500 Chapter 41 Recapture Payment 0Materials and Supplies 65,000 10,500 75,500Other Operating Costs 3,000 3,000Debt Service 0Capital Outlay 275,000 12,816,500 35,320,558 48,412,058 TOTAL APPROPRIATIONS 340,000 13,000,000 35,621,873 48,961,873
OTHER SOURCES (USES) 37,500,000 37,500,000
EXCESS (DEFICIENCY) (340,000) (12,970,000) 1,978,127 (11,331,873)
EST. FUND BALANCE 09/01/2009 350,000 13,000,000 0 13,350,000
EST. FUND BALANCE 08/31/2010 $10,000 $30,000 $1,978,127 $2,018,127
COLLEGE STATION INDEPENDENT SCHOOL DISTRICTCOMBINING BUDGET OF REVENUES AND APPROPRIATIONS
CAPITAL PROJECTS FUNDSFOR THE FISCAL YEAR ENDING AUGUST 31, 2010
Capital Projects Funds
19

714 713 TotalKids Community ProprietaryKlub Ed Funds
ESTIMATED REVENUESLOCAL/INTERMEDIATE
Property Tax 0TIF Payment 0Child Nutrition 0Co-Curricular 0Other Revenues $1,060,465 $421,460 $1,481,925 TOTAL LOCAL/INTERMED. 1,060,465 421,460 1,481,925
STATE SOURCES 0Available School Fund 0Technology Allotment 0TRS On-Behalf 0Other State Revenues 0 TOTAL STATE 0 0 0
FEDERAL SOURCESNational School Lunch/Breakfast 0Other Federal 0 TOTAL FEDERAL 0 0 0
TOTAL ESTIMATED REVENUES 1,060,465 421,460 1,481,925
APPROPRIATIONSPayroll Costs 767,061 275,700 1,042,761Contracted Services 34,600 13,250 47,850 Chapter 41 Recapture Payment 0Materials and Supplies 84,925 33,150 118,075Other Operating Costs 173,879 99,360 273,239Debt Service 0Capital Outlay 0 0 TOTAL APPROPRIATIONS 1,060,465 421,460 1,481,925
OTHER SOURCES (USES) 0
EXCESS (DEFICIENCY) 0 0 0
EST. FUND BALANCE 09/01/2009 120,000 215,000 335,000
EST. FUND BALANCE 08/31/2010 $120,000 $215,000 $335,000
Proprietary Funds
COLLEGE STATION INDEPENDENT SCHOOL DISTRICTCOMBINING BUDGET OF REVENUES AND APPROPRIATIONS
PROPRIETARY FUNDSFOR THE FISCAL YEAR ENDING AUGUST 31, 2010
20
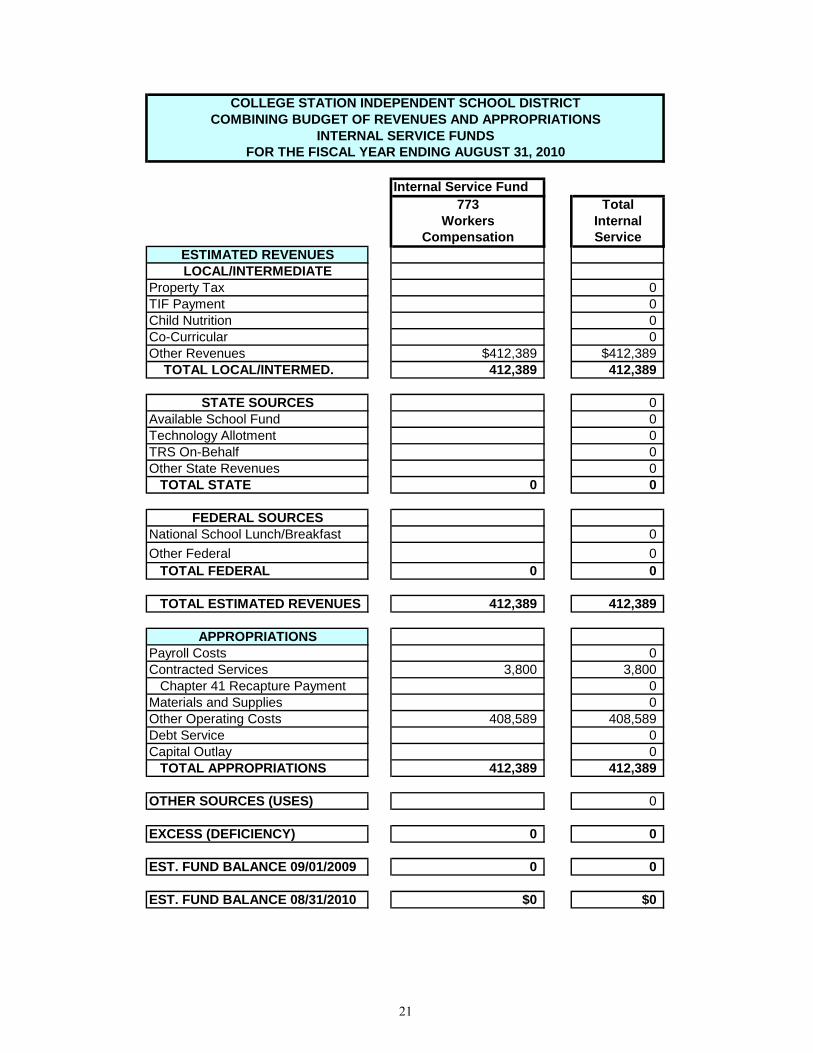
Internal Service Fund773 Total
Workers InternalCompensation Service
ESTIMATED REVENUESLOCAL/INTERMEDIATE
Property Tax 0TIF Payment 0Child Nutrition 0Co-Curricular 0Other Revenues $412,389 $412,389 TOTAL LOCAL/INTERMED. 412,389 412,389
STATE SOURCES 0Available School Fund 0Technology Allotment 0TRS On-Behalf 0Other State Revenues 0 TOTAL STATE 0 0
FEDERAL SOURCESNational School Lunch/Breakfast 0Other Federal 0 TOTAL FEDERAL 0 0
TOTAL ESTIMATED REVENUES 412,389 412,389
APPROPRIATIONSPayroll Costs 0Contracted Services 3,800 3,800 Chapter 41 Recapture Payment 0Materials and Supplies 0Other Operating Costs 408,589 408,589Debt Service 0Capital Outlay 0 TOTAL APPROPRIATIONS 412,389 412,389
OTHER SOURCES (USES) 0
EXCESS (DEFICIENCY) 0 0
EST. FUND BALANCE 09/01/2009 0 0
EST. FUND BALANCE 08/31/2010 $0 $0
COLLEGE STATION INDEPENDENT SCHOOL DISTRICTCOMBINING BUDGET OF REVENUES AND APPROPRIATIONS
INTERNAL SERVICE FUNDSFOR THE FISCAL YEAR ENDING AUGUST 31, 2010
21

REVENUE
22

Percentage Percentage2009-2010 of Total 2008-2009 of Total
Revenues Revenues
ESTIMATED REVENUES: 5700 Local Local Property Taxes $57,937,234 79.02% $54,543,110 71.18% Gate Receipts 150,000 0.20% 130,000 0.17% Tuition 195,000 0.27% 160,000 0.21% Other Local 1,924,000 2.62% 1,840,000 2.40%
Total Local Sources 60,206,234 82.11% 56,673,110 73.96%
5800 State Available School Fund 2,408,749 3.28% 2,242,240 2.93% Foundation School Fund 7,665,940 10.45% 15,101,553 19.71% TRS On Behalf 3,049,053 4.16% 2,601,543 3.40% Other State 0 0.00% 0 0.00%
Total State Sources 13,123,742 17.89% 19,945,336 26.04%
5900 Federal Other Federal 0 0.00% 0 0.00%
Total Federal Sources 0 0.00% 0 0.00%
Total Estimated Revenues $73,329,976 100.00% $76,618,446 100.00%
College Station Independent School DistrictSources of Revenue
General Fund
23
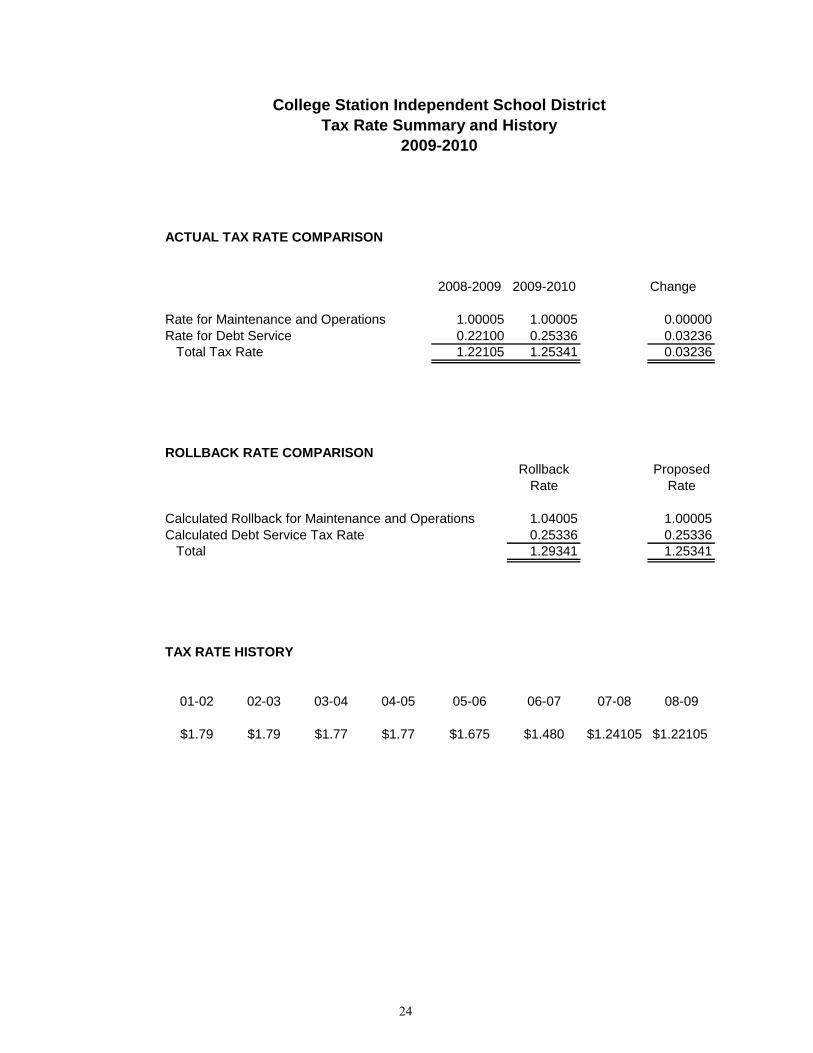
ACTUAL TAX RATE COMPARISON
2008-2009 2009-2010 Change
Rate for Maintenance and Operations 1.00005 1.00005 0.00000Rate for Debt Service 0.22100 0.25336 0.03236 Total Tax Rate 1.22105 1.25341 0.03236
ROLLBACK RATE COMPARISONRollback Proposed
Rate Rate
Calculated Rollback for Maintenance and Operations 1.04005 1.00005Calculated Debt Service Tax Rate 0.25336 0.25336 Total 1.29341 1.25341
TAX RATE HISTORY
01-02 02-03 03-04 04-05 05-06 06-07 07-08 08-09
$1.79 $1.79 $1.77 $1.77 $1.675 $1.480 $1.24105 $1.22105
College Station Independent School DistrictTax Rate Summary and History
2009-2010
24

Last Year This Year % Change
Average Market Value of Residences $203,284 $217,481 6.9838%
Average Taxable Value of Residences $186,988 $201,340 7.6754%
Last Year's Rate Versus Proposed Rate Per $100 Value $1.22105 $1.25341 2.6502%
Taxes Due on Average Residence $2,283.22 $2,523.62 10.5290%
Increase (Decrease) in Annual Taxes $240.40
Please note that all residence values did not change from the prior year, or change by the average above. The average home value is influenced by the revaluation of existing homes, and the value of new homes constructed during the year. The taxable value of an individual home can only be determined by reviewingyour appraisal notice or by contacting the Brazos County Appraisal District.
Under state law, the dollar amount of school taxes imposed on the residence homestead of a person 65years of age or older or of the surviving spouse of such a person, if the surviving spouse was 55 years ofage or older when the person died, may not be increased above the amount paid in the first year after theperson turned 65, regardless of changes in tax rate or taxable value.
College Station Independent School District
Impact of Proposed Tax LevyOn Average Residence
2009-2010
25

Appraised Value $50,000 $85,000 $100,000 $150,000 $200,000 $250,000
Homestead Exemption (15,000) (15,000) (15,000) (15,000) (15,000) (15,000)
Taxable Value 35,000 70,000 85,000 135,000 185,000 235,000
Tax Rate $1.22105 $1.22105 $1.22105 $1.22105 $1.22105 $1.22105
Tax Levy $427.37 $854.74 $1,037.89 $1,648.42 $2,258.94 $2,869.47
Appraised Value $53,492 $90,936 $106,984 $160,476 $213,968 $267,460
Homestead Exemption (15,000) (15,000) (15,000) (15,000) (15,000) (15,000)
Taxable Value 38,492 75,936 91,984 145,476 198,968 252,460
Proposed Tax Rate $1.25341 $1.25341 $1.25341 $1.25341 $1.25341 $1.25341 Proposed Tax Levy $482.46 $951.79 $1,152.94 $1,823.41 $2,493.88 $3,164.36
Tax Levy Change $55.09 $97.05 $115.05 $174.99 $234.94 $294.89Percentage Change 12.89% 11.35% 11.08% 10.62% 10.40% 10.28%
For homeowners over age 65, property taxes are frozen at the dollar amount they were in the year the homeowner first became eligible for the over age 65 exemption. In addition to the standard exemption noted above, over age 65 homeowners also receive an additional $5,000 local and $10,000 state over age 65 exemption. This means that unless new improvements are added to an over age 65 homestead, taxes will not increase due to revaluation or tax rate increases.
The average residence value in the District in 2009 was $217,481. Average home value in 2008 was $203,284. This represents an increase in the average value of 6.99 percent.
2008-2009 Values
2009-2010 Values
College Station Independent School DistrictComparison of Tax Levy
On Various Residence ValuesAt Average Increase In Home Value
(Where Taxpayer is Under 65 Years of Age)
26

CERTIFIED TAX ROLL COMPARISON 2009 VERSUS 2008
2009
MARKET FREEZE FREEZE ADJUSTED %
CATEGORY LAND IMPROVEMENTS OTHER VALUE EXEMPT VALUE TAXABLE VALUE CHANGE
HOMESITES $681,651,608 $2,779,793,742 $0 $3,461,445,350 ($216,883,671) ($422,234,112) $2,822,327,567 8.636%
NON-HOMESITES $920,666,075 $1,920,793,396 $0 $2,841,459,471 ($638,087,394) $2,203,372,077 4.034%
LAND - AGRICULTURAL $166,060,502 $0 $0 $166,060,502 ($163,809,827) $2,250,675 12.291%
LAND -TIMBER $0 $0 $0 $0 $0 $0 N/A
PERSONAL PROPERTY $0 $0 $469,503,339 $469,503,339 $0 $469,503,339 2.588%
MINERALS $0 $0 $16,841,032 $16,841,032 $0 $16,841,032 -24.557%
NET TAXABLE $1,768,378,185 $4,700,587,138 $486,344,371 $6,955,309,694 ($1,018,780,892) $5,936,528,802 6.553%
LESS: FREEZE TAXABLE ($422,234,112) ($422,234,112) 13.044%
FREEZE ADJUSTED TAXABLE $5,514,294,690 6.087%
2008
MARKET FREEZE FREEZE ADJUSTED
CATEGORY LAND IMPROVEMENTS OTHER VALUE EXEMPT VALUE TAXABLE VALUE
HOMESITES $602,214,620 $2,574,209,689 $0 $3,176,424,309 ($204,946,325) ($373,514,638) $2,597,963,346
NON-HOMESITES $827,446,278 $1,807,522,748 $0 $2,634,969,026 ($517,026,571) $2,117,942,455
LAND - AGRICULTURAL $149,220,300 $0 $0 $149,220,300 ($147,215,980) $2,004,320
LAND - TIMBER $0 $0 $0 $0 $0 $0
PERSONAL PROPERTY $0 $0 $457,659,499 $457,659,499 $0 $457,659,499
MINERALS $0 $0 $22,322,985 $22,322,985 $0 $22,322,985
NET TAXABLE $1,578,881,198 $4,381,732,437 $479,982,484 $6,440,596,119 ($869,188,876) $5,571,407,243
LESS: FREEZE TAXABLE ($373,514,638) ($373,514,638)
FREEZE ADJUSTED TAXABLE $5,197,892,605
CHANGE
CHANGE $189,496,987 $318,854,701 $6,361,887 $514,713,575 ($149,592,016) ($48,719,474) $316,402,085
PERCENT CHANGE 12.002% 7.277% 1.325% 7.992% 17.211% 13.044% 6.087%
Note: Freeze value is the value of homesteads frozen for over age 65 homeowners. Tax on these homes is frozen in the year the homeowner attains age 65.
27
APPROPRIATIONS
28

Object Object Total by % of Total by % ofCategory Number Category Approp. Category Approp.
Payroll Costs 6100 $62,001,110 81.58% $55,187,048 70.16% Contracted Services 6200 6,120,492 8.05% 14,696,829 18.69% Supplies and Materials 6300 4,229,164 5.56% 4,030,429 5.13% Other Operating Costs 6400 2,354,294 3.10% 2,591,311 3.30% Debt Service 6500 381,671 0.50% 603,740 0.77% Capital Outlay 6600 921,887 1.21% 1,532,697 1.95%Total Appropriations $76,008,618 100.00% $78,642,054 100.00%
2009-2010 2008-2009
College Station Independent School DistrictAppropriations by Object Category - General Fund
Budget Year 2009-2010
29

% %Function Total of Total of
Code Appropriation Approp. Appropriation Approp.
Instruction 11 45,118,990 59.37% 40,606,578 51.64%
Instructional Resources and Media Services 12 1,046,451 1.38% 1,032,268 1.31%
Curriculum and Staff Development 13 894,226 1.18% 800,229 1.02%
Instructional Leadership 21 1,394,356 1.83% 1,380,085 1.75%
School Leadership 23 3,773,417 4.96% 3,411,060 4.34%
Guidance and Counseling 31 2,343,896 3.08% 2,220,715 2.82%
Social Work Services 32 0 0.00% 0 0.00%
Health Services 33 838,957 1.10% 740,605 0.94%
Student Transportation 34 2,444,161 3.22% 2,344,040 2.98%
Co. & Extracurricular Activities 36 2,626,749 3.46% 2,301,475 2.93%
General Administration 41 2,217,868 2.92% 2,975,997 3.78%
Plant Maintenance 51 9,092,370 11.96% 8,483,430 10.79%
Security and Monitoring 52 159,842 0.21% 67,806 0.09%
Computer Services 53 1,942,984 2.56% 1,294,684 1.65%
Community Services 61 185,834 0.24% 213,684 0.27%
Debt Service 71 381,671 0.50% 603,740 0.77%
Facilities Acquisition and Construction 81 75,000 0.10% 576,360 0.73%
Contracted Instructional Services 91 183,036 0.24% 9,084,698 11.55%
Payments to Fiscal Agent 93 78,712 0.10% 26,600 0.03%
Payments to Tax Increment Fund 97 495,000 0.65% 478,000 0.61%
Payments to County Appraisal District 99 715,098 0.94% 0 0.00% Total Appropriations 76,008,618 100.00% 78,642,054 100.00%
COLLEGE STATION INDEPENDENT SCHOOL DISTRICTAppropriations by Functional Category - General Fund
For Fiscal Year 2009-2010
2009-2010 2008-2009
30

DEBT REQUIREMENTS
31

Fiscal Yr.Ending 8/31 Principal Interest Principal Interest Principal Interest Principal Interest Principal Interest Principal Interest Principal Interest Totals
2010 375,000 218,213 745,000 26,546 595,000 456,875 1,825,000 616,081 384,775 2,520,000 2,906,412 1,490,000 1,560,855 13,719,7572011 395,000 202,744 130,000 8,418 610,000 439,025 1,895,000 536,978 384,775 2,620,000 2,799,312 1,485,000 1,558,953 13,065,2052012 410,000 186,450 130,000 2,827 630,000 414,625 2,005,000 445,125 384,775 2,725,000 2,687,963 1,555,000 1,484,703 13,061,4682013 430,000 169,538 645,000 389,425 2,120,000 342,000 384,775 2,830,000 2,575,556 1,635,000 1,406,953 12,928,2472014 450,000 151,800 670,000 363,625 2,235,000 233,125 384,775 2,945,000 2,458,819 1,680,000 1,357,903 12,930,0472015 475,000 133,238 695,000 340,175 2,300,000 119,750 384,775 3,065,000 2,337,337 995,000 1,307,503 12,152,7782016 500,000 113,644 720,000 315,155 1,245,000 31,125 1,110,000 357,025 3,190,000 2,203,244 1,025,000 1,275,165 12,085,3582017 525,000 93,019 745,000 288,515 2,660,000 272,750 3,325,000 2,059,694 1,055,000 1,244,415 12,268,3932018 550,000 71,363 780,000 260,205 2,740,000 163,138 3,160,000 1,910,068 1,100,000 1,202,215 11,936,9892019 575,000 48,675 810,000 229,785 2,840,000 55,025 3,295,000 1,771,819 1,145,000 1,158,215 11,928,5192020 605,000 24,956 845,000 197,385 3,455,000 1,623,544 1,190,000 1,112,415 9,053,3002021 880,000 162,740 3,615,000 1,463,750 1,235,000 1,064,815 8,421,3052022 920,000 125,780 3,790,000 1,283,000 1,285,000 1,015,415 8,419,1952023 960,000 86,220 3,970,000 1,093,500 1,340,000 964,015 8,413,7352024 1,005,000 44,220 4,155,000 895,000 1,395,000 909,075 8,403,2952025 4,365,000 687,250 1,450,000 850,485 7,352,7352026 4,585,000 469,000 1,515,000 788,135 7,357,1352027 4,795,000 239,750 1,580,000 721,475 7,336,2252028 1,650,000 650,375 2,300,3752029 1,725,000 576,125 2,301,1252030 1,805,000 498,500 2,303,5002031 1,895,000 408,250 2,303,2502032 1,990,000 313,500 2,303,5002033 2,090,000 214,000 2,304,0002034 2,190,000 109,500 2,299,500
Totals 5,290,000$ 1,413,640$ 1,005,000$ 37,791$ 11,510,000$ 4,113,755$ 13,625,000$ 2,324,184$ 9,350,000$ 3,156,588$ 62,405,000$ 31,465,018$ 37,500,000$ 23,752,960$ 206,948,936$
Outstanding Principal 140,685,000$
Building Bonds Refunding BondsSeries 2007
Building BondsSeries 2006 Series 2009
Building BondsBuilding Bonds Refunding Bonds
(Sale and Pricing Date 8/17/09Delivery Date 09/15/09)
Series 2004Refunding Bonds
COLLEGE STATION INDEPENDENT SCHOOL DISTRICTDEBT SERVICE REQUIREMENTS
Series 1999 Series 2002
As of August 31, 2009
Series 2004
32