
MASTER THESIS · MASTER THESIS Dealing with Contested Heritage:

College of Management Engineering
Master of Science Thesis
Development of Technical Standards and Optimization of
Working Capital in FCA S.P.A.
Supervisor: Prof. Domenico Maisano
Co-Supervisor (FCA): Luigi Andrea Valla
Submitted by: Farhat Abbas
March 2019

2
Table of Contents
Table of Contents ............................................................................................................... 2
Acknowledgement .............................................................................................................. 5
Abstract ............................................................................................................................... 6
1 Introduction ................................................................................................................ 7
1.1 Problems specification ...................................................................................... 7
1.2 Outline ................................................................................................................ 8
1.3 Overview of Industry ........................................................................................ 8
1.3.1 Leading automobile manufacturers worldwide .............................................. 8
1.4 Overview of Company .................................................................................... 14
1.4.1 Company’s History ....................................................................................... 17
1.5 Overview of Department ................................................................................ 20
2 Theoretical Background .......................................................................................... 21
2.1 Working Capital Management ...................................................................... 21
2.1.1 Working Capital ............................................................................................ 22
2.1.2 Cash Conversion Cycle ................................................................................. 22
2.1.3 Inventory ....................................................................................................... 24
2.1.4 Supply-chain management ............................................................................ 24
2.1.5 Raw materials inventory ............................................................................... 25
2.1.6 Work in Progress Inventory .......................................................................... 25
2.2 Logistic and Supply chain .............................................................................. 26
2.2.1 Introduction to logistic .................................................................................. 26
2.2.2 Logistic Areas ............................................................................................... 27
2.2.3 Logistic flow ................................................................................................. 28
2.2.4 Materials Management and Classification .................................................... 28
2.2.5 Storage .......................................................................................................... 29
2.2.6 Stock and Stock Management ....................................................................... 30

3
2.2.7 Safety Stock .................................................................................................. 32
2.2.8 FCA Supply chain Structure ......................................................................... 36
2.3 Logistics and Inventory Management ........................................................... 37
2.3.1 Bill of Material (BOM) ................................................................................. 38
2.3.2 Bill of Manufacture ....................................................................................... 38
2.3.3 Physical Inventory System ............................................................................ 39
2.3.4 Inaccuracy in inventory Record (IRI) ........................................................... 39
2.3.5 Negative Stock Balance ................................................................................ 40
2.3.6 Causes of Inventory Inaccuracy .................................................................... 41
3 FIAT CHRYSLER AUTOMOBILES: A CASE STUDY ....................................... 45
3.1 Technical standards for manufacturing ....................................................... 45
3.1.1 Defining Technical Standard ........................................................................ 46
3.1.2 Calculation of Technical Standard ................................................................ 46
3.1.2.1 Warehouse Stock ................................................................................... 47 3.1.2.2 Work in progress and pending material ................................................. 50
3.1.3 Containers and standardization ..................................................................... 51
3.1.3.1 Material in transit ................................................................................... 53 3.1.3.2 Outsourced Work ................................................................................... 54
3.1.4 Safety stock ................................................................................................... 54
3.1.4.1 A (stock) ................................................................................................. 55 3.1.4.2 B (transit warehouses) ............................................................................ 57 3.1.4.3 C (stock of first delivery) ....................................................................... 57
3.1.5 Logics behind calculation of safety stock ..................................................... 57
3.1.6 Implementation of technical standard and its impact ................................... 58
3.1.6.1 Plants 1 ................................................................................................... 59 3.1.6.2 Plant 2 .................................................................................................... 59 3.1.6.3 Plant 3 .................................................................................................... 59
3.2 Analysis of Missing items ............................................................................... 60
3.2.1 Identified Root causes in FCA ...................................................................... 61
3.2.1.1 Missing transfer from warehouse to production line ............................. 61 3.2.1.1.1 RFID: Radio Frequency Identification .............................................. 62
3.2.1.2 A flawed inventory data gathering procedure ........................................ 64 3.2.1.3 Employees using a substitute ................................................................. 64 3.2.1.4 Experienced employees using matching parts from another order ........ 65
4
3.2.1.5 Ineffective bar-code scanning ................................................................ 66 3.2.1.6 Human Errors ......................................................................................... 67 3.2.1.7 Documents containing bar-codes put one inside another ...................... 67 3.2.1.8 Changes in the Composition of Groups and Failure to Update Records 67
3.2.2 Proposed solution to mitigate inventory inaccuracy ..................................... 68
3.2.2.1 Preparing the kits in Advance ................................................................ 68 3.2.2.2 Counting of material not used on return to warehouse .......................... 68 3.2.2.3 A regular Stock checks .......................................................................... 69 3.2.2.4 Increase the material buffer stock .......................................................... 70 3.2.2.5 Registration of Material ......................................................................... 70 3.2.2.6 Managing location of storage ................................................................. 71 3.2.2.7 Visibility and integration ....................................................................... 71
3.2.3 Theoretical techniques to Reduce waste and scrap ....................................... 72
3.2.3.1 World Class Manufacturing ................................................................... 72 3.2.3.2 World Class Manufacturing in FCA ...................................................... 74 3.2.3.3 World class manufacturing logistics and customer service pillar .......... 74 3.2.3.4 Kaizen .................................................................................................... 77
4 Conclusion ................................................................................................................ 79
5 Bibliography .................................................................. Error! Bookmark not defined.
5.1 Books and journals .............................................. Error! Bookmark not defined.
5.2 Articles from Web ........................................................................................... 85
5.3 Websites for Data Collection .......................................................................... 86

5
Acknowledgement
The opportunity I had with Fiat Chrysler Automobile was a great chance for professional
development and learning experience. Therefore, I consider myself as a very lucky individual as I
got an opportunity to be a part of it. I am also grateful for having a chance to meet so many
wonderful people and professionals who led me though this period.
Moreover, I am using this opportunity to express my deepest gratitude and special thanks
to the Andrea Valla Luigi who in spite of being extraordinarily busy with his duties, took time out
to hear, guide and keep me on the correct path and allowing me to carry out my thesis. I would
also like to thank my Prof. Domenico Maisano for trusting me and supervising me through all this.
I perceive this opportunity as a big milestone in my career development. I will strive to use
gained skills and knowledge in the best possible way, and I will continue to work on their
improvement, in order to reach my career goal.

6
Abstract
The purpose of this study is to identify and evaluate the main impacts of technical
standards, for the production and inventory management, has over the automotive industry and in
particular on logistics and working capital.
In order to address this problem, both documentary research and an analytical approach
was used, first goal was to understand the problem and then carry out an analysis but with some
limits and on some selected part. The literature research is addressed to understand the impacts of
work in progress (WIP) and safety stock on working capital of Production Company.
In the present manufacturing condition, distinctive parts, fabricated in-house and purchased
from supplier, are regularly assembles together into a completed product. Rivalry has made it
essential for organizations to convey a tweaked item on a guaranteed date. Be that as it may, when
stock items are absent at production time, lead times for items end up with uncertainty and this
makes it hard to satisfy a client request on due date. It is in this manner critical to investigate the
reasons for missing items at the production time so as to take care of such an issue.
For that reason, companies are developing specific standards to fulfil customer needs and
to work with no interference. These norms serve to recognize the required safety stock level for
production and to decrease the expense and time.
Besides, to decrease the working capital and increase the efficiency of production
company, it is imperative to break down the losses amid production. To comprehend this issue,
inventory management is vital and considered about the best tool. By taking a gander at the missing
item and their underlying causes, we can wipe out those issues and consequently increment the
productivity.

7
1 Introduction
The study is the result of a Joint Collaboration between Politecnico di Torino and Fiat
Chrysler Automobiles; the thesis was developed during a six months internship inside the
company.
This thesis is done during my final year of master’s in Engineering and Management in
Politecnico in Torino university.
The main aim of this study is to find different methods to increase the working capital of
FCA and how waste can be reduced in production process. Two main cases were studies for this
purpose. Development of technical standards to increase the efficiency of time and reduction of
cost for logistics processes, mainly focusing of safety stock and its optimization.
The second contention is about the issue of missing item at the time of production. Missing
components? How would they get missing? Do workers take them? Do they get absent because of
being severely damaged? Are the things missing from their store location? Do they go missing
because of awful material dealing? It is safe to say that they are absent because of the
IT/innovation? Would it be possible that they get missing by workers imprudence?
This thesis aimed at finding methods to increase the efficiency of inventory management
and minimize working capital. Even though working capital and logistic is a broad field with many
developed frameworks and theories, this study limits only towards negative work in progress and
standards for inventory to make the system more efficient
1.1 Problems specification
There have been many problems identified in company and many questions came up and needed
to be answered:
• Several parts have been produced but they are not visible in a system or program
• Parts delivered from supplier but are missing
• there is a mismatch between the inventory in the computer records and the available
physical inventory
The firm recognizes the setback of misplaced quantities at the time of production which
raises: waste of material, waste of time, financial waste and reduced delivery precision.

8
1.2 Outline
In this section the disposition of the rest of the report is presented.
Chapter 1: In this chapter an introduction was written about this thesis. A sub chapter was written
about industry and then brief introduction about company was written.
Chapter 2: The theoretical tools and frameworks used in study of thesis were described in detail
in this chapter.
Chapter 3: Analysis of case studies was done in this chapter which explained the problem faced,
criticalities and solution proposed for those problems. Some solutions were proposed from theory
and other were stated by looking at the problem and possible ways to mitigate them.
Chapter 4: This chapter states the conclusion of this report and the study that was done.
Chapter 5: All the references are written in this chapter including, websites used for the study,
journals, books, and other thesis studies.
1.3 Overview of Industry
Automotive industry is evolving rapidly with the changing technology and environment.
The competition has changed the way car manufactures approach the market. An increasing trend
has been seen from 2017 to 2018. The statistic depicts global vehicle sales by manufacturer in
2017. Japan-based automotive manufacturer Toyota's global vehicle sales came to just shy of 10.5
million units in 2017. Over the past decades, China has emerged as one of the main growth markets
for players in the global automobile industry, with car sales amounting to 24.7 million vehicles in
2017. Iran became one of the most exciting market in terms of passenger car production before
faling victim to U.S. sanctions.
1.3.1 Leading automobile manufacturers worldwide
Since 2013, the joined vehicle sales of these substantial markets grew by 10.5 million
vehicles, of which right around 7 million accumulated to the Chinese new vehicle market. The
Indian new vehicle market increased by a million units in this period while in Russia and Brazil
sales are still around a million cars not exactly like in 2013. Vehicle sales in the USA and Europe
stayed at notable highs as of late while the Chinese new vehicle market contracted in 2018 for the
first time in two decades.

9
Overall vehicle sales were required to achieve 77.8 million units in 2017. Expanded interest
from Chinese clients was anticipated to balance drowsy vehicle sales in Brazil and Russia, where
an absence of buyer certainty and Westerns activities added to financial vulnerability.
The ranking of the main automotive companies in terms of brand value contains the leading
automotive producers Volkswagen, Toyota, General Motors and Renault-Nissan. The Toyota
Motor Corporation sold around 10.47 million light and commercial vehicles in 2017. Toyota’s
main markets contained Japan and the United States. The U.S. was the second largest market for
passenger vehicles worldwide. In September 2017, the U.S. automotive industry reported some
1.4 million-vehicle sales. The rising trend in the world’s second-largest market for passenger
vehicles was set to continue through 2018. A growing number of people will also likely replace
their old vehicle with a new one. On average, U.S. passenger cars were 11.6 years old. FCA has
been ranked 8th in worldwide manufacturing ranking as they produced 4.86 million vehicles in
2017.
Figure 1. Leading Vehicle Manufacturers 2017 (source: Statista)
The global trend was changed in 2018 and higher volume of vehicle was produced.
Increasing demand in some countries resulted in positive trend for manufacturers.

10
Region Dec 2018 %
Change 1-12/2018 %
Change
Europe (EU+EFTA)
1,039,000 -8.7 15,624,500 0.0
Russia* 175,200 5.6 1,800,600 12.8
USA* 1,619,600 1.5 17,215,200 0.5
Japan 319,700 -3.2 4,391,200 0.1
Brazil* 225,400 9.8 2,475,400 13.8
India 238,700 -0.4 3,394,700 5.1
China 2,366,300 -15.8 23,256,300 -3.8
Table 1 Worldwide Car Sales in 2018 by regions (source: VDA)
Year 2018 saw china stayed the biggest country for new car market in the work. However,
the market was less by 4% than it was in 2017, the first reduction in car sales in two decades. In
2018, car sales in China were shakier than in both 2017 and 2016 but still a good 3.2 million higher
than in 2015 and 7 million higher than in 2013.
In the EU and EFTA, traveller car listings decreased in 2018 by 0.04% (around 6,000 cars)
to 15,624,500 cars. Although, there is some ambiguity in the European economy, the major reason
was lack of readiness of new emission regulations.
2018 in total saw Volkswagen Group continued to be the biggest car-manufacturing
corporation in Europe. The PSA Group, boosted by the inclusion of Opel, was the second largest
followed by Renault, BMW and the FCA Group. Volkswagen was also the best-selling car brand
in Europe in 2018 followed by Renault, Ford, Peugeot and Opel.

11
Carmaker FY2018 FY2017 %
17/18 Share
18
EU & EFTA 15,624,486 15,630,555 -0.04 100
VW Group 3,733,427 3,717,478 +0.4 23.9
– VOLKSWAGEN 1,752,162 1,706,431 +2.7 11.2
– AUDI 724,168 826,394 -12.4 4.6
– SKODA 729,224 705,232 +3.4 4.7
– SEAT 452,372 401,028 +12.8 2.9
– PORSCHE 70,504 73,397 -3.9 0.5
PSA Group 2,499,522 1,885,867 +32.5 16.0
– PEUGEOT 971,437 924,953 +5.0 6.2
– CITROEN 598,254 569,822 +5.0 3.8
– Opel / Vauxhall (PSA) 884,412 345,218 +156.2 5.7
– DS 45,419 45,874 -1.0 0.3
RENAULT Group 1,641,156 1,628,702 +0.8 10.5
– RENAULT 1,105,778 1,150,686 -3.9 7.1
– DACIA 528,249 472,816 +11.7 3.4
BMW Group 1,033,221 1,043,217 -1.0 6.6
– BMW 815,179 827,755 -1.5 5.2
– MINI 218,042 215,462 +1.2 1.4
FCA Group 1,021,311 1,045,074 -2.3 6.5
– FIAT 711,285 779,522 -8.8 4.6
– JEEP 168,674 108,431 +55.6 1.1
– ALFA ROMEO 82,939 85,833 -3.4 0.5
– LANCIA/CHRYSLER 48,854 60,885 -19.8 0.3
FORD 994,397 1,018,436 -2.4 6.4
12
DAIMLER 970,187 992,528 -2.3 6.2
– MERCEDES 871,221 893,574 -2.5 5.6
– SMART 98,966 98,954 +0.0 0.6
TOYOTA Group 760,069 732,290 +3.8 4.9
– TOYOTA 713,374 686,757 +3.9 4.6
– LEXUS 46,695 45,533 +2.6 0.3
HYUNDAI 543,292 523,047 +3.9 3.5
KIA 494,304 472,125 +4.7 3.2
NISSAN 493,862 566,516 -12.8 3.2
VOLVO CAR CORP. 320,071 301,603 +6.1 2.0
JAGUAR LAND ROVER Group
214,188 221,039 -3.1 1.4
– LAND ROVER 130,369 151,566 -14.0 0.8
– JAGUAR 83,819 69,473 +20.6 0.5
HONDA 135,584 140,418 -3.4 0.9
GM 3,301 600,996 -99.5 0.0
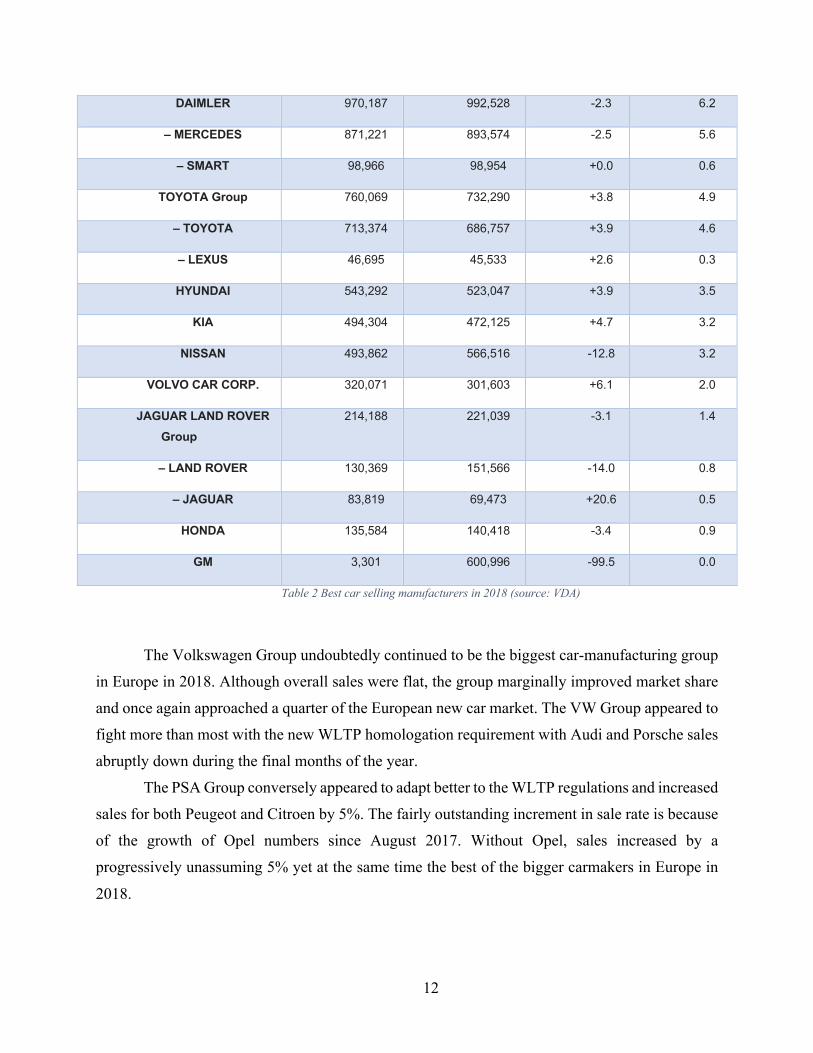
Table 2 Best car selling manufacturers in 2018 (source: VDA)
The Volkswagen Group undoubtedly continued to be the biggest car-manufacturing group
in Europe in 2018. Although overall sales were flat, the group marginally improved market share
and once again approached a quarter of the European new car market. The VW Group appeared to
fight more than most with the new WLTP homologation requirement with Audi and Porsche sales
abruptly down during the final months of the year.
The PSA Group conversely appeared to adapt better to the WLTP regulations and increased
sales for both Peugeot and Citroen by 5%. The fairly outstanding increment in sale rate is because
of the growth of Opel numbers since August 2017. Without Opel, sales increased by a
progressively unassuming 5% yet at the same time the best of the bigger carmakers in Europe in
2018.

13
Sales of the Renault Group were flat in Europe in 2018 with the Renault brand weaker
while Dacia sales increased by twofold digits.
In spite of weaker sales in Europe in 2018, the BMW Group advanced of FCA, which saw
sales slipped for Fiat while Jeep deals increased unequivocally.
Ford deals slipped to not exactly a million vehicles in Europe in 2018. Daimler also had
more fragile deals.
The Toyota Group expanded sales in Europe in 2018. South Korean brands Hyundai and
Kia expanded sales, and both pushed forward of Nissan, that was the most exceedingly terrible
performing carmaker in Europe in 2018 with sales down 13%.
Volvo sales increased in Europe in 2018. Panther Land Rover sales were down regardless
of Jaguar brand sales expanding by a fifth. Honda deals were weaker while GM sales are
essentially down to Corvette and muscle vehicle imports following the clearance of Opel to PSA
in 2017.
A few makers including Mazda, Suzuki and Mitsubishi are never again incorporated into
the ACEA measurements for makers.

14
1.4 Overview of Company
Fiat Chrysler Automobiles is a global automotive group engaged in designing,
engineering, Manufacturing, distributing and selling vehicles, components and production
systems worldwide.
Its main brands include Abarth, Alfa Romeo, Chrysler, Dodge, Fiat, Fiat Professional, Jeep,
Lancia, Ram, Maserati and Mopar, the parts and service brand. The Group’s businesses also
include Comau (production systems), Magneti Marelli (components) and Teksid (iron and
castings).
In addition, retail and dealer financing, leasing and rental services related to and in support
of the Group’s car business are provided either through subsidiaries or through financial partners.
FCA is listed on the New York Stock Exchange under the symbol “FCAU” and on the
Mercato Telematico Azionario under the symbol “FCA”.
Figure 2. FCA group overview

15
Figure 3. Key figures of FCA (source: FCA)
There are 4 main operating regions of FCA that includes NAFTA, LATAM, APAC, EMEA
and China.
Figure 4. FCA divisional structure in Regions
Fiat
Chrysle
r Automobiles
is a

16
The EMEA region of FCA underpins the structure, engineering, improvement,
manufacturing, dissemination and sales of vehicles in Europe, the Middle East and Africa.
The APAC region bolsters the structure, engineering, improvement, manufacturing,
distribution and sales of vehicles in Asia Pacific with key activities in China, India, Japan,
Australia and South Korea and general merchants in different markets.
In the LATAM region, FCA is in charge of the development, production, distribution and
sales of autos and light business vehicles in Brazil, Argentina and Venezuela.
FCA is committed to improving the driving knowledge in North America and around the
globe. It cooperates as the North American arm of FCA to make change in the car field and
guarantee the brands remain aggressive in the worldwide commercial centre.
FCA has sold around 4.8 million autos around the world.
17
1.4.1 Company’s History
Fiat, founded at the end of the 1800s, a phase occupied with the eagerness of outstanding
enterprises, innovative attitude and new ideas, was meant to become one of the world’s leading
industrial groups. Fiat eventual development over the century was followed by this timeline:
1899 On July 11th, the deed of incorporation is signed giving birth to Società Anonima
Fabbrica Italiana di Automobili Torino – F.I.A.T. The first car built was the 4 HP.
1900 The first plant is inaugurated, and production reaches 24 cars a year. 1902 Giovanni Agnelli becomes Managing Director. 1903 Company is listed on the stock exchange and begins producing its first vehicles
for goods transport. 1906 Out of a total 8 million lire in annual sales, export sales reach 6 million lire. Auto
production is expanded with the addition of the 8, 10, 12, 24, 60, 100 and 130 HP models. The company also begins making trucks, buses, trams and marine engines.
1908 Company begins manufacturing of aircraft engines, the first developed is the 50hp SA 8/75, which incorporates the experience acquired on the auto racing circuit. In Europe, as the new century unfolds, significant economic and scientific progress continues but the eruption of the Great War has a considerable impact on industrial activity as it is transformed to support the country’s military effort.
1910 Six new models are launched: the 12-15 HP, 15-20 HP, 20-30 HP, 30-45 HP and the Type 5 and Type 6.
1912-1914 Fiat cars win a number of international races, such as the American Grand Prize, the Indianapolis 500-Mile. Race and the Gothenburg-Stockholm Winter Cup. The first small displacement production car, the Fiat Zero, is created.
1914 As part of the war effort, almost 20,000 units of the 18BL lorry are produced and, in the years following, various aircraft engines.
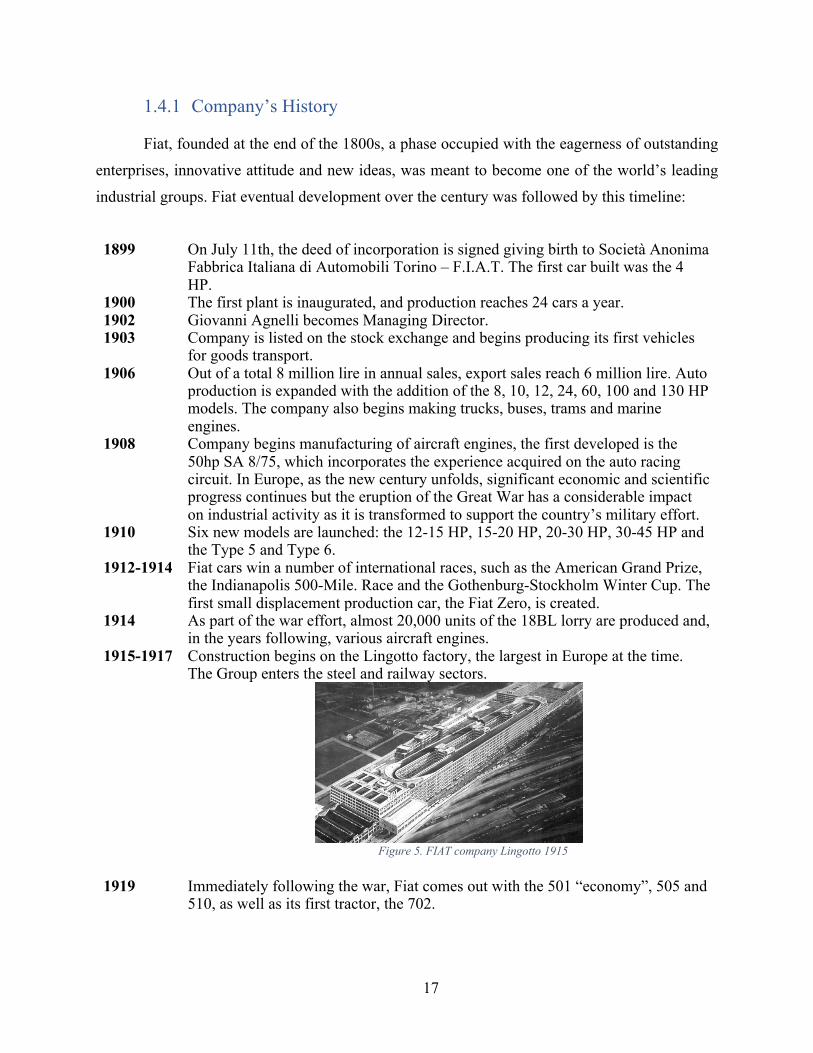
1915-1917 Construction begins on the Lingotto factory, the largest in Europe at the time. The Group enters the steel and railway sectors.
Figure 5. FIAT company Lingotto 1915
1919 Immediately following the war, Fiat comes out with the 501 “economy”, 505 and 510, as well as its first tractor, the 702.

18
1945-1947 Senator Agnelli dies on 16 December 1945 and Vittorio Valletta becomes chairperson. Large-scale production of cars resumes, with models such as the 500B berlinetta and estate, the refreshed 1100 and 1500, and the sporty 1100S. Alongside these are trucks and buses, high-power tractors, railcars, airplanes and large marine engines.
1951 The transatlantic liner Giulio Cesare, powered by a Fiat engine, enters service and Italy’s first jet, the Fiat G.80, takes flight.
1952 The high-performance 8V sports car reaches 200 kilometres per hour and the 7002 helicopter is presented. The same year, production begins on the 682N lorry, which goes on to be produce for more than a quarter of a century and becomes a milestone in transport history.
1955 Impresit, a company specialized in civil engineering founded in 1929, constructs roads, tunnels, bridges and dams, such as the Kariba dam on the Zambesi river.
1956 The new 500 and the Autobianchi Bianchina are launched. The Fiat G.91 is selected as tactical fighter for NATO. The decade begins with a general spirit of optimism and the economic miracle continues in Italy. Fiat experiences dramatic increase in production volumes: the number of cars constructed per year goes from 425,000 to 1,741,000; trucks from 19,000 to 64,800; tractors from 22,637 to 50,558; earthmovers from 3,000 to 6,255. Fiat doubles the number of employees to almost 171,000.
Italy experiences a period of economic boom and the car industry is one of the main drivers of intense growth: one car for every 96 inhabitants in 1949 becomes one for every 28 inhabitants in 1958. 1963 Fiat now has more than 85,000 employees and car production grows six-fold over
the decade. 1964 Launch of the two-door, five-seat Fiat 850 sedan. 1966 Giovanni Agnelli, grandson of the founder, becomes Chairman. A major
agreement is signed for construction of the Vaz plant in Togliattigrad, Russia, which will produce two thousand Zigulì passenger cars a day.
1969 The company acquires Lancia and purchases a 50% interest in Sefac-Ferrari. The same year, Fiat Ferroviaria designs and produces the Pendolino, the world’s first tilting train.
1970 The 128, Fiat’s first front-wheel drive car, is named “Car of the Year”. FIAT group invests heavily in the south of Italy. During the same period, Fiat begins the process of decentralizing its operating activities, transforming the company into an industrial holding. Among the first companies to be established were Fiat Macchine Movimento Terra, Fiat Engineering and Iveco.
1972 Lancia begins production of the Beta, which is followed in subsequent years by the Stratos, Gamma and Delta. The same year, Lancia wins the World Rally Constructors’ Championship many times
1975 Ferrari wins the Formula 1 World Championship. This triumph is repeated in 1977 and 1979.
1984 Alfa Romeo becomes part of the Group. 1985 Production begins on the innovative FIRE (Fully Integrated and Robotized
Engine)

19
1987 The world’s first direct-injection diesel engine for passenger cars is developed. Moreover, in the same year, FIAT Ferroviaria constructed the high-speed train called pendolino, which can reach a maximum speed of 280 km/h (174 mph), service top speed was 250 km/h (155 mph).
1988 State-of-the-art research centre Elasis is established at the Group’s initiative. The same year, the Fiat Tipo is named “Car of the Year”. Other cars to achieve success during the decade are the Fiat Regata and Croma, the Lancia Delta, Thema and Y10, the Alfa Romeo 164, and the Ferrari GTO, Testarossa and F40, as well as the commercial vehicles Fiorino and Ducato.
1990 Panda Elettra is the first mass-produced electric vehicle.
1993 Company acquires the prestigious automaker Maserati and also introduces Progetto Autonomy to facilitate mobility for the disabled.
1997 Alfa Romeo 156 becomes the first car in the world to be fitted with a diesel engine with Common Rail system, which within the space of a few years revolutionizes the market for diesel-powered cars.
1998 Fiat Multipla, Lancia Lybra and new Punto come into the market. 1999 World’s first automated manual transmission (Selespeed) goes into mass
production. During the same year, CNH-Case New Holland is formed to create a leading global player in agricultural and construction equipment.
2000-2008 Punto, the new Idea, the Bravo, and relaunches the iconic Fiat 500; Alfa Romeo debuts the 159, 166, MiTO and Giulietta; for its 100th anniversary, Lancia launches the all-new Ypsilon; at Maranello, Ferrari begins production of the innovative Ferrari F430 and 599 GTB Fiorano; and, Maserati comes out with the captivating GranSport and GranTurismo. In 2004, the Group begins an impressive turnaround achieving record profits in 2008.
2009-2013 Fiat Group and Chrysler Group enter into a global strategic alliance in mid-2009, launching a period of profound changes for both groups. Synergies include optimization of the respective manufacturing footprints and global supplier base, sharing of technologies and access to new markets. Chrysler Group achieves an impressive turnaround in just 19 months and fully repays, with interests and six years ahead of schedule, all the loans received from the U.S. and Canadian governments. A historic decision changes the shape of the Group: the demerger of its capital goods businesses and the creation of two distinct entities, Fiat and Fiat Industrial. By the end of the period, Fiat and Chrysler have achieved full integration at the industrial and cultural level and have created an organization that is truly unified in practice, even if not yet on paper.

20
1.5 Overview of Department
I have started my thesis in “Manufacturing planning and control” department in FCA. The
main activities of this department are to ensure the financial stability and continuous supply of
material in order to produce the desired quantity. I have worked in an office, which controls
working capital of FCA. My thesis mainly consisted on developing technical standard for
manufacturing, which will be discussed in detail in the later chapter and analysing the KPI’s to
evaluate the quantities generating negative cash flow. My work mainly will be about supply chain
and its related work to calculate the right safety stock and to decrease the negative work in progress
in production plants. All these will be discussed in later chapters in detail and the methodologies
used for this purpose.
2014-Present
In early 2014, Fiat Group acquires 100% ownership in Chrysler Group paving the way to complete the union between the two groups in both financial and technical terms. The merger of an Italian company and an American company creates a multi-national organization that operates in more than 140 countries and employs nearly 236,000 people. Fiat Chrysler Automobiles unveils the Group’s strategic plan for 2014-2018. This marks the beginning of a new phase for the now fully integrated global automaker, which pursues its ambitious strategic objectives while consistently delivering on the key financial targets set out in the plan.

21
2 Theoretical Background
These days manufacturing industries are facing serious and continuous pressures to reduce
their costs from both shareholders and from the market. In fact, the shareholders are seeking to
have the maximum revenue with a minimum cost. As well, the market and customers aim to get
good products in term of quality, delivery timing and prices. According to Krishnan et al. (2011),
one of the main troubles nowadays is that manufacturers not just want to but has to reduce
manufacturing costs while bringing maximum output for customers. All the factor raises some
questions: how can manufacturing companies improve their efficiency and be able to provide good
quality products with optimized capital? How can they bring maximum value to customers with
reduced costs? How can manufacturers optimize their cash flows whilst pursuing cost reduction
objectives? Inventory management is one of the key factors contributing to enhance manufacturing
plant’s results. In fact, inventory levels are affecting directly the financial results of the industrial
companies, we often hear about percentage to sales. The higher the inventory percentage to sales
is the lower plant’s efficiency is.
A brief literature review, available tools and theoretical framework has been discussed
below.
2.1 Working Capital Management
The management of working capital is a critical part of an organization to keep up the
monetary circumstance amid the typical time of business. Working capital is the main venture an
organization makes without anticipating a characterized return. This speculation is basic so as to
keep the business running than to create something itself. Along these lines, numerous
organizations have over-put resources into working capital prompting income issues and to a
decline in investor esteem. For some organizations, the parts of working capital speak to the
biggest things on the monetary record. In spite of this, they tend not to be viewed as issues,
requesting vital thought or best administration consideration. (Drinking spree 2009, p. 325.)
In a journal published by Hofmann and Kotzap (2010), they expressed that the management
of working capital includes all highlights of the organization's present assets and current liabilities.

22
The primary point of this is to reduce working capital by lessening current assets and extending
current liabilities. In the following sections, the most important parts of working capital are
contemplated in more detail.
2.1.1 Working Capital
There have been a wide range of approaches to characterize working capital all relying
upon the diverse sources. Working capital is a tool of assets which incorporates many accounting
components, for example, money, stock and accounts whether receivable or payable. This
subtracted from obligations or if organization owes in short term. The hypothetical equation
broadly utilized is following:
𝑊𝑜𝑟𝑘𝑖𝑛𝑔𝐶𝑎𝑝𝑖𝑡𝑎𝑙 = 𝐶𝑢𝑟𝑟𝑒𝑛𝑡𝐴𝑠𝑠𝑒𝑡 − 𝐶𝑢𝑟𝑟𝑒𝑛𝑡𝐿𝑖𝑎𝑏𝑖𝑙𝑖𝑡𝑖𝑒𝑠
An alternate, more elaborated formula is given below: 𝑊𝑜𝑟𝑘𝑖𝑛𝑔𝐶𝑎𝑝𝑖𝑡𝑎𝑙 = 𝐼𝑛𝑣𝑒𝑛𝑡𝑜𝑟𝑖𝑒𝑠 + 𝐴𝑐𝑐𝑜𝑢𝑛𝑡𝑅𝑒𝑐𝑒𝑖𝑣𝑎𝑏𝑙𝑒𝑠 − 𝐴𝑐𝑐𝑜𝑢𝑛𝑡𝑃𝑎𝑦𝑎𝑏𝑙𝑒𝑠 − 𝐴𝑑𝑣𝑎𝑛𝑐𝑒𝑠𝑅𝑒𝑐𝑒𝑖𝑣𝑒𝑑
The term working capital demonstrate organization's momentary resources or current
resources. Organizations deal with their working capital on regular basis to ensure they have
adequate resources to run the activities. This include numerous activities and money distribution
over various tasks. (Ross 2007. p. 4). So as to manage vulnerabilities and capriciousness of
inbound and outbound of cash flow, most of the companies require to main a certain level of
working capital. A few procedures, for instance, irregular supply chains, over-stock, deficient
exchange credit terms, and imperfect advance choices require higher working capital than what is
adequate. Organizations lean towards better administration by not putting their working capital in
non-gainful stocks and different procedures, for example, limiting the time of accumulation of
account receivable. (Hoffmann 2010, p. 308.)
2.1.2 Cash Conversion Cycle
“The cash conversion cycle (CCC) is a metric that states the time (measured in days) it
requires for a company to transform its ventures in stock and other resources into cash flows from
sales. Also called the Net Operating Cycle or simply Cash Cycle, CCC attempts to measure how
long each net input dollar is tied up in the production and sales process before it gets converted
into cash received.”

23
Figure 6. Cash Conversion Cycle of a company (source: google images)
The significance of this cycle is its capacity to demonstrate the span of days the income of
organization is constrained in different activities. In the event that the timeframe of this cycle is
negative, it shows that all the stock deals and receivable records have been settled before settling
the liabilities. There have been conditions like this where organization has sold the stock while no
money has been returned or gotten. An imperative rule of fund is to get the money and defer the
outpouring as long as it very well may be finished. This administration route comprises on
customary strategy for money working cycle and the money transformation cycle. The money
change cycle comprises on collection bookkeeping data and it in a roundabout way assesses
organization's monetary circumstance. That is, if the cycle is short in connection to a long cycle,
it as a rule shoes that the firm is getting the money faster than they are paying the providers close
the date of expiry. This outcomes in high net income and friends' esteem separately and the other
way around. Correspondingly, if the cycle is short, the inner task of organization is progressively
proficient. It likewise decides the reserve of how long are committed to inventories and different
receivables, on the off chance that the days are less, at that point it implies the installment due has

24
been conceded. For the most part this cycle considers the time span of store that are submitted and
doesn't consider the measure of assets. (Upper class et al. 2001 p. 90.)
2.1.3 Inventory
Inventory is an accounting term that indicates the part or good that are in different stages
of production even in phase of being sold, including:
• Finished goods (that are available to be sold)
• Work-in-progress (meaning in the process of being made)
• Raw materials (to be used to produce more finished goods)
Inventory is usually the biggest current asset.
An organization must have the enough liquidity all together to pay the bills and wages, on
the other hand, it additionally requires having enough stock, so it doesn't intrude on the production,
likewise considering that it doesn't decrease the quality level to consumer satisfaction. However,
these two needs can be met, if there is an unlimited amount of capital, yet having a lot of stock
would be slothful for working capital. This implies the if the stock is substantial and its expense
of holding capital is likewise huge, this would result in loss of benefit. (Mott 2008, p. 231.)
Inventory management is extremely an imperative subject in overseeing working capital
of an organization who needs to decrease the working capital and have leverage on liquidity, to
accomplish this, organizations should concentrate on stock reduction. So as to work, organizations
need raw material, finished products just as work in progress. Ordinarily, on the off chance that
you have more finished products, you have all the more working capital. Along these lines it
includes an exchange off among expenses and holding an extensive stock. It isn't mandatory to
have raw material, finished product and so on however from perspective of cost, it costs less to
keep the stock than to purchase on regular basis. Organizations needs to adjust between holding a
stock and purchasing on day by day basis. (Brealey, 2011 p. 786). Stock management is a piece of
supply chain management.
2.1.4 Supply-chain management
Mostly, it is taken for granted the influence supply chain management has over company’s
performance. Supply chain management often refers inter-organizational disposition, it is not hard
to understand the common goal of all the entities involved, that is, to achieve the goal of financial
improvements. Risks and capital costs are often transferred to other various stages of SCM when

25
different approaches like extension done to payable suppliers, imposition of receivable to
customers or unbalance inventory programs are implemented. (Hofman 2010, p. 305.)
There have been many models over time that were developed for managing inventories.
The sole purpose of these frames is to help in finding the optimal level of inventory. For example,
economic order quantity (EOQ) is used in order to calculate the inventory level, where the total
inventory holding costs and ordering costs are in minimum, and just-in time (JIT) is depends on
long-term contracts with suppliers and deliveries, exactly in needed amounts and times. EOQ
approximates demand from previous experience, material requirements purchasing (MRP) is
dependent on what requires to be bought or manufactured to meet the planned level of production,
to fulfil actual or expected orders from customers. (Mott 2008, p. 243.)
2.1.5 Raw materials inventory
For the companies that are producing good, it is important to schedule the production taking
into account the amount of raw material that is available in stock to make production easier. If the
raw material is already available in stock, these companies can schedule without any hesitation
and proceed with production. Another reason to have a stock raw is the fluctuation of prices,
companies can buy the material when the believe the prices are low and then decide not to buy if
the prices go up.to ensure there is no shortage of material in production it is important to have
stock. (Scherr 1989, p. 281.)
2.1.6 Work in Progress Inventory
A certain amount of work-in-progress inventory occurs as products move from one
production process to another. A major reason why firms keep work-in-progress inventory beyond
this minimum level is to buffer production. Buffering is part of the planning process and allows
flexibility and economies that would not otherwise occur. (Sherr, 1989 p. 282.)
Considering my scope of study, I would be focusing on two of the main pillars of working
capital, logistic and inventory control. Scope of this study is to evaluate and determine how to
improve the working capital by reducing waste and improving logistic of FCA.

26
2.2 Logistic and Supply chain
2.2.1 Introduction to logistic
As the time passes by, basic concept of logistic is changing over time, which is generalized
logistics and narrow physical distribution distinctions. Concept of logistics was differentiated
officially by council of logistic management.
The main attributes of today’s logistics are more about customer satisfaction, the effective
logistics activities and extension from the traditional sale of the logistics to the supply logistics,
business and sales logistics.
Figure 7. Extension of modern logistic
Nevertheless, there are numerous meanings of present-day logistics that are broadly
utilized and acknowledged. One essential and normal definition is 7 R's of Logistics. These R's
guarantees the accessibility of items that are right for the production. Furthermore, Christopher in
1998 expressed, procurement procedure can be overseen deliberately by logistics. material's
storage and movements, the raw material and finished stock experiences such a marketing price
such that, its cost has been boosted. (Jane and Ochoa 2006, 11-12). Another definition has been
expressed by Robert V. Delaney, Logistics is the management of stock in movement and at rest.
furthermore, the primary objective of the logistic responsible is to guarantee that production is at
highest level. (Stephen and C. John 2000, 73)
Nonetheless, logistic is considered as the flow of components amid during production,
through materials procurement and physical transfer of these two utilitarian activities, separately

27
to both suppliers and client introduction of the longitudinal expansion of the structure of the
production network framework.
So as to guarantee the viability of logistics, it is vital to know the components that
influences its benefit and execution. As expressed by Lumsden, the productivity can be clarified
as far as service, cost and tied working capital. Their association with return is portrayed in picture
below:
Figure 8. The fundamental balance - logistic mix of goals
(source: Modified according to Lumsden. 1998)
2.2.2 Logistic Areas
In a manufacturing plant, it is essential to isolate diverse logistics regions based on their
usefulness. Each logistic are should be set up as per their requirements and capacity. Important
components inside FCA Plant are:
- Loading and Unloading: the place the raw material is stored after the purchase and
finished good are stored to be shipped
- Magazine/Warehouse: It is a place where finished products are placed
- Buffer: Safety stock of different types of materials inside the plant, from raw materials to
work in progress to finished products
- Pick-up Location: here raw material arrives and are differentiated into classes, which in
turn gives the information about each specific route and schedule to be transported to the
assembly line. Some of these materials/components are unloaded from their original

28
packaging and loaded into standard packaging while other are sent in in the same package
to production line.
- Kitting Area: Various components coming from external supplier and those, which are
produced inside the Plant, are sorted into within cells. The kits assembled here are then
transferred to the assembly line, based on the type of components to be assembled.
2.2.3 Logistic flow
The two essential flows, which supplements one another, are the physical flow of material
and the flow of data. These streams are integral and go the other way, which could be seen from
the graphical portrayal:
Figure 9. Logistic flow representation (source: google images)
2.2.4 Materials Management and Classification
The way material flow is handled inside a company determines costs and profits of a
company. Mismanagement could definitely cause loss, both in financial and production terms.
Based on statistical studies, materials’ cost has a major impact on the total production cost
of the finished product.
• Raw materials: Material arriving in raw form and soon to be processed

29
• Subassembly parts/components: Other components, that are essential to make the
finished products.
• Work in Progress materials: Material, that is currently under development, in machining
stage or in conversion stage.
• Toll Manufactured Goods: Material that cannot be processed inside the production
facility due to some reason and will be sent away to an external contractor which will
process and sent the material back in final product form
• Finished goods: Final finished product that is ready to be sold
In the manufacturing world, all the materials represent an investment, which in turn means
a prospect of profitability. The objective of materials management is to make sure when to order
and quantity to order the materials, and eventually to determine the strategic stocks.
2.2.5 Storage
Inside a logistic chain of an organization, a storage has twofold jobs as a holder of stock
and as a converter of inbound flow to an outbound one. The last job, as a converter, concerns both
the evolution of the component after some time and the composition of the component or, if there
should be an occurrence of the most fundamental types of parts, the nature of the item.
Storages can be useful in increasing the manufacturing proficiency by diminishing the
expenses, emerge from Non-Productive Time (NPT) caused by raw materials or WIP deficiencies.
For certain period's interest, storages give as buffers. By amplifying the production limit and in
this manner increasing the level of stock, to most likely satisfy request when it peaks. Different
reasons for capacity is the affirmation of materials accessibility, both raw and work in progress
materials, as a security from increasing cost of raw materials and, at lastly, to most likely react to
sudden change of interest.
As found in the figure 9, there are three sorts of storages or warehouse, for raw materials,
work in progress merchandise and completed products. There are three distinct sorts of costs
connected to stock keeping, time costs, space related expenses and the management costs. Time
related expenses are spoken to by capital expense. This infers these expenses are entirely relied
upon the term of the stock keeping inside the storage or distribution centre. Space related expenses
relied upon the expense of distribution (for instance lease). At last, the management costs are
spoken to by degrading expense.

30
• Procurement costs, every time an order is placed towards the supplier there are several
costs related to it induced by various activities involved, including the offer analysis, order
issue, follow-up, order reception, check and control, and other activities.
• Movement related expenses are connected to internal movement activities, which in turn
are related to energy utilizations, conveyance, storage method and equipment.
• Insurance costs including premiums relative to policy or protection against risks, such as
fire risk or theft.
• Management expenses are related to employees, arrangement and conveyance
organization.
• Stock-out expenses is the slight profit loss each time a request from customer is not met
due to lack of storage of material.
2.2.6 Stock and Stock Management
Any material that is put away for production reason. A production stock can be
characterized as the group of items which contributes in delivering the finished product, including
raw materials, components, semi-completed items. In the event that there is an action that expects
to adjust the free market activity, it will likewise influence the variety of the stock size. The
motivation behind having a stock is to guarantee the independency of various stages inside a
manufacturing cycle and to deal with various variation. It likewise ensures the adaptability of the
production plan, as a preventive proportion of the conveyance time varieties and to benefit from
the ideal size of request. There are a few sorts of stock:
• Cycle stock: this type of stock fulfils the warehouse demand. The material arrives in bigger
batch with lower frequency in order to fulfil the higher demand requests in smaller batches
or quantity.
• Seasonal stock: this type of stock is meant for goods with seasonal demand. It is
considered advantageous to build up or stock up when demand is low to be able to satisfy
demand, later when it goes up.
• Pipeline stock: this type of stock includes the material that have been shipped from
company’s warehouse but have not been bought by the customer, or users, and are therefore
still within the firm's distribution chain. It is used to separate the stages between production
phases or in a distribution system.

31
• Safety stock: this type of stock is used to compensate or make up for the uncertainty of
demand and offer, caused by, as an example, delays in delivery, production system failures
and fluctuation of demand.
Unexpectedly, a stock management framework is a lot of procedure that controls the
amount of stock and manage which level to keep, when to resize the request and what point
reintegration is required.
The primary point of stock management is to control the correct amount and time to deliver
or re-request the, while limiting the expense of the procedure. There are numerous strategies or
methods typically utilized in stock management, including:
• Materials Requirement Planning: this type of planning is used to calculate the required
and lead-time, taking into account the demand. This technique anticipates the total
knowledge of the production plan, BOM (bills of materials), level of stock and lead-time.
• Economic Order Quantity or EOQ: It is deterministic model, which describes the trade-
offs between inventory cost and ordering. This method predicts a continuous control of
stock. The model consists on a quantity that is already fixed for re-order with different time
intervals. As the name explains, the target is to minimize the total cost of inventory
management, in a certain time period.
• Economic Production Quantity or EPQ: this model is similar to EOQ model with a
minor difference. Instead of orders received in a single delivery, the units received in an
increasing order by increment during production, which is, a constant production rate. This
model is particularly useful for production in which when an order is placed, the production
begins, and a constant number of units is produced, refilling the stock on daily basis until
the production is completed.
The level of stock, with time proportion, is calculated with the following formula:
G(t) =∫ [𝑝(𝑡) − 𝑑(𝑡)]𝑑𝑡CD
Where p(t) represents the refill or refurbishment rate of the storage, d(t) indicates the
demand and G(t) represents the stock, all on a time proportion basis.

32
2.2.7 Safety Stock
Generally, customer’s demand and obtained lead time are variables that can’t be controlled
due to constant variation. These two reasons combining could lead to a stock out condition. A
stock-out situation occurs when the available level of stock is less or hardly convers the demands
of customers. In financial terms, stock-out results in loss of revenue, gross profit, customer and
market share.
On the contrary, having a lot inventory would results in holding cost. Due to uncertainty is
about demand and supply it is really difficult to calculate the amount of stock needed to meet the
customer’s demand while ensuring the availability of stock. However, it is possible, to decrease
the impact of variation, using the technique of Re-order Level and the Safety Stock. The safety
stock is an extra quantity to apart from what is required in order to avoid the risk of stock-out. To
calculate the safety stock, it is necessary to identify several variables, which are:
• Demand (D): the average quantity of material consumed by the customer, on a given time.
• Procurement Lead Time (PLT): It is the time between the issue of the order (Re-order
Level) and order fulfilment. Depending on the service provided by seller, lead times can
be constant or variable. It is almost impossible to reach the stable level. Usually the lead
time is variable, implicates that the products production or time of delivery are not always
the same.
Figure 10. Lead-time gap
• Approximation Error is the estimate of the difference between the effective demand or the
procurement lead time and the forecasted ones, which is expressed as a standard deviation
(𝝈).

33
• Service Level (SL): It is the possibility that the quantity of inventory on hand during the
lead time is enough to meet the anticipated demand. Put it differently, the probability that
stock-out will not occur. Determining the correct service level for a definite product is
fundamentally balancing inventory costs in comparison to the cost of a stock out. It is
essential to keep in mind that growing a products service level will in turn rises the amount
of inventory held as safety stock. Sequentially, increasing cost connected with the
particular product in discussion. Therefore, it is recommended to set a realistic service level
which meets the business model requirements. In order to change the desired service level
into a briefer value, it is mandatory to use a normal distribution chart and find the service
factor (Z), which matches to the service level established earlier.
It is implied that safety stock and service level can be more efficient to be measured through
the use of standard deviation. The normal distribution is denser in the centre and contains more
data than at the extreme ends. Standard deviation can be calculated through following formula.
𝑆𝑡𝑎𝑛𝑑𝑎𝑟𝑑𝐷𝑒𝑣𝑖𝑎𝑡𝑖𝑜𝑛(𝜎) = I1𝑛K (𝑥M − �̅�)O
P
MQR
where 𝑥M = demand on specified period “𝑖” and 𝑥 = average demand. For a normal
distribution equalling to 68.26% of the data falls under one standard deviation of the mean (�̅� ±
𝛔). 95.45% of the data falls beneath two standard deviation of the mean (�̅� ± 2𝛔) and 99.73% of
the data falls inside three standard deviation of the mean ( �̅� ± 3𝛔).

34
Figure 11. Normal (Gaussian) Distribution and Standard Deviation
So as to figure explicit amount, meet the particular service level, the service factor is
utilized as a multiplier alongside the standard deviation. The connection between service level and
service factor is non-linear, essentialness that higher service level needs higher service factor,
consequently causing in higher safety stock size. A clarification should be possible with an
example, if the required dimension is 98% and the stock gotten the opportunity to reorder point,
all through the lead time, the organization accepts to take care of all requests from clients amid the
lead time for 98% of the time. While 2% of the requests the organization will dare to come up
short on stock.
Instead of utilizing the comparative and static service factor for all goods or factors, diverse
variables can be intended for different materials and parts. The changed service factor could be
resolved basing on planned significance, overall revenue or even effect of sale. An item with
greater worth, will have more security stock.
As demonstrated previously, having demand and lead time inconstancy this equation to
compute safety stock can be utilized:
𝑆𝑎𝑓𝑒𝑡𝑦𝑆𝑡𝑜𝑐𝑘(𝑆𝑆) = 𝑍W(𝑃𝐿𝑇YYYYY ∙ 𝜎[)O + (𝐷\ ∙ 𝜎]^_)O
Z is the service factor, PLT is the Procurement Lead Time, D represents demand, 𝜎[ is the
standard deviation of the demand and 𝜎]^_ is the standard deviation of the Procurement Lead-

35
Time. Generally, this formula is appropriate to estimate inventory and calculate flexible changes
in supply and demand. Summarizing, the company can approximate the occurrence of out of stocks
situation. Safety stock exclusively computes the quantity of extra stock, which should be added to
total inventory, other than showing when to reorder. As soon as it is settled, inventory level should
be observed continually over time to decide if the inventory profile is as projected or not.
Figure 12. Safety Stock Graph (source: google images)

36
2.2.8 FCA Supply chain Structure
Figure 13. FCA Supply Chain Management organizational structure
A supply chain management structure of FCA has been shown in the figure, which, is sub
divided into further part.
Every SCM office has their own Finance and human resource managers, which report to
the central level. Each Plant has a Plant Logistics Manager, which coordinates the material flow
inside the facility; this manager reports to the Plant Manager but at the functional level is placed
under the SCM.
The Business Centre level involves the managers which coordinate the vehicle distribution
and the commercial activities inside each country. They report to the region manager but
functionally they belong to the SCM.
The Business Planning & KPI System also involves the control of logistics and targets
requires for the operation, recognising the problem and proposing correct solution.
The Demand & Production Planning gathers real and predicted orders for the final cars and
set the volume production levels for each plant, that requires to satisfy the customer’s demand.
The Supply & Capacity Management supports the Purchasing department in outlining the supply

37
sizes; it recognizes limitations such as restrictions in plants and capacity of supplier and time
constraints; it confirms the actual capacity and the future volume requirements. It also manages
the supplier mixing and the compliance of supplies to standards and arrangements.
The Process & Methods is a cross-operational entity which matches the strategy and the
execution of new procedure criteria and policies; for example, it can upkeep the IT entity to apply
new tools and software in the operative actions. The Vehicle Distribution oversees the transport
and handling of vehicles through the markets. The Inter-Regional Operations are involved in the
material flow management among the regions, which are connected by devoted nodes and
warehouses (called IRF). The Maserati brand has its own Supply Chain Management office, due
to the individuality of its business that however reports to the FCA Supply Chain Management
Head Officer.
The i-FAST is a totally FCA-owned company, that controls the container logistic
management and also controls the transportation. Specifically, i-FAST accomplishes the
movement of standardized containers which are more than 2 million, that are property of FCA and
that are lent to contractors who request this service, producing revenues. Nonetheless, i-FAST is
involved also in the operational activities of vehicle distribution, with stocking, movement and
unloading of the car carriers through the markets. The i-FAST is the main seller of delivery
services to FCA, conversely also other private companies are involved in this activity. The
described system is aimed at supporting the orthodox order to delivery cycle:
1. Demand planning
2. Management of orders
3. Suppliers capacity confirmation
4. Import/Export flow management
5. Inbound transportation
6. Manufacturing logistics
7. Outbound transportation finished product
8. Market supply
2.3 Logistics and Inventory Management
For this situation, the issue is inside a production domain and it covers internal logistic
areas, for example, warehousing and development of material inside the plant. The issue space

38
along these lines incorporates areas, for example, bill of material, bill of manufacturing, physical
stock, material flow process, innovation accessible to help in having a successful material flow
process, human errors, stock record incorrectness, inventory inaccuracy, and so on.
"A stock management framework comprises in monitoring the identity and number of
items" (Sahin and Dallery, 2008 p.1) and their areas inside the facility. "Stock record incorrectness,
for example the inconsistency between the recorded stock and the real stock physically accessible
in the warehouse, is a generous issue looked by such frameworks" (Sahin and Dallery, 2008 p.1).
"Stock precision is a key component for good operational flow" (Gill, 2007 p.22)
"Among components that lead to stock mistakes and wasteful aspects in activities are
misplacement error, stealing, obsolete items, supplier cheats and exchange mistakes, for example
blunders that emerge while recognizing/tallying items or checking their standardized identification
names" (Sahin and Dallery, 2008 p.1). Stock errors result from inadequate picking, storage and
recording activities. Nonetheless, because of the setting of this contextual investigation, it is
fundamental that the stock flow situation be taken a gander at from a production point of view.
2.3.1 Bill of Material (BOM)
“A Bill of Material is a listing of all the sub-assemblies, intermediates, parts, and raw
materials that go into a parent assembly showing the quantity of each required to make an
assembly” (Fogarty et. al, 1991 p.811)
In a situation where production is sequenced on an earliest-due-date rule based on
chronological order number and recording of the output occurs after production at each station,
random error in the recording of the data could be introduced at one of two selected stations. In
some cases, the station could be near the gateway activity (low in the BOM), in others, the error
could occur near the finished goods level (high in the BOM).
Furthermore, making a system where two matching units can get overrun of quantities by
each other can create problems if they are assembled concurrently at altered assembly stations. A
problem arises when different worker who realises that a part which is only available part start to
assemble. Through the assembling, one of the assembly lines would extract the part while the other
line will now miss that part and have to put the whole unit in a postponement.
2.3.2 Bill of Manufacture
"To empower the arrangement of production job for building staggered items and
overseeing customer's requests, a strategy called bill of manufacturing (BOMfr) is utilized".

39
Bill of manufacturing blends bill of material by associating materials and parts directly to
the activity that needs them in the moving order. A bill of manufacturing depicts the assembly data
of a manufactured item by distinguishing the course of action of production forms required to
make the item, contained with materials and transitional parts, items fundamental at every task.
By actualizing such framework each request can be allotted specific parts and that would
bring about having no issue of missing thing."
2.3.3 Physical Inventory System
components required in performing production jobs formed from client orders are
accumulated in the physical stock system in magazine. storage procedures are utilized to dispense
stock items in a magazine that is open physically. Petersen and Aase (2004 p.12) express that
"storage arrangements, which dole out SKUs to storage location, for the most part fall into three
general classifications".
"Impromptu storage is normally utilized in numerous distribution centres since it is easy to
utilize, regularly includes less space than other capacity techniques, and results in an increasingly
level utilization of all picking passageways. Volume-based storage arrangements dole out SKUs
with the biggest interest to areas close to the get/drop-off (p/d) point" (Petersen and Aase, 2004
p.12). Petersen (1999 p.1053) further expresses that "in practice, numerous warehouses utilize
arbitrary storage and use volume-based storage for just a couple of high-volume items".
Distribution centres, or as it were the physical stock framework, can be made progressively
compelling. Hendry (1998) underscores that we should "Improve perceivability". Regardless of
whether we have a utilitarian diagram, a lot less complex storage can be structured which is
progressively detectable, that would prompt decrease of out of date material while limiting work
in advancement and crude material.
2.3.4 Inaccuracy in inventory Record (IRI)
"Often, stock portrayed to be missed, happens not lost ,or even, missing. The
announcement frequently begins from the issue the stock has been checked wrongly".
"The precision of stock is really the extent between number of stock units checked and are
discovered right and complete number of stock units" (Brown et. al, 2001 p.48). Accordingly,
stock record mistake is said to happen when the measure of accessible physical stock varies from
the records.

40
2.3.5 Negative Stock Balance
This kind of balance isn't permitted in stock framework. In its place, permitting negative
values, which are impractical physically, the balance ought to be put as zero and stock manager
ought to be informed rapidly about the mistake happened and its reason should to be examined.
The purposes behind negative balance can for instance be:
• Difference between original number and counting done manually
• Wrong part could be issued instead
• Wrong number were put when adding the stock numbers
At present, negative inventory record balances are used as a form of priority indicator at
FCA.

41
2.3.6 Causes of Inventory Inaccuracy
This table has been taken from a book, also stated in one of the articles publish. It actually
describes the problem that are involved in my argument.
Inventory Cause
Accounting control
Typically via "charge
categories")
Inventory Control
Status
Causes of Inventory
Inaccuracy
Received Material
Upon "logical" receipt
on freight on board
responsibility
(shipping point or
destination)
Received but not
Available
Supplier Related error:
-Supplier over ship
-Supplier under ship
-Packing Slip quantity error
-Material misidentified by
packing slip
-Supplier ships +/- packing
slip quantity
Shipping-related errors:
-Loss during shipment
-Damage during shipment
Company-related errors:
-PO Receipt data entry error
-Inaccurate count upon
receipt
Incoming Inspection Raw Material In inspection but not
available
Quality Control (QC) error in
specifying:
-Loss due to destruct
sampling
-Loss due to sample
quantity usage
-Partial rejection quantity

42
Rejected Material Raw Material In disposition but not
available
QC error in specifying
reject quantity
Disposed Material Return to supplier or
scrapped Unavailable
-QC error in specifying
disposed quantity
-QC error in specifying
accepted quantity
Material in transit to
stores Raw material
Received but not
available
Material taken by
production without the
proper paperwork update
Material in stores Raw Material Available
-Cycle count adjustment
error(s)
-Issue error(s)
-Credit (returned materials)
identification
quantity error(s)
-Scale count error(s)
-Receipt error(s)
-Transfer error(s)
-Damaged material
-Lost/pilfered material
-Misidentified material
-Misplaced material
-Misissued material
-Incorrect unit of measure
-Incorrect unit of measure
conversion factor
Material bin-locked Raw Material In-stock but not
available
Kitted material Work in progress Issued
-Incorrect issued quantity
-Incorrect part issued
-Duplicate issue

43
Materials issued to
Production without
kitting
Work in progress Issued
-Incorrect issued quantity
-Incorrect part issued
-Duplicate issue
Production Loss Scrapped Issued
-Incorrect scrap quantity
-Materials disposed-off
improperly
-Lost or pilfered material
Finished good in
warehouse Finished goods Available
-Incorrect paperwork
-Improper stacking pattern
for quantity
-Returned material without
proper paperwork
-See Material in Stores
Finished good in
Shipping sales Issued
-Incorrect issue quantity
-Incorrect kitting
Incorrect paperwork Table 3. Summary of the causes of inventory inaccuracies (Bernard, 1999 pp.199- 200)

44

45
3 FIAT CHRYSLER AUTOMOBILES: A CASE STUDY
3.1 Technical standards for manufacturing
The aim of this research was to develop technical standards in order to increase the
efficiency of production while reducing cost and time. The main aim was to evaluate the impact
of these technical standards on working capital, and how it can help the company to reduce the
cost, while maintaining the desired level of production.
Working Capital is a fundamental and strategic instrument of corporate financing,
representing all the resources destined for the cycle of transformation and sale waiting to be
consumed or sold. It assures the logistical need of all the production plants, considering the
economics and financial stability.
Working capital expresses the extent to which the company is able to meet the
commitments made in the short term with the realization of short-term assets. Its constant
monitoring allowed the company to avoid liquidity crises and compromise financial balance.
In order to understand how these standards were developed, it is important to understand
how working capital is calculated in FCA.
The working capital in FCA production is calculated in terms of money (€), of all the
materials present in Warehouse, + work in progress (Hung + Side Line) + Finished Product +
Traveling (in return yield).
It is also calculated in terms days; this value represents the days of coverage of material
present in the factory. Formula used to calculate working is following
𝑁𝑒𝑡𝑤𝑜𝑟𝑘𝑖𝑛𝑔𝑐𝑎𝑝𝑖𝑡𝑎𝑙 = 𝐺𝑟𝑜𝑠𝑠𝑤𝑜𝑟𝑘𝑖𝑛𝑔𝑐𝑎𝑝𝑖𝑡𝑎𝑙 − (𝑚𝑒𝑐ℎ𝑎𝑛𝑖𝑐𝑎𝑙 + 𝑏𝑎𝑛𝑘𝑖𝑛𝑔 + 𝑡𝑟𝑎𝑛𝑠𝑖𝑡)
Identification of problems:
It is often stated that the working capital is one of the main pillars for any company to
operate smoothly. But in order to calculate it correctly, many variables need to be taken into
consideration. During this development many questions were needed to be answered in pursuance
of right calculation. For example:
1. How do you calculate the cost of material in transit?
2. How the hung material or material in side-line is calculated?
3. What constraints are used in order to calculate the safety stock?

46
4. What standards were used to calculate the distance for material in transit?
5. What is the right lead time for material to arrive?
All these parameters make a huge part working capital. So, to make sure it the working
capital calculations were right, some technical standards were developed and improved.
3.1.1 Defining Technical Standard
The technical standard is the tool for managing the working capital of the system in an
analytical form, taking into account the physical and mathematical parameters connected to the
production plant, and exempted from all derivatives such as (obsolete, overstock, banking, etc.),
has the objective of making reference for an optimal management of materials and management
parameters (e.g. stocks, frequency of shipping).
The technical standard is calculated on each part or material managed by the production
plant, taking into account the following factors:
• Transit time
• Safety stock
• Supplier location
• Standard cost
• Day Requirement
• Delivery Frequency
• Work in progress (line side + pending)
• Material in transit
It provides us with the value of working capital divided by:
• Area of plants (Assembly-Taping - Painting)
• Supply point
• Warehouse / Work in progress / Traveling / outsourced work / Start-up
• According to distance bands
3.1.2 Calculation of Technical Standard
To calculate technical standard, three important components were considered, which
further breakdown into sub-components.

47
• Warehouse stock
• Work in progress material + pending material
• Material in transit
3.1.2.1 Warehouse Stock
The warehouse is a essential part of the company logistics as it contributes to the decision-
making and operational processes aimed at ensuring the timely supply of the production and
distribution structure, allowing the continuous supply to the outlet market. The warehouse has the
fundamental function of connecting the company's purchases and its technical-economic
transformation processes, guaranteeing:
1. Continuity of the production process and timeliness in meeting customer needs
2. Separation of business processes
From the physical point of view, the warehouse term identifies:
1. Stock of materials, goods, semi-finished and finished products present on the holding to be
used or sold
2. The structures (buildings, equipment, various materials and accessories) and the personnel
able to receive, store and deliver the stocks
The term stock indicates the quantity of materials, semi-finished and finished products present in
stock at a given time, ready to be used in the production and distribution process.
Stocks are classified according to different criteria: by nature, based on physical /
merchandise characteristics, and according to their use and function in the production process. In
the latter case, they are classified in:
• Existing stock: It is quantity actually present in the warehouse at a certain time
• Virtual stock: It is the existing stock increased by the quantities ordered to suppliers and
reduced by those already committed to customers
• Normal stock: average stock normally in stock during the year
• Maximum stock: stock not to be exceeded to maintain the balance between production
efficiency and cost limitation
• Minimum or security stock: Level of stock below which the company risks changes in
the market

48
• Speculative stock: stock formed under particular market conditions, when expectations
arise about a short-term rise in the purchase price of materials or goods
The classification consists in splitting stocks into homogeneous classes, for example on the
basis of belonging to a commodity sector. The codification consists in the attribution to each article
of a name that can be a number or a set of letters and numbers.
The construction of the code of a product requires the identification of subclasses, determined not
only for internal use but also to make the instruction booklet or maintenance manual of the
purchased product easily accessible for the customer.
In case of FCA, warehouse stock was calculated with following parameters:
• Material Cost
• Daily Requirement
• Frequency of delivery
• Distance in km
To elaborate further, material cost is the standard cost, of any goods purchased by FCA, set by
supplier. Daily requirement is programmed by supply chain department in coordination with plant
to produce the required cars. Delivery frequency determines how many times a material needs to
be delivered at warehouse or pre-determined location.
In order to provide a correct amount of material required, first, required stock level has to
be carefully evaluated. The main purpose of the stock level is to satisfy the component demand
and to protect against uncertainty. In order to carry out this operation, analytical methods can be
followed. However, these models require the knowledge about the variability of the system, both
in terms of supply (trough lead-time uncertainty) and demand (trough component demand
fluctuations over time, due to a variable end product demand).
In Fiat Chrysler Automobiles, due to complexity of system and the high number of items
to be controlled, the inventory level is carried out through a perceptive method, which was
developed through years, with the assistance of experience and experts opinion.

49
Figure 14. Intuitive method used in FCA to approximately evaluate the necessary inventory level, taking into account
the delivery frequency, the distance from the supplier and the weekly delivered volume.
Knowing the distance between the location of supplier and the plant’s destination, this
information is intersected with the frequency of delivery (or the volume delivered each week),
using the colours displayed in each section. For example, if the delivery frequency is daily and the
volume delivered each week is between 121 and 180 cubic meters, the reference colour is green.
Therefore, knowing the distance that the component has to travel, the analyst selects the external
circular section associated to that distance and to the reference colour. In case of a distance between
251 and 600 kilometres, choosing the green section, the amount of stock suggested by the method
is 3,10 days. Knowing the component demand of the plant, the number of items that the warehouse
has to stock can be easily calculated.
If the goods are just-in-sequence the values of the magazine and the work in progress are
equal to 0. Only the pending is considered with the same logic of the other details

50
Figure 15. Standards used in FCA for lead-time distance and frequency of delivery
3.1.2.2 Work in progress and pending material
Work-in-progress (WIP) indicates the inventory of company that is yet to be completed.
The accounting term of these semi-finished goods is also called material in process on the balance
sheet .
The formula, taken from a website Investopedia, which is also described in literature, is as
follows:
Work in progress = (operating inventory goods in process + raw materials used during the
period + direct labour during the period + factory overhead for period) - ending inventory
For each part or good, a collection means is considered, with half the standard quantity,
plus the pending material considering the number of parts on the production line during the various
stages of parts assembly.
Pending material is simply the material in line for the production that is not yet used.

51
A more practical approach to calculate the work in progress material was used:
𝑊𝑜𝑟𝑘𝑖𝑛𝑝𝑟𝑜𝑔𝑟𝑒𝑠𝑠 = 𝑀𝑒𝑎𝑛𝑠𝑜𝑓𝑐𝑜𝑙𝑙𝑒𝑐𝑡𝑖𝑜𝑛𝑓𝑜𝑟𝑊𝐼𝑃 ∗ 𝑄𝑢𝑎𝑛𝑡𝑖𝑡𝑦 ∗ 𝑈𝑛𝑖𝑡𝑃𝑟𝑖𝑐𝑒
Means of collection is an important indicator here, which is, the containers used in order to collect
and transport the material. It is necessary to understand the standardization of containers in FCA.
3.1.3 Containers and standardization
Due to the great capacity and intricacy of the automotive supply movements, it is of main
prominence to have a firm control over the movements of container for the inbound network. The
i-Fast Container Logistics is FCA’s own service for transportation. A main factor, that permits
corporations to lessen transportation and management costs and difficulty, is the degree of
standardization that the firm can present in the container variety. Numerous standard container
models are used in the daily delivery cycle, with diverse features and fields of application. The
standard containers can be classified, according to their application, in Control Units and Stacking
Units. For each field the containers can be sub-divided according to their characteristics.
Figure 16. Cycle of transport in FCA

52
Figure 17. Some of the containers used in FCA supply
The standardization of containers was introduced to attain modularity when loading the
truck or the shipping containers. The dimensions of the loading and handling units were designed
in order to perfectly fit, in a certain number, to the internal dimensions of the carrying units moved
by transportation vehicles (trucks, ship or train). Hence, the company has to rely on truck with
standard dimension.
Figure 18. i-fast logistic service of FCA
The same considerations can be made when the shipping containers are studied: producers
throughout the world respect their standard dimensions, in order to bring into line, the global
operations of the companies and countries trading goods.

53
Coming back to the topic of Work in progress, as we have seen, containers plays an
important role and according to their dimension and type, a number is assigned to them. If the
material Management type is Deposit, Containers = 0; if type is Warehouse = storage means of
collection of stock – means of collection of WIP; If Type is WIP then it is put equal to zero.
3.1.3.1 Material in transit
Material that has been in transit, which has left the point of supplier and is on its way to
point of arrival, is considered material in transit or travelling. Following formula is used in order
to calculate the value as it is a part of working capital.
𝑀𝑎𝑡𝑒𝑟𝑖𝑎𝑙𝑖𝑛𝑡𝑟𝑎𝑛𝑠𝑖𝑡 = 𝑇𝑟𝑎𝑛𝑠𝑖𝑡𝑡𝑖𝑚𝑒 ∗ 𝐷𝑎𝑦𝑟𝑒𝑞𝑢𝑖𝑟𝑒𝑚𝑒𝑛𝑡
Again, it is important to into account the type of containers used and then the value is rounded off
per package. This further requires the explanation of methods used to calculate transit time.
Transit time:
The Transit Time (TT) is the time needed to cover a certain distance. More precisely, it
indicates the time period between the date of collection of the materials at the place of pick-up and
the date of delivery of the same at the factory / warehouse. It is calculated considering the working
days between the date of pick-up at the supplier and the delivery date to the destiny plant.
• AxA 1 day of transit
• AxB 2 days of transit
• AxC 3 days of transit
• ....
(Where A = day of pickup and B, C ... = day of delivery)
Why is it important to know the TT?
On the basis of the delivery date requested by the plant, knowing the value of the transit
time, it is possible to identify the pick-up date at the supplier (obviously Saturday and Sunday
excluded).
Example: The table below shows the above calculation for the delivery of 26/09: in
accordance with the TT (A x G 7 days of transit) the date of pick will be set on 18/09.
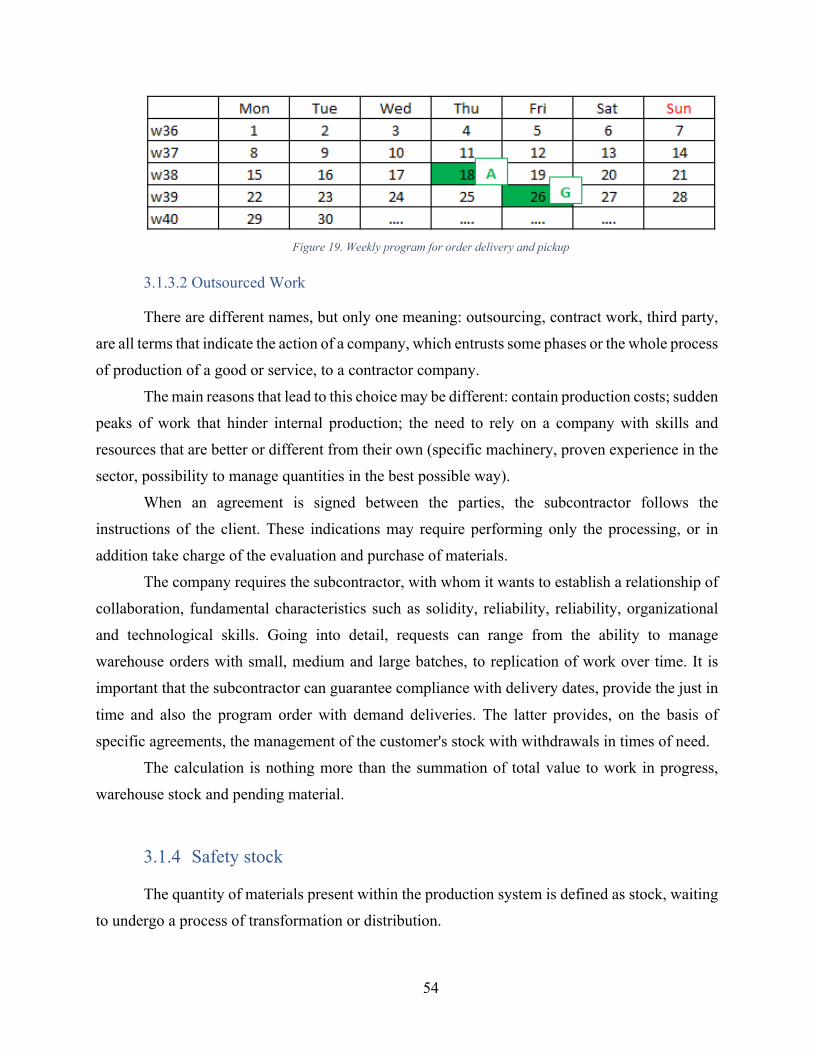
54
Figure 19. Weekly program for order delivery and pickup
3.1.3.2 Outsourced Work
There are different names, but only one meaning: outsourcing, contract work, third party,
are all terms that indicate the action of a company, which entrusts some phases or the whole process
of production of a good or service, to a contractor company.
The main reasons that lead to this choice may be different: contain production costs; sudden
peaks of work that hinder internal production; the need to rely on a company with skills and
resources that are better or different from their own (specific machinery, proven experience in the
sector, possibility to manage quantities in the best possible way).
When an agreement is signed between the parties, the subcontractor follows the
instructions of the client. These indications may require performing only the processing, or in
addition take charge of the evaluation and purchase of materials.
The company requires the subcontractor, with whom it wants to establish a relationship of
collaboration, fundamental characteristics such as solidity, reliability, reliability, organizational
and technological skills. Going into detail, requests can range from the ability to manage
warehouse orders with small, medium and large batches, to replication of work over time. It is
important that the subcontractor can guarantee compliance with delivery dates, provide the just in
time and also the program order with demand deliveries. The latter provides, on the basis of
specific agreements, the management of the customer's stock with withdrawals in times of need.
The calculation is nothing more than the summation of total value to work in progress,
warehouse stock and pending material.
3.1.4 Safety stock
The quantity of materials present within the production system is defined as stock, waiting
to undergo a process of transformation or distribution.

55
In particular, raw materials in stock are waiting to be introduced for the first time in the
production cycle, unlike semi-finished and finished products that have already undergone partial
or complete processing within the company. The safety stocks respond to the purpose of ensuring
continuity of production processes and sales, where this is considered a primary objective on the
management side.
A theoretical framework has been explained already in chapter above. Usually companies
follow the formula presented in textbook in order to calculate or update their safety stock. Which
is mostly the right choice. But due to standard deviation and variability it does not provide the
exact answer. Because of the problems faced regarding FCA safety stock a modified formula was
presented, which in turn gave the better result and is currently in use for the calculation.
For FCA assembly plants the safety stock is calculated as the sum of several determined
coefficients with the following information:
1. Distance
2. Mix variation of material
3. Unit cost
4. Frequency of delivery
5. Transit warehouse
6. Multiple delivery order
7. Stock of first delivery
All this data is taken from different systems and then analysed manually, in order to calculate the
safety stock.
For reasons of clarity in the calculation display, we separate the stock into 3 parts:
• A (stock)
• B (transit warehouses)
• C (stock of first delivery)
So, the formula becomes:
𝑆𝑎𝑓𝑒𝑡𝑦𝑠𝑡𝑜𝑐𝑘 = 𝐴 + 𝐵 + 𝐶
These coefficients are calculated by comparing different scenarios and constraints.
3.1.4.1 A (stock)
The coefficient A is calculated with the following formula:

56
• If the material or good falls in multiple delivery goods A = 0,5
• Otherwise, A = S1 + S2 + S3 + S4
Where the coefficients S1, S2, S3, S4 are determined by the data taken from the system or entered
by the user in following structure.
Distance(km) S1 Mix S2 Price S3 Delivery frequency S4
301-600 1 15-40 1.1 <2 2.4 96 0.2
301-600 1 15-40 1.1 5-Feb 1.8 99 0.2
1201-1800 2 40-70 2.2 5-Feb 1.8 84 1.2 Table 4. Illustrative data for calculation of coefficient of safety stock
It is important to declare that this data has been used for the scope of illustration.
Distance has already been defined in the previous arguments. In addition, Mix is actually
the percentage of material bought from two different suppliers and it has been divided in different
band which corresponds to different distance intervals. Every delivery is categorized according to
its frequency and then assigned a number respectively.
Frequency of delivery Duration Days of stock of first
delivery
11 Monthly 20
21 Bi monthly 10
96 Daily 1
99 Daily 1
41 weekly 5
84 Thrice a month 2 Table 5. Frequency of delivery and their assigned values

57
3.1.4.2 B (transit warehouses)
• If the part or good has intermediate warehouse or transit warehouse, then it is considered
as B=3
• Otherwise it is considered 0
3.1.4.3 C (stock of first delivery)
𝐶 =𝑆𝑡𝑜𝑐𝑘𝑜𝑓𝑓𝑖𝑟𝑠𝑡𝑑𝑒𝑙𝑖𝑣𝑒𝑟𝑦
2
Stock and its frequency can be calculated from the example shown in the above table.
3.1.5 Logics behind calculation of safety stock
• Absorption of material: If the absorption is high, the stock will be low. On the other hand,
if the absorption is low, the stock will be higher
• Distance: On 2 same parts with the same parameters, but with different distances, the stock
will be higher for the part with the greater distance
• Material Cost: If the price is low, the stock will be higher and vice versa
• Delivery Frequency: for materials with daily deliveries, the stock is lower than the
materials, delivered weekly
• In most cases, the suppliers of the material that is in JIT or JIS, safety stock will be equal
to ZERO.
• If there is a transit warehouse, the safety stock automatically adds 3 days of safety stock.
• For the suppliers with Transit Time> 5 days, the programming is done by freezing 2 weeks,
in these cases, due to lack of stability, stock should be increased. (to evaluate the
coefficient.

58
3.1.6 Implementation of technical standard and its impact
After the study of all the coefficients and constraints, a practical approach was used in order
to check the correctness of formula for both safety stock and technical standards. All these
formulas were implemented on data, results obtained were satisfactory, and more beneficial for
company’s working capital. It has been observed that with these standards and formulas, safety
stock became more accurate and the overall production of each plant was improved by a good
margin. These standards have been implemented in every plant of FCA, which, in return has
increased the efficiency of production and reduced the cost and time as well. A greater impact has
been observed on working capital, which was the main aim of this study.
A full implementation of these formulas requires a lot of calculation, which cannot be
shown due to privacy reasons.
Due to confidentiality of data, exact numbers and values cannot be written in thesis, as it
is a part of FCA production process and the functionality of working capital. However, an example
has been shown in order to understand the impact of these technical standards.
An analysis on frequency of delivery, making distance intervals and overall in EMEA
region. It was observed that after implementing standards, a theoretical value of -88 million euros,
which could be saved after proper implementation of technical standards.
Figure 20. Impact of technical standards on delivery frequency
€(60,000,000)€(50,000,000)€(40,000,000)€(30,000,000)€(20,000,000)€(10,000,000)€-
Weekly
Daily
Tri weekly
Bi weely
Fortnightly
Monthly
66 %25 %5 %
3 %--
Delivery Frequency

59
Figure 21. Impact of technical standards on distance interval
3.1.6.1 Plants 1
Due to non-disclosure agreement, names of the plants have been changed to just number.
Few points have been made on the reduction of working capital after the implementation of
technical standards.
- Inventory value by setting stocks according to standards = € 9,914 thousand
- Reduction of daily stock = 1,049 K € equal to 9% of the value of stocks.
- Days reduction = 1,310 K € equal to 11% of the value of stocks.
- Average working capital value of plant 33.000K €
- Reduction equal to 7.2% of working capital.
3.1.6.2 Plant 2
- Inventory value by setting stocks according to standards = € 32,999 thousand
- Reduction of daily stock = 5,973 K € equal to 15% of the value of stocks.
- Average working capital value of plant 83,121K €
- Reduction equal to 7.2% of working capital.
3.1.6.3 Plant 3
- Inventory value by setting stocks according to standards = € 47,106 thousand
- Reduction of daily stock = 3,825 K € equal to 7.5% of the value of stocks.
- Average working capital value of plant 159,322 K €
- Reduction equal to 2.4% of working capital.
€(35,000,000)€(30,000,000)€(25,000,000)€(20,000,000)€(15,000,000)€(10,000,000)€(5,000,000)€-
Overseas
6-250
1801-2400
601-1200
1201-1800
251-600
0-5
36 %17 %16 %
15 %9 %
4 %2 %
Distance interval (KM)

60
3.2 Analysis of Missing items
At the time of production, a major problem is missing of an item that need for the
production of parts or components. It mostly occurs with the material bought from suppliers and
even material made in house. Occasionally, if an employee is looking for an item in a warehouse
where it should have been places, the part is not there physically. But the system is showing that
the material is located at that place and is available.
Many causes have been identified in chapter 2 for missing item and how inventory
management can affect the working capital. Many companies are now more concerned about this
issue and how they can optimize their inventory in order to get the optimal results. During this
analysis of FCA, it was observed that a good part of working capital of increased due to missing
item. The name used in industry is negative work in progress, that simply means if a part has been
used but not updated in inventory it generates a negative balance. There could be many reasons
for this as working in a plant as big as FCA’s plants is not a simple task and chances or errors are
bigger. With increasing production, scrap and waste increases over time and so does the numbers
of missing items. However, it may not be able to get rid of this problem totally, it can be reduced
to certain level that it does not have a big impact on company’s financial report.
Many problems have been identified and few of them have been modified for better results,
which after implementation would result in positive working capital.

61
3.2.1 Identified Root causes in FCA
3.2.1.1 Missing transfer from warehouse to production line
Before understanding how this cause generates negative balance in manufacturing it is
important to understand the method of this process.
Loading / unloading method: the insertion or removal of parts inside the container can
be done automatically or manually. The handling solutions can therefore be different in the various
points of the value chain: for example, the discharge can be manual, while the load is robotized,
or vice versa.
With unloading, it means transfer to the line, therefore loading of the container, with load
vice versa.
When there is manual, it is advisable to provide a special shred that allows the operator to
literally, enter the container in order to carry out the manipulation with the greatest convenience.
This is a constraint in the design phase, but also in the handling phase, in accordance with the
standard it is not possible to forecast it in the container on the side of the glove. This type of
imitation, as we can guess, constrains the positioning on the line side on the means of transport.
The ergonomic constraints that condition the manual gripping of the elements make it very easy
to carry weight; for this reason, in some special cases in which the piece is particularly heavy to
handle, a weight canceler is used, thanks to which the conveyor can do it in complete safety, also
containing fatigue and ensuring a constant level of productivity.
These particular instruments are pneumatic manipulators with articulated arms, consisting
of a pneumatic cylinder fed with compressed air coupled to a lever transmission system, which
balances the weight of the applied load. The strength of the controlled cylinder through two
pneumatic circuits opportunely predisposed: it first ensures that the weight of the gripping system
is always balanced, while it is second to balance the weight of the load. The change in load level
obtained by the operator applying a minimum force on the gripping tool or directly on the load.
Thanks to this equipment, it is therefore possible, for a single operator, to move even very heavy
elements respecting the ergonomic restrictions. On the contrary, when there are automatisms for
gripping the element, appropriate spaces must be left inside the collection means in such a way as
to facilitate the movements of the robot and provide the racks to allow the elements to be spaced
correctly; both these operations, although necessary, limit the saturation of the container. In some
cases, when the weight and the dimensions of the element exceed the limits allowed for it by a

62
single person, a manual loading / unloading performed by two operators can be envisaged; in this
case, very rare, two shutters on one side can be designed.
Cartellino identificativo materiale (CIM) is the technique that is widely used in FCA now.
To put it in more simple way it is known as bar code scanning, which is used mostly to tag the
material in order to keep its record. However, there are some projects under consideration in order
to bring this error to zero, by implementing methods that are more effective.
However, by using more advance technology this problem can be eliminated. An RFID is
highly recommended to bring this problem to zero. An introduction to RFID has been explained
below.
3.2.1.1.1 RFID: Radio Frequency Identification
During their flow, whatever it is among the aforementioned, the containers can be equipped
with a special radio frequency identification tag.
RFID means a technology for the automatic identification and/or storage of information
about objects (also applicable to animals or people), known as automatic identifying and data
capture (AIDC). Based on the ability to store data by details electronic labels, called tags (or even
transponders), and on their ability to respond to remote interrogation by special fixed or portable
devices, called readers. This identification is made by radiofrequency, thanks to this reader can
communicate and/or update the information contained in the tags it is interrogating; in fact, despite
its name, a reader is not only able to read but also to write information.
In a sense, RFID devices can therefore be similar to systems of reading and/or writing
without filling various applications. In recent years the NFC standard (Near Field Communication,
13.56 MHz and up to 10 cm, but with data transmission speeds of up to 424 kbps) is being
gradually established, which also allows the exchange of information between readers.
Specifically, an RFID system consisting of three fundamental elements:
• A reading and / or writing device (reader);
• One or more RFID tags (or tags or transponders);
• Information management system for their transfer to and from readers.
The RFID tag may be active, passive, semi-passive or semi-active. If it is active, it has:
• A battery to power it;
• One or more antennas to send it a read signal and receive answers even on different
frequencies;

63
• One or more transponders / RFID tags
• They generally have greater operating distances than passive tags and reach a maximum of
200m.
The main element features an RFID tag system, consisting of:
• A microchip that contains data in memory
• An antenna
• A physical medium that holds it and the antenna called "substrate", which can be in Mylar,
plastic film (PET, PVC, etc.), carts or other materials.
The antenna receives a signal that, through induction, transfigures into electrical energy,
feeding it microchip. This transmits the data it contains via the antenna (signal transmission circuit)
to the device that receives the data. In short, therefore, an RFID tag is able to receive and transmit
via radio frequency the information contained in the chip to an RFID transceiver.
This in-depth introduction allows us to understand how a system of this type can be implemented
inside of a company logistics system to optimize its flows; in particular, RFID can be applied to:
• Warehouses: Identifying each container and each warehouse shelf with tags reduces errors
in withdrawals and provides a certain identification of the item (depending on the
controlled entities we speak of Item Tagging, in the case of a single object, or Box
Tagging). It is not necessary to open the packaging to check the contents of it, looking for
it with the code, as it is not necessary to do it manually to check the physical inventory.
With a series of remote scans, it is possible to identify and verify the presence of specific
items in the warehouse. In fact, the technology allows you to simultaneously read more
labels: up to 100 at the same time, also ensuring that you know in good time the warehouse
stock. The technology used in an 860-960 MHz ISO 18000-6 tag.
• Transport: In this case, the tags are applied both on objects (boxes, pallets, etc.) to be
transported, and on means of transport (wagons, cars, etc.). In Italy, France and Japan,
millions of RFID cards are already operating, allowing commuters to use different types of
transport with different forms of subscription (the common example of it is tele pass). RFID

64
systems therefore contribute to improve the quality of transport means, identification
systems in terms of efficiency and service.
Obviously, a technology of this type represents an important investment for any type of
company, so that, before moving towards this solution, a benefit/cost analysis needs to be
performed to understand if the benefits are actually greater than the costs. the advantage obtained
thanks to the application of this innovation is clear. in fact, there is an instantaneous electronic
bubble, which makes the handling of materials extremely efficient and precise, while allowing a
correct storage of data, which, in many cases, they are manually reported more times before being
recorded, running the risks of being lost or equivocal and becoming at the same time unusable in
case of future analysis.
3.2.1.2 A flawed inventory data gathering procedure
In a system or program for the inventory management, all items are subtracted from
computer database once the items are picked up for production purposes. Which in turn, takes the
idea of all the items present physically and so it does record on program database. System also
takes into account that if a certain item is dedicated for certain production it cannot be substitutes
or used somewhere else. The framework in this way makes a presumption of an "impeccable
world". This supposition penetrates all through the component of the stock administration
programming and the stock administration work method. This presumption is a key reason for the
issue of missing things at the time of production. In that capacity, despite the fact that the quantity
of things recovered or delivered in a vocation request can vary from what was arranged, the present
stock information the executive’s methodology does not guarantee the genuine sum recovered or
created to be enlisted yet it rather guarantees that the arranged sum is enrolled regardless of any
distinctions. This tosses the stock records out of balance.
3.2.1.3 Employees using a substitute
To represent this, envision a circumstance in which around 12 things were put in the
appointed static rack yet because of the rack being full simultaneously, 2 of these things were set
in another rack and the typical identifier was utilized to demonstrate the additional area. At the
point when 10 of these things have been utilized, and they were altogether taken from the allocated
static rack as is regularly the situation, there would be none left at the allotted static rack in spite
of the fact that there would be 2 remaining in the additional area. The PC framework would at
present determine that 2 are left in the allotted rack. Assuming, the identifier used to demonstrate

65
the additional areas tumbles off as here and there occurs and one of the things is required in a
request, issues emerge. At the point when laborers go for the thing and don't discover any in the
relegated static area and don't discover the identifier it is possible that, it in some cases happens
that those specialists who need such a thing critically will as a snappy momentary arrangement
take a comparable thing whose physical and PC stock parity is for example 3 that is wanted to be
utilized for another sort of unit and change it to look like the required part by for instance cutting
the length.
What could be the possible consequences?
The system parity of that item that was required by the request will progress toward
becoming 1 (on the grounds that once a request is "discharged" the things required for the request
are consequently deducted from the PC's stock database once the program is run) albeit physically,
it would even now be 2. The balance for the item that was utilized as a substitute will physically
lessen to 2 however not in the PC framework if no additional measures are taken. Such measures
could, for instance, be telling the creation organizers that a substitute thing has been utilized and
that the stock parity should be physically decreased in the PC framework. This issue unleashes
destruction when the creation organizers are not informed that a substitute has been utilized. This
is on the grounds that the administrator himself because of administrators not being approved to
change the PC framework balance does regularly not right the stock record balance. Different
variables that expansion the effect of this issue incorporate time requirements and the administrator
not having any desire to demonstrate the generation head/organizer that a deviation from the work
system has been made. In synopsis, the result of this activity is a raising unevenness between the
PC's stock record information and the physical stock.
3.2.1.4 Experienced employees using matching parts from another order
The experienced employees who realize how each part looks like can take alternate ways
to almost certainly total their present air-handling units. These parts are specially allotted for a
specific unit. Be that as it may, a comparative unit may likewise have a requirement for a similar
part, and this is the point at which the issue emerges.
What could be the possible consequences?
If these kinds of situation arise, it creates a lot of problems for example:

66
• It makes lost parts (stock items) in requests and in that capacity, as indicated by the working
methodology, it isn't permitted to take parts from another request in spite of the fact that to
keep the conveyance accuracy high, parts are in some cases stolen from different requests.
• On the off chance that the worker who took the similar item from the other request
neglects to advise any individual who can re-request a section for that other request (for
example a production organizer) that the part has been taken, that request will come up
short on the part. The part would in this manner should be re-requested at the time it is
required. For little parts, this will make superfluous holding up time since new things
should be created in the pre-fabricating division and after that conveyed to the production
assembly group. For greater or vital things, the holding up time is even much more
terrible.
• Together with the issue of the computer system, it contributes to a mismatch between the
physical inventory and computer system inventory data.
3.2.1.5 Ineffective bar-code scanning
The use of bar-codes was found not to be effective.
Causes it has generated:
Some suppliers who deliver the materials do not have bar-code scanners with them during
the time of delivery. This hinders the stock records from being effectively refreshed with the new
area of things when the things are moved with the trucks. This is therefore an issue of inadequate
specialized facilities. Those suppliers that do have standardized tag scanners are once in a while
hesitant to move out of their vehicle and utilize the scanners because of the extra time and exertion
required. This issue is likewise identified with the way that in the present state, it is beyond the
realm of imagination to expect to examine the things while sitting in the truck and that the
standardized tag scanners that are utilized can just output from a separation of roughly twenty
centimeters. This is subsequently an issue of specialist social inclinations and nonappearance of
hierarchical measures to keep these conduct tendencies.
The checking system for area assurance isn't sufficiently thorough. This empowers the
inclination for things to be conveyed late to the assembly and controls divisions. At the point when
material from supplier, they are sometimes assigned a specific place by the receiving department.
Now and again, the standardized identifications are found excessively near one another.
This is frequently the situation for racks high up. This expands the inclination to check the wrong
standardized identification amid stock stockpiling and recovery. An alternate method has been

67
discussed in detail already. Implementing new technology would definitely result in more
accuracy.
3.2.1.6 Human Errors
There is an inclination for human blunders through oversight. At the receiving office,
which fills in as the primary purpose of receiving the stock, landing from providers, item
information on records from providers and the truck drivers are at times checked for match
physically by looking at the article numbers in spite of the fact that scanner tag data exists. The
explanation behind the manual check originates from the two actualities that a few gatherings in
the division don't have standardized identification peruses and the present stock information
gathering method does not inflexibly require it. At this division, it was seen that there was a ton of
manual keying of stock area data, particularly the locations. The PC framework does not give a
double-checking option where standardized identification sweeps can be looked at against entered
in information for a representative to be alarmed in the event that the wrong item was filtered, or
the wrong article number was written. The framework requirement and the stock chronicle
methodology therefore increment the propensity for human mistakes which, thus, causes a
confusion between the physical stock and the stock records in the PC framework.
3.2.1.7 Documents containing bar-codes put one inside another
In some cases, material arrive from a provider bundled in one container. Nonetheless, the
papers containing the scanner tags, CIM, are regularly put one inside another. Accordingly, the
material handler just observes the peripheral paper and scan them. This is basically the issue of
misidentified material by pressing slip inside one another. Subsequently, other material, which
have reached from the provider, are not recorded in the system. The outcome is that parts material
from providers, yet nobody knows where they are.
Sometimes, during the change of worker’s shift the handler leave the tags as it is. When a
new person comes, he does not pay attention to the work left by previous person thus losing all the
codes to scan and enter in the system.
3.2.1.8 Changes in the Composition of Groups and Failure to Update Records
Changes in the creation of groups and in that capacity work abilities and an inability to
refresh the stock directing information in the PC framework to line up with current gathering pieces
was additionally observed to be an explanation behind missing parts for a few requests. For
example, one group is assigned to produce one item and another group is supposed to produce
68
different part. While, the first group takes that substitute and identical part of the first one, it leaves
the second group with no option than to stop and wait for the item to arrive.
3.2.2 Proposed solution to mitigate inventory inaccuracy
3.2.2.1 Preparing the kits in Advance
Unquestionably, this strategy of issuing complete material units ahead of time will work,
since each work-request is independent and not subject to some other materials from anyplace
whenever. It is an assurance that the work request will be raced to fulfillment. The general
population searching for readiness in the task will say that if the generation plan changes, the work-
requests can be executed in any grouping even on an alternate line with a completely extraordinary
line design. The expense of doing this anyway is extremely high. The sheer number of extra
materials expected to get ready ahead of time and focus on assembling is exceptionally high,
particularly in the high-volume conditions. Indeed, even materials which are basic starting with
one work-request then onto the next should be independently provided, adequately in copy.
To adjust total units as a best practice, there is an immense increment in the amount of
materials distributed by material release planner from the stockroom to the production line, and as
a result, an enormous increment in the material work in progress on the production line. Change-
overs take longer since all materials should be changed, re-setup and re-checked, and there will be
a massive increment in the quantity of halfway utilized reels, all of which should be overseen.
Individuals utilizing this training, additionally, state that advance prepared material kits are
open for mistreatment, for example as the arrangement changes or surprising decay happens the
readied units are frequently "plundered" for materials required at short notice, which bargains the
pack honesty prompting extra inside deficiencies.
Having such an expansion of materials on the production line, with such a big volume of
utilized rolls to oversee can't be viewed as a best practice, however actually, this is normal.
3.2.2.2 Counting of material not used on return to warehouse
Numerous rolls and plate of materials will turn out to be midway used and should be
overseen. It requires investment and exertion; however, an answer can be to count the materials
and return them into the distribution centre. There are machines to check materials on rolls
automatically. however, this is as yet a physically escalated activity. Every material should be
checked and MRP updated with the amount came back to warehouse. Other generation issues
regularly take need and this action falls behind.

69
There are some famous MRP frameworks that don't permit the arrival of halfway utilized
materials. These frameworks bargain just in a solitary unit amount of materials, for example, 5,000
sections for each whirl of a specific material part number. They have no real way to comprehend
that there are numerous reels in the distribution centre with various amounts of parts on each reel.
To issue a specific number of parts from the distribution centre stock into creation at that point
turns into a troublesome errand of physically assembling the correct reels to make up the issue
amount, which can never truly be accurate. The returned materials are likewise regularly on
feeders. The decision is then to abandon them on the feeders and store them some way or another
in the distribution centre, or, expel the materials from the feeders. Taking the materials of the
feeders again expands waste and taking care of issues, however with the normal expense of a
feeder being about $1,000, the interest in feeders is colossal if the decision is made to store the
stock on the feeder.
Many manufacturing offices accordingly attempt to manage materials as well as can be
expected on the production line, if even physically, with little control of age, taking care of,
allotment or precision. This presents quality issues in addition to collecting stock blunders and
inward material deficiencies. This plainly is additionally not best practice.
3.2.2.3 A regular Stock checks
One approach to reset the incorrectness circumstance is to do a stock check. It essentially
intends to tally the majority of the materials and contrast the outcomes and MRP and apply a
corrective measure. The checking itself takes quite a while particularly with such a large number
of in part utilized on production line. Frequently, fabricating is halted for a couple of days while
stock checks are finished. This is itself a key supporter of lost profitability and furthermore prompts
yet all the more dealing with issues.
The consequence of the MRP correlation with the stock check still incorporates holes since
MRP will exclude materials set on products but still not back-flushed. The outcome of the stock
check practice is quite often a demand to erase the difference in materials count. as observed, this
mean a great many dollars in materials cost every year in a sensibly extensive manufacturing site.
In spite of the fact that to be reasonable, it is likewise normal to discover a few materials they
didn't realize they had.
Production after the stock check is generally great, inner deficiencies are wiped out for
some time, however maybe a couple of work-arranges still can't be kept running since MRP did
not organization the materials accurately before the stock check. Definitely be that as it may, the

70
errors again accrue and the entire cycle repeats. The more regularly the stock check is done, the
better to lessen the in general the quantity of interior material deficiencies but, at the expense of
profitability. This can't be best practice by any stretch of the imagination.
3.2.2.4 Increase the material buffer stock
The majority of the endeavors depicted up to this point to determine the internal parts
shortage problem, have been attempted but the issue remains. Whatever rehearses are presented,
they, best case scenario postpones the unavoidable and absolutely present more expense and waste
in to the activity. The primary concern of the profitability reports is, in many tasks, internal
material issues keep on being the significant reason for efficiency misfortune.
Missing conveyance due dates, seeing profitability decay, the ends quite often boiled down
to one most minimized shared factor – increment the material buffer stock.
The buffer stock is utilized to very liberally increment the measure of stock in the activity
with the end goal that internal material deficiencies can be nearly disposed of between stock
checks. Indeed, even this activity be that as it may, is just viable to purchase time. The hidden issue
of stock mistake is still there, blunders and related expenses ceaselessly amassing. Absolutely not
the best practice.
3.2.2.5 Registration of Material
As a matter of first importance, a material management system ought to almost certainly
deal with each material on a unit premise.
This is finished by marking every transporter (supply structure), for example plate, reel, or
even cylinders or sacks, with an exceptional ID, for example, a standardized identification (see
Figure). Scanning the supplier scanning tag marks with a mistake-proof process as a major aspect
of the MRP booking-in strategy, is the spot to begin. We can guarantee that it is finished with a
base expense. When the individual material units are recognized, we can relate basic material
properties including precisely what the material is, the place it has originated from, use history,
and obviously the genuine live amount. This is altogether put away in an exhaustive live materials
database. With an interface between this database and MRP, MRP would now be able to approach
the genuine use and decay of materials.

71
Figure 22. The key to materials management is automating the fool-proof capture of vendor data from the bar codes on
the reel and posting this information into the material database.
Another suggestion has been made in the previous chapter, use of RFID, which would
eliminate bar code problem.
3.2.2.6 Managing location of storage
The storage place is an important characteristic for the materials. The material management
system should be able to properly identify and help in placing the items in that location. It is
important to make sure that the inventory in system and present physically is same, to do that, a
regular stock check is highly effective, and it assures the availability of stock.
The extremely critical issue however is the capacity to discover explicit materials as
required. Recognizing what amount is on every material unit and precisely where it is found
enables an exact selection of materials to be chosen and conveyed into assembling including
obviously exact control of incomplete utilized reels.
3.2.2.7 Visibility and integration
The advancement of the finish of work-requests can likewise be sent back to ERP, so
further improvement of assets should be possible. The Just-In-Time task and the unique ID of
materials are altogether overseen by the material management framework permitting total visibility
of the whole activity.
MRP can without much of a stretch comprehend what materials are accessible, in the
stockroom, however for the entire activity. Having the virtual stock precise to the physical stock
and connected to MRP implies that stock checks can be disposed of. MRP can work all the more
adequately with no extraordinary manual controls or contributions from the shop-floor. It
additionally implies that the buffer stocks can be decreased.

72
3.2.3 Theoretical techniques to Reduce waste and scrap
There have been many theoretical frameworks developed over time. Mainly from Toyota
in japan, and many others in Japanese industry to increase the efficiency and reduce waste and
scrap. These frameworks are implemented all over the world because of their successful results.
Some of these techniques has been discussed below which, could potentially reduce waste in
production.
3.2.3.1 World Class Manufacturing
World Class Manufacturing is a coordinated assembling framework which controls,
oversees, diminishes, and to at last take out wastes and losses. It is finished with as a consistent
improvement and contribution all things considered and works inside the organization, with an
institutionalized strategies and methodologies.
In light of a propelled ideas or parts of Toyota Production framework, WCM permits the
use of these ideas: Total Industrial Engineering, Total Quality Control, Total Productive
Maintenance and Just-in-Time. WCM is additionally a standout amongst the most critical creation
systems utilized crosswise over Europe. The WCM framework is comprised of ten technical and
ten managerial pillars, showed in figure as a sanctuary. The ten specialized pillars are as per the
following:
1. Safety (Occupational safety)
2. Cost Deployment (Distribution of Costs)
3. Focused Improvement
4. Autonomous Maintenance and Workplace Organization
5. Professional maintenance
6. Quality Control
7. Logistics & Customer Service
8. Early equipment Management
9. People Development
10. Environment (and Energy)
Every technical pillar is implemented in order to authorize everyone within the group to be
able to make savings and to produce insubstantial resources. In other words, increasing

73
independence, control behaviors and advance knowledge at all levels of the company. The ten
managerial pillars are:
1. Management Commitment
2. Clarity of Objectives
3. Route map to WCM
4. Allocation of Highly Qualified People to Model Areas
5. Commitment of the Organization
6. Competence of Organization towards Improvement
7. Time and Budget
8. Level of Detail
9. Level of Expansion
10. Motivation of Operators
Figure 23. WCM Technical and Managerial Pillars
It is understood that to attain and maintain the World Class level of manufacturing, a firm
must develop capable leaders at every level of company. These leaders must be proficient of
accompanying the needs of an ideal production system.

74
3.2.3.2 World Class Manufacturing in FCA
World Class Manufacturing (WCM) is an organized, thorough and integrated production
strategy embraced at FCA plants around the world, which includes the whole company, from
security to environment, preservation, logistics and excellence. It is the establishment of FCA's
fabrication measures and, as a matter of first importance of, their modern culture. The essential
target of WCM is consistent improvement in every aspect of production so as to ensure the nature
of the final product and meet client desires. Activities created under the WCM technique – which
depend on higher level of workers contribution – focus on the end of all types of waste and scraps
with a definitive target of accomplishing zero accidents, zero waste, zero breakdowns and zero
stock.
The objective of WCM is to meet the client desires by drawing in and spurring all
dimensions of company. In spite of the fact that innovation is critical, the interest in individuals is
the main thing to accomplish brilliance inside the production system. The center elements of the
manufacturing framework are illustrated in every one of the technical pillar. The utilization of
every technical pillar engages the groups inside FCA to increase the savings and to develop
immaterial resources. This incorporates expanded self-rule, administration practices and higher
information at all dimensions of the company.
Alternatively, WCM for FCA is a fabrication system where:
1. Safety the basis of everything
2. Customer satisfaction is given the most importance
3. Leaders implement standards in a defined way
4. There is no room for waste and loses
5. Methods are implemented with consistency
6. All irregularities are made evident
7. People involvement is backbone of innovation
3.2.3.3 World class manufacturing logistics and customer service pillar
The main aim of this pillar to develop a scenario which is advantageous for the flow of
material inside the company as well as towards the vendor and customers. The 7th pillar of World
Class Manufacturing contains 3 fundamental subjects in which any losses are methodically
decreased:

75
• Supply Logistics manages the association of data stream and IT frameworks from and to
providers, in look for progressively productive courses and methods for transport, and ideal
organization of materials and warehosue.
• Production Logistics manages arranging and controlling production stream, participation
with manufacturing framework so as to fulfill the necessities of the external and internal
clients. These activities are performed dependent on the production stream, which can
deliver little batches, hence extending the production range and blend, shortening the
planning time, at superb procedures, with satisfactory supply of materials and with solid
inspiration of specialists and low non-attendance factor.
• Distribution Logistics, Distribution Logistics, manages transfer of dispersion focuses of
finished product, techniques for picking transportation, investigation of market request and
setting up a transient deal plan and the executives and control of provisions. Distribution
logistics is a field of sorting out logistic pillar in WCM for this situation, since there is no
different mainstay of client administration and is joined with logistics.
Logistic pillar is intended to satisfy the fundamental 3 undertakings which are synchronizing
manufacturing and deals, presenting flow coherence that decreases distribution center parity and
zone, and diminishing material reposition, stockpiling and storage place. logistic in WCM
framework means to build consumer loyalty's, particularly with supply dates, lessening them if
conceivable and entirely complying with the supply due dates and quality. Additionally, expanding
profitability and adequacy of the framework and work positions by decreasing transfer and over-
capacity, lastly limiting expense of material transportation and utilization of room, hence adding
to general cost decrease.

76
Figure 24. 7 Steps of Logistics and the Objectives (Source: WCM in FCA)
Moving towards the methods and understanding of logistic pillar, that is developed in 7
steps, listed in figure 24. The objective of these steps is to ensure the flow and control.
The formation of the flow can be achieved by controlling the lead time, set up time, revision
of stock size, eradicating needless activities of materials and other logistic wastes. The overall
cleanliness and restructuring of the working atmosphere, along with FIFO, First in First Out,
materials management. The principal argument of this specific step is to describe and create a
detailed flow of each material class. It also intends to decrease the Work In Progress (WIP) and
material management, while adapting to the Work Organization standards and following to the
concept of Minimum Material Handling and the Golden Zone.
The inside Logistic manages arranging and control of material stream inside the limits of
the central organization. It is a standout amongst the most imperative segments inside ventures,
particularly in the substantial production organizations. It oversees, masterminds, plans and
conveys the final product. It is a crucial piece of the inventory network and mirrors the aftereffect
of usage organization procedure. There are seven stages to be done to upgrade/improve the inner
strategic inside a production plant:
1. Problem Identification
2. Material movement examination
3. Choosing the method to adapt
77
4. Object approach
5. Generating ideas to improve
6. Selecting the right idea
7. Standardization and expansion in plant
3.2.3.4 Kaizen
Kaizen is a Japanese word meaning change (kai) for the good (Zen). It is a viewpoint which
helps to guarantee maximum quality, the eradication of waste, and enhancements in efficiency,
both in relations of equipment and work techniques. It encourages continuous improvements in
standardized work and help maximize productivity at every worksite. Standardized work to
achieve regular and incremental improvements.
This theory helps improves the workplace, allowing single members to recognize areas for
improvement and suggest practical solutions. Kaizen initiates in the initial designs of a production
line and continues through its lifespan. It is done by making it the responsibility of each member
to adopt the improved standardized procedure and eliminate waste starting from the local working
environment. It can be seen as a gentler and employee-friendly way to institute the changes that
must occur as a business grows and adapts to its changing environment.
Kaizen points for improvements in output, efficiency, protection, and waste reduction, and
when followed gives a whole lot more in return. Since this approach involves everyone within a
company, when done correctly, people will feel the effect directly, thus giving a personal
satisfaction. Moreover, it will improve worker's commitment as they are the direct participants of
their own job. This type of engagement with everybody also enhanced maintenance level within a
company. Under kaizen, all employees are responsible for identifying the gaps and inadequacies
and everyone, at every level in the company, suggests where improvement can take place. Finally,
it will help to reduce wastes and improve consumer satisfaction

78

79
4 Conclusion
The motivation behind this thesis is to dispose of higher WIP and to apply demand driven
management in manufacturing line. Because of some constraints, the proposition is essentially
focused on indicating what the principle issue is and how profoundly it influences the organization
regarding cost and working capital.
The procedure of the proposition began from seeking after hypothetical examination,
moving towards the company analysis, breaking down of the issue, and lastly proposing
recommendations and suggestions. From the examination of the production line, numerous issues
were discovered which cause the higher WIP and have been explained.
A concise part was composed on technical standards and how they influence the working
capital of organization. The contextual analysis was appeared and new technical standard that
could lessen the working capital of organization has been described.
Lastly, this report will be particularly useful for the workers of organization or any student
working on a similar topic, in which they can get an outline of the issues which causes WIP and
steps to reduce them. So as to proceed with the project, a few proposals are suggested in suggestion
part to continue further with this analysis and study.
A detailed description of my contribution in this study and development in this case will
be highlighted in the following paragraphs.
During the first part of thesis, which was mainly written on technical standards, a tool that
allows to calculate the how much products or goods should be produced and also takes into account
different parameters that impacts the production process. The work began by studying the already
developed technical standards and what are the short comes that could be changed. As was seen
during the process that the parameters which were used were not giving the optimal result and
there was a need to change them in order to reduce the deficit and increase the efficiency.
Previously, a theoretical formula was being used that allows to calculate safety stock by
taking into account the variability and standard deviation by measuring the difference between
previous safety stock and new one, and also by considering service level and procurement lead
time. However, the literature formula was not efficient to give detailed and more accurate result.
After doing many analysis and experiments, a new formula was to calculate the safety stock. I
worked with supply chain department that gave me all the material and information required to
make this process easy. At the end, a formula was developed which takes into account many

80
factors, explained in detail in section 3.1.4, some of them were already developed and the rest was
written during this study in order to get more accurate result. Lastly, when it was confirmed that
this method brings more accurate result, it was used to calculate the required material.
In second part of my thesis, I worked on identifying the main causes that generate negative
work in progress and increase the working capital. During my time in FCA, I have seen that
everything month they calculate how much goods have been scraped and obsolete material and the
money loss it is generating. By identifying the already causes that has been used as the reason for
loss, I worked on this part to get into details of this and reason behind this loss. Some of the reasons
were modified and some were identified. All these reasons and problem have been discussed in
detail in 3.2.1 section. Some of them are described here.
1. A flawed inventory data gathering procedure
2. Ineffective computer system
3. Workers taking a similar substitute to use in production
4. Experienced workers taking identical parts from another order
5. Ineffective bar-code scanning
6. Incorrect amounts from pre-manufacturing
7. Human Errors
8. Papers Containing Bar-Codes Placed One Inside Another
9. Re-sequencing at Pre-Manufacturing
10. Changes in the Composition of Groups and Failure to Update Records
11. Ineffective Quantity Check of Items at Receiving
12. Invisibility of Some Material Categories to Planners and Schedulers
After detailed analysis, a proposal was made to improve and eradicate these problems. I
worked on how we can identify these problems and from which system we can retrieve data in
order to cross check, what type of item is missing and where it can be found. Lastly after this a
new step was taken which would allow how we can eliminate these risks and problems. A proposal
was made with different suggestions that could potentially reduce this impact and eradicate these
problems, in result, decrease the working capital. Due to non-disclosure agreement the final
developed work cannot be shown in the thesis.
To conclude this all, the main objective was to find different methods or techniques that
will reduce the working capital of company and provide way to improve the efficiency of system.

81
As discussed in the previous chapter, a major difference was observed after the implementation of
these studies and in the end, it was useful for company in order to get the profit and reduce the
losses.

82

83
5 Bibliography (Coimbra, 2016)
Agrawal, A., Harhalakis, G., Minis, I., . . . R. (n.d.). Just-in-time production of large assemblies
IIE Transactions. Vol. 28.
Alan, D.S., Felix, & O. (n.d.). Information management of automatic data capture: an overview of
technical developments. Information Management and Computer Security. Vol. 10 No.3.
Anderson, & C. (2004). The long tail. Wired Magazine, Issue 12.10. ConděNet Inc.
Anderson, M.G., K., & P.B. (1998). Strategic Sourcing, International Journal of Logistics
Management.
Arnold, J. R. T., & Chapman. (2004). Introduction to Materials Management. Pearson Prentice
Hall. Upper Saddle River. S.N.
Arnold, Tony, J. R., Chapman, S. N., & Clive, L. M. (2007). Introduction to Materials
Management.
Arshinder, Kanda, A., & Deshmukh, S. G. (2008). Supply Chain Coordination: Perspectives,
Empirical Studies and Research Directions. International Journal of Production
Economics 115.
Back, P. (1988). Corporate cash management. Cambridge, England: Woodhead-Faulkner Ltd.
Backes, & R. W. (1980). Cycle Counting – A Better Method for Achieving Accurate Inventory
Records. Production and Inventory Management. Vol. 21.
Baños-Caballero, S., García, T. P., & Martínez, S. P. (2010). Working Capital Management in
SMEs.
Benrqya, Yassine, Estampe, D., Vallespir, B., & Babai, M. Z. (2004). Impact of Product
Characteristics on Distribution Strategy Selection. Supply Chain Forum: International
Journal 15, 38–50.
Bernard, & A., P. (1985). Cycle counting: The missing link. Production and Inventory
Management. Vol. 26.
Bernard, & P. (1999). Integrated Inventory Management. New York: John Wiley and Sons.
Bigelow, S, L., & Argyres, N. (2008). Transaction Costs , Industry Experience and Make-or-Buy
Decisions in the Population of Early U . S . Auto Firms.
Bowersox, J., D., Closs, D. J., & Cooper, a. M. (2002). In Supply Chain Logistics Management.
McGraw-Hill.
84
Brooks, B., R., Wilson, & W., L. (n.d.). Inventory Record Accuracy: Unleashing the Power of
Cycle Counting. Oliver Wight Publications. Essex Junction.
Brown, K.L., Inman, R.A., & Calloway. (2001). Measuring the effects of inventory inaccuracy in
MRP inventory and delivery performance. Production Planning & Control. J.A.
Brynzér, H, & Johansson. (1996). Storage Location Assignment: Using the Product Structure to
Reduce Order Picking Times. International Journal of Production Economics. Vol. 46-47.,
595-603.
Brynzér, H., & Johansson. (1994). A Methodology for Evaluation of Order Picking Systems as a
Base for System Design and Managerial Decisions. International Journal of Operations
and Production Management., 126- 139.
Brynzér, H., & Johansson. (1995). Design and Performance of Kitting and Order Picking Systems.
International Journal of Production Economics. Vol. 41. M.I.
Bullard, P.D., Resnik, & A.J. (1983). Too many hands in the corporate cookie jar. Sloan
Management Review.
Chung-Hsing, & Y. (2000). A customer-focused planning approach to make-to-order production.
Industrial Management &Data Systems. Vol. 100.
Coimbra. (2016). Total Flow Management: Achieving Excellence with Kaizen and Lean Supply
Chain. s.l.:s.n.
Donald, B. J., & David, C. J. (1996). Logistics Management.
DouglaS, M. L., James, R. S., & Lisa, M. E. (1998). Fundamentals of Logistics management.
Edelman, & P., M. (1984). Cycle counting for distribution inventories. Readings in Production and
Inventory Control and Planning APICS.
Emery, G.W., Margues, & M.A. (2011). The effect of transactions costs, payment terms and power
on the level of raw materials inventories. Journal of Operations Management, 236-249.
Engle, & P. (2006). When Inventory Goes Missing. Industrial Engineer. Vol. 38.
Fleisch, E., Tellkamp, & C. (2005). Inventory inaccuracy and supply chain performance: a
simulation study of a retail supply chain. International Journal of Production Economics.
Vol. 95, 373–385.
Flores, E., B., Whybark, & C., D. (1986). Multiple Criteria ABC Analysis. International Journal
of Operations and Production Management, 36-46.
Fogarty, W., D., Blackstone, H., J., Hoffmann, & R., T. (1991). Production & Inventory
Management, 2nd Edition. Cincinnati: South-Western Publishing Co.

85
G, S. (n.d.). Integrating the Supply Chain, International Journal of Physical Distribution and
Materials Management.
Gentry, J.A, Vaidyanathan, R., Lee, & H. W. (2001). Working capital management in the value
chain of automotive industry. Lind, L.
James, R. S., & Douglas, M. L. (2001). Strategic Logistics Management 4edn.
Johnson, J. C., WOOD, D. F., DANIEL, L., Wardlow, & Paul , R. M. (1998). Contemporary
Logistics.
5.1 Articles from Web
• Vorne, 2011-2018. Kaizen. [Online]
Available at: https://www.leanproduction.com/kaizen.html [Accessed 2018].
• Toyota (GB) PLC, n.d. Kaizen – Toyota Production System Guide. [Online] Available at:
http://blog.toyota.co.uk/kaizen-toyota-production-system [Accessed 2018].
• Lappeenranta University of Technology. Department of Industrial Management. Master´s
Thesis.
• Mind Tools Content Team, 2016. Kaizen. [Online]
Available at: https://www.mindtools.com/pages/article/newSTR_97.htm [Accessed 2018].
• Available at: https://www.logisticaefficiente.it/qualitas/supplychain/produzione/3-kpi-
indispensabili-corretto-monitoraggio-della-produzione.html
[Accessed 2018].
• Ivanov, B., 2014. Cycle Time as Normal (Gaussian) Distribution. [Online]
Available at: https://kanbanize.com/blog/normal-gaussian-distribution-over-cycle-time/
[Accessed May 2018].
•
• Lukkari, E. 2011.Working Capital Management: A Bibliometric study. Lappeenranta
University of Technology. Department of Industrial Management. Master’s thesis.
• https://www.fcagroup.com/enUS/group/governance/FiatDocuments/New_Guidelines/FC
A_Logistics_Guidelines_2018.pdf
• FCA, 2017. FCA's Logistic and Customer Service Guide, s.l.: s.n.

86
• Ivanov, B., 2014. Cycle Time as Normal (Gaussian) Distribution. [Online] Available at:
https://kanbanize.com/blog/normal-gaussian-distribution-over-cycle-time/
• https://www.logisticaefficiente.it/qualitas/supplychain/produzione/3-kpiindispensabili-
corretto-monitoraggio-della-produzione.html
• European Automobile Manufacturers Association - ACEA. 2016. “Economic and Market
Report.” EU Automotive Industry, no. March:26.
http://www.americanautocouncil.org/sites/default/files/2015-AAPC-Economic-
Contribution-Report(FINAL).pdf.
• European Automobile Manufacturers Association - ACEA. 2016. “Economic and Market
Report.” EU Automotive Industry, no. March:26.
http://www.americanautocouncil.org/sites/default/files/2015-AAPC-Economic-
Contribution-Report(FINAL).pdf.
• European Automobile Manufacturers Association - ACEA. 2016. “Economic and Market
Report.” EU Automotive Industry, no. March:26.
http://www.americanautocouncil.org/sites/default/files/2015-AAPC-Economic-
Contribution-Report(FINAL).pdf.
5.2 Websites for Data Collection
• https://www.fcagroup.com/en-US/group/history/Pages/default.aspx
• https://www.statista.com/statistics/275520/ranking-of-car-manufacturers-based-on-
global-sales/http://www.carsitaly.net/
• http://www.autoevolution.com/fiat/
• http://fiatgroupworld.com/
• https://www.vda.de/en/topics/automotive-industry-and-markets.html
• Fiat Chrysler Automobiles worldwide sales Source: www.fiatspa.com
• www.researchgate.com
• FIAT Cars and Brand History
• Fiat Chrysler Automobiles worldwide sales Source: fiatspa.com
• https://www2.deloitte.com/ca/en/pages/finance/articles/strategies-to-optimize-inventory-
management.html

87
• FCA, 2017. FCA's Logistic and Customer Service Guide, s.l.: s.n.
• Global Automotive Report 2017