
Collateral pricing$ Journal of Financial Economics ARTICLE IN ...
22
Collateral pricing $ Efraim Benmelech a,c , Nittai K. Bergman b,c, a Department of Economics, Harvard University, Littauer Center, Cambridge, MA 02138, USA b Sloan School of Management, MIT, 50 Memorial Drive, Cambridge, MA 02142, USA c NBER, USA article info Article history: Received 15 March 2007 Received in revised form 18 February 2008 Accepted 3 March 2008 Available online 30 November 2008 JEL classification: G24 G32 G33 Keywords: Collateral Redeployability Liquidation Collateralized debt obligations Airlines abstract We examine how collateral affects the cost of debt capital. Using a novel data set of secured debt issued by U.S. airlines, we construct industry-specific measures of collateral redeployability. We show that debt tranches that are secured by more redeployable collateral exhibit lower credit spreads, higher credit ratings, and higher loan-to-value ratios—an effect which our estimates show to be economically sizeable. Our results suggest that the ability to pledge collateral, and in particular redeployable collateral, lowers the cost of external financing and increases debt capacity. & 2008 Elsevier B.V. All rights reserved. 1. Introduction Collateral is of central importance in the theory and practice of corporate finance. In particular, collateral allows the creditor to recover, at least partially, a loan made to a debtor. The ability to seize and sell collateral when a debtor fails to make a promised payment reduces the creditor’s expected losses upon default. All else equal, therefore, if a firm pledges collateral when issuing bonds or taking a loan, the price at which it obtains credit should be lower. There is an extensive theoretical literature showing that collateral can be used to alleviate financial frictions stemming from moral hazard and adverse selection effects (Aghion and Bolton, 1992; Johnson and Stulz, 1985; Hart and Moore, 1994, 1998; Hart, 1995). The presence of collateral in a loan, therefore, may be correlated with unobserved firm characteristics which have a first order impact on loan rates. For example, previous theories focusing on moral hazard argue that firms with greater default risk pledge collateral as a mechanism to increase pledgeable income (see, e.g., Berger and Udell, 1990; Eisfeldt and Rampini, 2009; Rampini and Viswanathan, 2008; Tirole, 2005). Consistent with these theories, empirical evidence shows that creditors require firms with poor repayment histories or firms with greater default risk to secure their loans with collateral (see, e.g., Hester, 1979; Berger and Udell, 1995; Jimenez, Salas, and Saurina, 2006). The selection effect, in which riskier firms are more likely to be required to pledge collateral, makes it difficult to analyze the impact of collateral on loan rates by Contents lists available at ScienceDirect journal homepage: www.elsevier.com/locate/jfec Journal of Financial Economics ARTICLE IN PRESS 0304-405X/$ - see front matter & 2008 Elsevier B.V. All rights reserved. doi:10.1016/j.jfineco.2008.03.003 $ We thank Paul Asquith, George Baker, Amiyatosh Purnanandam, Adriano Rampini, Jeremy Stein, Amir Sufi, seminar participants at the 2008 AFA meetings in New Orleans, Harvard University, University of Illinois, and the University of Michigan’s 15th Mitsui Life Symposium and an anonymous referee for very constructive and helpful comments. We also thank Robert Grundy and Phil Shewring from Airclaims Inc. Alex Bayers provided excellent research assistance. All errors are our own. Corresponding author. E-mail addresses: effi[email protected] (E. Benmelech), [email protected] (N.K. Bergman). Journal of Financial Economics 91 (2009) 339–360
Transcript of Collateral pricing$ Journal of Financial Economics ARTICLE IN ...

ARTICLE IN PRESS
Contents lists available at ScienceDirect
Journal of Financial Economics
Journal of Financial Economics 91 (2009) 339–360
0304-40
doi:10.1
$ We
Adriano
2008 A
Illinois,
an anon
also tha
Bayers� Cor
E-m
nbergm
journal homepage: www.elsevier.com/locate/jfec
Collateral pricing$
Efraim Benmelech a,c, Nittai K. Bergman b,c,�
a Department of Economics, Harvard University, Littauer Center, Cambridge, MA 02138, USAb Sloan School of Management, MIT, 50 Memorial Drive, Cambridge, MA 02142, USAc NBER, USA
a r t i c l e i n f o
Article history:
Received 15 March 2007
Received in revised form
18 February 2008
Accepted 3 March 2008Available online 30 November 2008
JEL classification:
G24
G32
G33
Keywords:
Collateral
Redeployability
Liquidation
Collateralized debt obligations
Airlines
5X/$ - see front matter & 2008 Elsevier B.V.
016/j.jfineco.2008.03.003
thank Paul Asquith, George Baker, Amiyat
Rampini, Jeremy Stein, Amir Sufi, seminar
FA meetings in New Orleans, Harvard Unive
and the University of Michigan’s 15th Mitsui L
ymous referee for very constructive and help
nk Robert Grundy and Phil Shewring from
provided excellent research assistance. All err
responding author.
ail addresses: [email protected] (E
[email protected] (N.K. Bergman).
a b s t r a c t
We examine how collateral affects the cost of debt capital. Using a novel data set of
secured debt issued by U.S. airlines, we construct industry-specific measures of
collateral redeployability. We show that debt tranches that are secured by more
redeployable collateral exhibit lower credit spreads, higher credit ratings, and higher
loan-to-value ratios—an effect which our estimates show to be economically sizeable.
Our results suggest that the ability to pledge collateral, and in particular redeployable
collateral, lowers the cost of external financing and increases debt capacity.
& 2008 Elsevier B.V. All rights reserved.
1. Introduction
Collateral is of central importance in the theory andpractice of corporate finance. In particular, collateralallows the creditor to recover, at least partially, a loanmade to a debtor. The ability to seize and sell collateralwhen a debtor fails to make a promised payment reducesthe creditor’s expected losses upon default. All else equal,therefore, if a firm pledges collateral when issuing bondsor taking a loan, the price at which it obtains credit shouldbe lower.
All rights reserved.
osh Purnanandam,
participants at the
rsity, University of
ife Symposium and
ful comments. We
Airclaims Inc. Alex
ors are our own.
. Benmelech),
There is an extensive theoretical literature showingthat collateral can be used to alleviate financial frictionsstemming from moral hazard and adverse selection effects(Aghion and Bolton, 1992; Johnson and Stulz, 1985; Hartand Moore, 1994, 1998; Hart, 1995). The presence ofcollateral in a loan, therefore, may be correlated withunobserved firm characteristics which have a first orderimpact on loan rates. For example, previous theoriesfocusing on moral hazard argue that firms with greaterdefault risk pledge collateral as a mechanism to increasepledgeable income (see, e.g., Berger and Udell, 1990;Eisfeldt and Rampini, 2009; Rampini and Viswanathan,2008; Tirole, 2005). Consistent with these theories,empirical evidence shows that creditors require firmswith poor repayment histories or firms with greaterdefault risk to secure their loans with collateral (see,e.g., Hester, 1979; Berger and Udell, 1995; Jimenez, Salas,and Saurina, 2006).
The selection effect, in which riskier firms are morelikely to be required to pledge collateral, makes it difficultto analyze the impact of collateral on loan rates by

ARTICLE IN PRESS
E. Benmelech, N.K. Bergman / Journal of Financial Economics 91 (2009) 339–360340
examining the extensive margin of collateral use—i.e.,whether a loan has collateral or not. Indeed, a number ofpast studies find a positive relation between loan rates andthe existence of collateral, consistent with a moral hazardinduced selection effect in which collateral is required ofhigh default-risk firms (see, e.g., Berger and Udell, 1990;John, Lynch, and Puri, 2003; Knox, 2005). Testing theeffect of collateral on loan rates by analyzing its extensivemargin suffers, therefore, from endogeneity and selectionbias.
In this paper, we study collateral pricing by examiningthe intensive margin of collateral use—i.e., variation in thevalue of collateral to lenders. Using a novel data set ofsecured debt tranches issued by U.S. airlines, we constructmeasures of collateral redeployability as a proxy forcreditors’ expected value of collateral upon default. Weshow that asset redeployability is negatively related tocredit spreads, and positively related to credit ratings andloan-to-value ratios in an economically significant man-ner. Thus, focusing on a particular industry and examiningthe intensive, rather than the extensive, margin ofcollateral values reveals a negative impact of collateralon the price and amount of debt, and enables us toestimate the magnitude of this effect.
Airlines in the U.S. issue tranches of collateralized debtobligations (CDOs) which take a variety of formats knownas equipment trust certificates (ETCs), enhanced equip-ment trust certificates (EETCs), and pass through certifi-cates (PTCs). Pledging aircraft from an airline’s fleet ascollateral, these debt instruments served as the mainsource of external financing for U.S. airlines during the1994–2005 period. We construct a sample of aircrafttranche issues from SDC Platinum and then use filingprospectuses to obtain the serial number of all aircraftthat were pledged as collateral. Matching aircraft serialnumbers to the Ascend CASE airline database—a databasecontaining information on all commercial aircraft world-wide—we obtain detailed information about aircraftcharacteristics such as aircraft type, engines, noise level,and age. As a result, for each of the debt tranches in oursample we can identify precisely its underlying collateral.
Using the Ascend CASE database, we also constructmeasures of aircraft redeployability to proxy for theexpected value of collateral to creditors upon default.Our proxies for aircraft redeployability are motivated byShleifer and Vishny’s (1992) industry equilibrium model.We use three measures of aircraft redeployability: (1) thenumber of aircraft per type; (2) the number of operatorsper type; and (3) the number of operators who operate atleast five aircraft per type. Our measures of aircraftredeployability are proxies for the ease at which creditorswill be able to liquidate their positions, and hence capturethe value to creditors of the collateral backing eachsecured tranche. We then examine the relation betweenour measures of collateral redeployability and creditspreads controlling for airline and tranche characteristics.
One concern about the effect of collateral values oncredit spreads is a selection effect along the intensivemargin similar in spirit to that shown in previousliterature. If higher default-risk firms are required notonly to pledge collateral, but also to pledge collateral of
greater redeployability, increases in our redeployabilitymeasures would, in part, proxy for increases in airlinedefault risk. We test for selection in collateral quality byregressing our redeployability measures on proxies forairline risk, and find that they are not correlated withaircraft redeployability. Thus, a selection bias in whichhigher default-risk firms are required to pledge collateralof greater redeployability is not supported by the data.
Using our proxies for aircraft redeployability, we findthat more redeployable collateral is associated with lowercredit spreads. After controlling for tranche and airlinecharacteristics and both year and airline fixed effects, anincrease from the 25th percentile to the 75th percentile inour redeployability measures is associated with a decreasein the spread that is between 58.0 and 64.2 basis points,representing a decrease of between 29.2 and 32.3percentage points relative to the mean spread. In inter-preting the magnitude of our results, it is important tonote that we are estimating the effect of collateralredeployability on spreads at the time of the credit issue.The value of collateral is, therefore, priced based on theexpected probability of liquidation value calculated as ofthe issue date. Hence, to the extent that a firm’s financialposition deteriorates and liquidation probabilities in-crease post issue—a description accurate for many of theairlines in our sample—we are underestimating theaverage life-time impact of collateral on credit spreads.Moreover, we provide qualified support for the hypothesisthat the ability to pledge redeployable collateral is morevaluable during industry downturns.
Next, we analyze the relation between the redeploy-ability of collateral and credit ratings, loan-to-value ratios,and tranche maturity. We find that more redeployablecollateral is associated with better credit ratings andhigher loan-to-value ratios. We do not find a statisticallysignificant relation between collateral redeployability andtranche maturity. Our results provide insight into the rolethat asset redeployability plays in the determination ofcredit spreads, credit ratings, and debt capacity of secureddebt, and in particular of CDOs.
The rest of the paper is organized as follows. Section 2provides the theoretical framework for the analysis.Section 3 provides the institutional details on the marketfor ETCs and enhanced equipment trust certificates.Section 4 describes our data and the aircraft redeploy-ability measures. Section 5 presents the empirical analysisof the relation between collateral redeployability anddifferent facets of CDOs. Section 6 concludes.
2. Collateral and debt financing—implications for theairline industry
Most of the theory on the role of collateral in securedlending has focused either on situations where borrowersexhibit moral hazard or on situations of adverse selection,with borrowers enjoying private information about pro-ject quality. The nature of the financial friction in thesemodels yields differential theoretical predictions. Whenthe financial friction is one of adverse selection andasymmetric information, high quality firms are predicted

ARTICLE IN PRESS
E. Benmelech, N.K. Bergman / Journal of Financial Economics 91 (2009) 339–360 341
to employ collateral when borrowing, while firms of lowquality are predicted to borrow using unsecured debt. Forexample, in Bester (1985), lenders offer different loancontracts with variable collateral requirements where theinterest rate is decreasing in the value of the collateral.The optimal contract in Bester (1985) is such that riskyborrowers pay a high interest rate but are not required toput down any collateral, while safer borrowers put downsome collateral and pay a lower interest rate. Collateral isthus used as a signaling device by high quality borrowersto differentiate themselves from low quality ones. Suchsignaling is made possible because higher quality firmsfind it less costly to pledge collateral, since the probabilityof them defaulting and losing their collateral is smaller.Similarly, Besanko and Thakor (1987a, b), Chan andKanatas (1985), and Chan and Thakor (1987) all analyzethe role of collateral in the presence of informationasymmetry and deliver similar predictions to those inBester (1985) that lower-risk borrowers pledge morecollateral.
In contrast to the predictions relying on adverseselection and hidden information, models that are basedon moral hazard predict that lower quality firms arerequired to use collateral when raising capital, whilehigher quality firms are able to borrow without it (see,e.g., Berger and Udell, 1990; Boot, Thakor, and Udell, 1991).In essence, collateral is used to increase borrowers’pledgeable income and hence, helps in obtaining externalfinance and reducing its price (see, e.g., Tirole, 2005; Qianand Strahan, 2007).
According to John, Lynch, and Puri (2003) and Tirole(2005) the empirical evidence suggests that, consistentwith the moral hazard models, low quality borrowers arethose more likely to post collateral (see, e.g., Berger andUdell, 1990; Booth, 1992). For example, Hester (1979) findsthat bank analysts classified loans with collateral to beriskier, while Jimenez, Salas, and Saurina (2006) find thatcreditors often require firms with poor repaymenthistories or firms which, ex post, were more likely todefault, to pledge collateral. Furthermore, Harhoff andKorting (1998) find that the use of collateral is more likelyamong firms which are in financial distress at the time ofthe loan issue. These results explain the empirical findingof a positive relation between the use of collateral anddebt yields (Berger and Udell, 1990, 1995). The selectioneffect, whereby low quality firms are required to postcollateral, leads to a positive bias in estimates of the effectof collateral on the price of loans. John, Lynch, and Puri(2003) also find that the yield on collateralized debt ishigher than on unsecured debt after controlling for creditrating.1 Their results are interesting given that theycontrol for the borrower risk in their regressions. Toexplain these results John, Lynch, and Puri (2003) developa model that shows that agency problems affect the valueof collateralized assets, so that if credit ratings fail to fullyreflect the impact of agency problems on credit quality,
1 Likewise, Knox (2005) finds that the effects of collateral on a firm’s
cost of capital is positive, after controlling for borrower characteristics.
then secured debt will have higher yields than unsecureddebt controlling for credit rating.
Collateral redeployability plays an important role inalleviating moral hazard problems and increasing pledge-able income. In particular, more redeployable collateral—i.e., comprised of assets that have better alternativeuses—helps in reducing the costs of external financebecause assets can be sold for a higher price in the eventof default (Tirole, 2005). However, since an increase in theliquidation value of an asset may also raise the optimaldebt level, the net effect of liquidation value on promiseddebt yields is analytically ambiguous. Harris and Raviv(1990) show in numeric results that, controlling for thedebt level of the firm, higher liquidation values areassociated with lower promised yields, since creditorscan expect a higher payment in the case of default.
The airline industry is a natural candidate for analyzingthe relation between collateral and debt financing. Duringthe period 1990–2005, secured debt became the primarysource for external finance of aircraft by airlines in theU.S.2 Since secured debt is used by virtually all airlines inthe U.S., risk-based selection is less likely to explaincollateral use in the airline industry. Moreover, our samplerepresents secured debt issues by large publicly tradedairlines that include the 10 largest scheduled passengercarriers in the U.S. (out of which five are among the 10largest passenger carriers in the world as of 2005), as wellas the largest air courier company in the world (FedEx).During our sample period 1990–2005, the airlines in oursample account on average for 97.2% of the book value ofall publicly traded airlines in the U.S. airline industry. Weargue that given their scale and publicity, concerns aboutasymmetric information and adverse selection are notlikely to play a major role. Finally, as shown below, bydevising asset-specific measures of collateral character-istics in the airline industry and using them to analyze theintensive, rather than extensive, margin of collateral use,we alleviate the standard selection bias that imposes apositive relation between collateral and loan rates.
Another advantage of using airline debt tranches is thatthey are typically bankruptcy-remote and subject toSection 1110 of the Bankruptcy Code. Bankruptcy remote-ness and Section 1110 insulate creditors from the bank-ruptcy of the issuing airline by relieving creditors fromautomatic stay provisions, allowing them to seize andforeclose collateral. These special features of secured debtin the airline industry reinforce the importance ofcollateral value for debt financing.
The following two predictions emerge from therelation between the cost of borrowing and the liquida-tion value of the collateral in studying the intensivemargin of collateral in tranches of secured debt issued byairlines.
Prediction 1. Credit spreads decrease in collateral liqui-dation values, all else equal.
2 According to Morrell (2001), as of 2000, secured debt accounts for
20% of aircraft finance, while equity and unsecured debt account for
about 15%.

ARTICLE IN PRESS
E. Benmelech, N.K. Bergman / Journal of Financial Economics 91 (2009) 339–360342
Prediction 2. Tranche credit ratings improve in collateralliquidation values, all else equal.
The value of collateral affects other facets of debtcontracts in addition to credit spreads. Both the transac-tions cost approach and the incomplete contracts ap-proach emphasize the role that collateral value plays infinancial contracting. The next two predictions about debtcapacity and debt maturity follow from this literature.According to Williamson (1988), Shleifer and Vishny(1992), Harris and Raviv (1990), and Hart and Moore(1994), the total debt capacity the lender is willing tosupply is increasing in collateral redeployability. Wetherefore have:
Prediction 3. Loan-to-value ratios increase in collateralliquidation values, all else equal.
Moreover, Hart and Moore (1994) show that assetredeployability increases the durability of the asset andserves as better collateral for long-term debt. Similarly,Berglof and von Thadden (1994) predict that firms withfungible assets should be financed with long-term debt.3
Thus, Prediction 4 states that:
Prediction 4. Tranche maturity increases in collateralliquidation values, all else equal.
Both Predictions 3 and 4 stem from the ‘bargainingapproach’ to financial contracting.4 The driving force inthis approach is the right to foreclose on the debtor’sassets in the case of default. If the debtor fails to make apromised repayment, the creditor can seize his assets andliquidate the assets for their market value. The threat toliquidate thus induces the debtor to repay. It is theliquidation value of the assets, therefore, that determinesthe allocation of bargaining power between the creditorand the debtor and the credibility of the liquidation threat.While in this paper we focus on implications of collateralredeployability to ex ante tranche characteristics, airlinesoften renegotiate the terms of the tranches ex post. Forexample, Benmelech and Bergman (2008) provide evi-dence that airlines can successfully renegotiate their leaseobligations downward when their financial position issufficiently poor and when the liquidation value of theirfleet is poor. Thus, while asset redeployability is importantfor the initial contract, it may also affect the ex postdetermination of contract renegotiation.5
Before presenting our empirical analysis, we describethe airline secured debt market in the next section.
3. The airline ETC market
3.1. Historical development
ETCs first evolved during the 19th century in theAmerican railroad industry by using railroad rolling stock
3 See Benmelech (2009) for a discussion of the relation between
liquidation values and debt maturity.4 See Hart (1995) for a survey of the literature.5 Of course, the threat of contract renegotiation also feeds into ex
ante debt contract terms, such as debt pricing.
as collateral.6 Unlike mortgage liens, the legal title for therolling stock underlying ETCs was vested with a trusteerather than the railroad. The trustee would lease therolling stock back to the railroad while selling the ETCs toinvestors, using the lease payments to pay principal andinterest on the certificates. The railroad did not own theequipment until the certificates were fully repaid, and ifthe railroad defaulted, the trustee could easily forecloseand repossess the rolling stock as the holder of the legaltitle.
The first form of ETCs dates back to the financing ofseveral locomotives of the Baltimore and SusquehannaRailroad in 1839. In 1890, the total dollar value ofequipment certificates of all steam railways in the U.S.was $49.0 million representing 1.11% of total funded debtby railroads. In 1924 the total dollar value of equipmentcertificates of all steam railways in the U.S. was $1,057.0million representing 8.55% of total funded debt byrailroads (Street, 1959). By 1955, equipment certificatesaccounted for 26.01% of total debt in the railroad industrywith a total value of $2,589.0 million.
Airline ETC financing developed from the railroadequipment certificates. According to Littlejohns andMcGairl (1998), the Bankruptcy Code began to treataircraft financing favorably in 1957, but it was not until1979 that Congress amended the Bankruptcy Code andintroduced Section 1110 protection which provides cred-itors relief from the automatic stay. On October 22, 1994,the Bankruptcy Code was amended, and the rights ofcreditors under Section 1110 were strengthened.7 Thechanges in the Bankruptcy Code increased the protectionthat Section 1110 provided to secured creditors andreduced the potential threat of legal challenge to securedaircraft.
This legal innovation affected the practice of securedlending in the airline industry. The market for ETCsexpanded and new financial innovations such as enhancedequipment trust certificates (EETCs) soon became theleading source of external financing of aircraft. Theammendments to Section 1110 led Moody’s to revise itsratings criteria such that securities that were issued afterthe enactment date received a rating up to two notchesabove issuing airlines’ senior unsecured rating.
3.2. ETC and EETCs
In a traditional ETC a trustee issues ETCs to investorsand uses the proceeds to buy the aircraft which is thenleased to the airline. The collateral of ETCs typicallyinclude only one or two aircraft. For example, on August24, 1990, American Airlines issued an ETC (1990 Equip-ment Trust Certificates, Series P) with a final maturity onMarch 4, 2014. The certificates were issued to financeapproximately 77% of the equipment cost of one Boeing757-223 (serial number 24,583) passenger aircraft, includ-ing engines (Rolls-Royce RB211-535E4B). The proceeds
6 This section draws heavily from Littlejohns and McGairl (1998) and
Morrell (2001).7 See Littlejohns and McGairl (1998, pp. 72–73).

ARTICLE IN PRESS
E. Benmelech, N.K. Bergman / Journal of Financial Economics 91 (2009) 339–360 343
from the ETC issue were $35.5 million, with a serialinterest rate of 10.36% and a credit rating of A (S&P) and A1(Moody’s).
Economies of scale in issuance costs led airlines withlarge financing needs to the development of PTCs, whichpool a number of ETCs into a single security that is backedby a pool of aircraft rather than one. The added security inthe form of diversification over a pool of aircraft led to asubstantial number of PTC issues in the early 1990s.However, the poor earnings of airlines during the 1990sled to downgrades of many ETCs and PTCs to belowinvestment grade, and subsequently to a narrowedinvestor base and poor liquidity. The next developmentwas a modified version of the ETC—the enhancedequipment trust certificate. EETC securitization enhancesthe creditworthiness of traditional ETCs as follows. First,the issuer of the EETC is bankruptcy-remote. Second,EETCs typically have several tranches with differentseniority. Third, a liquidity facility ensures the continuedpayment of interest on the certificates for a predeter-mined period following a default. The basic structure of anEETC contains several tranches of senior, mezzanine, andsubordinated certificates, with different loan-to-valueratios, cross-collateralization of aircraft, ratings, andmaturities.
Table 1 presents the characteristics of three EETCissues that are in our sample. There are three tranches ineach of the EETCs in Table 1. For each tranche we reportthe issue size (in $ millions), yield, spreads (in basispoints), final maturity date, Moody’s and S&P tranche-specific credit rating, cumulative loan-to-value, andcollateral description. Cumulative loan-to-value is definedas the ratio between the sum of the principal amount ofthat tranche and all tranches senior to it, divided by anappraisal of the value of the assets serving as collateral.For example, the cumulative loan-to-value ratio of tranche1-B of the FedEx 1998-1 issue, which is a mezzanine
Table 1Selected EETC transactions.
This table displays the characteristics of three EETC issues by FedEx, Northw
tranche (presented by seniority). Issue size is the dollar value (in $ millions) of t
credit spread (in basis points) over its corresponding treasury yield. Maturity is
S&P tranche rating are the ratings of the tranche assigned by either Moody’s or S
between the sum of the principal amount of that tranche and all tranches se
collateral. Collateral provides a description of the aircraft serving as tranche co
Issue Yield Spread
EETC Tranche size (%) (bp) Maturity
FedEx 1998-1 1-A 458.1 6.720 125 1/2022
FedEx 1998-1 1-B 178.6 6.845 138 1/2019
FedEx 1998-1 1-C 196.8 7.020 155 1/2016
NWA 1999-3 G 150.2 7.935 170 6/2019
NWA 1999-3 B 58.6 9.485 325 6/2015
NWA 1999-3 C 30.5 9.152 300 6/2010
Delta 2002-1 G-1 586.9 6.718 153 1/2023
Delta 2002-1 G-2 370.3 6.417 123 7/2012
Delta 2002-1 C 168.7 7.779 325 1/2012
tranche, includes the sum of the loans of both the seniortranche (1-A) and the mezzanine tranche (1-B). Likewise,the cumulative loan-to-value ratio of tranche 1-C of theFedEx 1998-1 issue (0.688), which is a subordinatedtranche, includes the sum of the loan amounts of thesenior tranche (1-A), the mezzanine tranche (1-B), and thesubordinated tranche (1-C).
In the first EETC in the table (FedEx 1998-1), the mostsenior tranche (1-A) has a credit rating of Aa2/AAA, acumulative loan-to-value ratio of 38.7%, and a creditspread of 125 basis points over the correspondingtreasury. The least senior tranche in the FedEx 1998-1issue (1-C) has a lower credit rating ððBaa1/BBBþÞ, ahigher cumulative loan-to-value ratio (68.8%), and a creditspread of 155 basis points. All three tranches of FedEx1998-1 are secured by the same pool of assets—fiveMcDonnell Douglas MD-11F and eight Airbus A300F4-605R. Similarly, the most senior tranche (G) in the secondEETC in the table (NWA 1999-3) has a credit rating ofAaa/AAA, a cumulative loan-to-value ratio of 44.1%, and acredit spread of 170 basis points, while the mezzaninetranche in the NWA 1999-3 issue (B) has a lower creditrating (Baa2/BBB), a higher cumulative loan-to-value ratio(61.4%), and a credit spread of 325 basis points. As before,all the three tranches of NWA 1999-3 are secured by thesame pool of aircraft—14 BAE Avro RJ85. Finally, the thirdEETC in Table 1 has two senior tranches (G-1 and G-2) andone junior tranche (C). The three tranches of Delta 2002-1sum-up together to $1,125.9 million, and are secured by32 Boeing aircraft, consisting of 17 Boeing 737-832aircraft, one Boeing 757-232 aircraft, eight Boeing767-332ER aircraft, and six Boeing 767-432ER aircraft.
4. Data and summary statistics
This section describes our data, and provides summarystatistics on airline characteristics, tranche characteristics,
est Airlines, and Delta Airlines. Tranche is the name of each individual
he tranche. Yield is the yield of the tranche at the time of issue. Spread is
the number of years until the final payment. Moody’s tranche rating and
&P. LTV is the tranche cumulative loan-to-value ratio defined as the ratio
nior to it, divided by an appraisal of the value of the assets serving as
llateral.
Moody’s S&P
rating rating LTV Collateral
Aa2 AAA 0.387 5 MD-11F 8 A300F4-605R
A1 AA� 0.532 5 MD-11F 8 A300F4-605R
Baa1 BBB+ 0.688 5 MD-11F 8 A300F4-605R
Aaa AAA 0.441 14 BAE Avro RJ85
Baa2 BBB 0.614 14 BAE Avro RJ85
Baa3 BBB� 0.691 14 BAE Avro RJ85
Aaa AAA 0.519 17 B737-832 1 B757-232
8 B767-332ER 6 B767-432ER
Aaa AAA 0.519 17 B737-832 1 B757-232
8 B767-332ER 6 B767-432ER
Baa2 A� 0.611 17 B737-832 1 B757-232
8 B767-332ER 6 B767-432ER

ARTICLE IN PRESS
Table 2Equipment trust certificates issuance.
This table displays the distribution of nominal values of 246 equipment trust certificates (ETCs), pass-through certificates (PTCs), and enhanced
equipment trust certificates (EETCs) that were issued in the U.S. public markets between 1990 and 2005 and are included in our sample. Number of issues
per airline are provided in parentheses for different sample periods.
Airline 1990–1993 1994–1997 1998–2001 2002–2005 1990–2005
Alaska Airlines $98.9 $98.9(4) (4)
America West $93.8 $1,079.9 $1,173.7(4) (9) (13)
American Airlines $668.9 $65.9 $3,792.4 $871.9 $5,399.1(23) (1) (14) (2) (40)
Atlas Air $543.5 $543.5(4) (4)
Continental Airlines $2,287.7 $5,338.0 $1,575.5 $9,201.2(19) (29) (7) (55)
Delta Air Lines $1,105.5 $79.6 $2,748 $1,125.9 $5,059.0(10) (2) (8) (3) (23)
Federal Express 541.9 $1,615.7 $1,183.6 $3,341.2(6) (14) (7) (27)
JetBlue Airways $929.3 $929.3(6) (6)
Southwest Airlines $168.0 $610.4 614.3 $1,392.7(3) (9) (3) (15)
United Air Lines $724.3 $610.6 $3,622.5 $4,957.4(12) (3) (12) (27)
U.S. Airways $168.6 $263.0 $2,947.3 $3,378.9(3) (3) (10) (16)
Northwest Airlines $1,872.8 $749.1 $2,621.9(12) (4) (16)
Total $3,476.1 $5,626.7 $23,742.3 $5,251.7 $38,096.8(61) (56) (108) (22) (246)
8 Some of the tranche level variables are not available for all the
tranches.
E. Benmelech, N.K. Bergman / Journal of Financial Economics 91 (2009) 339–360344
the aircraft used as collateral, and aircraft redeployabilitymeasures.
4.1. Sample construction
Using SDC Platinum, we identify all secured bonds,ETCs, PTCs, and enhanced equipment trust certificatesissues by firms with four-digit SIC codes 4512 (ScheduledAir Transportation), 4513 (Air Courier Services), and 4522(Nonscheduled Air Transport) that were issued betweenJanuary 1990 and December 2005. This results in 426 debttranches out of which 191 are private placements and 235are issued in U.S. public markets. We collect all relevantdata from SDC Platinum such as seniority, size, and creditspread over the corresponding treasury at time of issue.The aggregate nominal value of the private placementsand public issues are $19.8 billion and $32.1, respectively,totaling $51.9 billion.
We continue by collecting the filing prospectus fromEDGAR Plus (R) and from Compact Disclosure for eachpublicly traded tranche identified by SDC. Since there areno publicly available prospectuses for private placements,we collect data from Airfinance Journal, an industryperiodical, for the private deals. For each public tranche,we obtain the serial number of all aircraft that werepledged as collateral from the filing prospectus, while forprivate tranches we obtain the aircraft model type servingas collateral from Airfinance Journal. We are able to findfull information about the aircraft collateral securing the
bonds for 198 public tranches and 48 private tranches. Toobtain data on aircraft model type for the public tranches,we match each aircraft serial number obtained from filingprospectuses to the Ascend CASE airline database, whichcontains ownership information, operating information,and information on aircraft characteristics for everycommercial aircraft in the world. For each of the 246tranches, we can thus identify the full portfolio of aircraftserving as collateral.
4.2. Tranche and airline characteristics
Table 2 describes the sample of secured tranches usedin the paper, by issuing airline. There are 246 individualtranches with an aggregate nominal value of $38,096.8million that were issued by 12 American airlines.8 Duringthe period 1990–1993, 61 tranches with an aggregatebook value of $3,476.1 million were issued by sevenairlines as compared to 108 tranches with an aggregatebook value of $23,742.3 that were issued by 10 airlinesbetween 1998 and 2001. Our sample includes the 10largest scheduled passenger airlines in the U.S. (out ofwhich five are among the 10 largest passenger carriers inthe world as of 2005), as well as the largest air couriercompany in the world (FedEx).
ARTICLE IN PRESS
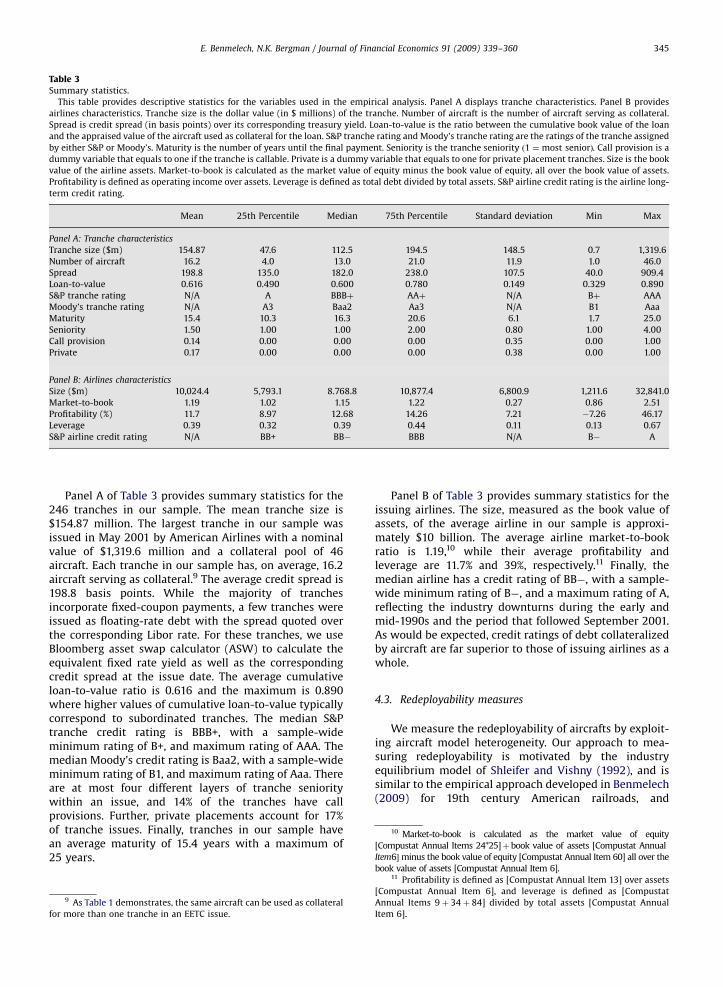
Table 3Summary statistics.
This table provides descriptive statistics for the variables used in the empirical analysis. Panel A displays tranche characteristics. Panel B provides
airlines characteristics. Tranche size is the dollar value (in $ millions) of the tranche. Number of aircraft is the number of aircraft serving as collateral.
Spread is credit spread (in basis points) over its corresponding treasury yield. Loan-to-value is the ratio between the cumulative book value of the loan
and the appraised value of the aircraft used as collateral for the loan. S&P tranche rating and Moody’s tranche rating are the ratings of the tranche assigned
by either S&P or Moody’s. Maturity is the number of years until the final payment. Seniority is the tranche seniority ð1 ¼ most seniorÞ. Call provision is a
dummy variable that equals to one if the tranche is callable. Private is a dummy variable that equals to one for private placement tranches. Size is the book
value of the airline assets. Market-to-book is calculated as the market value of equity minus the book value of equity, all over the book value of assets.
Profitability is defined as operating income over assets. Leverage is defined as total debt divided by total assets. S&P airline credit rating is the airline long-
term credit rating.
Mean 25th Percentile Median 75th Percentile Standard deviation Min Max
Panel A: Tranche characteristics
Tranche size ($m) 154.87 47.6 112.5 194.5 148.5 0.7 1,319.6
Number of aircraft 16.2 4.0 13.0 21.0 11.9 1.0 46.0
Spread 198.8 135.0 182.0 238.0 107.5 40.0 909.4
Loan-to-value 0.616 0.490 0.600 0.780 0.149 0.329 0.890
S&P tranche rating N/A A BBBþ AAþ N/A Bþ AAA
Moody’s tranche rating N/A A3 Baa2 Aa3 N/A B1 Aaa
Maturity 15.4 10.3 16.3 20.6 6.1 1.7 25.0
Seniority 1.50 1.00 1.00 2.00 0.80 1.00 4.00
Call provision 0.14 0.00 0.00 0.00 0.35 0.00 1.00
Private 0.17 0.00 0.00 0.00 0.38 0.00 1.00
Panel B: Airlines characteristics
Size ($m) 10,024.4 5,793.1 8.768.8 10,877.4 6,800.9 1,211.6 32,841.0
Market-to-book 1.19 1.02 1.15 1.22 0.27 0.86 2.51
Profitability (%) 11.7 8.97 12.68 14.26 7.21 �7.26 46.17
Leverage 0.39 0.32 0.39 0.44 0.11 0.13 0.67
S&P airline credit rating N/A BB+ BB� BBB N/A B� A
10 Market-to-book is calculated as the market value of equity
[Compustat Annual Items 24*25]þbook value of assets [Compustat Annual
Item6�minus the book value of equity [Compustat Annual Item 60] all over the
E. Benmelech, N.K. Bergman / Journal of Financial Economics 91 (2009) 339–360 345
Panel A of Table 3 provides summary statistics for the246 tranches in our sample. The mean tranche size is$154.87 million. The largest tranche in our sample wasissued in May 2001 by American Airlines with a nominalvalue of $1,319.6 million and a collateral pool of 46aircraft. Each tranche in our sample has, on average, 16.2aircraft serving as collateral.9 The average credit spread is198.8 basis points. While the majority of tranchesincorporate fixed-coupon payments, a few tranches wereissued as floating-rate debt with the spread quoted overthe corresponding Libor rate. For these tranches, we useBloomberg asset swap calculator (ASW) to calculate theequivalent fixed rate yield as well as the correspondingcredit spread at the issue date. The average cumulativeloan-to-value ratio is 0.616 and the maximum is 0.890where higher values of cumulative loan-to-value typicallycorrespond to subordinated tranches. The median S&Ptranche credit rating is BBB+, with a sample-wideminimum rating of B+, and maximum rating of AAA. Themedian Moody’s credit rating is Baa2, with a sample-wideminimum rating of B1, and maximum rating of Aaa. Thereare at most four different layers of tranche senioritywithin an issue, and 14% of the tranches have callprovisions. Further, private placements account for 17%of tranche issues. Finally, tranches in our sample havean average maturity of 15.4 years with a maximum of25 years.
9 As Table 1 demonstrates, the same aircraft can be used as collateral
for more than one tranche in an EETC issue.
Panel B of Table 3 provides summary statistics for theissuing airlines. The size, measured as the book value ofassets, of the average airline in our sample is approxi-mately $10 billion. The average airline market-to-bookratio is 1.19,10 while their average profitability andleverage are 11.7% and 39%, respectively.11 Finally, themedian airline has a credit rating of BB�, with a sample-wide minimum rating of B�, and a maximum rating of A,reflecting the industry downturns during the early andmid-1990s and the period that followed September 2001.As would be expected, credit ratings of debt collateralizedby aircraft are far superior to those of issuing airlines as awhole.
4.3. Redeployability measures
We measure the redeployability of aircrafts by exploit-ing aircraft model heterogeneity. Our approach to mea-suring redeployability is motivated by the industryequilibrium model of Shleifer and Vishny (1992), and issimilar to the empirical approach developed in Benmelech(2009) for 19th century American railroads, and
book value of assets [Compustat Annual Item 6].11 Profitability is defined as [Compustat Annual Item 13] over assets
[Compustat Annual Item 6], and leverage is defined as [Compustat
Annual Items 9þ 34þ 84] divided by total assets [Compustat Annual
Item 6].

ARTICLE IN PRESS
Table 4Aircraft type.
This table lists the 22 different aircraft types represented in our sample. For every aircraft type we list the number of aircraft and percentage of total
aircraft in our sample. The table also reports the time-series (1990–2005) mean of the three redeployability measures for every aircraft type.
Redeployability (# of aircraft) is the number of aircraft per type; Redeployability (# of operators) is the number of operators per type; Redeployability
(# of operators with more than 5 aircraft) is the number of operators who operate at least five aircraft per type.
(time-series mean)
(time-series mean) (time-series mean) # operators with
Aircraft type Number Percent # of aircraft # of operators 45 aircraft
Airbus A300 25 2.30 278.9 53.1 17.8
Airbus A310 12 1.10 161.7 44.9 10.6
Airbus A319 144 13.26 188.7 36.3 8.9
Airbus A320 89 8.20 621.1 83.2 34.1
Airbus A321 10 0.92 116.6 31.0 9.1
Airbus A330 9 0.83 117.5 30.7 9.1
BAE SYSTEMS RJ Avroliner 14 1.29 44.1 6.0 2.1
BAE SYSTEMS Jetstream 31/S3 2 0.18 180.9 64.0 8.5
Boeing (McDonnell-Douglas) MD-11 24 2.21 130.4 26.6 9.8
Boeing (McDonnell-Douglas) MD-80 49 4.51 997.7 67.3 28.3
Boeing 737 (CFMI) 58 5.34 1502.3 162.9 66.0
Boeing 737 (NG) 222 20.44 686.1 143.3 28.7
Boeing 747 21 1.93 760.8 91.4 36.3
Boeing 757 141 12.98 688.0 80.0 26.2
Boeing 767 80 7.37 617.6 83.5 30.1
Boeing 777 56 5.16 185.8 25.8 9.9
Bombardier Dash 8 2 0.18 389.4 69.0 18.9
Embraer EMB-120 9 0.83 31.2 5.0 1.3
Embraer ERJ-135 8 0.74 19.3 6.7 0.7
Embraer ERJ-145 98 9.02 205.7 20.1 7.2
Lockheed L-1011 TriStar 11 1.01 73.8 28.5 4.4
Saab 340 2 0.18 274.0 40.1 12.5
Total 1,086 100.00 – – –
E. Benmelech, N.K. Bergman / Journal of Financial Economics 91 (2009) 339–360346
Benmelech and Bergman (2008) and Gavazza (2006) forairlines.
In order to reduce costs associated with operatingdifferent aircraft types, airlines tend to operate a limitednumber of aircraft models. Therefore, potential secondarymarket buyers of any given type of aircraft are prone to beairlines already operating the same type of aircraft. Thenotion that the number of potential buyers and the‘popularity’ of an aircraft model are important determi-nants of the redeployability of aircraft is supported byindustry participants and analysts. According to Little-johns and McGairl (1998), the ease of remarketing anaircraft is an important determinant of expected collateralvalue and that, ‘‘[a]n aircraft with a large number incurrent use across a wide array of users will obviously beeasier to resell or re-lease than an aircraft of limitedproduction and usage.’’12 Similarly, the prospectus supple-ment of PTCs issued by Federal Express describe thefactors that affect the marketability of an aircraft:
Marketability of Aircraft. It is impossible to predict theresale value for any Aircraft to be sold upon theexercise of the Indenture Trustee’s remedies underthe related Indenture. The market for aircraft, whethernew or used, is and will be affected by many factorsincluding, among other things, the supply of similarly
12 Littlejohns and McGairl (1998, p. 81).
equipped aircraft of the same make and model, thedemand for such aircraft by air carriers and the costand availability of financing to potential purchasers ofsuch aircraft.13
Table 4 provides a breakdown of all aircraft in our sample,by aircraft type. Our sample includes 1,086 individualaircraft serving as collateral, representing 22 differentaircraft types. The most prevalent type of collateralaircraft in our sample is the Boeing 737 (NG) (222aircraft), followed by the Airbus A319 (144 aircraft), andBoeing 757 (141 aircraft). The least popular aircraft in oursample are BAE Jetstream 31/S3, Saab 340, and Bombar-dier Dash 8, with two aircraft each. While Boeing 737(CFMI) is the most popular aircraft in the world, it isunderrepresented in the pool of aircraft used as acollateral for these deals. The reason for this under-representation is that the sample in our paper does notcover the whole market for used aircraft, but rather thesample of aircraft that were used as collateral by majorU.S. airlines during the period 1990–2005.
Using the Ascend CASE database, we construct threeredeployability measures using the same method as inBenmelech and Bergman (2008). We begin by construct-ing redeployability measures at the yearly level for eachaircraft type, where aircraft type is defined using the
13 Source: Federal Express Corp. Prospectus Supplement, November
26, 1993.

ARTICLE IN PRESS
E. Benmelech, N.K. Bergman / Journal of Financial Economics 91 (2009) 339–360 347
aircraft-type category in the Ascend CASE database. To doso, we compute for every sample-year (1) the number ofaircraft per type, (2) the number of operators per type, and(3) the number of operators who operate at least fiveaircraft per type. In calculating these measures, wedisregard airlines who are in bankruptcy using the SDCbankruptcy database, as their financial position mostlikely precludes them from serving as potential aircraftbuyers.14 This process yields three redeployability mea-sures for each aircraft-type and each sample-year. The lastthree columns in Table 4 report the time-series mean ofeach of the three redeployability series during the period1990–2005. The aircraft type with the largest number ofoperators that were not subject to Chapter 7 or Chapter 11of the Bankruptcy Code is the Boeing 737 (CFMI). Thisaircraft was operated by an average of 162.9 operators, ofwhich 66 had more than five such aircraft. The aircrafttype with the smallest number of operators in our sampleis the Embraer EMB-120 with an average of only 31.2aircraft, five operators, and 1.3 operators with more thanfive aircraft.
To construct the redeployability measures for aportfolio of aircraft serving as collateral for a particulartranche, we simply aggregate the aircraft-type redeploy-ability measures across all aircraft in the portfolio.Specifically, we define the redeployability of the collat-eral-portfolio to be the weighted average of the redeploy-ability index corresponding to each of the aircraft in theportfolio. In calculating the first redeployability measure,since we want to account for the residual demand for theaircraft in each fleet, we do not include each airline’s ownaircraft. Likewise, in our number-of-operators-basedproxies we subtract the airline for which we calculatethe measure. We calculate in this manner three measuresof fleet redeployability corresponding to each of the threemeasures of aircraft-type redeployability. The threemeasures are given by
Redeployabilityaircrafti;t ¼
XS
s
oi;t;sðRedeployabilityaircrafts;t Þ,
Redeployabilityoperatorsi;t ¼
XS
s
oi;t;sðRedeployabilityoperatorss;t Þ,
Redeployabilityoperators45i;t ¼
XS
s
oi;t;sðRedeployabilityoperators45s;t Þ,
where i is a tranche, t is sample year, s denotes an aircrafttype, and oi;t;s is defined as
oi;t;s ¼ numberi;t;s � seatss
XS
s
numberi;t;s � seatss
,.
We use the number of seats in an aircraft model as a proxyfor its size (and value) in our weighted average calcula-tions. We use the number of seats since we have appraisedvalues of aircrafts for only about 60% of the aircraft in oursample. Also, according to Littlejohns and McGairl (1998):
14 As robustness we run all regressions using redeployability
measures that do not exclude bankrupt airlines. The results are
qualitatively unchanged.
‘‘(T)he exact appraisal value of aircraft involved in asecuritization is not vital because the rating agenciesrecognize that the value will change from the outset of thedeal. They do, however, take into consideration whetherthe secondary market is at a cyclical high or low.’’ Incontrast to current appraised aircraft value, our aircraft-type-based measures serve to capture the long-termredeployability of an aircraft, while placing less weighton current market conditions and prices.
Panel A of Table 5 provides descriptive statistics for ourthree redeployability measures. As can be seen, theredeployability measure based on number of aircraft hasan average value of 958.6 aircraft operated by airlines thatare not subject to Chapter 7 or Chapter 11 of theBankruptcy Code. Furthermore, on average, there are118.7 potential non-bankrupt buyers for aircraft servingas collateral for secured tranche issues. When we measureredeployability using potential buyers with at least fiveaircraft, there are only 40.2 potential buyers on average(median of 27). Panel B of Table 5 lists examples oftranches, their collateral, and the corresponding redeploy-ability measures. Northwestern NWA-1999 tranches G, B,and C have the least redeployable aircraft pool in oursample. Secured by 14 BAE SYSTEMS RJ85 Avrolineraircraft, there were only 72 aircrafts of this type on theissue date, with only three solvent operators with morethan five aircraft. In contrast, the collateral of Southwest1996 A1 and A2 tranches is among the most redeployablepools in our sample—secured by six Boeing 737-300aircraft that have 112 potential buyers that operate morethan five aircraft. Panel B also shows that the pool ofaircraft that is used as collateral for ETCs, PTCs, or EETCsoften includes multiple aircraft types. The Delta 2000-1tranches A2, B, and C are secured by 20 Boeing 737-832, 18Boeing 757-232, and six B767-332ER, resulting in 63potential buyers that operate more than five aircraft.
5. Empirical analysis
This section presents the empirical analysis of therelation between aircraft redeployability and credit spreadand tranche rating, as well as cumulative loan-to-valueratios and tranche maturity. Our theoretical predictionsstem from the observation that, all else equal, when debtis secured by collateral with greater expected liquidationvalues, creditors bear less downside risk in the event ofdefault. Rather than relying only on the promisedpayments by the firm to generate a return on theiroriginal investment, creditors can sell the collateralizedassets and redeploy them elsewhere to a different user.Hence, redeployability should be negatively related totranche credit spreads, positively related to tranche creditratings, and should be associated with higher debtcapacity and longer-term debt.
To test redeployability’s impact on credit characteris-tics, and establish its economic significance, we relate ourthree measures of tranche-collateral redeployability to thetranche credit spread, to the tranche S&P and Moody’scredit rating, as well as to cumulative loan-to-value ratiosand tranche maturity. Because all of the tranches in our

ARTIC
LEIN
PRESS
Table 5Redeployability measures.
This table provides descriptive statistics for the redeployability measures used in the empirical analysis. Panel A displays the characteristics of the Redeployability measures. Redeployability (# of aircraft) is
the number of aircraft per type; Redeployability (# of operators) is the number of operators per type; Redeployability (# of operators with more than 5 aircraft) is the number of operators who operate at least
five aircraft per type. Panel B presents examples of specific tranches, the collateral used to secure the tranches, and the redeployability measures values for each of the tranches.
Mean 25th Percentile Median 75th Percentile Standard deviation Min Max
Panel A: Summary statistics
Redeployability 958.6 365.0 661.7 1,624.1 793.8 72.0 3,485.0
(# of aircraft)
Redeployability 118.7 53.2 73.6 185.8 90.7 7.0 421.0
(# of operators)
Redeployability 40.2 17.6 27.0 63.0 30.0 2.0 131.0
(# of operators
with 45 aircraft)
EETC Tranche Issue size Spread (bp) # of aircraft # of operators # of operators with 45 aircraft Collateral
Panel B: Examples of tranche redeployability
Delta 2000-1 A1 341.1 148 1657.2 185.8 63.0 20 B737-832
18 B757-232
6 B767-332ER
Delta 2000-1 A2 738.1 170 1657.2 185.8 63.0 20 B737-832
18 B757-232
6 B767-332ER
Delta 2000-1 B 182.5 205 1657.2 185.8 63.0 20 B737-832
18 B757-232
6 B767-332ER
Delta 2000-1 C 238.3 188 1657.2 185.8 63.0 20 B737-832
18 B757-232
6 B767-332ER
NWA 1999-3 G 150.2 170 72.0 7.0 3.0 14 BAE RJ85
NWA 1999-3 B 58.0 325 72.0 7.0 3.0 14 BAE RJ85
NWA 1999-3 C 31.9 300 72.0 7.0 3.0 14 BAE RJ85
Southwest 1996 A1 113.1 72 2646.0 302.0 112.0 6 B737-300
Southwest 1996 A2 33.1 85 2646.0 302.0 112.0 6 B737-300
E.
Ben
melech
,N
.K.
Berg
ma
n/
Jou
rna
lo
fFin
an
cial
Eco
no
mics
91
(20
09
)3
39
–3
60
34
8

ARTICLE IN PRESS
15 We do not control for loan-to-value in these regressions since we
do not have loan-to-value data for all the tranches in our data. We later
control for loan-to-value in Table 12 for robustness.
E. Benmelech, N.K. Bergman / Journal of Financial Economics 91 (2009) 339–360 349
sample employ aircraft as collateral, our tests rely onexamining the effect of the intensive margin rather thanthe extensive margin of collateral use. Put differently, weare analyzing the effect of variation in collateral redeploy-ability levels on tranche characteristics, rather than theeffect of having collateral at all on these characteristics. Bydoing so, we alleviate the selection bias that is present in anumber of previous studies which utilize variation in theextensive margin to analyze the effect of collateral on loanprices (see, e.g., Berger and Udell, 1990). As describedabove, these studies tend to find a positive relationbetween a debt issue employing collateral and its yield,a fact that is interpreted as suggesting that only relativelylow-risk firms can borrow using non-collateralized loans.The selection bias involved in the collateralizationdecision tends, therefore, to mask the actual relationbetween collateral values and loan characteristics.
5.1. Airline risk and the endogeneity of the redeployability
measures
One potential effect which would lead our results tounderestimate the actual effect of collateral values oncredit spreads is a selection effect similar in spirit to thatshown in previous literature. If higher default-risk firmsare required not only to pledge collateral, but also topledge collateral of greater redeployability, increases inour redeployability measures would, in part, proxy forincreases in airline default risk. It should be noted,however, that such a selection bias along the intensivemargin will work against our finding support for thehypotheses in Section 2: if riskier airlines are required topost better collateral, increased collateral redeployabilitywill have a more negative impact on credit spreads thanthat estimated by our regressions. Similarly, increasedcollateral redeployability will have a more positive effecton improved credit ratings, loan-to-value ratios, and debtmaturities than that estimated in our regressions.
Although a selection bias along the intensive marginworks against our finding support for the hypotheses, itsexistence is ultimately an empirical question. In Table A1in the Appendix we test the hypothesis that aircraftredeployability is correlated with airline default risk. Weregress each of our three tranche redeployability mea-sures on variables that capture the financial status of anairline: size, profitability, leverage, interest coverage, andthe S&P long-term credit rating. All regressions includeyear fixed effects and standard errors are clustered byairline. To alleviate a multicollinearity concern, we includeeach of the regressors individually in Panel A throughPanel C of Table A1 for each of the redeployabilitymeasures. We also test a multivariate specification inwhich all the explanatory variables are included. As can beseen, we find that none of the explanatory variables arestatistically significant in explaining aircraft redeploy-ability, and together they are not jointly significant, as theF-test reveals. Since airline risk is clearly correlated witheach of the explanatory variables, and in particular withthe airline credit rating, we conclude that airline risk isnot correlated with aircraft redeployability. Thus, aselection bias in which higher default-risk firms are
required to pledge collateral of greater redeployability isnot supported by the data. Moreover, later on in ourregressions we include airline characteristics and airlinesfixed effects to control for airline heterogeneity thatpotentially drives aircraft redeployability.
5.2. Redeployability and credit spreads
We begin with a simple test of Hypothesis 1 whichpredicts a negative relation between redeployability andcredit spreads. We estimate the following specification:
Spreadi;a;t ¼ b� Redeployabilityi;a;t þ Xi;a;tcþ Za;t�1dþ cthþ �i;a;t ;
(1)
where Spread is the tranche credit spread above thecorresponding treasury yield on the issue date, subscriptsindicate tranche (i), airline (a), and year (t), Redeployability
is one of our three measures of the redeployability of theaircraft portfolio serving as collateral for each tranche,Xi;a;t is a vector of tranche covariates, Za;t is a vector ofairline controls, ct is a vector of year fixed effects, and �i;a;t
is the regression residual. The tranche covariates includethe seniority of the tranche, the log of the tranche size(in $ millions), a dummy variable that equals one if thetranche is callable, a dummy variable that equals one forprivate placements, and the maturity (in years) of eachtranche.15 The issuing airline control variables are theairline’s size, market-to-book ratio, profitability, and theairline S&P credit rating. Airline control variables arecalculated as of the beginning-of-year t, hence the laggedt subscript. Regressions are run under OLS, and robuststandard errors are clustered by airline and reported inparentheses.
We report the results from estimating regression (1) inthe first three columns of Table 6. In the last threecolumns of Table 6 we include both year and airlines fixedeffects. Thus, we estimate the following specification:
Spreadi;a;t ¼ b� Redeployabilityi;a;t þ Xi;a;tcþ Za;t�1d
þ cthþ bawþ ui;a;t , (2)
where ba is a vector of airline fixed effects, ui;a;t is theregression residual, and all other control variables aredefined as in regression (1).
We find that after controlling for tranche character-istics and aircraft controls, and both year and airline fixedeffects, higher redeployability is associated with lowercredit spreads. This effect is economically sizeable. In thespecification without airline fixed effects, moving fromthe 25th percentile to the 75th percentile in ourredeployability measures is associated with a decreasein the spread that is between 21.6 and 23.7 basis points,representing an 11% decrease relative to the mean spread.Adding airline fixed effects, and thus controlling forunobserved heterogeneity in airline characteristics,strengthens the economic magnitudes of the effect ofredeployability, with a 25th to 75th percentile movement
ARTICLE IN PRESS
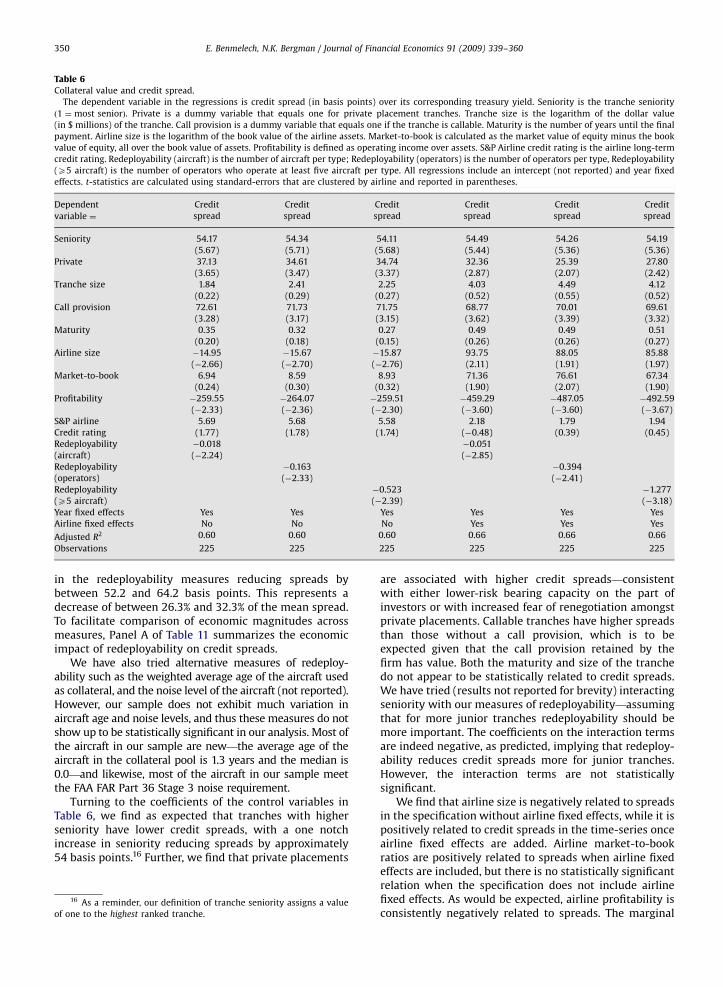
Table 6Collateral value and credit spread.
The dependent variable in the regressions is credit spread (in basis points) over its corresponding treasury yield. Seniority is the tranche seniority
ð1 ¼ most seniorÞ. Private is a dummy variable that equals one for private placement tranches. Tranche size is the logarithm of the dollar value
(in $ millions) of the tranche. Call provision is a dummy variable that equals one if the tranche is callable. Maturity is the number of years until the final
payment. Airline size is the logarithm of the book value of the airline assets. Market-to-book is calculated as the market value of equity minus the book
value of equity, all over the book value of assets. Profitability is defined as operating income over assets. S&P Airline credit rating is the airline long-term
credit rating. Redeployability (aircraft) is the number of aircraft per type; Redeployability (operators) is the number of operators per type, Redeployability
(X5 aircraft) is the number of operators who operate at least five aircraft per type. All regressions include an intercept (not reported) and year fixed
effects. t-statistics are calculated using standard-errors that are clustered by airline and reported in parentheses.
Dependent Credit Credit Credit Credit Credit Credit
variable ¼ spread spread spread spread spread spread
Seniority 54.17 54.34 54.11 54.49 54.26 54.19
(5.67) (5.71) (5.68) (5.44) (5.36) (5.36)
Private 37.13 34.61 34.74 32.36 25.39 27.80
(3.65) (3.47) (3.37) (2.87) (2.07) (2.42)
Tranche size 1.84 2.41 2.25 4.03 4.49 4.12
(0.22) (0.29) (0.27) (0.52) (0.55) (0.52)
Call provision 72.61 71.73 71.75 68.77 70.01 69.61
(3.28) (3.17) (3.15) (3.62) (3.39) (3.32)
Maturity 0.35 0.32 0.27 0.49 0.49 0.51
(0.20) (0.18) (0.15) (0.26) (0.26) (0.27)
Airline size �14.95 �15.67 �15.87 93.75 88.05 85.88
(�2.66) (�2.70) (�2.76) (2.11) (1.91) (1.97)
Market-to-book 6.94 8.59 8.93 71.36 76.61 67.34
(0.24) (0.30) (0.32) (1.90) (2.07) (1.90)
Profitability �259.55 �264.07 �259.51 �459.29 �487.05 �492.59
(�2.33) (�2.36) (�2.30) (�3.60) (�3.60) (�3.67)
S&P airline 5.69 5.68 5.58 2.18 1.79 1.94
Credit rating (1.77) (1.78) (1.74) (�0.48) (0.39) (0.45)
Redeployability �0.018 �0.051
(aircraft) (�2.24) (�2.85)
Redeployability �0.163 �0.394
(operators) (�2.33) (�2.41)
Redeployability �0.523 �1.277
(X5 aircraft) (�2.39) (�3.18)
Year fixed effects Yes Yes Yes Yes Yes Yes
Airline fixed effects No No No Yes Yes Yes
Adjusted R2 0.60 0.60 0.60 0.66 0.66 0.66
Observations 225 225 225 225 225 225
E. Benmelech, N.K. Bergman / Journal of Financial Economics 91 (2009) 339–360350
in the redeployability measures reducing spreads bybetween 52.2 and 64.2 basis points. This represents adecrease of between 26.3% and 32.3% of the mean spread.To facilitate comparison of economic magnitudes acrossmeasures, Panel A of Table 11 summarizes the economicimpact of redeployability on credit spreads.
We have also tried alternative measures of redeploy-ability such as the weighted average age of the aircraft usedas collateral, and the noise level of the aircraft (not reported).However, our sample does not exhibit much variation inaircraft age and noise levels, and thus these measures do notshow up to be statistically significant in our analysis. Most ofthe aircraft in our sample are new—the average age of theaircraft in the collateral pool is 1.3 years and the median is0.0—and likewise, most of the aircraft in our sample meetthe FAA FAR Part 36 Stage 3 noise requirement.
Turning to the coefficients of the control variables inTable 6, we find as expected that tranches with higherseniority have lower credit spreads, with a one notchincrease in seniority reducing spreads by approximately54 basis points.16 Further, we find that private placements
16 As a reminder, our definition of tranche seniority assigns a value
of one to the highest ranked tranche.
are associated with higher credit spreads—consistentwith either lower-risk bearing capacity on the part ofinvestors or with increased fear of renegotiation amongstprivate placements. Callable tranches have higher spreadsthan those without a call provision, which is to beexpected given that the call provision retained by thefirm has value. Both the maturity and size of the tranchedo not appear to be statistically related to credit spreads.We have tried (results not reported for brevity) interactingseniority with our measures of redeployability—assumingthat for more junior tranches redeployability should bemore important. The coefficients on the interaction termsare indeed negative, as predicted, implying that redeploy-ability reduces credit spreads more for junior tranches.However, the interaction terms are not statisticallysignificant.
We find that airline size is negatively related to spreadsin the specification without airline fixed effects, while it ispositively related to credit spreads in the time-series onceairline fixed effects are added. Airline market-to-bookratios are positively related to spreads when airline fixedeffects are included, but there is no statistically significantrelation when the specification does not include airlinefixed effects. As would be expected, airline profitability isconsistently negatively related to spreads. The marginal

ARTICLE IN PRESS
0.9
1
1.1
1.2
1.3
1.4
1.5
1990
Market-to-book
0
0.02
0.04
0.06
0.08
0.1
0.12
0.14
0.16
0.18
Profitability
Industry Market-to-bookIndustry Profitability
1991
1992
1993
1994
1995
1996
1997
1998
1999
2000
2001
2002
2003
2004
2005
Fig. 1. The cyclicality of the airline industry: This figure provides industry weighted average profitability (right-hand scale) and market-to-book ratio
(left-hand scale) over the sample period 1990–2005. Profitability is defined as operating income over assets. Market-to-book is calculated as the market
value of equity minus the book value of equity, all over the book value of assets. Airline market values are used as weights.
E. Benmelech, N.K. Bergman / Journal of Financial Economics 91 (2009) 339–360 351
effect of profitability is large: a one standard deviationincrease in airline profitability decreases tranche creditspreads by approximately 30 basis points in the specifica-tion without airline fixed effects and approximately 55basis points in the specification with airline fixed effects,representing 15% and 28% of the mean spread in thesample. Finally, while the point estimates of the coeffi-cients on airline S&P credit rating are positive, indicating anegative relation between airline credit rating andspreads, the effect is insignificant in the specificationswith airline fixed effects, and only marginally significantin the specifications without airline fixed effects(t-statistic ¼ 1.77).
5.3. Credit spreads and collateral redeployability in industry
downturns
In this subsection we examine whether airline indus-try-wide conditions affect the relation between collateralredeployability and credit spreads.17 Following Shleiferand Vishny (1992), we hypothesize that the negativerelation between redeployability and credit spreadsshould be stronger during times when the industry isdoing poorly, as during these times, the ability to easilyredeploy assets of failing firms will be particularlyimportant. In contrast, it might be relatively easy to findbuyers even for low redeployability aircraft duringindustry booms.
To test the effect of industry-wide conditions on creditspreads we examine two proxies for the industry health:
17 We thank an anonymous referee for suggesting the empirical tests
in this section.
(i) the weighted average airline profitability, and (ii) theweighted average airline market-to-book. Fig. 1 displaysthe evolution of our measures of the state of the airlineindustry over our sample period. As Fig. 1 illustrates,industry condition peaked during 1997, then deteriorateduntil 2001–2002, and has recently slightly improved.18 Asa first step, we include a control for industry-wideconditions in regression (2) which relates credit spreadsto collateral redeployability. Since industry-wide condi-tions are equal for all airlines in a given year, year fixedeffects are not included in these specifications. The resultsare shown in Table 7.
As expected, we find a negative relation betweenspreads and the general health of the airline industry, asproxied by profitability and market-to-book ratios.Further, as can be seen in the table, the negative relationbetween collateral redeployability and credit spreadscontinues to hold even after controlling for industrycondition. It should be noted that the coefficients on thethree measures of redeployability in Table 7 are morenegative than the corresponding coefficients in Table 6,suggesting that the year fixed effects are capturingtemporal variation not captured by our measures ofindustry health.
To test the industry downturn hypothesis, i.e., that thenegative relation between redeployability and creditspreads should be stronger during times when theindustry is doing poorly, we add an interaction termbetween the measures of airline industry health and each
18 While September 11, 2001, was an exogenous shock to the airline
industry leading to deterioration of airlines’ profitability and valuation,
our sample includes only 16 tranches that were issued after September
2001, and thus, we cannot fully exploit this shock.

ARTICLE IN PRESS
Table 7Industry conditions and credit spread.
The dependent variable in the regressions is credit spread (in basis points) over its corresponding treasury yield. Seniority is the tranche seniority
ð1 ¼ most seniorÞ. Tranche size is the logarithm of the dollar value (in $ millions) of the tranche. Private is a dummy variable that equals one for private
placement tranches. Call provision is a dummy variable that equals one if the tranche is callable. Maturity is the number of years until the final payment.
Airline size is the logarithm of the book value of the airline assets. Market-to-book is calculated as the market value of equity minus the book value of
equity, all over the book value of assets. Profitability is defined as operating income over assets. S&P airline credit rating is the airline long-term credit
rating. Industry profitability is a weighted average profitability at the airline industry level. Industry market-to-book is a weighted average industry
market-to-book. Redeployability (aircraft) is the number of aircraft per type; Redeployability (operators) is the number of operators per type,
Redeployability (X5 aircraft) is the number of operators who operate at least five aircraft per type. All regressions include an intercept (not reported) and
airline fixed effects. t-statistics are calculated using standard-errors that are clustered by airline and reported in parentheses.
Dependent Credit Credit Credit Credit Credit Credit
variable ¼ spread spread spread spread spread spread
Seniority 42.92 42.99 42.85 40.50 40.39 40.77
(4.61) (4.44) (4.43) (4.23) (4.06) (4.14)
Private 18.38 2.85 9.76 23.86 6.88 13.31
(0.51) (0.07) (0.28) (0.62) (0.16) (0.36)
Tranche size �5.75 �5.29 �6.02 �6.18 �5.75 �6.38
(�1.09) (�1.02) (�1.17) (�1.04) (�1.01) (�1.14)
Call provision 22.53 23.42 24.10 28.51 29.94 29.47
(0.90) (0.92) (0.97) (1.43) (1.40) (1.40)
Maturity 1.14 1.16 1.12 1.00 1.03 0.99
(0.61) (0.63) (0.61) (0.55) (0.57) (0.54)
Airline size 125.31 121.84 117.56 145.66 141.34 134.56
(2.51) (2.55) (2.44) (2.66) (2.62) (2.57)
Market-to-book 46.88 56.82 36.22 56.62 67.45 43.40
(1.82) (2.31) (1.35) (1.83) (2.29) (1.34)
Profitability 115.46 81.59 60.75 �201.87 �252.18 �219.03
(0.84) (0.60) (0.50) (�1.43) (�2.01) (�1.87)
S&P airline �4.73 �5.17 �3.70 0.18 �0.31 0.65
credit rating (�1.09) (�1.20) (�0.91) (0.04) (�0.06) (0.14)
Industry profitability �812.92 �827.86 �715.35
(�5.09) (�5.35) (�4.67)
Industry market-to-book �253.11 �253.82 �217.34
(�2.97) (�3.10) (�2.81)
Redeployability �0.087 �0.097
(aircraft) (�5.71) (�5.57)
Redeployability �0.716 �0.793
(operators) (�5.43) (�5.05)
Redeployability �2.361 �2.626
(X5 aircraft) (�5.97) (�5.52)
Airline fixed effects Yes Yes Yes Yes Yes Yes
Adjusted R2 0.47 0.47 0.48 0.45 0.45 0.46
Observations 225 225 225 225 225 225
19 One of the interaction coefficients is marginally significant with a
t-statistic of 1.67.
E. Benmelech, N.K. Bergman / Journal of Financial Economics 91 (2009) 339–360352
of our three redeployability measures. In some specifica-tions we also include year fixed effects and thus identifyoff of the interaction term between redeployability andindustry conditions. Naturally, in the specifications thatinclude year fixed effects we do not include the unin-teracted industry condition variable as it is absorbed bythe year fixed effects.
We present the results in Table 8. For expositionalbrevity, the table presents only the results for industrycondition proxied by the weighted average of airlineprofitability. The results using the market-to-book mea-sure are similar. Further, for expositional brevity the tableincludes only the coefficients on the redeployabilitymeasure and the interaction term between industrycondition and tranche redeployability.
As can be seen from the table, we find qualifiedsupport for the hypothesis that the effect of increasedredeployability in reducing credit spreads is concentratedduring times of relative poor industry performance.Focusing on columns 1–3 of the table, i.e., those without
year fixed effects, we find that while the coefficients onthe level effect of redeployability are negative (essentiallymeasuring the effect of redeployability at an industryprofitability of zero), the coefficients on the interactionterms between the redeployability measures and theweighted average of airline profitability are consistentlypositive and statistically significant.19 Thus, when theindustry is doing relatively well, the negative effect ofcollateral redeployability on spreads is diminished. How-ever, the table also shows that after we include year fixedeffects, the coefficients of the interaction terms are stillpositive yet they are not statistically significant. Thus,with the limited number of years in our sample, we losestatistical significance when year fixed effects are added inaddition to airline fixed effects.

ARTICLE IN PRESS
Table 8Collateral value, industry conditions, and credit spread.
The dependent variable in the regressions is credit spread (in basis points) over its corresponding treasury yield. Industry profitability is a weighted
average profitability at the airline industry level. Redeployability (aircraft) is the number of aircraft per type; Redeployability (operators) is the number of
operators per type; Redeployability (X5 aircraft) is the number of operators who operate at least five aircraft per type. Regressions also include tranche
characteristics (seniority, size, a dummy for private placement, and controls for call provisions at tranche maturity), and airline characteristics (airline
size, market-to-book, profitability, and S&P airline long-term credit rating) which are not reported for brevity. All regressions include an intercept (not
reported) and airline fixed effects. t-statistics are calculated using standard-errors that are clustered by airline and reported in parentheses.
Dependent Credit Credit Credit Credit Credit Credit
variable ¼ spread spread spread spread spread spread
Redeployability (aircraft) �0.142 �0.084
(�5.34) (�3.31)
Redeployability (operators) �1.208 �0.668
(�5.45) (�3.02)
Redeployability (X5 aircraft) �3.347 �1.908
(�4.79) (�3.30)
Redeployability (aircraft) � 0.461 0.285
Industry profitabilityt�1 (2.18) (1.55)
Redeployability (operators)� 4.27 2.368
Industry profitabilityt�1 (2.85) (1.62)
Redeployability (X5 aircraft)� 8.78 5.739
Industry profitabilityt�1 (1.67) (1.25)
Tranche controls Yes Yes Yes Yes Yes Yes
Airline controls Yes Yes Yes Yes Yes Yes
Airline fixed effects Yes Yes Yes Yes Yes Yes
Year fixed effects No No No Yes Yes Yes
Adjusted R2 0.48 0.48 0.48 0.60 0.60 0.60
Observations 225 225 225 225 225 225
20 See Wooldridge, 2001, p. 506.21 Put differently, we are analyzing qProb½rating ¼ AAA=Aaa�=qxi .
E. Benmelech, N.K. Bergman / Journal of Financial Economics 91 (2009) 339–360 353
5.4. Redeployability and credit ratings
We now turn to Hypothesis 2 and analyze the relationbetween the redeployability of collateral and creditratings. Given the ordinal discrete nature of the dependentvariable and similar to Blume, Lim, and Mackinlay (1998)we employ an ordered probit model. This model relatescredit ratings to observed airline and tranche character-istics through unobserved threshold parameters. Thecredit rating categories are mapped into a partition ofthe unobserved threshold parameters range, where thepartition is a linear function of the observed explanatoryvariables.
We assign numeric values to the credit rating cate-gories of Moody’s (S&P), with a credit rating of Aaa (AAA)assigned a value of one, a rating of Aa1 ðAAþÞ assigned avalue of two, all the way to a rating of C (which is thelowest credit rating in the Moody’s scale) that is assigneda value of 21, and a rating of D (which is the lowest creditrating in the S&P scale) that is assigned a value of 22. Wedefine Tranche ratingM;S
i;a;t as either the Moody’s (M ) or S&P(S) numeric value assigned to the credit rating of tranche i
of airline a at time t.Table 9 reports the results from estimating the ordered
probit model by maximum likelihood. Detailed descrip-tions of the ordered probit procedure are provided in theAppendix. The coefficients in Table 9 do not representmarginal effects. The direction of the marginal effectsof the explanatory variables is unambiguously determinedby the sign of the coefficients in Table 9 only forthe highest and lowest ordered response—i.e.PrðTranche ratingM;S
i;a;t ¼ 1jXÞ, PrðTranche ratingMi;a;t ¼ 21jXÞ,
and PrðTranche ratingSi;a;t ¼ 22jXÞ.20 Thus, we first discuss
the direction of the effects of the explanatory variables inTable 9 on the probability that a tranche will be rated AAAby S&P (or alternatively Aaa by Moody’s).21
As Table 9 shows, senior tranches are more likely to berated AAA/Aaa. In addition, we find that larger tranchesare more likely to be rated AAA by S&P ratings, but are notstatistically significant in explaining Moody’s rating.Callable tranches are less likely to be AAA/Aaa rated andtranche maturity does not seem to have a statisticallysignificant effect on being rated AAA/Aaa. We also controlfor three airline characteristics in explaining the tranchecredit rating: size, market-to-book, and profitability. Wefind that tranches of larger airlines, and those of airlineswith higher market-to-book are more likely to be AAA/Aaarated.
Focusing on the relation between credit rating andcollateral, Table 9 shows that the probability that atranche will be rated AAA by S&P or Aaa by Moody’s isconsistently positively related to our measures of collat-eral redeployability. Thus, consistent with our secondhypothesis, credit rating agencies appear to take collateralredeployability into account when determining debtquality, with higher redeployability measures associatedwith improved tranche credit ratings. We measure themarginal effects of collateral redeployability on theprobability that a tranche will be rated AA+, A, andBBBþ and report the economic magnitudes in Panel B of

ARTICLE IN PRESS
Table 9Collateral value and credit rating.
The dependent variable in the regressions is either Moody’s tranche rating or S&P tranche rating. Seniority is the tranche seniority ð1 ¼ most seniorÞ.
Private is a dummy variable that equals one for private placement tranches. Tranche size is the logarithm of the dollar value (in $ millions) of the tranche.
Call provision is a dummy variable that equals one if the tranche is callable. Maturity is the number of years until the final payment. Airline size is the
logarithm of the book value of the airline assets. Market-to-book is calculated as the market value of equity minus the book value of equity, all over the
book value of assets. Profitability is defined as operating income over assets. S&P airline credit rating is the airline long-term credit rating. Redeployability
(aircraft) is the number of aircraft per type; Redeployability (operators) is the number of operators per type; Redeployability (X5 aircraft) is the number of
operators who operate at least five aircraft per type. The table reports coefficients (not marginal effects) from ordered probit regressions that include an
intercept (not reported) and year fixed effects. t-statistics are calculated using standard-errors that are clustered by airline and reported in parentheses.
Dependent Moody’s Moody’s Moody’s S&P S&P S&P
variable ¼ credit rating credit rating credit rating credit rating credit rating credit rating
Ordered probit regressions
Seniority 1.49 1.49 1.50 1.77 1.78 1.78
(7.47) (7.57) (7.62) (5.71) (5.78) (5.82)
Private 0.18 0.14 0.14 �0.53 �0.59 �0.59
(0.65) (0.53) (0.52) (�1.54) (�1.71) (�1.68)
Tranche size �0.17 �0.16 �0.16 �0.31 �0.30 �0.30
(�1.49) (�1.38) (�1.42) (�2.75) (�2.66) (�2.70)
Call provision 0.95 0.94 0.93 0.82 0.80 0.80
(2.33) (2.27) (2.23) (3.00) (2.92) (2.87)
Maturity �0.01 �0.02 �0.01 �0.001 �0.002 �0.003
(�0.39) (�0.42) (�0.48) (�0.04) (�0.07) (�0.14)
Airline size �0.49 �0.50 �0.51 �0.37 �0.38 �0.39
(�2.67) (�2.74) (�2.77) (�2.78) (�2.79) (�2.91)
Market-to-book �1.02 �0.97 �0.94 �1.36 �1.33 �1.29
(�1.83) (�1.68) (�1.65) (�2.05) (�1.98) (�1.90)
Profitability �0.14 �0.20 �0.10 �3.44 �3.50 �3.44
(�0.07) (�0.10) (�0.05) (�1.55) (�1.60) (�1.56)
Redeployability �0.0003 �0.0004
(aircraft) (�1.75) (�2.32)
Redeployability �0.003 �0.003
(operators) (�1.89) (�2.40)
Redeployability �0.010 �0.011
(X5 aircraft) (�2.02) (�2.49)
Fixed effects Year Year Year Year Year Year
Pseudo R2 0.24 0.25 0.25 0.32 0.32 0.32
Observations 227 227 227 223 223 223
E. Benmelech, N.K. Bergman / Journal of Financial Economics 91 (2009) 339–360354
Table 11. As Table 11 shows, a one standard deviationmove in the number of aircraft redeployability measureincreases the probability that a tranche will have a AAþcredit rating by 2 percentage points, representing anincrease of 25.6% relative to the sample mean, and reducesthe probability that a tranche will have a BBB+ creditrating by 1 percentage point, representing a decrease of6.9% relative to the sample mean.22 Similarly, increases inour other measures of redeployability—the number ofoperators redeployability measure, and the number ofoperators with more than five aircraft of similar type—arealso associated with higher credit ratings.
5.5. Redeployability, loan-to-value, and tranche maturity
In this section we analyze the relation betweencollateral redeployability and both loan-to-value ratiosand debt maturity. We begin by testing Hypothesis 3which states that more redeployable collateral supportshigher debt capacity using loan-to-value ratio as ourdependent variable. In testing Hypothesis 3, we use two
22 As discussed above, given the shape of the probability function,
the effect of an independent variable on the probability of the dependent
variable being in a particular bin is non-monotonic in the ranking of the
bin.
baseline specifications: (i) tranche level, and (ii) issuelevel regressions. In the first specification we calculate thecumulative loan-to value ratio for every tranche. Thesecond specification defines a loan-to-value ratio for eachissue as the ratio between the aggregate principal amountof all the tranches within an issue to the appraisedcollateral value.
In the first specification we estimate the followingregression:
LTVTi;a;t ¼ b� Redeployabilityi;a;t þ Xi;a;tcþ Za;t�1d
þ cthþ bawþ ui;a;t , (3)
where LTVTi;a;t is the tranche cumulative loan-to-value ratio
of tranche (i), airline (a), and year (t). Redeployability is oneof our three measures of the redeployability of the aircraftportfolio serving as collateral for each tranche, Xi;a;t is avector of tranche covariates, Za;t is a vector of airlinecontrols, ct is a vector of year fixed effects, ba is a vector ofairline fixed effects, and �i;a;t is the regression residual.Regressions are run under OLS, and robust standard errorsare clustered by airline and reported in parentheses.
The second specification we estimate is given by
LTVIj;a;t ¼ b� Redeployabilityj;a;t þ Za;t�1dþ cthþ bawþ uj;a;t ,
(4)

ARTICLE IN PRESS
Table 10Collateral value, loan-to-value, and tranche maturity.
The dependent variable in columns 1–3 is the cumulative loan-to-value (LTV) at the tranche level. The dependent variable in columns 4–6 is the
cumulative loan-to-value (LTV) at the issue level. The dependent variable in columns 7–9 is the tranche maturity in years. Seniority is the tranche
seniority ð1 ¼ most seniorÞ. Private is a dummy variable that equals one for private placement tranches. Tranche size is the logarithm of the dollar value
(in $m) of the tranche. Call provision is a dummy variable that equals one if the tranche is callable. Maturity is the number of years until the final payment.
Airline size is the logarithm of the book value of the airline assets. Market-to-book is calculated as the market value of equity minus the book value of
equity, all over the book value of assets. Profitability is defined as operating income over assets. S&P airline credit rating is the airline long-term credit
rating. Redeployability (aircraft) is the number of aircraft per type; Redeployability (operators) is the number of operators per type; Redeployability (X5
aircraft) is the number of operators who operate at least five aircraft per type. All regressions include an intercept (not reported) and airline and year fixed
effects. t-statistics are calculated using standard-errors that are clustered by airline and reported in parentheses.
Model (1) (2) (3) (4) (5) (6) (7) (8) (9)
dependent LTV LTV LTV LTV LTV LTV Maturity Maturity Maturity
variable ¼
Seniority 0.10 0.10 0.10 � – – �1.63 �1.62 �1.63
(12.75) (13.26) (12.63) – – – (�2.91) (�2.83) (�2.90)
Private �0.05 �0.04 �0.05 – – – 0.51 0.32 0.41
(�1.23) (�1.11) (�1.18) – – – (0.29) (0.19) (0.24)
Tranche size 0.003 0.002 0.002 – – – 2.15 2.17 2.16
(0.53) (0.81) (0.40) – – – (2.41) (2.44) (2.42)
Call provision 0.02 0.02 0.02 – – – �0.82 �0.82 �0.81
(0.78) (0.81) (0.73) – – – (�0.68) (�0.66) (�0.67)
Maturity �0.002 �0.002 �0.002 – – – – – –
(�0.29) (�0.20) (�0.19) – – – – – –
Airline size �0.21 �0.22 �0.19 �0.004 �0.01 0.02 �4.36 �4.30 �4.50
(�1.44) (�1.51) (�1.30) (�0.04) (�0.10) (0.20) (�0.82) (�0.80) (�0.82)
Market-to-book �0.04 �0.05 �0.04 �0.08 �0.10 �0.07 3.11 3.29 3.04
(�0.78) (�1.06) (�0.63) (�2.34) (�2.23) (�2.15) (0.76) (0.81) (0.73)
Profitability �0.23 �0.29 �0.19 �0.15 �0.13 �0.10 �19.01 �18.98 �19.53
(�0.69) (�0.81) (�0.55) (�0.86) (�0.84) (�0.55) (�1.20) (�1.13) (�1.17)
S&P airline 0.01 0.01 0.01 �0.02 �0.02 �0.02 �0.15 �0.14 �0.16
credit rating (0.56) (0.47) (0.55) (�1.94) (�2.14) (�1.88) (�0.36) (�0.33) (�0.36)
Redeployability 0.08 0.09 �1.04
(aircraft)*1000 (1.90) (2.72) (�1.32)
Redeployability 0.001 0.001 �0.01
(operators) (1.92) (2.65) (�1.39)
Redeployability 0.002 0.002 �0.03
(X5 aircraft) (1.63) (2.34) (�1.44)
Year fixed effects Yes Yes Yes Yes Yes Yes Yes Yes Yes
Airline fixed effects Yes Yes Yes Yes Yes Yes Yes Yes Yes
Adjusted R2 0.90 0.90 0.90 0.93 0.93 0.93 0.56 0.56 0.56
Observations 207 207 207 76 76 76 230 230 230
Unit of observation tranche tranche tranche issue issue issue tranche tranche tranche
E. Benmelech, N.K. Bergman / Journal of Financial Economics 91 (2009) 339–360 355
where LTVIj;a;t is the issue loan-to-value ratio of issue (j),
airline (a), and year (t). Since this specification is run atthe issue level, it does not include tranche covariates ascontrols.
It should be noted that tranche characteristics such asloan-to-value, maturity, call provisions, and tranche sizeare endogenous and jointly determined at the time of theissue. Thus, ideally one would like to utilize an instru-mental variable approach to estimate the economicimpact of each of these variables. However, since thesedebt facets are jointly determined, this complicates theuse of an instrumental variable. Nevertheless, our speci-fications allow us to understand the cross-correlationsbetween asset redeployability and tranche characteristicsin the data.23
The results of regressions (3) and (4) are reported incolumns 1 through 6 of Table 10. Consistent with
23 See Benmelech, Garmaise, and Moskowitz (2005) and Qian and
Strahan (2007) for similar approaches.
Hypothesis 3, we find a robust positive relation betweenloan-to-value ratios and collateral redeployability both atthe tranche level and the issue level. Collateral pools withhigher asset redeployability are associated with higherdebt capacity. The coefficients of the redeployabilitymeasures in the two specifications are quite similar,although the coefficients in the issue-level specificationhave higher statistical significance, reflecting the debtcapacity of the entire collateral pool.24 The economicsignificance implied by the coefficients is sizeable. Movingfrom the 25th to 75th percentile of our redeployabilitymeasures increases loan-to-value ratios by between 9 and13 percentage points. This corresponds to an increase ofbetween 14% and 21% of the mean tranche loan-to-valueratio, and between 13% and 19% of the mean issue loan-to-value ratio. Panel C of Table 11 summarizes theeconomic impact of redeployability on debt capacity
24 We thank an anonymous referee for suggesting this test and its
interpretation.

ARTICLE IN PRESS
Table 11Economic significance of collateral redeployability.
Predicted changes in the dependent variables as each redeployability measure varies (i) by one standard deviation, (ii) from the 25th percentile to the
75th percentile, (iii) from the 10th percentile to the 90th percentile. Panel A reports level changes basis points (bp) and percentage changes relative to the
sample spread mean (in parentheses). Panel B reports marginal effects of changes in credit rating category probability associated with one standard
deviation move, and their corresponding percentage change relative to the sample mean (in parentheses) in the redeployability measures. Panel C reports
changes in LTV as well as percent changes relative to the sample LTV mean (in parentheses). The results are computed using the specifications in Tables 6,
8 and 9.
Standard deviation 25th–75th Percentile 10th–90th Percentile
Panel A: Credit spread
Redeployability (aircraft) �40.5 bp �64.2 bp �99.5 bp
(�20.4%) (�32.3%) (�50.0%)
Redeployability (operators) �35.7 bp �52.2 bp �85.8 bp
(�18.0%) (�26.3%) (�43.2%)
Redeployability (X5 aircraft) �38.3 bp �58.0 bp �93.9 bp
(�19.3%) (�29.2%) (�47.2%)
qProb½rating ¼ AAþ�=qx qProb½rating ¼ A�=qx qProb½rating ¼ BBBþ�=qx
Panel B: Credit rating
x ¼ Redeployability (aircraft) 0.02 �0.01 �0.05
(25.6%) (�6.9%) (�35.7%)
x ¼ Redeployability (operators) 0.02 �0.01 �0.05
(25.6%) (�6.9%) (�35.7%)
x ¼ Redeployability ðX5 aircraftÞ 0.03 �0.01 �0.06
(38.4) (�6.9%) (�42.9%)
Standard deviation 25th–75th Percentile 10th–90th Percentile
Panel C: Loan-to-value
Redeployability (aircraft) 0.071 0.113 0.176
(11.6%) (18.4%) (28.5%)
Redeployability (operators) 0.091 0.133 0.218
(14.7%) (21.5%) (35.3%)
Redeployability (X5 aircraft) 0.060 0.091 0.147
(9.7%) (14.7%) (23.9%)
E. Benmelech, N.K. Bergman / Journal of Financial Economics 91 (2009) 339–360356
across redeployability measures. Senior tranches havelower loan-to-values by construction; a decrease of onelevel of tranche seniority increases cumulative loan-to-value ratios by 10 percentage points. Finally, at the issue-level specification (Table 10, columns 4–6), we find thathigher airline market-to-book ratios and lower S&P airlinecredit ratings are associated with lower loan-to-valueratios. Similar to our previous analysis, we also examinewhether airline industry-wide conditions affect the rela-tion between collateral redeployability and loan-to-valueratios but we find no evidence that industry conditionsaffect loan-to-value ratios.
We next turn to test the relation between assetredeployability and debt maturity. We estimate regression(5) at the tranche level and not at the issue level sincedifferent tranches within the same issue have differentmaturities (see Table 1):
Maturityi;a;t ¼ b� Redeployabilityi;a;t þ Xi;a;tcþ Za;t�1d
þ cthþ bawþ ui;a;t , (5)
where Maturityi;a;t is the maturity of tranche i of airline a
in year t. All control variable are defined as in regression(4). The results are presented in columns 7 through 9 ofTable 10. While we find that lower seniority tranches areassociated with shorter maturities, we do not find a
statistically significant relation between redeployabilityand tranche maturity. Thus, the evidence in our sample ofairline asset-backed securities does not support Hypoth-esis 4. Our results differ from the findings in Benmelech(2009), and Benmelech, Garmaise, and Moskowitz (2005),who find that higher liquidation values are associatedwith longer-term debt. One potential explanation for whymaturity is not correlated with redeployability in ourpaper is that senior tranches tend to have longermaturities than mezzanine or subordinated tranches.The average maturity of senior tranches is 17.1 yearscompared to 13.9 years in mezzanine tranches and 10.5 injunior tranches. If creditors are willing to supply long-term debt only when their tranches are senior, and if ourseniority control variable does not fully control for this, itis possible that the seniority effect will dominateredeployability in determining tranche maturity. More-over, both Benmelech (2009) and Benmelech, Garmaise,and Moskowitz (2005) study ‘balloon loans’ that requiresubstantial principal payment at the end of the term ofthe loan—which is consistent with models of debtmaturity that assume zero-coupon debt. However, similarto residential mortgages, EETCs are amortized and hence,most of the principal of the loan is already paid by thetime of the legal maturity date. In summary, while we donot find a relation between tranche maturity and asset

ARTICLE IN PRESS
Table 12Robustness test: controlling for loan-to-value.
The dependent variable in the regressions is credit spread (in basis points) over its corresponding treasury yield. Loan-to-value is the cumulative loan-
to-value (LTV) at the tranche level. Seniority is the tranche seniority ð1 ¼ most seniorÞ. Private is a dummy variable that equals one for private placement
tranches. Tranche size is the logarithm of the dollar value (in $ millions) of the tranche. Call provision is a dummy variable that equals one if the tranche is
callable. Maturity is the number of years until the final payment. Airline size is the logarithm of the book value of the airline assets. Market-to-book is
calculated as the market value of equity minus the book value of equity, all over the book value of assets. Profitability is defined as operating income over
assets. S&P airline credit rating is the airline long-term credit rating. Redeployability (aircraft) is the number of aircraft per type; Redeployability
(operators) is the number of operators per type; Redeployability (X5 aircraft) is the number of operators who operate at least five aircraft per type. All
regressions include an intercept (not reported) and both year and airline fixed effects. t-statistics are calculated using standard-errors that are clustered by
airline and reported in parentheses.
Dependent Credit Credit Credit Credit Credit Credit
variable ¼ spread spread spread spread spread spread
Loan-to-value 108.21 110.14 108.98 349.12 364.96 343.61
(0.72) (0.74) (0.74) (2.00) (2.03) (2.00)
Seniority 45.02 44.93 44.87 18.04 16.36 18.36
(7.28) (7.32) (7.38) (1.62) (1.39) (1.63)
Private 38.23 36.12 36.25 36.25 24.18 29.75
(3.23) (3.16) (3.15) (2.99) (1.72) (2.54)
Tranche size 0.40 0.99 0.86 2.34 3.92 2.80
(0.05) (0.12) (0.10) (0.29) (0.45) (0.34)
Call provision 66.00 64.96 65.20 55.81 55.69 58.78
(3.25) (3.13) (3.07) (4.34) (4.15) (3.53)
Maturity 0.16 0.11 0.08 0.26 0.09 0.16
(0.09) (0.06) (0.04) (0.13) (0.04) (0.08)
Airline size �15.67 �16.48 �16.56 179.35 174.68 152.11
(�1.60) (�1.64) (�1.68) (2.72) (2.31) (2.29)
Market-to-book 17.53 19.60 19.23 94.32 107.13 84.20
(0.72) (0.78) (0.81) (2.90) (2.91) (2.99)
Profitability �210.25 �213.64 �210.24 �342.78 �332.10 �418.18
(�2.11) (�2.09) (�2.05) (�1.58) (�1.55) (�1.84)
S&P airline 7.32 7.31 7.19 2.23 2.14 1.37
credit rating (1.76) (1.76) (1.76) (0.51) (0.40) (0.35)
Redeployability �0.016 �0.10
(aircraft) (�2.98) (�4.49)
Redeployability �0.145 �0.83
(operators) (�3.15) (�3.07)
Redeployability �0.457 �2.34
(X5 aircraft) (�3.75) (�4.03)
Year fixed effects Yes Yes Yes Yes Yes Yes
Airline fixed effects No No No Yes Yes Yes
Adjusted R2 0.63 0.63 0.63 0.68 0.68 0.68
Observations 203 203 203 203 203 203
E. Benmelech, N.K. Bergman / Journal of Financial Economics 91 (2009) 339–360 357
redeployability in our sample, these results may bespecific to EETCs or other debt instruments with amor-tized payments.
5.6. Redeployability and credit spreads controlling for LTV
Having shown that loan-to-value ratios are increasingin our measures of collateral redeployability and are henceendogenous, we now examine whether the relationbetween tranche credit spreads continues to hold evenafter controlling for tranche loan-to-value. Since assetredeployability may increase debt capacity, our redeploy-ability measures may be capturing, in part, variations inleverage ratios, which in turn have a direct effect on creditspreads. Since increased loan-to-value ratios tend toincrease credit spreads, our previous estimates of theimpact of redeployability on credit spreads may beunderestimated (i.e., Harris and Raviv, 1990). We thusestimate the following regression:
Spreadi;a;t ¼ b� Redeployabilityi;a;t þ l� LTVi;a;t þ Xi;a;tc
þ Za;t�1dþ cthþ bawþ xi;a;t , (6)
where Spread is the tranche credit spread above thecorresponding treasury yield on the issue date, Redeploy-
ability is one of our three measures of the redeployabilityof the aircraft portfolio serving as collateral for eachtranche, LTV is the tranche cumulative loan-to-value ratio,Xi;a;t is a vector of tranche covariates, Za;t is a vector ofairline controls, ct is a vector of year fixed effects, ba is avector of airline fixed effects (included in the last threecolumns of the table), and xi;a;t is the regression residual.Regressions are run under OLS, and robust standard errorsare clustered by airline and reported in parentheses. Sincewe do not have tranche loan-to-value ratios for all thetranches in our data, our number of observations drops to203.
We report the results from estimating regression (6) inTable 12. First, we find that when including airline fixedeffects, increased loan-to-value is associated with highertranche credit spreads. The economic magnitude of theeffect is quite large, with a standard deviation increase incumulative loan-to-value ratios increasing credit spreadsby between 51 and 54 basis points in the specificationwith airline fixed effects, representing 26% of the mean

ARTICLE IN PRESS
E. Benmelech, N.K. Bergman / Journal of Financial Economics 91 (2009) 339–360358
spread. While having the right sign, cumulative loan-to-value is not statistically significant in determining creditspreads when airline fixed effects are not included. Thecoefficients on the other control variables in Table 12 areconsistent with our previous findings.
As Table 12 demonstrates, collateral redeployability isconsistently negatively related to credit spreads, evenafter controlling for tranche cumulative loan-to-valueratios. As expected, since debt capacity should bepositively related to collateral redeployability, controllingfor cumulative loan-to-value ratios generally increases theeconomic and statistical significance of our results ascompared to those found in Table 6. We find that in thespecification without airline fixed effects, moving fromthe 25th to the 75th percentile in our three redeploy-ability measures reduces tranche credit spreads byapproximately 20 basis points, representing a decreaseof 10% relative to the mean spread. Controlling for airlinefixed effects increases the economic significance of thisresult, with a 25th to 75th percentile movement in theredeployability measures reducing spreads by between106 and 126 basis points, representing between 53% and63% of the mean spread.
It should be noted that, as argued earlier, even theseestimates of the effect of redeployability on credit spreadsmay be understated. Since credit spreads in our sampleare calculated as of the issue date of the secured debt, thevalue of collateral is priced based on the expectedprobability of liquidation at the time of issue. As theprobability of default and liquidation increases, the effectof redeployability on prices will increase. Put differently,for the many airlines which post-ETC or EETC issueexperienced financial distress, the estimates in Table 12represent a lower bound on the effect of redeployabilityon subsequent credit spreads.25
6. Conclusion
In this paper we analyze the effect of collateral on thecost of debt capital and other aspects of debt financing.Theories based on borrower moral hazard and limitedpledgeable income predict that collateral increases theavailability of credit and reduces its price by limiting thedownside risk born by creditors. Upon default, creditorscan obtain at least a portion of the return on theirinvestment through the repossession and liquidation ofpledged collateral.
Testing these theories is complicated by the veryselection problem which they imply: creditors willdemand collateral precisely from those borrowers whoare riskier. This selection problem leads to a positiverelation in the data between the presence of collateral andloan yields. Analyzing the extensive margin of collateraluse, therefore, masks the hypothesized negative impactthat collateral exhibits on debt yields.
We analyze the intensive, rather than extensive,margin of collateral use. We assemble a novel data set of
25 Unfortunately, since we do not have data on yields in the
secondary market, we cannot test this prediction directly.
secured credit issued by U.S. airlines which use aircraft ascollateral. We proxy for the ease at which creditors will beable to liquidate collateral upon default by constructingmeasures of aircraft redeployability. We then test therelation between collateral redeployability and creditspreads, credit rating, loan-to-value ratios, and debtmaturity, and estimate its economic significance.
We find a negative relation between tranche creditspreads and expected collateral values. Increased aircraftredeployability is thus associated with cheaper credit ascreditors’ downside risk upon default is reduced. Ourresults also show that debt tranches that are secured bymore redeployable collateral exhibit higher Moody’s andS&P credit ratings as well as higher loan-to-value ratios.We find no relation between redeployability and debtmaturity. Taken together, our results suggest that theability to pledge collateral, and in particular, collateralwhich is more redeployable, eases financial frictions,lowers the cost of external financing, and increases debtcapacity.
Appendix A. Ordered probit construction
Following Blume, Lim, and Mackinlay (1998) we use alatent variable model assuming that a latent variable y� isdetermined by
y� ¼ Xbþ z, (A.1)
where X includes one of our three measures of theredeployability of the aircraft portfolio serving as collat-eral for each tranche, a vector of tranche covariates,a vector of airline controls, and vector of year fixedeffects, and z is a standard normal random variable.Let a1oa2o � � �oaJ�1 be the unknown cut points, anddefine
Tranche ratingM;Si;a;t ¼
1 if y�pa1;
2 if a1oy�pa2;
� �
� �
� �
J if y�4aJ�1;
8>>>>>>>>><>>>>>>>>>:
where J ¼ 21 for Moody’s rating and J ¼ 22 in the case ofS&P rating. Given the standard normal assumption forzi;a;t , we derive the conditional distribution of the tranchecredit rating:
PrðTranche ratingM;Si;a;t ¼ jjXÞ
¼
Uða1 � XbÞ if j ¼ 1;
Uðaj � XbÞ �Uðaj�1 � XbÞ if 1ojoJ;
1�UðaJ�1 � XbÞ if j ¼ J;
8>><>>:
where Uð�Þ is the standard normal cumulative distributionfunction (Table A1).
ARTICLE IN PRESS
Table A1Redeployability and airline characteristics.
The dependent variable in the regressions is one of three redeployability measures: Redeployability (aircraft) is the number of aircraft per type;
Redeployability (operators) is the number of operators per type, Redeployability (X5 aircraft) is the number of operators who operate at least five aircraft
per type. Airline size is the logarithm of the book value of airline assets. Profitability is defined as operating income over assets. Leverage is defined as total
debt divided by total assets. Interest coverage is defined as operating earnings before depreciation divided by interest expense. S&P airline credit rating is
the airline long-term credit rating. All regressions include an intercept (not reported) and year fixed effects. Also reported are the p-values of F-tests for
the joint significance of the explanatory variables (excluding year fixed effects). t-statistics are calculated using standard errors that are clustered by
airline and reported in parentheses.
Panel A: Dependent variable: Redeployability (# of aircraft)
Airline size �212.00 �197.68
(�0.70) (�0.92)
Profitability 3780.45 1661.08
(1.31) (0.65)
Leverage 558.35 1589.76
(0.31) (0.94)
Interest coverage 386.33 208.80
(1.03) (0.76)
S&P airline �107.11 �107.56
credit rating (�1.05) (�1.20)
F-test (p-value) 0.407
Adjusted R2 0.21 0.26 0.18 0.23 0.23 0.340
Observations 225 225 223 225 225 225
Panel B: Dependent variable: Redeployability (# of operators)
Airline size �24.90 �22.12
(�0.74) (�0.93)
Profitability 415.07 148.13
(1.22) (0.51)
Leverage 32.65 173.69
(0.16) (0.89)
Interest coverage 53.84 38.07
(1.28) (1.19)
S&P airline �12.58 �10.61
credit rating (�1.08) (�0.98)
F-test (p-value) 0.339
Adjusted R2 0.21 0.22 0.19 0.21 0.24 0.29
Observations 225 245 225 225 225 225
Panel C: Dependent variable: Redeployability (# of operators with 45 aircraft)
Airline size �8.58 �7.95
(�0.76) (�0.99)
Profitability 143.02 58.59
(1.31) (0.64)
Leverage 13.91 55.04
(0.21) (0.91)
Interest coverage 15.97 0.06
(1.17) (0.91)
S&P airline �4.12 �3.95
credit rating (�1.08) (�1.31)
F-test (p-value) 0.377
Adjusted R2 0.23 0.26 0.16 0.25 0.25 0.36
Observations 225 225 225 225 225 225
E. Benmelech, N.K. Bergman / Journal of Financial Economics 91 (2009) 339–360 359
References
Aghion, P., Bolton, P., 1992. An incomplete contracts approach to financialcontracting. Review of Economic Studies 59, 473–494.
Benmelech, E., 2009. Asset salability and debt maturity: evidence fromnineteenth-century American railroads. Review of Financial Studies,forthcoming.
Benmelech, E., Bergman, N., 2008. Liquidation values and the credibilityof financial contract renegotiation: evidence from U.S. airlines.Quarterly Journal of Economics 123, 1635–1677.
Benmelech, E., Garmaise, M., Moskowitz, M., 2005. Do liquidation valuesaffect financial contracts? Evidence from commercial loan contractsand zoning regulation. Quarterly Journal of Economics 120,1121–1154.
Berger, A., Udell, G., 1990. Collateral, loan quality and bank risk. Journal ofMonetary Economics 25, 21–42.
Berger, A., Udell, G., 1995. Relationship lending and lines of credit insmall firm finance. Journal of Business 68, 351–382.
Berglof, E., von Thadden, E., 1994. Short-term versus long-term interests:capital structure with multiple investors. Quarterly Journal ofEconomics 109, 1055–1084.
Besanko, D., Thakor, A., 1987a. Collateral and rationing: sorting equilibriain monopolistic and competitive credit markets. InternationalEconomic Review 28, 671–689.
Besanko, D., Thakor, A., 1987b. Competitive equilibria in the creditmarket under asymmetric information. Journal of Economic Theory42, 167–182.
Bester, H., 1985. Screening vs. rationing in credit markets with imperfectinformation. American Economic Review 75, 850–855.
Blume, M., Lim, F., Mackinlay, C., 1998. The declining credit qualityof U.S. corporate debt: myth or reality. Journal of Finance 53,1389–1413.

ARTICLE IN PRESS
E. Benmelech, N.K. Bergman / Journal of Financial Economics 91 (2009) 339–360360
Boot, A., Thakor, A., Udell, G., 1991. Secured lending and default risk:equilibrium analysis, policy implications and empirical results. TheEconomic Journal 101, 458–472.
Booth, J., 1992. Contract costs, bank loans, and the cross-monitoringhypothesis. Journal of Financial Economics 31, 25–41.
Chan, Y., Kanatas, G., 1985. Asymmetric valuation and the role ofcollateral in loan agreements. Journal of Money, Credit and Banking17, 85–95.
Chan, Y., Thakor, A., 1987. Collateral and competitive equilibria with moralhazard and private information. Journal of Finance 42, 345–364.
Eisfeldt, A., Rampini, A., 2009. Leasing, ability to repossess, and debtcapacity. Review of Financial Studies, forthcoming.
Gavazza, A., 2006. Asset liquidity, boundaries of the firm and financialcontracts: evidence from aircraft leases. Working paper, YaleUniversity.
Harhoff, D., Korting, T., 1998. Lending relationships in Germany—empi-rical evidence from survey data. Journal of Banking and Finance 22,1317–1353.
Harris, M., Raviv, A., 1990. Capital structure and the informational role ofdebt. Journal of Finance 46, 321–349.
Hart, O., 1995. Firms, Contracts, and Financial Structure. OxfordUniversity Press, Oxford.
Hart, O., Moore, J., 1994. A theory of debt based on the inalienability ofhuman capital. Quarterly Journal of Economics 109, 841–879.
Hart, O., Moore, J., 1998. Default and renegotiation: a dynamic model ofdebt. Quarterly Journal of Economics 113, 1–41.
Hester, D., 1979. Customer relationships and terms of loans. Journal ofMoney, Credit and Banking 11, 349–357.
Jimenez, G., Salas, J., Saurina, J., 2006. Determinants of collateral. Journalof Financial Economics 81, 255–281.
John, K., Lynch, A., Puri, M., 2003. Credit rating, collateral and loancharacteristics: implications for yield. Journal of Business 76,371–409.
Johnson, H., Stulz, R., 1985. An analysis of secured debt. Journal ofFinancial Economics 14, 501–522.
Knox, K., 2005. Essays in financial economics. Unpublished Ph.D. Thesis,Harvard University.
Littlejohns, A., McGairl, S., 1998. Aircraft Financing, third ed. EuromoneyPublications, England.
Morrell, P., 2001. Airline Finance, second ed. Ashgate Publishing Ltd.,England.
Qian, J., Strahan, P., 2007. How law and institutions shape financialcontracts: the case of bank loans. Journal of Finance 62, 2803–2834.
Rampini, A., Viswanathan, S., 2008. Collateral, financial intermediation,and the distribution of debt capacity. Working paper, DukeUniversity.
Shleifer, A., Vishny, R., 1992. Liquidation values and debt capacity: amarket equilibrium approach. Journal of Finance 47, 143–166.
Street, D., 1959. Railroad Equipment Financing. Columbia UniversityPress, New York.
Tirole, J., 2005. The Theory of Corporate Finance. Princeton UniversityPress, Princeton, NJ.
Williamson, O., 1988. Corporate finance and corporate governance.Journal of Finance 43, 567–591.
Wooldridge, J., 2001. Econometric Analysis of Cross Section and PanelData. MIT Press, Cambridge, MA.