Collateral Effects of a Family-focused Behavioral Intervention · Collateral Effects of a...
76
Collateral Effects of a Family-focused Behavioral Intervention on Physical Activity by Jenna Rudo-Stern A Thesis Presented in Partial Fulfillment of the Requirements for the Degree Master of Arts Approved January 2015 by the Graduate Supervisory Committee: Thomas Dishion, Chair Sharlene Wolchik Leona Aiken ARIZONA STATE UNIVERSITY May 2015
Transcript of Collateral Effects of a Family-focused Behavioral Intervention · Collateral Effects of a...

Collateral Effects of a Family-focused Behavioral Intervention
on Physical Activity
by
Jenna Rudo-Stern
A Thesis Presented in Partial Fulfillment
of the Requirements for the Degree
Master of Arts
Approved January 2015 by the
Graduate Supervisory Committee:
Thomas Dishion, Chair
Sharlene Wolchik
Leona Aiken
ARIZONA STATE UNIVERSITY
May 2015
i
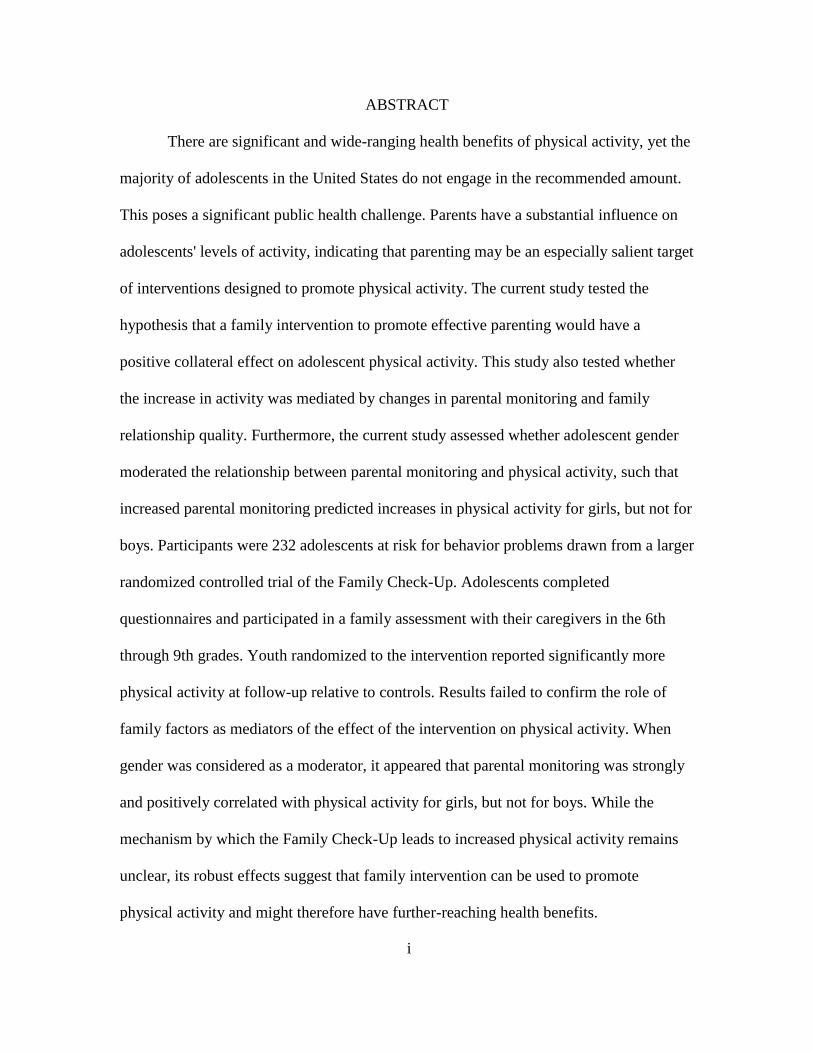
ABSTRACT
There are significant and wide-ranging health benefits of physical activity, yet the
majority of adolescents in the United States do not engage in the recommended amount.
This poses a significant public health challenge. Parents have a substantial influence on
adolescents' levels of activity, indicating that parenting may be an especially salient target
of interventions designed to promote physical activity. The current study tested the
hypothesis that a family intervention to promote effective parenting would have a
positive collateral effect on adolescent physical activity. This study also tested whether
the increase in activity was mediated by changes in parental monitoring and family
relationship quality. Furthermore, the current study assessed whether adolescent gender
moderated the relationship between parental monitoring and physical activity, such that
increased parental monitoring predicted increases in physical activity for girls, but not for
boys. Participants were 232 adolescents at risk for behavior problems drawn from a larger
randomized controlled trial of the Family Check-Up. Adolescents completed
questionnaires and participated in a family assessment with their caregivers in the 6th
through 9th grades. Youth randomized to the intervention reported significantly more
physical activity at follow-up relative to controls. Results failed to confirm the role of
family factors as mediators of the effect of the intervention on physical activity. When
gender was considered as a moderator, it appeared that parental monitoring was strongly
and positively correlated with physical activity for girls, but not for boys. While the
mechanism by which the Family Check-Up leads to increased physical activity remains
unclear, its robust effects suggest that family intervention can be used to promote
physical activity and might therefore have further-reaching health benefits.
ii
ACKNOWLEDGMENTS
I wish to express my sincere appreciation for the way in which my graduate
adviser, Dr. Thomas Dishion, has shared with me his vision, enthusiasm, and belief in the
importance of the work we do and his commitment to engage in research that benefits
society as a whole. I am deeply grateful to Dr. Leona Aiken for her generous and
thoughtful guidance through the data analytic process. It is an honor to benefit from her
instruction, and I hold enormous respect for her as both a scientist and teacher. I would
like also to thank Dr. Sharlene Wolchik for asking important questions, for providing
valuable feedback, and for encouraging me along the way. I feel incredibly fortunate to
have such a powerful team of thinkers overseeing my academic growth and development.
In addition to the guidance and support provided by the members of my thesis committee,
I have also had the distinct pleasure of puzzling my way through this project with the
help of Hanjoe Kim, Dr. J. D. Smith, Charlotte Winter, Dr. Danielle Shore, and
Michaeline Jensen. I appreciate your generosity, patience, knowledge, and insight; thank
you. I offer my thanks also to Jake Heckathorn, who gave his unflagging support
throughout the research and writing process. I would like also to acknowledge that data
used in this study was collected for research supported by National Institute on Drug
Abuse grant DA007031, awarded to Dr. Thomas Dishion.
iii
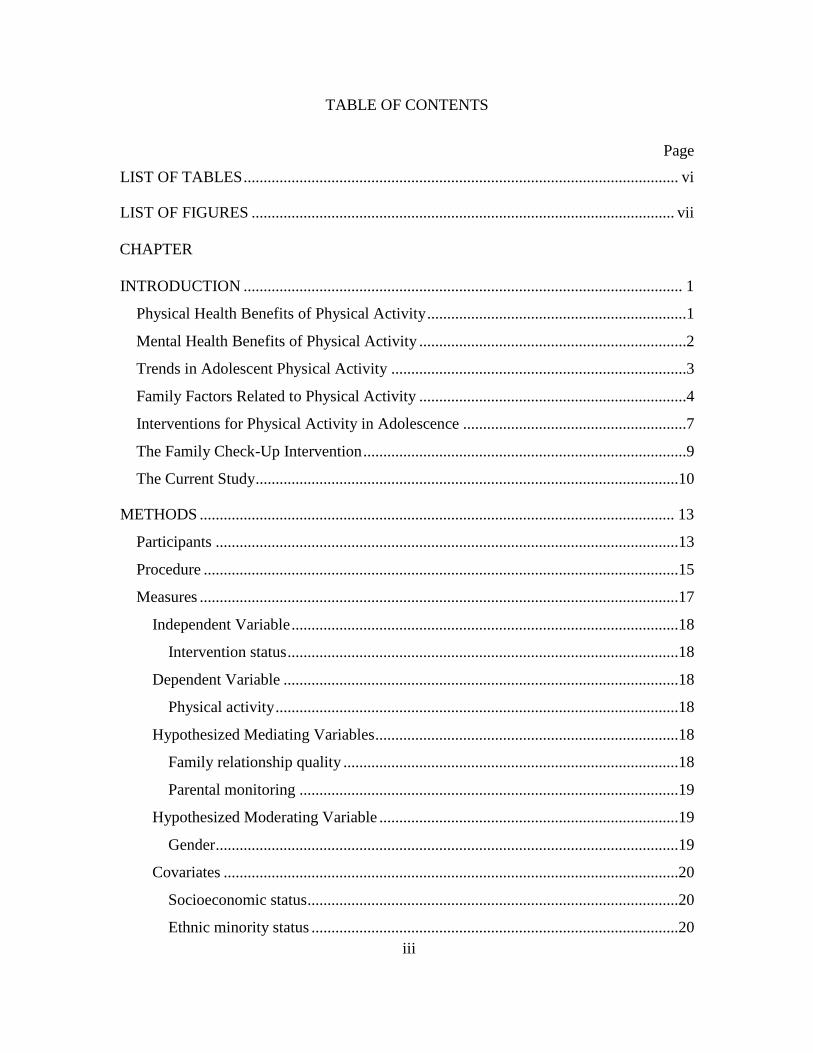
TABLE OF CONTENTS
Page
LIST OF TABLES ............................................................................................................. vi
LIST OF FIGURES .......................................................................................................... vii
CHAPTER
INTRODUCTION .............................................................................................................. 1
Physical Health Benefits of Physical Activity .................................................................1
Mental Health Benefits of Physical Activity ...................................................................2
Trends in Adolescent Physical Activity ..........................................................................3
Family Factors Related to Physical Activity ...................................................................4
Interventions for Physical Activity in Adolescence ........................................................7
The Family Check-Up Intervention .................................................................................9
The Current Study ..........................................................................................................10
METHODS ....................................................................................................................... 13
Participants ....................................................................................................................13
Procedure .......................................................................................................................15
Measures ........................................................................................................................17
Independent Variable .................................................................................................18
Intervention status ..................................................................................................18
Dependent Variable ...................................................................................................18
Physical activity .....................................................................................................18
Hypothesized Mediating Variables ............................................................................18
Family relationship quality ....................................................................................18
Parental monitoring ...............................................................................................19
Hypothesized Moderating Variable ...........................................................................19
Gender ....................................................................................................................19
Covariates ..................................................................................................................20
Socioeconomic status .............................................................................................20
Ethnic minority status ............................................................................................20

iv
CHAPTER Page
Other Baseline Characteristics ...................................................................................20
Teacher risk assessment .........................................................................................21
Family conflict .......................................................................................................22
Antisocial behavior ................................................................................................23
Age .........................................................................................................................23
Substance use .........................................................................................................23
Number of adults and children in the home ...........................................................23
DATA ANALYSIS ........................................................................................................... 23
Correlational Analyses ...................................................................................................24
Hierarchical Regressions ...............................................................................................24
Path Analysis of the Full Model ....................................................................................25
RESULTS ......................................................................................................................... 26
Sample statistics .............................................................................................................26
Family Check-Up and Physical Activity .......................................................................26
Family Relationship Quality and Physical Activity ......................................................28
Parental Monitoring and Physical Activity ....................................................................28
Family Check-Up and Family Relationship Quality .....................................................29
Family Check-Up and Parental Monitoring ..................................................................30
Mediation and Moderated Mediation Analyses .............................................................32
Family relationship quality ........................................................................................32
Parental monitoring ...................................................................................................33
Gender ........................................................................................................................33
Family relationship quality for FCU participants ......................................................34
DISCUSSION ................................................................................................................... 34
REFERENCES ................................................................................................................. 39
APPENDIX ....................................................................................................................... 62
A MEASURES ..............................................................................................................62
Youth Report of Physical Activity ............................................................................63

v
Page
Youth Report of Family Relationship Quality ...........................................................63
Youth Report of Parental Monitoring ........................................................................64
Teacher Report of Youth Risk Status ........................................................................65

vi
LIST OF TABLES
Table Page
1. Sample Characteristics .................................................................................................. 47
2. Zero-order Correlations ................................................................................................ 48
3. Path Coefficients of the Full Model, Family Relationship Quality .............................. 49
4. Path Coefficients of the Full Model, Parental Monitoring ........................................... 50
5. Path Coefficients of the Moderated Mediation Model,
Parental Monitoring and Gender .................................................................................. 51
6. Path Coefficients, Family Relationship Quality, Received the FCU Vs. Controls....... 52
7. Path Coefficients, Family Relationship Quality, Received the FCU Vs. Controls....... 53

vii
LIST OF FIGURES
Figure Page
1. Conceptual Model ....................................................................................................... 54
2. Consort table ............................................................................................................... 55
3. Intervention Model...................................................................................................... 56
4. Mediation Model, Family Relationship Quality ......................................................... 57
5. Mediation Model, Parental Monitoring ...................................................................... 58
6. Moderated Mediation Model, Parental Monitoring and Gender ................................ 59
7. Interaction of Gender and Parental Monitoring Predicting Physical Activity ............ 60
8. Mediation Model, Family Relationship Quality, Received FCU vs. Controls ........... 61

1
Introduction
There are significant and wide-ranging health benefits of physical activity, yet the
majority of adolescents in the United States do not engage in the recommended amount
of activity (Biddle et al., 2004). This poses a significant public health challenge. Parents
have a significant influence on adolescents’ levels of activity, indicating that parenting
may be an especially promising target for interventions to promote physical activity
(Sallis et al., 2000). By providing encouragement and instrumental support, parents may
increase their adolescent’s physical activity (Pugliese and Tinsley, 2007). Such
encouragement and support may be more likely to exist in an atmosphere characterized
by close family relationships and high levels of monitoring. This study examines whether
an intervention that targets parent behaviors and family factors results in a collateral
benefit on adolescents’ level of physical activity. If this hypothesis is supported,
interventions targeting parent behaviors and family factors could be adapted to explicitly
promote physical activity.
Physical Health Benefits of Physical Activity
There is substantial evidence to suggest that individuals who are more physically
active experience healthier and longer lives than do individuals leading a sedentary
lifestyle. In a review of the health benefits of physical activity and fitness, Blair, Cheng,
and Holder (2001) found that physical activity reduces the risk for cardiovascular disease,
colon cancer, and stroke in adults. Although the literature on the short- and long-term
health benefits of youth physical activity is mixed, the literature indicates that physical
fitness ought to be encouraged during adolescence (Biddle et al., 2004; Sallis and Patrick,

2
1994; Strong et al., 2005). Hallal, Victora, Azevedo, and Wells (2006) found that the
literature supports a link between physical activity in adolescence and physical activity in
adulthood, which contributes to subsequent good health and longevity. The short-term
health benefits of adolescent physical activity include higher levels of cardiorespiratory
fitness, lower body fat, lower blood pressure, and improved bone density (Biddle et al.,
2004; Hallal et al., 2006). Physical activity in adolescence also protects against
cardiovascular disease and obesity, which is associated with type II diabetes mellitus and
dyslipidemia during adolescence and with increased risk of various health conditions in
adulthood (Biddle et al., 2004). Evidence also suggests that physical activity in
adolescence has a preventive effect for breast cancer (Hallal et al., 2006). Furthermore,
sedentary behaviors (e.g., television-viewing) in adolescence are associated with poor
health in adulthood (Hancox et al., 2004; Landhuis et al., 2008; Thorp et al., 2011).
Mental Health Benefits of Physical Activity
In addition to benefiting physical health, evidence suggests that increased levels
of physical activity improve psychological well-being, especially increasing self-esteem
and reducing depression and anxiety (Biddle et al., 2004; Hallal et al., 2006).
Furthermore, engaging in recommended levels of exercise reduces symptoms of
depression in adults (Dunn et al., 2005). Meta-analyses find exercise therapy has positive
effects on depression and anxiety in youth (Larun et al., 2006). Exercise may benefit
mental health through several physiological and psychosocial mechanisms. First, physical
activity improves monoamine function and reduces HPA axis sensitivity to stress.
Second, it may distract from negative cognitions and emotions, and improve global and

3
domain-specific self-evaluations due to increased behavioral accomplishment. Finally,
because exercise is valued by society, exercise can lead to an increase in self-esteem
(Brosse et al., 2002).
Trends in Adolescent Physical Activity
In the 1990s, when data for this study were collected, national physical activity
guidelines recommended engaging in moderate physical activity for at least 30 minutes
per day on at least five days of each week and engaging in vigorous physical activity for
at least 20 continuous minutes on at least three days each week (Sallis and Patrick, 1994).
Population studies, such as the Youth Risk Behavior Survey (YRBS), indicate that, over
the past two decades, a substantial proportion of youth have not been meeting the
national guidelines (Biddle et al., 2004; Brownson and Boehmer, 2005; Eaton et al.,
2012; Eaton et al., 2010; Kann et al., 1996; Sallis et al., 2000). The YRBS conducted in
1995 found that over one-third (36.3%) of high school students throughout the United
States had not met the guideline regarding vigorous physical activity. Only 21.1% of
students nationwide had engaged in moderate activity, defined as walking or bicycling
for at least 30 minutes on five or more of the seven days preceding the survey. Because
self-report of activity may be less accurate than direct measures, Pate and colleagues
(2002) conducted a study using accelerometers to measure students’ physical activity and
compliance with these guidelines. They found that while over 90% of the students were
in compliance with the guideline regarding moderate activity, less than 3% of the
students met the recommendations regarding vigorous activity. The results of more recent
4
studies on youth physical activity confirm that adolescents continue to engage in less than
the recommended level of activity (Eaton et al., 2012; Eaton et al., 2010).
Certain socio-demographic factors are related to levels of adolescent physical
activity; these include ethnic minority status, socioeconomic status, and child gender.
One of the most consistent findings in the literature on adolescent physical activity is that
boys are more active than girls during adolescence (Eaton et al., 2012; Eaton et al., 2010;
Kann et al., 1996; Sallis et al., 2000; Van der Horst et al., 2007). Socioeconomic status
has been found to be positively correlated with physical activity in children, but may
exert less influence for adolescents (Gordon-Larsen et al., 2000; Sallis et al., 2000;
Taylor et al., 1994; Van der Horst et al., 2007). Socioeconomic status may influence
adolescents’ activity through exposure to sports and extramural activities, physical
education in school, proximity to safe and open spaces for recreation, and transportation
to and financial resources for physical activities. Ethnic minority status is consistently
associated with physical activity as well; specifically, non-Hispanic Whites have been
shown to be more active than other ethnic groups (Gordon-Larsen et al., 1999; Sallis et
al., 2000). On the other hand, ethnic minority youth are more likely to report engaging in
more moderate activity by walking or cycling, while non-Hispanic Whites report more
vigorous activity, in part because they are more likely to play on sports teams (Kann et
al., 1996).
Family Factors Related to Physical Activity
Given the numerous positive effects of moderate to high levels of physical
activity, the deleterious effects of low levels of physical activity, and the currently sub-
5
optimal levels of physical activity in the adolescent population, there is a pressing need
for interventions that promote physical activity in youth. In order to create an effective
intervention, it is important to first consider the determinants of physical activity in this
population from an ecological perspective (Dishion and Patterson, 1999).
Parental influence has been included in several models of youth physical activity
(Taylor et al., 1994; Trost et al., 2003; Welk, 1999). Social learning theory posits that
there is a reciprocal relationship between an individual’s behavior and his or her
environment and suggests that the family, as the primary unit of socialization, has a
foundational influence on children’s behaviors in multiple domains, including levels of
physical activity. Parents model physical activity, offer reinforcement and
encouragement for their child’s activity, and provide opportunities for physical activity
through transportation and payment of recreational fees. Sallis, Prochaska, and Taylor
(2000) found that parental encouragement and instrumental support were consistently and
positively related to adolescent physical activity. Similarly, a study of African American
girls found a positive relationship between parents’ support of their daughters’ physical
activity, their self-efficacy for engaging in physical activity with their daughter, and the
girls’ level of physical activity (Adkins et al., 2004). Furthermore, while modeling of
physical activity by parents may have an influence, parental support appears to be a more
important factor in promoting youth physical activity (Gustafson and Rhodes, 2006;
Sallis et al., 2000; Sallis et al., 2002; Trost et al., 2003; Welk et al., 2003).
While parent physical activity level and parental support for physical activity are
well studied, the influence of broader family factors – such as family cohesion, parent-
6
child relationship, and parent-child communication – on adolescent physical activity has
received less attention in the empirical literature. In the only study of its kind, Ornelas,
Perreira, and Ayala (2007) found that family cohesion, parent-child communication, and
parental engagement (not necessarily including shared physical activity) predicted higher
levels of youth vigorous physical activity assessed one year later. Another study found
that adolescent girls who reported having mothers with a more authoritative parenting
style (i.e. mothers who set high expectations and offer support) also reported being more
physically active (Schmitz et al., 2002). A different study found that boys with
authoritative fathers were more physically active five years following assessment than
were those who had reported a neglectful paternal parenting style (Berge et al., 2010). In
a study of overweight adolescents, higher levels of family connectedness and parental
expectations regarding exercise were associated with higher rates of weekly exercise
(Mellin et al., 2002). These findings suggest that an intervention focused on improving
family management and parent-child relationship quality might have a positive, collateral
effect on physical activity. Indeed, an RCT study of a behavioral family intervention
targeting parenting practices had a collateral beneficial effect on physical activity in
preschool-age children (Brotman et al., 2012). The mediating effects of changes in
parenting practices, however, were not studied.
There is reason to hypothesize that parenting practices targeted in family
interventions might be relevant to promoting physical activity. Sandler and colleagues
(2011) reviewed 46 experimental trials of parenting interventions, ten of which tested for
and showed mediation between randomly assigned interventions and changes in youth
7
behaviors. In the case of youth physical activity, it may be that closer family relationships
lead to increased activity as a family. Additionally, a good parent-child relationship may
increase children’s self-esteem, thereby encouraging greater activity. Alternatively,
increased monitoring may lead parents to involve their children in more organized
physical activities.
Research has demonstrated gender differences in parental monitoring. A number
of studies indicate that girls experience a higher level of parental monitoring than do boys
(Flannery et al., 1994; Li et al., 2000; Pettit et al., 2001). Additionally, boys’ and girls’
play activities have been shown to differ, with boys engaging in more physical and
rough-and-tumble play (DiPietro, 1981; King et al., 2010). Furthermore, boys are more
likely to play away from the home (and away from supervising adults) than girls and are
more likely to play team sports and other physically active games (Lever, 1976; Martin
and Fabes, 2001). It may be the case that boys who receive little parental monitoring are
already fairly physically active, such that increased monitoring does not lead to increased
physical activity for them. For girls, however, unsupervised social interactions may be
relatively sedentary and increased parental monitoring could lead to greater increases in
physical activity via engagement in supervised activities such as organized sports.
Interventions for Physical Activity in Adolescence
Family factors are known influences on adolescent physical activity (Biddle et al.,
2004), yet the vast majority of interventions designed to promote physical activity are
school-based and few include family components. In a systematic review of controlled
trials of interventions to promote physical activity in adolescents, Van Sluisj, McMinn,
8
and Griffin (2007) identified 24 such studies, only six of which included parent
participation. Two of these six interventions included a psychoeducational component for
parents, involving a single meeting about physical activity and how to support their
children (Haerens et al., 2006; Young et al., 2006). They also received supplementary
written materials (e.g., newsletters and suggested homework assignments). Only one
study (Nader et al., 1992) focused specifically on the family unit: families attended a
series of weekly 90-minute sessions on self-monitoring, goal-setting, problem-solving,
and supporting family members in making healthier food choices and engaging in
physical activity. This study found an effect on physical activity in a subset of the
sample. A more recent study employing a similar, family-focused intervention that
specifically targeted nutrition and exercise found significant intervention effects on
physical activity in the entire sample (Sacher et al., 2010). While few interventions
targeting physical activity have focused on the family, evidence for effectiveness is
strongest for interventions involving a family component (Kriemler et al., 2011; Van
Sluisj et al., 2007).
Despite the fact that family factors such as family cohesion, parent-child
communication, and shared activities predict physical activity (Ornelas et al., 2007), none
of the current interventions to promote youth physical activity target these psychosocial
family factors. Of the interventions described above that incorporate some level of parent
participation, most have relegated parent involvement to a peripheral role. Those
interventions that do address parent variables focus exclusively on parent support or
modeling of physical activity. In the current study, we propose to examine the effects of

9
the Family Check-Up – an intervention that targets psychosocial family factors – on
adolescent physical activity.
The Family Check-Up Intervention
The Family Check-Up (FCU) is an intervention that takes an ecological approach
to improving children’s behaviors across settings by targeting family management
practices and communication (Dishion and Stormshak, 2007). The FCU was originally
designed to prevent adolescents on a high-risk trajectory (e.g., school drop-out, substance
use, early sexual debut, delinquency) from continuing on that path. The intervention aims
to draw parents’ attention to their adolescent’s antisocial behavior and their own linked
family management practices (Dishion and Kavanagh, 2003; Dishion and Stormshak,
2007).
The FCU follows an adaptive framework in which services are tailored to
participants’ needs. Some families receive more services than others, and some receive
more support in certain areas (e.g. monitoring daily activities) while others receive
intervention targeting a different component (e.g. positive communication). Such
adaptive interventions, responsive to differing needs in terms of content and intensity, are
expected to yield more positive outcomes, decrease negative intervention effects, and
increase the efficiency of the intervention (Collins et al., 2004).
The FCU is the product of a series of intervention studies. Initially, a component
of the intervention had parents of high-risk adolescents meet as a group. A focus on
family management in these parent groups reduced observed coercive parent-adolescent
interactions, adolescent antisocial behavior at school, and adolescent tobacco use

10
(Dishion and Andrews, 1995; Dishion et al., 1996). It was revealed that changes in
coercive parent-adolescent interactions mediated intervention effects on problem
behavior (Dishion et al., 1992). Later interventions honed in on parenting practices such
as monitoring, limit-setting, and positive behavior support. Studies showed that changes
in parental monitoring mediated reductions in adolescent substance use (Dishion et al.,
2003). Family factors such as family conflict and relationship quality were also targeted.
While youth in high-risk families who did not engage in the FCU reported a steep
increase in family conflict over time, conflict in families who received the intervention
remained relatively stable (Van Ryzin et al., 2012). Similarly, an intention-to-treat
analysis showed that youth-report of relationship quality in families assigned to the
intervention group declined less sharply over time than it did in control families (Van
Ryzin and Nowicka, 2013). These demonstrated effects on parenting practice and other
family factors by the Family Check-Up, and the relationship between these factors and
physical activity, suggest that the Family Check-Up could have an effect on physical
activity.
The Current Study
The current study seeks to replicate the findings of Brotman and colleagues
(2012) that an intervention targeting family management can have a collateral positive
effect on physical activity, extending these findings to adolescents and also exploring the
role of parenting factors as mediators of this effect. The current study tests the hypothesis
that the Family Check-Up improves parental monitoring and family relationship quality
and results in a collateral benefit on adolescents’ physical activity (see Figure 1). Data are

11
drawn from a randomized trial targeting family and individual risk factors for antisocial
behavior and substance use. While the FCU does not specifically target physical activity,
it does target parenting factors that may contribute to this outcome.
It may also be the case that gender moderates the effect of parental monitoring on
physical activity. During leisure time, boys engage in more physical activities than do
girls (King et al., 2010; Lever, 1976). Girls are also more likely to experience higher
levels of parental monitoring than are boys (Flannery et al., 1994; Li et al., 2000; Pettit et
al., 2001). It may be the case that boys, unsupervised and left to their own devices, are
already relatively active. In this case, increased parental monitoring is unlikely to lead
boys to greater levels of physical activity. On the other hand, girls who are left
unsupervised and not actively encouraged to participate in physical activities are more
likely to engage in relatively sedentary social activities such as going to a movie or
“hanging out” (King et al., 2010). For girls, it may be that an increase in parents’ desire
to monitor their daughters may lead them to encourage their daughters to participate in
structured sports or other supervised physical activities.
This study adds to the literature on family-focused intervention and physical
activity in several important ways. First, the collateral benefits of a family-based
intervention targeting parenting factors – such as relationship quality and parental
monitoring – on adolescents’ physical activity levels are tested. Second, family
relationship quality and parental monitoring are tested as mediators of the effect of the
intervention on physical activity. Third, gender is tested as a moderator of the effect of

12
parental monitoring on physical activity, such that parental monitoring more strongly
predicts physical activity for girls than for boys.
It is notable that this study addresses physical activity in early adolescence, as this
is a time when physical activity tends to decline (Eaton et al., 2012; Eaton et al., 2010;
Kann et al., 1996; Pate et al., 2002; Sallis, 2000). Furthermore, the sample is
predominantly of low socioeconomic status, which has been associated with lower levels
of activity compared to adolescents of higher socioeconomic status (Sallis et al., 1996).
Physical activity and parenting factors (parental monitoring and relationship
quality) were measured, at staggered time points, at baseline (represented in Figure 2 as
6th
Grade School Assessment and 7th
Grade Family Assessment and identified in the
study data files as Wave 1) and two years after group assignment to the FCU or to middle
school as usual (represented in Figure 2 as 8th
Grade School Assessment and 9th
Grade
Family Assessment and identified in the study data files as Wave 3). Intervention effects
on these variables, controlling for baseline levels of these variables and of covariates, are
tested. Additionally, the hypothesized relationship between physical activity and each
parenting factor is tested. A mediation analysis to establish the role of parenting factors in
the intervention effect on youth physical activity is also proposed.
The specific hypotheses are:
1. The Family Check-Up will result in greater levels of adolescent-reported
physical activity assessed two years after study enrollment.
2. Parenting factors (i.e. relationship quality and parental monitoring) will
mediate the intervention effect on adolescent physical activity.

13
3. Gender will moderate the relationship between parental monitoring and youth
physical activity.
Methods
Participants
Data for the current study was drawn from a larger, multi-wave, randomized
controlled trial of the FCU referred to as Project Alliance 1 (Dishion and Kavanagh,
2003). The study enrolled 6th
grade students from three urban and ethnically diverse
middle schools in the Pacific Northwest. A first cohort (n = 674) was recruited and then a
second cohort (n = 324) was recruited two years later. All participants were assessed for
risk of future behavior problems and identified as belonging to a low, moderate, or high
risk group based on a teacher-rating measure of child conduct problems in the school
arena (Soberman, 1995). Teacher ratings of child conduct problems have been shown to
be among the most sensitive instruments for predicting child behavior problems (Loeber
and Dishion, 1983).
Only the moderate- or high-risk participants of the first cohort were assessed for
physical activity at two-year follow-up.1 For this reason, only data from the moderate- or
high-risk families in the first cohort were considered for inclusion in this analysis. Sixty-
two percent of these families eligible for inclusion in the present study agreed to
participate in a family assessment at baseline. Only these families, for whom there is
baseline data on physical activity, were included in the present analysis (N = 232).
Participation rates for these families are presented in Figure 2.
1 Funding shortfalls led to dropping the family assessments for the second cohort in the 9
th grade.

14
The target middle schools were chosen based on their profile of serving families
primarily of low socioeconomic status. Parents of all 6th
grade students from these three
middle schools were approached for participation and more than 90% consented. The
study paid students $20 for completing the initial school assessment and/or returning the
consent form whether or not consent was given. Participating families provided
information on parent employment status, parent education level, gross annual income,
financial aid received, and level of housing. This information was used to assess the
socioeconomic status of the sample and confirmed that the majority of participating
families were classified as low socioeconomic status. The families included in this
analysis reported yearly family income ranging from less than $5,000 to more than
$90,000, with median income in the range of $25,000–$29,999. The highest reported
education for a caregiver for each family ranged from less than 7th
grade to a graduate or
professional degree, with 1-3 years of college the median highest reported level of
caregiver education. Forty-four families (19%) in the sample reported receiving food
stamps.
Participating adolescents and their families were randomized at the individual
level to the FCU group or to a middle school as usual control condition. Seventy-eight
percent of the families included in this analysis participated in the two-year follow-up
family assessment.
Of the at-risk subsample used for this study, 117 students were randomly assigned
to the intervention condition and 115 students were assigned to the control group.
Families were told of their intervention status following the 7th
Grade Family Assessment

15
and those in the intervention group were invited back to receive feedback on the
assessment and could opt for additional services. Of the total subsample, 113 were male
and 119 were female; mean age of the adolescent at first assessment was 12.20 years (SD
= .36) (referred to here as 6th
Grade School Assessment), 12.82 years (SD = .39) at the 7th
Grade Family Assessment, 14.01 years (SD = .38) at the 8th
Grade School Assessment,
and 14.94 years (SD = .39) at the 9th
Grade Family Assessment. Child reported
racial/ethnic background of the subsample was representative of the Portland area at the
time the study was conducted: 90 (38.8%) European American, 97 (41.8%) African
American, 3 (1.3%) Native American, 10 (4.3%) Hispanic/Latino, 2 (0.9%) Asian
American, and 21 (9.1%) other or multiple ethnicities.
Procedure
This Project Alliance intervention trial was designed as a multilevel approach to
support middle-school families living in high-risk neighborhoods, with the goal of
preventing the onset of adolescent problem behaviors (Dishion and Kavanagh, 2003). At
the universal level, families had access to a family resource center that provided
parenting resources, referrals, and general information. Staff at the family resource center
provided brief consultations and delivered feedback to parents about their student’s
school performance and classroom behavior.
The select level of intervention used in this study was the Family Check-Up. The
Family Check-Up is comprised of three sessions potentially followed with further parent
management training. In the first session of the Family Check-Up, the therapist took a
motivational interviewing approach to learn more about the challenges the family was

16
facing and to increase their interest in behavior change and motivation to participate in
the family assessment. The second session was used to gather more information about the
family via a multi-method, ecological assessment comprised of questionnaires and direct
observation tasks (a member of the research team videotaped the family in the home
engaging in structured interaction tasks). Finally, parents participated in a feedback
session in which they discussed with the therapist the results of the assessment and
strategized for positive change, potentially through further involvement in intervention
services. For this third session, the therapist employed a motivational interviewing
approach (Miller and Rollnick, 2002) with the object of ascertaining whether the family
would want to engage in the third level of the intervention (i.e., further intervention
services) to receive more support and guidance for changing their family management
practices.
Additional intervention typically consisted of parent management training skills
consistent with the Everyday Parenting curriculum (e.g., monitoring, limit-setting,
problem solving, and positive behavior support) (Dishion et al., 2011) and could also
have included school or community-based programs. Figure 3 illustrates the progression
of the selected and indicated interventions.
Families participating in the study who left the school but who remained in the
same county were still offered FCU services. The control group had access to existing
school-based services, such as access to a school counselor or psychologist. Of the
families assigned to receive the intervention and included in this analysis, 26 (22%) had
no contact with an interventionist, 16 (14%) had limited contact with an interventionist

17
(e.g., by phone or at the family resource center), and 75 (64%) participated in the FCU
and received feedback anytime during middle school. The 75 families who received
feedback had a minimum of 30 minutes of in-person contact with an interventionist and a
maximum of just over 53 hours of contact (3,200 minutes). On average, families who
received the Family Check-Up met with an interventionist approximately 9 hours in total
(547.87 minutes), over the course of two years, with a standard deviation of 576.45
minutes (or just over 9 hours). Interventionists categorized their contact with families in
one or more of the following ways: problem-solving support, behavioral change program,
parent group, school meeting, and information. Of the 75 families who received the
Family Check-Up, 71 received support, 21 participated in a behavioral change program,
51 participated in a parent group, 13 participated in a school meeting, and all 75 received
information.
Questionnaires were given annually in the spring semester from the sixth through
eighth grades (ages 12-14) to the target child of the participating families in the schools.
Surveys were distributed to students in the schools as part of the School Assessment, with
the at-risk and high-risk subsample – evenly divided into the intervention and control
groups – receiving an extended assessment at a later time point as part of the Family
Assessment.
Measures
Table 1 shows the sample size, minimum, maximum, mean, standard deviation,
skewness, and kurtosis for each of the variables included in the model, and for the
intervention and control groups separately.

18
Independent Variable.
Intervention status. For families assigned to the intervention group, intervention
status was coded as 1. For families assigned to the control group (i.e., middle school as
usual), intervention status was coded as 0.
Dependent Variable.
Physical activity. A single item from the Physical Activity subscale of the Child
Health and Illness Profile – Adolescent Edition (Starfield et al., 1994; Starfield et al.,
1995) was used to assess physical activity (i.e., “In the past 4 weeks, on how many days
did you exercise or play sports hard enough to make you breathe hard, make your heart
beat fast, or make you sweat for 20 minutes or more?”) The guidelines for physical
activity at the time of data collection (in the 1990s) recommended that youth get at least
20 minutes per day of moderate to vigorous physical activity on three or more days each
week (Sallis and Patrick, 1994).
Hypothesized Mediating Variables.
Family relationship quality. Adolescents’ relationship with their parents was
assessed using youth report on a subscale of the Community Action for Successful Youth
(Metzler et al., 1998) in the sixth and eighth grades. We created a composite score by
averaging across six items that capture the degree to which family members share
positive affect, mutual regard, and enjoyable activities (e.g., “My parents and I have
gotten along very well with each other,” “There was a feeling of togetherness in our
family,” “The things we did together were fun and interesting”). Responses ranged from
1 (never true) to 5 (always true). Scale reliability (measured by Cohen’s alpha) was .89 at
19
baseline and .90 at two-year follow-up. Metzler and colleagues (1998) demonstrated
evidence of test-retest reliability and showed that the scale is predictive of antisocial
behavior, association with deviant peers, and substance use. In another study, this
measure was shown to predict health-related behaviors, maladaptive eating attitudes, and
depression (Van Ryzin and Nowicka, 2013).
Parental monitoring. Youth reports of parental monitoring were measured by
averaging across five items drawn from the CASY (Metzler et al., 1998). Items reflected
youth perception of how often a parent knows his or her whereabouts, activities, and
plans. This scale was part of the adolescent self-report assessments administered in the
sixth and eighth grades. Responses ranged from 1 (never true) to 5 (always true). Metzler
and colleagues (1998) computed composite reliability – scale reliability across three
measurement time points – for the parental monitoring scale and found composite
reliability = .90. They also found that the parental monitoring scale showed good
convergent validity with other parenting constructs and good discriminant validity with
parent-child relationship constructs. Good criterion validity was determined using a
model containing the following three criterion variables: associations with deviant peers,
antisocial behavior, and substance use. Scale reliability was .85 at baseline and .87 at
two-year follow-up.
Hypothesized Moderating Variable.
Gender. Information on gender was collected at baseline and based on youth self-
report. (51% of the sample used in this study is female.) Male was coded as 1 and female
as 0.

20
Covariates.
Socioeconomic status. Socioeconomic status (SES) was calculated using parental
employment status, parental education, family housing status, family income, and
financial aid status, with the highest level between two caretakers chosen when data were
available for both. Financial aid status was computed based on whether the family was
receiving food stamps, assistance through the Social Security Act and Aid to Dependent
Children (ADC), other welfare (not ADC), medical assistance, or Social Security death
benefits. Each item was standardized to have a mean of 0 and a standard deviation of 1.
The average of these z-scores was then computed to create an SES score. Internal
consistency of this scale was good (alpha = .73 for baseline SES scores for Cohort 1).
Ethnic minority status. Information on ethnic and racial background was
collected at baseline on the youth self-report questionnaires. European American was
coded as 1 and any other ethnicity was coded as 0.
Other Baseline Characteristics. The sample used in this study was drawn from a
larger study of prevention of problem behavior. To assure that baseline characteristics of
the participants did not bias the longitudinal findings, differences between the control and
intervention groups on several risk factors for problem behavior were tested. The Teacher
Risk Assessment has been shown to have a significant correlation with both parent and
student assessment of drug use (Soberman, 1995). Prior research has demonstrated a
relationship between the Family Conflict scale and antisocial behavior, deviant peer
involvement, and alcohol use (Smith et al., 2014; Van Ryzin and Dishion, 2012).
Antisocial behavior has been shown to correlate with juvenile arrest records (Gardner et
21
al., 2008). Age is related to risky behavior, with adolescents engaging in more risky
behavior than those younger or older, and was included in the analysis of baseline
characteristics (Steinberg, 2007). Substance use itself is considered a problem behavior
and is one of the primary targeted outcomes of the Family Check-Up prevention program.
The number of adults and number of children in the home were also included, as these
variables have been associated with family stress and compromised parental monitoring
(Patterson et al., 1992).
Teacher risk assessment. The Teacher Risk Assessment (TRISK) is a teacher
report of youth behavior on 16 items pertaining to classroom behavior, attitude toward
school, negative mood, peer relationship problems, and tobacco use. Responses ranged
from 1 (never, almost never; equivalent to low risk) to 5 (always, almost always;
equivalent to high risk). Reliability for the scale was .95 for the full PAL1 sample.
The TRISK has been shown to have good test-retest reliability (Soberman, 1995).
The lowest stability has been found for items regarding family stress and substance use,
possibly due to teachers’ lack of information regarding these issues relative to things such
as academic behavior and internalizing and externalizing behaviors at school (Soberman,
1995). Among high-risk students, the total risk score from the TRISK has been shown to
correlate with total scores from teacher and parent reports on Achenbach’s Child
Behavior Checklist. Similarly, students with no risk factors on the TRISK were shown to
have lower overall scores on these other instruments (Soberman, 1995). Moreover,
despite relatively low test-retest stability on the Drug Use subscale, teachers’ rating on
this subscale of the TRISK correlated with parent and student assessment of drug use on

22
other measures (i.e., teachers could differentiate drug users and nonusers) (Soberman,
1995). This instrument was deemed an appropriate measure for assigning students to risk
categories for tiered data collection.
Originally, the plan was to assign students to a risk group according to simple cut-
off scores. For the first cohort, the decision rules for assigning a risk category were: if the
TRISK score was 3 or higher, then the student was classified as being “high-risk”; if the
student’s smoking score was 3 or higher, then the student was automatically assigned to
the high-risk group; if the TRISK score was 1.5 to 2.99, then the student was classified as
“at-risk”. In the first year of the study, however, it was discovered that this procedure
yielded primarily ethnic minority males in the at-risk groups. The procedure was changed
in order to approximate the gender and ethnic distribution in each school. For the second
cohort, 15 males and 15 females with the highest TRISK scores from each school and
each intervention condition were assigned to the high-risk group; all remaining students
with risk scores above 1 were designated “at-risk”. All students with a drug risk score of
1 were automatically assigned to the high-risk group. The adjustment to the risk-
assignment procedure meant that males and females were deemed to be at moderate- and
high-risk relative to the norms of each school and demographic group. The rationale for
this change was the desire to give youth of either gender or ethnic minority status equal
access to intervention services (Dishion et al., 2003).
Family conflict. Youths’ reports of conflicts with parents were measured by
averaging across five items drawn from the CASY (Metzler et al., 1998). These items
reflected the frequency with which family members engaged in conflict behaviors during

23
the past month (e.g., “got angry with each other” and “argued at the dinner table”).
Responses ranged from 0 (never) to 7 (more than seven times). FCU intervention effects
on this measure have been demonstrated to be related to antisocial behavior, deviant peer
involvement, and alcohol use (Smith et al., 2014; Van Ryzin et al., 2012). Internal
consistency of this scale was good in the full sample (alpha = .81).
Antisocial behavior. A composite score of antisocial behavior was computed
across nine items measuring the frequency with which the participant has engaged in
behaviors such as lying, stealing, and physical violence in the past month. This measure
has been shown to correlate with juvenile arrest records (Gardner et al., 2008). The
internal consistency of this scale was good in the full sample (alpha = .83).
Age. Youth reported their date of birth and the date of assessment. From this
information, age at each time of assessment was calculated (in months).
Substance use. Youth reported on their substance use in the last month (i.e.,
number of cigarettes smoked, number of times used chewing tobacco or snuff, number of
drinks of alcohol, number of times smoked marijuana or hashish, and number of times
used stimulants). These items were drawn from the CASY (Metzler et al., 1998).
Number of adults and children in the home. Parents reported at baseline on a
demographics questionnaire the number of adults and the number of children who live in
their home.
Data Analysis
Sample statistics, correlations, and hierarchical regressions were computed using
SPSS Version 20. The full model was tested using an intention-to-treat analysis in a path

24
analysis framework with the software program Mplus (Muthén and Muthén, 1998-2012).
In order to test the hypotheses, zero-order and partial correlations were computed and
hierarchical regressions and path analysis were conducted.
Correlational Analyses
Correlational analyses were performed to assess the strength and direction of the
bivariate relationships between the parenting and physical activity outcomes and
intervention status. The zero-order correlations among the variables are presented in
Table 3. None of the variables were more than moderately correlated when examined for
the full sample in the current study.
Correlations involving intervention status were estimated first at an intention-to-
treat level, then comparing the control group with families in the intervention group who
had any level of contact with an interventionist, and then comparing the control group
with families in the intervention group who received the FCU including feedback.
Hierarchical Regressions
The following hypotheses were further tested through hierarchical regression: 1)
the intervention will predict physical activity, 2) family relationship quality and parental
monitoring will predict physical activity, 3) the intervention will predict family
relationship quality and parental monitoring. In order to test the first and third of the
above hypotheses, hierarchical regressions were conducted by first including a set of
predictors including baseline levels of the criterion and demographic factors (i.e., gender,
SES, and ethnic minority status), then adding intervention status to test whether it would
account for variation in the criterion over and above the covariates. In order to test the

25
second hypothesis – that the parenting factors will predict physical activity – physical
activity at follow-up was regressed on baseline physical activity, gender, SES, and ethnic
minority status. The parenting factor was next added to this model to see whether it
accounted for variation in physical activity over and above the covariates. Hierarchical
regressions were conducted first at the intention-to-treat level and then for a subsample
including only families who received the Family Check-Up and families in the control
group.
Path Analysis of the Full Model
Finally, an intention-to-treat analysis of the full model in a path-analysis
framework was conducted using Mplus 7.1 (Muthén and Muthén, 1998-2012). For this
analysis, maximum likelihood estimation with robust standard errors (MLR) was used.
When data are missing completely at random (MCAR), meaning that the reason a piece
of data is missing is independent of both the observed variables and unobserved
parameters of interest and occurs at random, MLR provides unbiased estimates (MCAR;
Little and Rubin, 2002). MLR is also an appropriate approach for treating a data set that
contains both non-normally distributed and missing data (Muthén and Asparouhov,
2002). Because MLR works with endogenous variables only, the intercorrelations of all
the variables measured at baseline were specified, such that these covariates were
considered in the treatment of missing data.

26
Results
Sample statistics
Table 2 shows the results of independent t-tests run on each of the variables in the
study, comparing the means of the intervention and control groups. The only variable for
which there was a significant difference between the groups was baseline physical
activity, t(230) = 2.54, p = .012, with the control group demonstrating higher physical
activity than the intervention group. To control for any baseline differences, baseline
variables are included in the model as covariates.
Family Check-Up and Physical Activity
The Family Check-Up was hypothesized to result in greater levels of adolescent
physical activity. In order to test for this proposed positive association between the
intervention and physical activity, partial correlations were computed, with variance due
to baseline physical activity – which was significantly different between the control and
intervention groups – partialed out. At the intention-to-treat level, intervention status was
reliably correlated with physical activity; intervention status was associated with
increased physical activity (r = .145, p = .052, n = 182). When the intervention group
included only the families who had some level of contact with an interventionist,
intervention status was significantly correlated with family relationship quality (r = .175,
p = .025, n = 165). When the intervention group included only the families who
participated in the FCU and received feedback, intervention status was significantly
correlated with physical activity (r = .184, p = .024, n = 152). These correlations

27
indicated a small association between participation in the intervention and subsequent
physical activity (Cohen, 1988).
Next, hierarchical regressions were conducted to further test whether the Family
Check-Up would result in greater levels of adolescent-reported physical activity assessed
two years after study enrollment. This analysis was conducted at the intention-to-treat
level. First, physical activity at two-year follow-up was regressed on the baseline level of
physical activity and the proposed demographic covariates (i.e., gender, SES, and ethnic
minority status). This set of predictors accounted for 11.1% of the variation in physical
activity in the sample (adjusted 𝑅2 = .111). Baseline physical activity and gender were
the significant predictors in this set, with reported p-values of .002. Next, intervention
status was added to the model. It accounted for a significant proportion of variation in
physical activity over and above the covariates, F change (1,176) = 3.890, p = .050, and
adjusted 𝑅2 = .126. As expected, when this same analysis was conducted on a subsample
including only families assigned to the intervention group who received the Family
Check-Up and all control families, participation in the Family Check-Up contributed to
variation in physical activity over and above the covariates, F change (1, 146) = 5.994, p
= .016, and adjusted 𝑅2 = .139. These findings lend support to the hypothesis that the
intervention will result in higher levels of physical activity. When path analysis was
conducted for the full mediational and moderated mediational models, this finding was
repeated in each of the three models tested as well as in a fourth, post-hoc analysis (path
coefficients are reported in Tables 4-7). The intervention appears to have a positive
collateral effect on youth physical activity.

28
Family Relationship Quality and Physical Activity
Family relationship quality was hypothesized to predict physical activity. A zero-
order correlation was computed to test for a positive relationship between these two
variables. Family relationship quality and physical activity were significantly correlated
(r = .161, p = .035, n = 172). In order to further test whether family relationship quality
might predict adolescent physical activity, hierarchical regression was conducted. To
begin, physical activity was regressed on the baseline level of physical activity and the
set of demographic covariates, along with intervention status. This set of predictors
accounted for 13.2% of the variation in physical activity in the sample (adjusted 𝑅2 =
.132). Baseline physical activity, gender, and intervention status were the significant
predictors in this set, with reported p-values of < .001, .003, and .031, respectively. Next,
family relationship quality was added to the model. It did not account for a significant
proportion of variation in physical activity over and above intervention status and other
covariates, F change (1, 165) = 2.199, p = .140, and adjusted 𝑅2 = .139. When the path
from family relationship quality to physical activity was tested in the full mediation
model, it was not significant. These paths are reported in Table 4. The results do not
support the hypothesis that family relationship quality predicts youth physical activity.
Parental Monitoring and Physical Activity
Parental monitoring was hypothesized to predict physical activity. Parental
monitoring and physical activity were not significantly correlated (r = .088, p = .251, n =
172). When hierarchical regressions were conducted, using the full sample, the addition
of parental monitoring to a model already including baseline physical activity, gender,
29
SES, and ethnic minority status as predictors of physical activity did not account for a
significant amount of variation in the criterion over and above the contributions of the
first set of predictors, F change (1, 165) = 2.070, p = .152, and adjusted 𝑅2 = .137. When
the path from parental monitoring to physical activity was tested in the full mediational
model, it was small and not statistically significant. (Path coefficients for the model are
reported in Table 5.) When gender was included as a moderator, the path from parental
monitoring to physical activity became substantive and statistically significant. This
moderated mediational model is reported in greater detail below and represented in
Figure 6, with path coefficients reported in Table 6. The results do not support the
hypothesis that parental monitoring predicts all youth physical activity. It appears that
parental monitoring predicts physical activity in girls but not in boys.
Family Check-Up and Family Relationship Quality
The Family Check-Up was hypothesized to result in improved youth-reported
family relationship quality. A positive relationship between the intervention and family
relationship quality was tested first by computing zero-order correlations. At the
intention-to-treat level, intervention status was not significantly correlated with family
relationship quality (r = .050, p = .475, n = 208). When the intervention group included
only the families who had some level of contact with an interventionist, intervention
status was not significantly correlated with family relationship quality (r = .068, p = .352,
n = 187). When the intervention group included only the families who participated in the
Family Check-Up, receiving the intervention was not significantly correlated with family
relationship quality (r = .110, p = .150, n = 173). In sum, the intervention did not
30
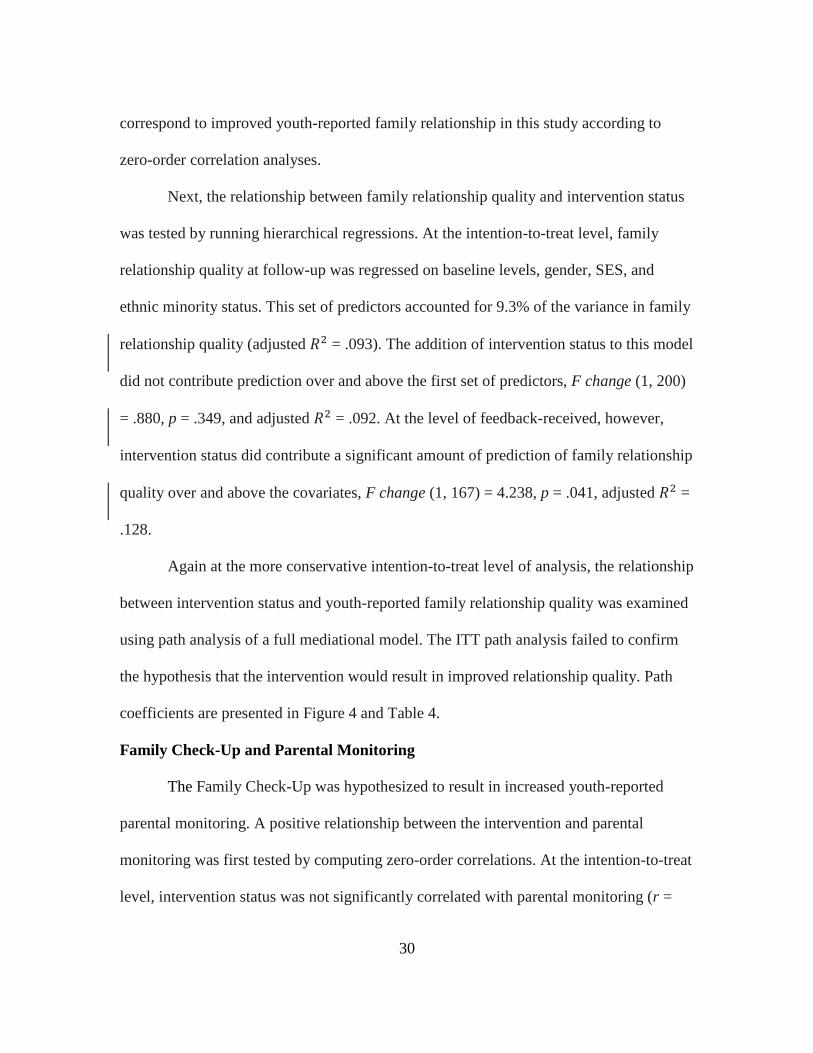
correspond to improved youth-reported family relationship in this study according to
zero-order correlation analyses.
Next, the relationship between family relationship quality and intervention status
was tested by running hierarchical regressions. At the intention-to-treat level, family
relationship quality at follow-up was regressed on baseline levels, gender, SES, and
ethnic minority status. This set of predictors accounted for 9.3% of the variance in family
relationship quality (adjusted 𝑅2 = .093). The addition of intervention status to this model
did not contribute prediction over and above the first set of predictors, F change (1, 200)
= .880, p = .349, and adjusted 𝑅2 = .092. At the level of feedback-received, however,
intervention status did contribute a significant amount of prediction of family relationship
quality over and above the covariates, F change (1, 167) = 4.238, p = .041, adjusted 𝑅2 =
.128.
Again at the more conservative intention-to-treat level of analysis, the relationship
between intervention status and youth-reported family relationship quality was examined
using path analysis of a full mediational model. The ITT path analysis failed to confirm
the hypothesis that the intervention would result in improved relationship quality. Path
coefficients are presented in Figure 4 and Table 4.
Family Check-Up and Parental Monitoring
The Family Check-Up was hypothesized to result in increased youth-reported
parental monitoring. A positive relationship between the intervention and parental
monitoring was first tested by computing zero-order correlations. At the intention-to-treat
level, intervention status was not significantly correlated with parental monitoring (r =

31
.067, p = .334, n = 208). When the intervention group included only the families who had
some level of contact with an interventionist, intervention status was not significantly
correlated with parental monitoring (r = .061, p = .405, n = 187). When the intervention
group included only the families who participated in the Family Check-Up, receiving the
intervention was not significantly correlated with parental monitoring (r = .093, p = .221,
n = 173). At none of the three levels of analysis were intervention status and parental
monitoring significantly correlated.
Next, the relationship between parental monitoring and intervention status was
tested by running hierarchical regressions. Parental monitoring at follow-up was
regressed on baseline levels, gender, SES, and ethnic minority status in an intention-to-
treat analysis. This set of predictors accounted for 24.3% of the variance in parental
monitoring (adjusted 𝑅2 = .242). The addition of intervention status to this model did not
contribute prediction over and above the first set of predictors, F change (1, 201) = .110,
p = .740, and adjusted 𝑅2 = .238. Including in the sample only those intervention families
who received feedback and all control families, intervention status again did not
contribute a significant amount of prediction of parental monitoring over and above the
covariates, F change (1, 167) = .545, p = .461, adjusted 𝑅2 = .277.
Next, path analysis was used to test the relationship between intervention status
and parental monitoring. This path was included in the full mediation model and in the
model moderated by gender. These ITT path analyses failed to confirm the hypothesis
that the intervention would result in increased youth-reported parental monitoring. These
path coefficients are presented in Figures 5 and 6 and Tables 5 and 6.

32
Mediation and Moderated Mediation Analyses
The lack of a positive relationship between intervention status and the parenting
factors of interest (i.e. relationship quality and parental monitoring) revealed that these
parenting factors might not mediate the intervention effect on adolescent physical
activity. While evidence of a significant bivariate correlation between the independent
and dependent variables is no longer a requirement to test hypotheses about indirect
effects, there must be evidence to suggest a significant path between the independent
variable and the mediator and between the mediator and the dependent variable (Hayes,
2009; MacKinnon, 2008). Intervention status did contribute a significant amount of
prediction of family relationship quality over and above the covariates in a hierarchical
regression conducted on only those in the intervention group who received the Family
Check-Up and the controls. There was also a significant zero-order correlation between
family relationship quality and physical activity. For this reason, as a post-hoc analysis
(beyond the scope of the ITT analysis), bootstrapping was later employed to test for
indirect effects in a mediational model.
Family relationship quality. Family relationship quality was hypothesized to
mediate the relationship between the intervention and physical activity. This mediational
model is shown in Figure 4. The path coefficients of this model are presented in Table 4.
Being assigned to the intervention group predicted a 2.7-day increase in physical activity
per month (p = .05). Because there was no significant relationship between intervention
status and family relationship quality, indirect effects were not tested.

33
Parental monitoring. Next, the hypothesis that parental monitoring would
mediate the intervention effect on physical activity was tested. This model is shown in
Figure 5. The path coefficients of this model are presented in Table 5. In this model,
being assigned to the intervention group predicted a similar increase (approximately 2.7
days) in physical activity per month (p = .05). Because there was no significant
relationship between intervention status and parental monitoring, we did not test for
indirect effects.
Gender. The effect of parental monitoring on physical activity was hypothesized
to be different for girls than for boys. A moderated mediation model was tested using an
interaction term of gender and parental monitoring that was included in the mediation
model by regressing physical activity on the interaction term. The path from the
interaction term (gender by parental monitoring) to physical activity was significant (β =
-.191, p = .024). The path from parental monitoring to physical activity was significant (β
= .221, p = .007). The path from intervention status to parental monitoring remained non-
significant (β = .021, p = .730). The path from intervention status to physical activity was
significant (β = .141, p = .033). The moderated mediation model for gender and parental
monitoring is shown in Figure 6. The interaction is displayed in Figure 7. Tests of
difference between the levels of physical activity across genders were examined at
different levels of parental monitoring. When parental monitoring is one standard
deviation above the mean, there are no gender differences in physical activity (b = 1.662,
p = .421); whereas when parental monitoring is one standard deviation below the mean,
girls are significantly less physically active than boys (b = 7.652, p < .001)(Aiken and

34
West, 1991). These findings indicate that, for boys, physical activity remains stable
across levels of parental monitoring; however, girls’ physical activity appears to be
higher when parental monitoring is higher.
Family relationship quality for FCU participants. Because family relationship
quality and physical activity were significantly correlated and because, at the level of
feedback-received vs. controls, intervention status did contribute a significant amount of
prediction of family relationship quality over and above the covariates, a post-hoc
analysis was conducted to test for indirect effects in the family relationship quality
mediation model, including in the analyses only those intervention families who received
the Family Check-Up and all families in the control condition. Using the model shown in
Figure 8, the analyses were run on this smaller subsample. The path coefficients from this
analysis are presented in Table 7. Being assigned to the intervention group predicted an
increase (approximately 3.7 days) in physical activity per month (p = .013). Receiving the
Family Check-Up feedback predicted an increase in family relationship quality (β =
0.148, p = .025). The indirect effect from receiving the intervention through family
relationship quality on physical activity was not significant (the 95% bootstrap
confidence interval based on 5000 bootstrap samples was -.250 to .850).
Discussion
The Family Check-Up was designed to promote effective family management
practices and has previously been shown to have a range of beneficial effects, such as
reductions in substance use, arrests, adolescent and maternal depression, and bullying and
improvements in grades and increased school attendance (Connell, 2009; Connell and

35
Dishion, 2008; Connell et al., 2007; Dishion et al., 2014; Dishion et al., 2003; Shaw et
al., 2009; Stormshak et al., 2009). The present study demonstrated that, among youth at
risk for behavior problems, this family-focused behavioral intervention had a collateral,
positive effect on physical activity in adolescence. Brotman and colleagues (2012)
conducted a randomized controlled study of a behavioral family intervention targeting
parenting practices and also found an unexpected effect of the family-based intervention
on physical activity in preschool-age children. The present study replicated and extended
these findings to adolescents. This study also extended the findings of Smith and
colleagues (Smith et al., In press) that the Family Check-Up has unintended collateral
benefits on physical health behaviors and indicators, specifically nutritional value of
meals and BMI, in childhood. These findings are consistent with models that emphasize
the role of parenting in the promotion of physical health (Repetti et al., 2002).
This study sought to identify the parenting factors that mediate the relationship
between an intervention that targets parenting practice and its effects on physical activity.
Family relationship quality and parental monitoring were hypothesized to predict
physical activity. While family relationship quality was correlated with physical activity,
it did not appear to uniquely predict, when controlling for other covariates, change in
physical activity. Parental monitoring was similarly unrelated to physical activity until
gender was included as a moderator. Once gender was considered, it appeared that
parental monitoring was strongly correlated with physical activity for girls, but not for
boys. This finding has implications about gender differences in unsupervised activities

36
and also suggests that interventions targeting physical activity in girls benefit from
addressing parental guidance and monitoring.
While the Family Check-Up has been shown to have positive intervention effects
on both parental monitoring and family relationship quality, these effects were not
apparent in the current study (Dishion et al., 2003; Van Ryzin and Nowicka, 2013). This
discrepancy may be due to the different developmental period, subsample used, and the
measure of parental monitoring. When only the intervention families who received the
Family Check-Up were compared to families in the control condition, however, receiving
the Family Check-Up did contribute to variance in family relationship quality above and
beyond baseline levels and covariates. In their analyses of intervention effects on parental
monitoring, Dishion and colleagues (2003) used direct observation of the parental
monitoring construct, which may be a more sensitive measure than youth report. Van
Ryzin and Nowicka (2013) studied the effect of the Family Check-Up on family
relationship quality. While they employed the same measure as used in the present study,
they looked at a broader developmental time span, focusing on change in family
relationship quality over four time points, and used the full Project Alliance sample.
These differences in measurement might explain the null findings of the present study
regarding intervention effects on family relationship quality and parental monitoring.
While the mechanism by which the Family Check-Up leads to increased
adolescent physical activity remains unclear, its robust effects suggest that behavioral
family intervention can be used to promote physical activity and might therefore have
further-reaching health benefits. It is possible that such an approach could be applied to
37
broadly defined populations, or its effectiveness may be limited to families of adolescents
at risk for behavior problems.
While the physical activity promotion effects of the Family Check-Up are
promising, findings should be interpreted in light of limitations. It is important to note
that the Family Check-Up was not designed to affect physical activity. Another limitation
of this study was that the measures of parenting mediators were not originally intended to
capture family factors specifically relevant to physical activity. It may also be the case
that the family factors examined here (i.e., parental monitoring and family relationship
quality) are not the key factors that influence physical activity. For example, future study
might examine the relationship of positive behavior support as a mediator for the effects
of parenting interventions on physical activity. It may be the case that an intervention that
targets positive behavior support encourages parents to view their child’s physical
activity as a strength and build on that. Physical activity is widely known to be a positive,
healthy behavior and it may evoke relatively little emotional charge as a topic of
discussion between parents and youth whose relationship is otherwise strained. For these
reasons, it may be a primary topic that parents go to when trying to identify and praise
their adolescent’s positive behavior.
Further factors that could be considered in future study of family variables and
youth physical activity include the type of physical activity youth engage in and with
whom they are active, the type of transportation they use to get to and from activities, the
financial costs associated with their physical activities, and how much value their parents
place on physical activity. It will also be important to investigate whether these findings

38
that a family intervention can have an effect on physical activity hold when physical
activity is measured using accelerometry, which is the current “gold standard” measure of
youth physical activity (Wójcicki and McAuley, 2014).
The Family Check-Up was originally designed to prevent risky behaviors such as
substance use. Given that the intervention appears to have collateral beneficial effects on
healthy behaviors, such as physical activity, it seems reasonable to examine the impact of
the Family Check-Up on health practices and health status. Given a more direct focus on
these daily practices, larger effects might be observed on these positive outcomes. It is
also reasonable to hypothesize that a focus on positive daily behaviors like good sleep
hygiene, nutrition, and exercise will continue to have benefits for reducing problem
behaviors such as substance use and high risk sexual behavior. The question of whether
intervention that encourages healthy behaviors may result in a commensurate decrease in
risky behaviors deserves additional investigation.

39
REFERENCES
Adkins, S., N. E. Sherwood, M. Story, and M. Davis, 2004, Physical Activity among
African‐American Girls: The Role of Parents and the Home Environment:
Obesity research, v. 12, p. 38S-45S.
Aiken, L. S., and S. G. West, 1991, Multiple regression: Testing and interpreting
interactions, Sage.
Berge, J. M., M. Wall, K. Loth, and D. Neumark-Sztainer, 2010, Parenting style as a
predictor of adolescent weight and weight-related behaviors: Journal of
Adolescent Health, v. 46, p. 331-338.
Biddle, S. J., T. Gorely, and D. J. Stensel, 2004, Health-enhancing physical activity and
sedentary behaviour in children and adolescents: Journal of sports sciences, v. 22,
p. 679-701.
Blair, S. N., Y. Cheng, and J. S. Holder, 2001, Is physical activity or physical fitness
more important in defining health benefits?: Medicine and Science in Sports and
Exercise, v. 33, p. S379-S399.
Brosse, A. L., E. S. Sheets, H. S. Lett, and J. A. Blumenthal, 2002, Exercise and the
treatment of clinical depression in adults: Sports medicine, v. 32, p. 741-760.
Brotman, L. M., S. Dawson-McClure, K.-Y. Huang, R. Theise, D. Kamboukos, J. Wang,
E. Petkova, and G. Ogedegbe, 2012, Early childhood family intervention and
long-term obesity prevention among high-risk minority youth: Pediatrics, v. 129,
p. e621-e628.
Brownson, R. C., and T. K. Boehmer, 2005, Patterns and trends in physical activity,
occupation, transportation, land Use, and sedentary behaviors: Transportation
Research Board, v. 282.
Cohen, J., 1988, Statistical power analysis for the behavioral sciences: Hillsdale, N.J., L.
Erlbaum Associates.
Collins, L. M., S. A. Murphy, and K. L. Bierman, 2004, A conceptual framework for
adaptive preventive interventions: Prevention Science, v. 5, p. 185-196.
Connell, A. M., 2009, Employing complier average causal effect analytic methods to
examine effects of randomized encouragement trials: The American journal of
drug and alcohol abuse, v. 35, p. 253-259.

40
Connell, A. M., and T. J. Dishion, 2008, Reducing depression among at-risk early
adolescents: three-year effects of a family-centered intervention embedded within
schools: Journal of Family Psychology, v. 22, p. 574.
Connell, A. M., T. J. Dishion, M. Yasui, and K. Kavanagh, 2007, An adaptive approach
to family intervention: linking engagement in family-centered intervention to
reductions in adolescent problem behavior: Journal of consulting and clinical
psychology, v. 75, p. 568.
DiPietro, J. A., 1981, Rough and tumble play: A function of gender: Developmental
Psychology, v. 17, p. 50.
Dishion, T. J., and D. W. Andrews, 1995, Preventing escalation in problem behaviors
with high-risk young adolescents: Immediate and 1-year outcomes: Journal of
Consulting and Clinical Psychology, v. 63, p. 538.
Dishion, T. J., D. W. Andrews, K. Kavanagh, and L. H. Soberman, 1996, Preventive
interventions for high-risk youth: The Adolescent Transitions Program.
Dishion, T. J., L. M. Brennan, D. S. Shaw, A. D. McEachern, M. N. Wilson, and B. Jo,
2014, Prevention of problem behavior through annual family check-ups in early
childhood: intervention effects from home to early elementary school: Journal of
abnormal child psychology, v. 42, p. 343-354.
Dishion, T. J., and K. Kavanagh, 2003, Intervening in adolescent problem behavior: A
family-centered approach, Guilford Press.
Dishion, T. J., S. E. Nelson, and K. Kavanagh, 2003, The family check-up with high-risk
young adolescents: Preventing early-onset substance use by parent monitoring:
Behavior Therapy, v. 34, p. 553-571.
Dishion, T. J., and G. R. Patterson, 1999, Model building in developmental
psychopathology: A pragmatic approach to understanding and intervention:
Journal of Clinical Child Psychology, v. 28, p. 502-512.
Dishion, T. J., G. R. Patterson, and K. A. Kavanagh, 1992, An experimental test of the
coercion model: Linking theory, measurement, and intervention, in J. McCord,
and R. E. Tremblay, eds., Preventing antisocial behavior : interventions from birth
through adolescence: New York, Guilford Press, p. 253-282.
Dishion, T. J., and E. A. Stormshak, 2007, Intervening in children's lives: An ecological,
family-centered approach to mental health care, American Psychological
Association.

41
Dishion, T. J., E. A. Stormshak, and K. A. Kavanagh, 2011, Everyday Parenting: A
Professional's Guide to Building Family Management Skills, Research Press.
Dunn, A. L., M. H. Trivedi, J. B. Kampert, C. G. Clark, and H. O. Chambliss, 2005,
Exercise treatment for depression: efficacy and dose response: American journal
of preventive medicine, v. 28, p. 1-8.
Eaton, D. K., L. Kann, S. Kinchen, S. Shanklin, K. Flint, J. Hawkins, W. Harris, R.
Lowry, T. McManus, and D. Chyen, 2012, Youth risk behavior surveillance-
United States, 2011: Morbidity and mortality weekly report. Surveillance
summaries (Washington, DC: 2002), v. 61, p. 1.
Eaton, D. K., L. Kann, S. Kinchen, S. Shanklin, J. Ross, J. Hawkins, W. A. Harris, R.
Lowry, T. McManus, and D. Chyen, 2010, Youth risk behavior surveillance—
United States, 2009: MMWR Surveill Summ, v. 59, p. 1-142.
Flannery, D. J., A. T. Vazsonyi, J. Torquati, and A. Fridrich, 1994, Ethnic and gender
differences in risk for early adolescent substance use: Journal of Youth and
Adolescence, v. 23, p. 195-213.
Gardner, T. W., T. J. Dishion, and A. M. Connell, 2008, Adolescent self-regulation as
resilience: Resistance to antisocial behavior within the deviant peer context:
Journal of abnormal child psychology, v. 36, p. 273-284.
Gordon-Larsen, P., R. G. McMurray, and B. M. Popkin, 1999, Adolescent physical
activity and inactivity vary by ethnicity: The National Longitudinal Study of
Adolescent Health: The Journal of pediatrics, v. 135, p. 301-306.
Gordon-Larsen, P., R. G. McMurray, and B. M. Popkin, 2000, Determinants of
adolescent physical activity and inactivity patterns: Pediatrics, v. 105, p. e83-e83.
Gustafson, S. L., and R. E. Rhodes, 2006, Parental correlates of physical activity in
children and early adolescents: Sports Medicine, v. 36, p. 79-97.
Haerens, L., B. Deforche, L. Maes, V. Stevens, G. Cardon, and I. Bourdeaudhuij, 2006,
Body mass effects of a physical activity and healthy food intervention in middle
schools: Obesity, v. 14, p. 847-854.
Hallal, P. C., C. G. Victora, M. R. Azevedo, and J. C. Wells, 2006, Adolescent physical
activity and health: Sports Medicine, v. 36, p. 1019-1030.
Hancox, R. J., B. J. Milne, and R. Poulton, 2004, Association between child and
adolescent television viewing and adult health: a longitudinal birth cohort study:
The Lancet, v. 364, p. 257-262.

42
Kann, L., C. W. Warren, W. A. Harris, J. L. Collins, B. I. Williams, J. G. Ross, and L. J.
Kolbe, 1996, Youth risk behavior surveillance—United States, 1995: Journal of
school health, v. 66, p. 365-377.
King, G., M. Law, P. Hurley, T. Petrenchik, and H. Schwellnus, 2010, A Developmental
Comparison of the Out‐of‐school Recreation and Leisure Activity Participation of
Boys and Girls With and Without Physical Disabilities: International Journal of
Disability, Development and Education, v. 57, p. 77-107.
Kriemler, S., U. Meyer, E. Martin, E. Van Sluijs, L. Andersen, and B. Martin, 2011,
Effect of school-based interventions on physical activity and fitness in children
and adolescents: a review of reviews and systematic update: British Journal of
Sports Medicine, v. 45, p. 923-930.
Landhuis, C. E., R. Poulton, D. Welch, and R. J. Hancox, 2008, Programming obesity
and poor fitness: the long-term impact of childhood television: Obesity, v. 16, p.
1457-1459.
Larun, L., L. Nordheim, E. Ekeland, K. Hagen, and F. Heian, 2006, Exercise in
prevention and treatment of anxiety and de-pression among children and young
people: Cochrane Database of Systematic Reviews, v. 4.
Lever, J., 1976, Sex differences in the games children play: Social problems, p. 478-487.
Li, X., S. Feigelman, and B. Stanton, 2000, Perceived parental monitoring and health risk
behaviors among urban low-income African-American children and adolescents:
Journal of Adolescent Health, v. 27, p. 43-48.
Little, R. J. A., and D. B. Rubin, 2002, Statistical analysis with missing data: Wiley
Series in Probability and Statistics: New York, NY, Wiley.
Loeber, R., and T. Dishion, 1983, Early predictors of male delinquency: a review:
Psychological bulletin, v. 94, p. 68.
Martin, C. L., and R. A. Fabes, 2001, The stability and consequences of young children's
same-sex peer interactions: Developmental psychology, v. 37, p. 431.
Mellin, A. E., D. Neumark-Sztainer, M. Story, M. Ireland, and M. D. Resnick, 2002,
Unhealthy behaviors and psychosocial difficulties among overweight adolescents:
the potential impact of familial factors: Journal of adolescent health, v. 31, p. 145-
153.

43
Metzler, C. W., A. Biglan, D. V. Ary, and F. Li, 1998, The stability and validity of early
adolescents' reports of parenting constructs: Journal of Family Psychology, v. 12,
p. 600.
Miller, W. R., and S. Rollnick, 2002, Motivational interviewing: Preparing people for
change, Guilford press.
Muthén, B., and T. Asparouhov, 2002, Using Mplus Monte Carlo simulations in practice:
A note on non-normal missing data in latent variable models: Mplus webnotes.
Muthén, L. K., and B. O. Muthén, 1998-2012, Mplus user's guide, Los Angeles, CA,
Muthén & Muthén.
Nader, P. R., J. F. Sallis, I. S. Abramson, and S. L. Broyles, 1992, Family-based
cardiovascular risk reduction education among Mexican-and Anglo-Americans:
Family & Community Health: The Journal of Health Promotion & Maintenance.
Ornelas, I. J., K. M. Perreira, and G. X. Ayala, 2007, Parental influences on adolescent
physical activity: a longitudinal study: International Journal of Behavioral
Nutrition and Physical Activity, v. 4, p. 3.
Pate, R. R., P. S. Freedson, J. F. Sallis, W. C. Taylor, J. Sirard, S. G. Trost, and M.
Dowda, 2002, Compliance with physical activity guidelines: prevalence in a
population of children and youth: Annals of epidemiology, v. 12, p. 303-308.
Patterson, G. R., J. B. Reid, and T. J. Dishion, 1992, Antisocial boys: A social
interactional approach: Eugene, OR: Castalia.
Pettit, G. S., R. D. Laird, K. A. Dodge, J. E. Bates, and M. M. Criss, 2001, Antecedents
and behavior‐problem outcomes of parental monitoring and psychological control
in early adolescence: Child development, v. 72, p. 583-598.
Pugliese, J., and B. Tinsley, 2007, Parental socialization of child and adolescent physical
activity: a meta-analysis: Journal of Family Psychology, v. 21, p. 331.
Repetti, R. L., S. E. Taylor, and T. E. Seeman, 2002, Risky families: family social
environments and the mental and physical health of offspring: Psychological
bulletin, v. 128, p. 330.
Sacher, P. M., M. Kolotourou, P. M. Chadwick, T. J. Cole, M. S. Lawson, A. Lucas, and
A. Singhal, 2010, Randomized Controlled Trial of the MEND Program: A
Family‐based Community Intervention for Childhood Obesity: Obesity, v. 18, p.
S62-S68.

44
Sallis, J. F., 2000, Age-related decline in physical activity: a synthesis of human and
animal studies: Medicine and science in sports and exercise, v. 32, p. 1598-1600.
Sallis, J. F., and K. Patrick, 1994, Physical activity guidelines for adolescents: consensus
statement: Pediatric exercise science, v. 6, p. 302-302.
Sallis, J. F., J. J. Prochaska, and W. C. Taylor, 2000, A review of correlates of physical
activity of children and adolescents: Medicine and science in sports and exercise,
v. 32, p. 963-975.
Sallis, J. F., W. C. Taylor, M. Dowda, P. S. Freedson, and R. R. Pate, 2002, Correlates of
vigorous physical activity for children in grades 1 through 12: Comparing parent-
reported and objectively measured physical activity: Pediatric Exercise Science,
v. 14, p. 30.
Sallis, J. F., J. M. Zakarian, M. F. Hovell, and C. R. Hofstetter, 1996, Ethnic,
socioeconomic, and sex differences in physical activity among adolescents:
Journal of clinical epidemiology, v. 49, p. 125-134.
Sandler, I., E. Schoenfelder, S. Wolchik, and D. MacKinnon, 2011, Long-term impact of
prevention programs to promote effective parenting: Lasting effects but uncertain
processes: Annual review of psychology, v. 62, p. 299.
Schmitz, K. H., L. A. Lytle, G. A. Phillips, D. M. Murray, A. S. Birnbaum, and M. Y.
Kubik, 2002, Psychosocial correlates of physical activity and sedentary leisure
habits in young adolescents: the Teens Eating for Energy and Nutrition at School
study: Preventive Medicine, v. 34, p. 266-278.
Shaw, D. S., A. Connell, T. J. Dishion, M. N. Wilson, and F. Gardner, 2009,
Improvements in maternal depression as a mediator of intervention effects on
early childhood problem behavior: Development and psychopathology, v. 21, p.
417-439.
Smith, J. D., N. B. Knoble, A. A. Zerr, T. J. Dishion, and E. A. Stormshak, 2014, Family
check-up effects across diverse ethnic groups: Reducing early-adolescence
antisocial behavior by reducing family conflict: Journal of Clinical Child &
Adolescent Psychology, p. 1-15.
Smith, J. D., Z. Montaño, T. J. Dishion, D. S. Shaw, and M. N. Wilson, In press,
Preventing Weight Gain and Obesity: Indirect Effects of the Family Check-Up in
Early Childhood: Prevention Science.
Soberman, L. H., 1995, Psychometric validation of a teacher screening instrument.

45
Starfield, B., M. Bergner, M. Ensminger, A. W. Riley, B. F. Green, and S. Ryan, 1994,
Child Health and Illness Profile-Adolescent Edition (CHIP-AE), Baltimore, MD,
The Johns Hopkins University.
Starfield, B., A. W. Riley, B. F. Green, M. E. Ensminger, S. A. Ryan, K. Kelleher, S.
Kim-Harris, D. Johnston, and K. Vogel, 1995, The adolescent child health and
illness profile: a population-based measure of health: Medical care, v. 33, p. 553.
Steinberg, L., 2007, Risk taking in adolescence new perspectives from brain and
behavioral science: Current Directions in Psychological Science, v. 16, p. 55-59.
Stormshak, E. A., A. Connell, and T. J. Dishion, 2009, An adaptive approach to family-
centered intervention in schools: Linking intervention engagement to academic
outcomes in middle and high school: Prevention Science, v. 10, p. 221-235.
Strong, W. B., R. M. Malina, C. J. Blimkie, S. R. Daniels, R. K. Dishman, B. Gutin, A.
C. Hergenroeder, A. Must, P. A. Nixon, and J. M. Pivarnik, 2005, Evidence based
physical activity for school-age youth: The Journal of pediatrics, v. 146, p. 732-
737.
Taylor, W. C., T. Baranowski, and J. F. Sallis, 1994, Family determinants of childhood
physical activity: A social-cognitive model, in R. K. Dishman, ed., Advances in
exercise adherence: Champaign, IL, England, Human Kinetics Publishers, p. 319-
342.
Thorp, A. A., N. Owen, M. Neuhaus, and D. W. Dunstan, 2011, Sedentary behaviors and
subsequent health outcomes in adults: a systematic review of longitudinal studies,
1996–2011: American journal of preventive medicine, v. 41, p. 207-215.
Trost, S. G., J. F. Sallis, R. R. Pate, P. S. Freedson, W. C. Taylor, and M. Dowda, 2003,
Evaluating a model of parental influence on youth physical activity: American
journal of preventive medicine, v. 25, p. 277-282.
Van der Horst, K., M. Paw, J. W. Twisk, and W. Van Mechelen, 2007, A brief review on
correlates of physical activity and sedentariness in youth: Medicine and science in
sports and exercise, v. 39, p. 1241.
Van Ryzin, M. J., and T. J. Dishion, 2012, The impact of a family-centered intervention
on the ecology of adolescent antisocial behavior: Modeling developmental
sequelae and trajectories during adolescence: Development and psychopathology,
v. 24, p. 1139-1155.
Van Ryzin, M. J., and P. Nowicka, 2013, Direct and indirect effects of a family-based
intervention in early adolescence on parent− youth relationship quality, late

46
adolescent health, and early adult obesity: Journal of Family Psychology, v. 27, p.
106.
Van Ryzin, M. J., E. A. Stormshak, and T. J. Dishion, 2012, Engaging parents in the
Family Check-Up in middle school: Longitudinal effects on family conflict and
problem behavior through the high school transition: Journal of Adolescent
Health, v. 50, p. 627-633.
Van Sluisj, E., A. McMinn, and S. Griffin, 2007, Effectiveness of interventions to
promote physical activity in children and adolescents: systematic review of
controlled trials: BMJ, v. 335, p. 677-8.
Welk, G. J., 1999, The youth physical activity promotion model: a conceptual bridge
between theory and practice: Quest, v. 51, p. 5-23.
Welk, G. J., K. Wood, and G. Morss, 2003, Parental Influences on Physical Activity in
Children: an Exploration of Potential Mechanisms: Pediatric Exercise Science, v.
15, p. 19-33.
Wójcicki, T. R., and E. McAuley, 2014, II. Physical Activity: Measurement and
Behavioral Patterns in Children and Youth: Monographs of the Society for
Research in Child Development, v. 79, p. 7-24.
Young, D. R., J. A. Phillips, T. Yu, and J. A. Haythornthwaite, 2006, Effects of a life
skills intervention for increasing physical activity in adolescent girls: Archives of
pediatrics & adolescent medicine, v. 160, p. 1255.

47
Table 1
Sample characteristics
Intervention Group
Control Group
Variable n Min. Max. Mean Std.
Dev. Skewness Kurtosis n Min. Max. Mean
Std.
Dev. Skewness Kurtosis
6th Grade School
Assessment
Teacher Risk Assessment 117 2.00 3.00 2.34 0.48 0.68 -1.57 115 2.00 3.00 2.36 0.48 0.61 -1.66
Gender (1 = male) 117 0.00 1.00 0.44 0.50 0.23 -1.98 115 0.00 1.00 0.53 0.50 -0.12 -2.02
SES 117 -1.61 0.99 0.02 0.62 -0.52 -0.20 115 -2.39 0.99 -0.10 0.79 -0.88 0.22
Ethnic minority status 117 0.00 1.00 0.38 0.49 0.48 -1.80 115 0.00 1.00 0.39 0.49 0.45 -1.83
Family Relationship Quality 115 1.00 5.00 3.47 1.10 -0.26 -1.13 115 1.67 5.00 3.48 0.89 0.02 -0.89
Parental Monitoring 116 1.00 5.00 3.94 1.13 -1.12 0.28 115 1.00 5.00 3.90 0.88 -0.75 0.18
7th Grade
Family Assessment
Physical Activity 117 0.00 28.00 10.6 8.96 0.45 -0.96 115 0.00 28.00 13.76 9.99 0.09 -1.41
8th Grade
School
Assessment
Family Relationship Quality 105 1.00 5.00 3.23 0.99 0.02 -0.68 103 1.00 5.00 3.13 1.09 -0.13 -1.02
Parental Monitoring 105 1.40 5.00 4.01 0.84 -1.12 1.20 103 1.00 5.00 3.90 0.98 -0.99 0.43
9th Grade
Family
Assessment
Physical Activity 91 0.00 28.00 15.10 9.69 -0.11 -1.29 91 0.00 28.00 13.40 10.30 0.09 -1.49

48
Table 2
Independent t-test results comparing intervention and control groups
Intervention Control Differences
Variable n Mean n Mean t or 𝜒2 p
6th Grade School Assessment
Teacher Risk Assessment 117 2.34 115 2.36 t = 0.23 0.82
Age (in months) 117 146.12 115 146.57 t = 0.80 0.42
Gender 117 52m/65f 115 61m/54f 𝜒2 = 1.72 0.24
SES 117 0.02 115 -0.10 t = -1.36 0.18
Ethnic minority status 117
45 EA/72
Other 115
45 EA/70
Other 𝜒2 = .01 0.92
Number of Cigarettes Smoked Past Month 116 .77 115 .52 t = -0.85 0.40
Number of Times Chewed
Tobacco Past Month 116 .03 115 .02 t = -0.33 0.74
Number of Alcoholic Drinks Past Month 116 .89 115 .71 t = -0.62 0.54
Number of Times Smoked
Marijuana Past Month 116 .38 115 .27 t = -0.60 0.55
Number of Times Used Stimulants Past Month 116 .09 115 .00 t = -1.32 0.19
Antisocial Behavior 116 1.49 115 1.50 t = 0.11 0.91
Family Conflict 116 2.23 115 2.03 t = -1.29 0.20
Family Relationship Quality 115 3.47 115 3.48 t = 0.06 0.96
Parental Monitoring 116 3.94 115 3.85 t = -0.68 0.50
7th Grade Family
Assessment
Age (in months) 117 153.50 114 154.08 t = 0.96 0.34
Number of Children at Home 112 2.75 100 2.55 t = -1.30 0.19
Number of Adults at Home 112 2.08 100 2.12 t = 0.23 0.82
Physical Activity 117 10.60 115 13.76 t = 2.54 0.01*
8th Grade School
Assessment
Age (in months) 105 167.83 103 168.50 t = 1.07 0.29
Family Relationship Quality 105 3.23 103 3.13 t = -0.72 0.48
Parental Monitoring 105 4.01 103 3.89 t = -0.97 0.33
9th Grade Family Assessment
Age (in months) 91 179.43 90 179.20 t = -0.33 0.74
Physical Activity 91 15.10 91 13.40 t = -1.15 0.25
Note. The frequencies are given for Gender and Ethnic minority status. “m” = Male. “f” =
Female. “EA” = European American. “Other” = not European American.

49
Table 3
Zero-order correlations
Note. The numbers in bold represent the r-values and the numbers below represent the
cell size. “T1” refers to baseline and “T2” refers to two-year follow-up.

50
Table 4
Path coefficients of the full model, family relationship quality
Estimate
(unstandardized)
Estimate
(standardized) S.E. Est./S.E. P-Value
Physical Activity T2 ON
Treatment 2.664 0.134 1.363 1.955 0.051
Phys. Act. T1 0.259 0.248 0.075 3.426 0.001
SES 1.118 0.080 1.186 0.942 0.346
Minority -0.154 -0.008 1.697 -0.090 0.928
Gender 4.203 0.211 1.517 2.770 0.006
Fam. Relationship T2 1.014 0.105 0.688 1.474 0.140
Fam. Relationship T2 ON
Treatment 0.145 0.070 0.135 1.072 0.284
Fam. R. T1 0.292 0.28 0.073 3.991 0.000
SES -0.111 -0.076 0.102 -1.087 0.277
Minority -0.027 -0.0120 0.158 -0.168 0.866
Gender 0.393 0.189 0.141 2.787 0.005
Note. “T1” refers to baseline and “T2” refers to two-year follow-up.

51
Table 5
Path coefficients of the full model, parental monitoring
Estimate
(unstandardized)
Estimate
(standardized) S.E. Est./S.E. P-Value
Physical Activity T2 ON
Treatment 2.653 0.133 1.353 1.962 0.050
Phys. Act. T1 0.263 0.252 0.076 3.477 0.001
SES 0.961 0.068 1.218 0.789 0.430
Minority -0.376 -0.018 1.699 -0.221 0.825
Gender 4.827 0.242 1.491 3.237 0.001
Parental Monitoring T2 1.119 0.102 0.737 1.519 0.129
Parental Monitoring T2 ON
Treatment 0.042 0.023 0.112 0.379 0.704
Parental Monitoring T1 0.451 0.498 0.066 6.799 0.000
SES 0.103 0.080 0.080 1.278 0.201
Minority -0.024 -0.013 0.126 -0.194 0.846
Gender -0.091 -0.050 0.114 -0.800 0.424
Note. “T1” refers to baseline and “T2” refers to two-year follow-up.

52
Table 6
Path coefficients of the moderated mediation model, parental monitoring and gender
Estimate
(unstandardized)
Estimate
(standardized) S.E. Est./S.E. P-Value
Physical Activity T2 ON
Treatment 2.855 0.141 1.353 2.11 0.035
Phys. Act. T1 0.272 0.256 0.074 3.673 0.000
SES T1 1.371 0.096 1.161 1.181 0.238
Minority -0.687 -0.033 1.664 -0.413 0.68
Gender 4.657 0.229 1.477 3.153 0.002
Parental Monitoring T2 2.452 0.221 0.934 2.626 0.009
Parental Monitoring x Gender -3.290 -0.234 1.461 -2.251 0.024
Parental Monitoring T2 ON
Treatment 0.039 0.021 0.112 0.345 0.730
Parental Monitoring T1 0.452 0.499 0.066 6.821 0.000
SES T1 0.108 0.084 0.081 1.328 0.184
Minority -0.024 -0.013 0.126 -0.190 0.849
Gender -0.092 -0.051 0.114 -0.814 0.416
Note. “T1” refers to baseline and “T2” refers to two-year follow-up.

53
Table 7
Path coefficients, family relationship quality, received the FCU vs. controls
Estimate
(unstandardized)
Estimate
(standardized) S.E. Est./S.E. P-Value
Physical Activity T2 ON
Treatment 3.726 0.183 1.506 2.475 0.013
Phys. Act. T1 0.277 0.266 0.081 3.433 0.001
SES 0.345 0.025 1.211 0.285 0.775
Minority 0.658 0.032 1.826 0.360 0.719
Gender 4.689 0.235 1.609 2.914 0.004
Fam. Relationship T2 0.681 0.070 0.731 0.932 0.352
Fam. Relationship T2 ON
Treatment 0.312 0.148 0.142 2.196 0.028
Fam. R. T1 0.349 0.340 0.079 4.405 0.000
SES -0.089 -0.063 0.105 -0.846 0.398
Minority -0.056 -0.027 0.170 -0.330 0.741
Gender 0.341 0.165 0.152 2.245 0.025
Note. “T1” refers to baseline and “T2” refers to two-year follow-up.

54
Figure 1. Conceptual model.

55
Figure 2. Consort table.

56
Figure 3. Intervention model.

57
Figure 4. Mediation model, family relationship quality. Shows the path coefficients for
the paths of interest.

58
Figure 5. Mediation model, parental monitoring. Shows the path coefficients for the
paths of interest.

59
Figure 6. Moderated mediation model, parental monitoring and gender. Shows the path
coefficients for the paths of interest.

60
Figure 7. Interaction of gender and parental monitoring predicting physical activity. Low
Parental Monitoring = one standard deviation below the mean. High Parental Monitoring
= one standard deviation above the mean.
0
4
8
12
16
20
24
28
Low Parental Monitoring High Parental Monitoring
Day
s o
f p
hys
ical
act
ivit
y in
pas
t 4
wee
ks
Girls
Boys
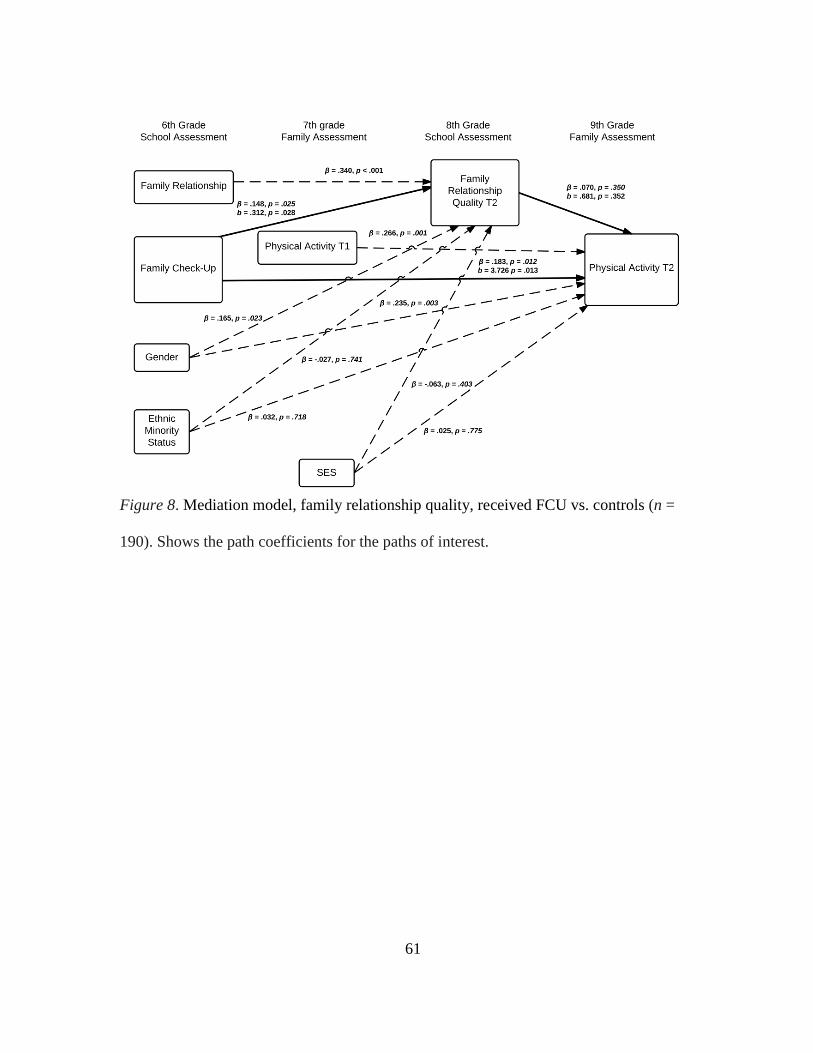
61
Figure 8. Mediation model, family relationship quality, received FCU vs. controls (n =
190). Shows the path coefficients for the paths of interest.

62
APPENDIX A
MEASURES

63
Youth Report of Physical Activity
(From the Child Health and Illness Profile – Adolescent Edition)
In the past 4 weeks, on how many days did you exercise or play sports hard enough to
make you breathe hard, make your heart beat fast, or make you sweat for 20 minutes or
more?
Number of days: 1 2 3 4 5 6 7 8 9 10 11 12 13 14 15 16 17 18 19 20 21 22 23 24 25 26 27
28
Youth Report of Family Relationship Quality
(Subscale of the Community Action for Successful Youth (CASY) Questionnaire)
Think back over the last month. How true are the following statements for you and your
parents? (Never true, Sometimes true, True about half the time, Often true, Always true;
score 1-5 in order of increasing trueness)
1. I really enjoy being with my parents.
2. My parents and I have gotten along very well with each other.
3. My parents trusted my judgment.
4. There was a feeling of togetherness in our family.
5. Family members really backed each other up.
6. The things we did together were fun and interesting.

64
Youth Report of Parental Monitoring
Subscale of the CASY

65
Teacher Report of Youth Risk Status
Teacher Risk Perception

66

67

68