Open enterprises collaborative innovation, authority and decision models

Collaborative, open, and automated data scienceby
Micah J. SmithB.A., Columbia University (2014)
S.M., Massachusetts Institute of Technology (2018)
Submitted to the Department ofElectrical Engineering and Computer Science
in partial fulfillment of the requirements for the degree of
Doctor of Philosophy in Computer Science
at the
MASSACHUSETTS INSTITUTE OF TECHNOLOGY
September 2021
© Micah J. Smith, MMXXI. All rights reserved.
The author hereby grants to MIT permission to reproduce and todistribute publicly paper and electronic copies of this thesis documentin whole or in part in any medium now known or hereafter created.
Author . . . . . . . . . . . . . . . . . . . . . . . . . . . . . . . . . . . . . . . . . . . . . . . . . . . . . . . . . . . . . . . .Department of Electrical Engineering and Computer Science
August 27, 2021Certified by. . . . . . . . . . . . . . . . . . . . . . . . . . . . . . . . . . . . . . . . . . . . . . . . . . . . . . . . . . . .
Kalyan VeeramachaneniPrincipal Research Scientist
Laboratory for Information and Decision SystemsThesis Supervisor
Accepted by . . . . . . . . . . . . . . . . . . . . . . . . . . . . . . . . . . . . . . . . . . . . . . . . . . . . . . . . . . .Leslie A. Kolodziejski
Professor of Electrical Engineering and Computer ScienceChair, Department Committee on Graduate Students

Collaborative, open, and automated data science
by
Micah J. Smith
Submitted to the Department ofElectrical Engineering and Computer Science
on August 27, 2021, in partial fulfillment of therequirements for the degree of
Doctor of Philosophy in Computer Science
Abstract
Data science and machine learning have already revolutionized many industries andorganizations and are increasingly being used in an open-source setting to addressimportant societal problems. However, there remain many challenges to developingpredictive machine learning models in practice, such as the complexity of the stepsin the modern data science development process, the involvement of many differentpeople with varying skills and roles, and the necessity of, yet difficulty in, collabo-rating across steps and people. In this thesis, I describe progress in two directions insupporting the development of predictive models.
First, I propose to focus the effort of data scientists and support structured collab-oration on the most challenging steps in a data science project. In Ballet, we createa new approach to collaborative data science development, based on adapting andextending the open-source software development model for the collaborative develop-ment of feature engineering pipelines, and is the first collaborative feature engineeringframework. Using Ballet as a probe, we conduct a detailed case study analysis of anopen-source personal income prediction project in order to better understand datascience collaborations.
Second, I propose to supplement human collaborators with advanced automatedmachine learning within end-to-end data science and machine learning pipelines.In the Machine Learning Bazaar, we create a flexible and powerful framework fordeveloping machine learning and automated machine learning systems. In our ap-proach, experts annotate and curate components from different machine learninglibraries, which can be seamlessly composed into end-to-end pipelines using a uni-fied interface. We build into these pipelines support for automated model selectionand hyperparameter tuning. We use these components to create an open-source,general-purpose, automated machine learning system, and describe several other ap-plications.
Thesis Supervisor: Kalyan VeeramachaneniTitle: Principal Research Scientist, Laboratory for Information and Decision Systems
2

On the Internet, nobody knows you’re a dog.
Peter Steiner
3

Acknowledgements
To my adviser, Kalyan Veeramachaneni, thank you for being a mentor, a teacher, a
collaborator, and a friend. I think it’s fair to say that we took a chance on each other
and that it has turned out pretty well so far. You have shown me that there is more
to research than academia.
To my thesis readers, Saman Amarasinghe and Rob Miller, thank you for your
support in my thesis formulation and defense and for your helpful feedback.
To my co-authors and other collaborators during my Ph.D. research, I am grateful
and proud to have worked with every single one of you: Carles Sala, ChengXiang Zhai,
Dongyu Liu, Huamin Qu, Jack Feser, Jürgen Cito, José Cambronero, Kelvin Lu, Lei
Xu, Max Kanter, Md. Mahadi Hasan, Plamen Kolev, Qianwen Wang, Qiaomu Shen,
Roy Wedge, Sam Madden, Santu Karmaker, Yao Ming, and Zhihua Jin. Without you,
this research would not be possible. In particular, to Carles Sala, thanks for your close
collaboration on so many projects and for our strong-headed disagreements that have
made me a better designer and developer.
To my fellow Ph.D. students, postdocs, and other researchers in the Data to AI
Lab at MIT over the years, thank you for feedback and discussion on research ideas
and software, keeping me company in 32-D712, and tolerating my wisecracks in our
group meetings: Alicia Sun, Lei Xu, Ola Zytek, Dongyu Liu, Iván Ramírez Díaz,
Santu Karmaker, and many others.
To all those who have collaborated with me in one way or another on the Ballet
project, especially those who have contributed to the predict-house-prices, predict-
census-income, and predict-life-outcomes projects, I thank you for your time and
effort in moving forward the vision of collaborative and open data science.
To the staff at MIT, thanks for all you do to support other students and me:
Michaela Henry, Arash Akhgari, Brian Jones, Leslie Kolodziejski, Janet Fischer, Gra-
cie Jin Gao, and Cara Giaimo.
To (most) anonymous reviewers of my research papers, thank you for engaging
honestly with my work and providing helpful feedback, whether positive or negative.
4

As maligned as it, I believe in the power of high-quality peer review. My research has
significantly improved as a result of peer review over the course of my Ph.D. program.
To academic mentors past, thank you for your wisdom and your investment in me:
Seyhan Erden, Marco Del Negro, Marc Giannoni, Mike Woodbury, Gregory Wornell.
To teachers and instructors in computer science and mathematics over the years
who have filled me with wonder, amazement, and passion for these beautiful subjects:
Adam Cannon, Jae Woo Lee, Rachel Ollivier, Hubertus Franke, Benjamin Goldberg,
Leslie Pack Kaelbling, Michael Sipser, Rob Miller, Casey Rodriguez, Max Goldman.
To the Muddy Charles and everyone in the community, thank you for keeping me
sane. The three best things about going to MIT are the Charles River, the Stata
Center, and the Muddy. To Mike Grenier, for showing a greater love for science than
anyone I know.
To friends at MIT, thank you for talking shop, letting loose, inspiring me with the
amazing things you do, always showing humility, being surprisingly normal, helping
me survive this experience in one piece, and touching my time at MIT in one way or
another: Maz Abulnaga, Caris Moses, José Cambronero, Flora Meng, Will Stephen-
son, Anish Agarwal, Jason Altschuler, Amanda Beck, Sam DeLaughter, Josh Saul,
Anne Tresansky, Tarfah Alrashed, Willie Boag, Leilani Gilpin.
To all my friends, thank you for your friendship, support, and love: you know who
you are.
To my family, thank you for your love and support. You keep me grounded and
inspire me with your commitment to education and intellectual inquiry.
To Mamba, who can’t read this but has shown me great wonder and joy, especially
during the most trying days.
To my wife Alex, you have been with me through this entire journey, from filling
out graduate school applications on Mulberry Street, to riding intercity buses around
the Northeast, to going on adventures with our friends and family all over the world,
to trying to stay sane in our living room during a pandemic, to planning our wedding
(twice!) in the breaks from research. Thank you for your support, your patience, and
your belief in me. I love you always.
5

Contents
1 Introduction 15
1.1 Summary of contributions . . . . . . . . . . . . . . . . . . . . . . . . 21
1.1.1 Adapting the open-source development model . . . . . . . . . 21
1.1.2 Understanding collaborative data science in context . . . . . . 22
1.1.3 Supporting data scientists with automation . . . . . . . . . . . 22
1.1.4 Putting the pieces together . . . . . . . . . . . . . . . . . . . . 23
1.2 Statement of prior publication . . . . . . . . . . . . . . . . . . . . . . 24
1.3 Thesis summary . . . . . . . . . . . . . . . . . . . . . . . . . . . . . . 25
2 Background 26
2.1 Data science and feature engineering . . . . . . . . . . . . . . . . . . 26
2.2 Collaborative and open data work . . . . . . . . . . . . . . . . . . . . 29
2.3 Open-source development . . . . . . . . . . . . . . . . . . . . . . . . 33
2.4 Testing for machine learning . . . . . . . . . . . . . . . . . . . . . . . 35
2.5 Machine learning systems . . . . . . . . . . . . . . . . . . . . . . . . 35
2.6 Prediction policy problems . . . . . . . . . . . . . . . . . . . . . . . . 38
2.7 The Fragile Families Challenge . . . . . . . . . . . . . . . . . . . . . . 40
I Collaborative and open data science 43
3 Ballet: a framework for collaborative, open-source data science 44
3.1 Introduction . . . . . . . . . . . . . . . . . . . . . . . . . . . . . . . . 44
3.2 Conceptual framework . . . . . . . . . . . . . . . . . . . . . . . . . . 46
6

3.2.1 Challenges . . . . . . . . . . . . . . . . . . . . . . . . . . . . . 47
3.2.2 Design concepts . . . . . . . . . . . . . . . . . . . . . . . . . . 48
3.3 An overview of Ballet . . . . . . . . . . . . . . . . . . . . . . . . . . . 50
3.3.1 Maintainer . . . . . . . . . . . . . . . . . . . . . . . . . . . . . 51
3.3.2 Collaborators . . . . . . . . . . . . . . . . . . . . . . . . . . . 53
3.3.3 Consumer . . . . . . . . . . . . . . . . . . . . . . . . . . . . . 55
3.4 A language for feature engineering . . . . . . . . . . . . . . . . . . . . 55
3.4.1 Feature definitions . . . . . . . . . . . . . . . . . . . . . . . . 57
3.4.2 Learned feature transformations . . . . . . . . . . . . . . . . . 58
3.4.3 Nested feature definitions . . . . . . . . . . . . . . . . . . . . 59
3.4.4 Feature engineering primitives . . . . . . . . . . . . . . . . . . 59
3.4.5 Feature engineering pipelines . . . . . . . . . . . . . . . . . . 60
3.4.6 Feature execution engine . . . . . . . . . . . . . . . . . . . . . 61
3.5 Acceptance procedures for feature definitions . . . . . . . . . . . . . . 63
3.5.1 Feature API validation . . . . . . . . . . . . . . . . . . . . . . 63
3.5.2 ML performance validation . . . . . . . . . . . . . . . . . . . . 64
3.5.3 Streaming feature definition selection . . . . . . . . . . . . . . 65
3.6 An interactive development environment for data science collaborations 74
3.6.1 Design . . . . . . . . . . . . . . . . . . . . . . . . . . . . . . . 75
3.6.2 Implementation . . . . . . . . . . . . . . . . . . . . . . . . . . 77
3.7 Preliminary studies . . . . . . . . . . . . . . . . . . . . . . . . . . . . 79
4 Understanding data science collaborations 82
4.1 Introduction . . . . . . . . . . . . . . . . . . . . . . . . . . . . . . . . 82
4.2 Methods . . . . . . . . . . . . . . . . . . . . . . . . . . . . . . . . . . 83
4.2.1 General procedures . . . . . . . . . . . . . . . . . . . . . . . . 84
4.2.2 Participants . . . . . . . . . . . . . . . . . . . . . . . . . . . . 84
4.2.3 Dataset . . . . . . . . . . . . . . . . . . . . . . . . . . . . . . 84
4.2.4 Research instruments . . . . . . . . . . . . . . . . . . . . . . . 85
4.2.5 Analysis . . . . . . . . . . . . . . . . . . . . . . . . . . . . . . 87
7

4.3 Results . . . . . . . . . . . . . . . . . . . . . . . . . . . . . . . . . . . 87
4.3.1 Collaborative framework design . . . . . . . . . . . . . . . . . 88
4.3.2 Participant background, experience, and performance . . . . . 91
4.3.3 Collaborative feature engineering code . . . . . . . . . . . . . 93
4.3.4 Comparative performance . . . . . . . . . . . . . . . . . . . . 95
4.3.5 Evaluation of Assemblé . . . . . . . . . . . . . . . . . . . . . . 96
5 Discussion of Ballet 100
5.1 Effects of scale . . . . . . . . . . . . . . . . . . . . . . . . . . . . . . 100
5.2 Effects of culture . . . . . . . . . . . . . . . . . . . . . . . . . . . . . 101
5.3 Security . . . . . . . . . . . . . . . . . . . . . . . . . . . . . . . . . . 101
5.4 Privacy . . . . . . . . . . . . . . . . . . . . . . . . . . . . . . . . . . . 102
5.5 Interpretability and documentation . . . . . . . . . . . . . . . . . . . 103
5.6 Feature stores . . . . . . . . . . . . . . . . . . . . . . . . . . . . . . . 103
5.7 Feature maintenance . . . . . . . . . . . . . . . . . . . . . . . . . . . 104
5.8 Higher-order features . . . . . . . . . . . . . . . . . . . . . . . . . . . 105
5.9 Combining human and automated feature engineering . . . . . . . . . 105
5.10 Ethical considerations . . . . . . . . . . . . . . . . . . . . . . . . . . 106
5.11 Data source support . . . . . . . . . . . . . . . . . . . . . . . . . . . 106
5.12 Assemblé . . . . . . . . . . . . . . . . . . . . . . . . . . . . . . . . . . 107
5.13 Earlier visions of collaboration . . . . . . . . . . . . . . . . . . . . . . 108
5.14 Limitations . . . . . . . . . . . . . . . . . . . . . . . . . . . . . . . . 109
II Automated data science 111
6 The Machine Learning Bazaar 112
6.1 Introduction . . . . . . . . . . . . . . . . . . . . . . . . . . . . . . . . 112
6.2 A framework for machine learning pipelines . . . . . . . . . . . . . . 116
6.2.1 ML primitives . . . . . . . . . . . . . . . . . . . . . . . . . . . 117
6.2.2 ML pipelines . . . . . . . . . . . . . . . . . . . . . . . . . . . 122
6.2.3 Discussion . . . . . . . . . . . . . . . . . . . . . . . . . . . . . 124
8

6.3 An automated machine learning framework . . . . . . . . . . . . . . . 127
6.3.1 Pipeline templates and hypertemplates . . . . . . . . . . . . . 128
6.3.2 Tuners and selectors . . . . . . . . . . . . . . . . . . . . . . . 128
6.4 AutoML systems . . . . . . . . . . . . . . . . . . . . . . . . . . . . . 130
6.4.1 AutoBazaar . . . . . . . . . . . . . . . . . . . . . . . . . . . . 130
7 Evaluations of ML Bazaar 132
7.1 Applications . . . . . . . . . . . . . . . . . . . . . . . . . . . . . . . . 132
7.1.1 Anomaly detection for satellite telemetry . . . . . . . . . . . . 132
7.1.2 Predicting clinical outcomes from electronic health records . . 133
7.1.3 Failure prediction in wind turbines . . . . . . . . . . . . . . . 133
7.1.4 Leaks and crack detection in water distribution systems . . . . 134
7.1.5 DARPA D3M program . . . . . . . . . . . . . . . . . . . . . . 134
7.1.6 Discussion . . . . . . . . . . . . . . . . . . . . . . . . . . . . . 135
7.2 Experimental evaluation . . . . . . . . . . . . . . . . . . . . . . . . . 137
7.2.1 ML task suite . . . . . . . . . . . . . . . . . . . . . . . . . . . 137
7.2.2 Pipeline search . . . . . . . . . . . . . . . . . . . . . . . . . . 138
7.2.3 Computational bottlenecks . . . . . . . . . . . . . . . . . . . . 138
7.2.4 AutoML performance . . . . . . . . . . . . . . . . . . . . . . . 140
7.2.5 Expressiveness of ML Bazaar . . . . . . . . . . . . . . . . . . 140
7.2.6 Case study: evaluating ML primitives . . . . . . . . . . . . . . 141
7.2.7 Case study: evaluating AutoML primitives . . . . . . . . . . . 142
III Looking forward 144
8 Putting the pieces together: collaborative, open-source, and auto-
mated data science for the Fragile Families Challenge 145
8.1 Introduction . . . . . . . . . . . . . . . . . . . . . . . . . . . . . . . . 145
8.2 Collaborative modeling . . . . . . . . . . . . . . . . . . . . . . . . . . 147
8.2.1 Methods . . . . . . . . . . . . . . . . . . . . . . . . . . . . . . 147
8.2.2 Feature development . . . . . . . . . . . . . . . . . . . . . . . 149
9

8.2.3 Automated modeling . . . . . . . . . . . . . . . . . . . . . . . 152
8.2.4 Metrics . . . . . . . . . . . . . . . . . . . . . . . . . . . . . . 155
8.3 Results . . . . . . . . . . . . . . . . . . . . . . . . . . . . . . . . . . . 155
8.3.1 Feature definitions . . . . . . . . . . . . . . . . . . . . . . . . 156
8.3.2 Predictive performance . . . . . . . . . . . . . . . . . . . . . . 157
8.4 Discussion . . . . . . . . . . . . . . . . . . . . . . . . . . . . . . . . . 159
8.4.1 Private data, open-source model . . . . . . . . . . . . . . . . . 159
8.4.2 Collaborative modeling without redundancy . . . . . . . . . . 160
8.4.3 Modeling performance is competitive . . . . . . . . . . . . . . 163
8.4.4 Models and features are interpretable . . . . . . . . . . . . . . 163
9 Future directions 165
9.1 Beyond feature engineering . . . . . . . . . . . . . . . . . . . . . . . . 165
9.2 Potential impact . . . . . . . . . . . . . . . . . . . . . . . . . . . . . 166
10 Conclusion 169
10

List of Figures
1.1 Typical stages and steps of a data science process for predictive ma-
chine learning modeling. . . . . . . . . . . . . . . . . . . . . . . . . . 16
1.2 The “data science Venn diagram” (adapted from Conway 2013). The
“ideal” data scientist is an expert in statistics and machine learning,
software development, and the problem domain. . . . . . . . . . . . . 18
2.1 Architecture of the FeatureHub platform. . . . . . . . . . . . . . . . . 28
3.1 An overview of collaborative data science development with the Ballet
framework for a feature engineering project. . . . . . . . . . . . . . . 52
3.2 Example of a user-submitted feature definition for a house price pre-
diction problem. . . . . . . . . . . . . . . . . . . . . . . . . . . . . . . 56
3.3 Example of a user-submitted feature definition for a personal income
prediction problem. . . . . . . . . . . . . . . . . . . . . . . . . . . . . 56
3.4 A feature engineering pipeline for a house price prediction problem
with four feature functions operating on six raw variables. . . . . . . 61
3.5 SFDS algorithm. . . . . . . . . . . . . . . . . . . . . . . . . . . . . . 69
3.6 An overview of the Assemblé development environment. . . . . . . . . 75
4.1 Most important functionality for the collaborative feature engineering
task in predict-census-income case study. . . . . . . . . . . . . . . . . 90
4.2 Summary of participant experience and performance for the predict-
census-income case study. . . . . . . . . . . . . . . . . . . . . . . . . 91
11

4.3 Example of a user-submitted feature definition for a personal income
prediction problem. . . . . . . . . . . . . . . . . . . . . . . . . . . . . 93
4.4 Assemblé user study results. . . . . . . . . . . . . . . . . . . . . . . . 97
6.1 ML task types that can be solved in ML Bazaar by combining ML
primitives. . . . . . . . . . . . . . . . . . . . . . . . . . . . . . . . . . 113
6.2 Representation and usage of the Orion pipeline for anomaly detection
using the ML Bazaar framework. . . . . . . . . . . . . . . . . . . . . 116
6.3 Annotation of the GaussianBlur transformer primitive. . . . . . . . . 118
6.4 Annotation of the ballet.engineer_features learning primitive. . . . 119
6.5 Usage of MLBlocks for a graph link prediction task. . . . . . . . . . . 122
6.6 Recovery of ML computational graph from pipeline description for a
text classification pipeline. . . . . . . . . . . . . . . . . . . . . . . . . 123
6.7 Pipeline-graph recovery algorithm. . . . . . . . . . . . . . . . . . . . 125
6.8 AutoBazaar pipeline search algorithm. . . . . . . . . . . . . . . . . . 131
7.1 Execution time of AutoBazaar pipeline search attributable to different
libraries/components. . . . . . . . . . . . . . . . . . . . . . . . . . . . 140
7.2 Distribution of task performance improvement due to ML Bazaar Au-
toML. . . . . . . . . . . . . . . . . . . . . . . . . . . . . . . . . . . . 141
8.1 A first user-submitted feature definition for the predict-life-outcomes
project. . . . . . . . . . . . . . . . . . . . . . . . . . . . . . . . . . . 151
8.2 A second user-submitted feature definition for the predict-life-outcomes
project. . . . . . . . . . . . . . . . . . . . . . . . . . . . . . . . . . . 152
8.3 Feature development partition for the predict-life-outcomes project. . 153
8.4 Distribution of input variables per feature in the predict-life-outcomes
project. . . . . . . . . . . . . . . . . . . . . . . . . . . . . . . . . . . 157
8.5 Variable coverage over time in the predict-life-outcomes project. . . . 157
8.6 Generalization of the predict-life-outcomes ML pipeline. . . . . . . . . 160
12

8.7 Probability of observing no duplicate input variables in a simulation
using two sampling strategies in the predict-life-outcomes project. . . 162
8.8 Feature importance in GPA prediction in the predict-life-outcomes project.163
13

List of Tables
1.1 Description of personas involved in predictive modeling projects. These
stylized personas are expressed to varying degrees in any given individual. 17
2.1 Number of contributors to large open-source collaborations. . . . . . . 31
3.1 Addressing challenges in collaborative data science development by ap-
plying our design concepts in the Ballet framework. . . . . . . . . . . 48
3.2 Feature engineering primitives implemented or re-exported. . . . . . . 60
3.3 Feature API validation suite in Ballet. . . . . . . . . . . . . . . . . . 64
4.1 ACS dataset used in predict-census-income project. . . . . . . . . . . 85
4.2 ML Performance of Ballet and alternatives. . . . . . . . . . . . . . . . 95
6.1 Primitives in the curated catalog of MLPrimitives. . . . . . . . . . . . 120
7.1 Results from the DARPA D3M Summer 2019 evaluation. . . . . . . . 135
7.2 Summary of tasks in ML Bazaar Task Suite. . . . . . . . . . . . . . . 138
7.3 ML task types and associated counts in the ML Bazaar Task Suite. . 139
8.1 Pipeline templates used for automated modeling in the predict-life-
outcomes project. . . . . . . . . . . . . . . . . . . . . . . . . . . . . . 154
8.2 Top features in the predict-life-outcomes project. . . . . . . . . . . . . 156
8.3 Performance of ML pipelines in the predict-life-outcomes project in
predicting Material Hardship. . . . . . . . . . . . . . . . . . . . . . . 158
8.4 Performance of the best ML pipelines in the predict-life-outcomes project
compared to FFC entrants. . . . . . . . . . . . . . . . . . . . . . . . . 158
14

Chapter 1
Introduction
Data science and machine learning have become vital decision-making tools in enter-
prises across many fields. In recent years, a subfield of data science called predictive
machine learning modeling has seen especially widespread usage. Companies use pre-
dictive modeling to automatically monitor computer logs and digital sensors to detect
anomalies or identify cyberattacks. Social media platforms use predictive modeling to
rank the items that appear in the feeds of their users in an attempt to serve more en-
gaging and interesting content. Physicians use predictive modeling to more effectively
detect signs of cancer in medical imaging. Banks use predictive modeling to identify
and reject fraudulent financial transactions. And cities and real estate companies use
predictive modeling to estimate the assessed values of homes from property records,
to forecast government revenues, and to identify trends.
As predictive modeling has matured and expectations for it have grown, re-
searchers have studied the processes through which data science projects are created,
developed, evaluated, and maintained, whether by large organizations, open data
communities, scientific researchers, or individual practitioners. There are three main
challenges in the development of predictive models.
First, the modern data science development process is complex and highly itera-
tive, with multiple stages and steps (Figure 1.1). These stages can be summarized as
preparation, modeling, and deployment. In the preparation stage, data scientists pre-
pare raw data for modeling by formulating a prediction task, acquiring data resources,
15

DeploymentModelingPreparation
Prediction task formulation
Data acquisition
Data cleaning, transformation,
and feature engineering
Exploratory data analysis
Training
Evaluation
Model selection
Hyperparameter tuning
Service development
Monitoring
Service deployment
Figure 1.1: Typical stages and steps of a data science process for predictive machinelearning modeling.
cleaning and transforming raw data, and engineering features. In the modeling stage,
data scientists explore patterns and relationships in the feature values and prediction
targets, train and evaluate machine learning models, select from among alternative
models, and tune hyperparameters. In the deployment stage, data scientists expose
the model as a service, assess performance metrics such as latency and accuracy, and
monitor it for drift.
During any of these stages, data scientists may need to backtrack and revisit prior
steps. For example, if a model does not achieve a desired level of performance during
a training and evaluation step, the data scientist may return to an earlier step and
acquire more labeled examples, integrate new data sources, or engineer additional
features in order to improve the downstream predictive performance. In addition,
each of these individual steps can be arbitrarily complex — for instance, exposing a
model as a service can require intensive engineering work.
Second, data science projects generally involve people with varying skill sets and
roles, or personas. A domain expert is a persona with a deep understanding of many
aspects of a problem domain or application, such as business and organizational pro-
16

Persona Description
Domain expert Has a deep understanding of many aspects of a problem do-main or application, such as business and organizational pro-cesses, underlying science and technology, and the provenanceof and relationships between data sources
Software developer Designs and implements software systems or applications andhas mastery of team-based development processes
Statistical and machinelearning modeler
Uses statistics, machine learning, and mathematics to under-stand and model relationships between different quantities ofinterest
Table 1.1: Description of personas involved in predictive modeling projects. Thesestylized personas are expressed to varying degrees in any given individual.
cesses, underlying science and technology, and the provenance of and relationships
between data sources. A software developer is a persona who designs and implements
software systems or applications and has mastery of team-based software develop-
ment processes. A statistical and machine learning modeler is a persona who uses
statistics, machine learning, and mathematics to understand and model the relation-
ships between different quantities of interest. These personas are usually expressed to
varying degrees by people with different backgrounds, roles, and job titles (Table 1.1).
Multiple personas may be expressed within an individual. For example, according
to the “data science Venn diagram” (Figure 1.2), the ideal data scientist expresses all
three of these personas and more. In this understanding, the ideal data scientist is an
expert in statistics and math, software development, and the problem domain. But
in reality, very few people develop expertise in all three of these disparate areas.1
Third, individual steps in the data science process may require a complicated
interplay of contributions from these three different personas. Domain experts and
data scientists must collaborate in order to properly scope a data science project in
terms of inputs, outputs, and requirements, and to obtain insight into the important
factors that might lead to successful predictive models. Data scientists must also1In this thesis, we will consider a data scientist to be anyone who contributes to a data science
project, while being mindful that this individual may have different skill sets, and will be morespecific as needed.
17
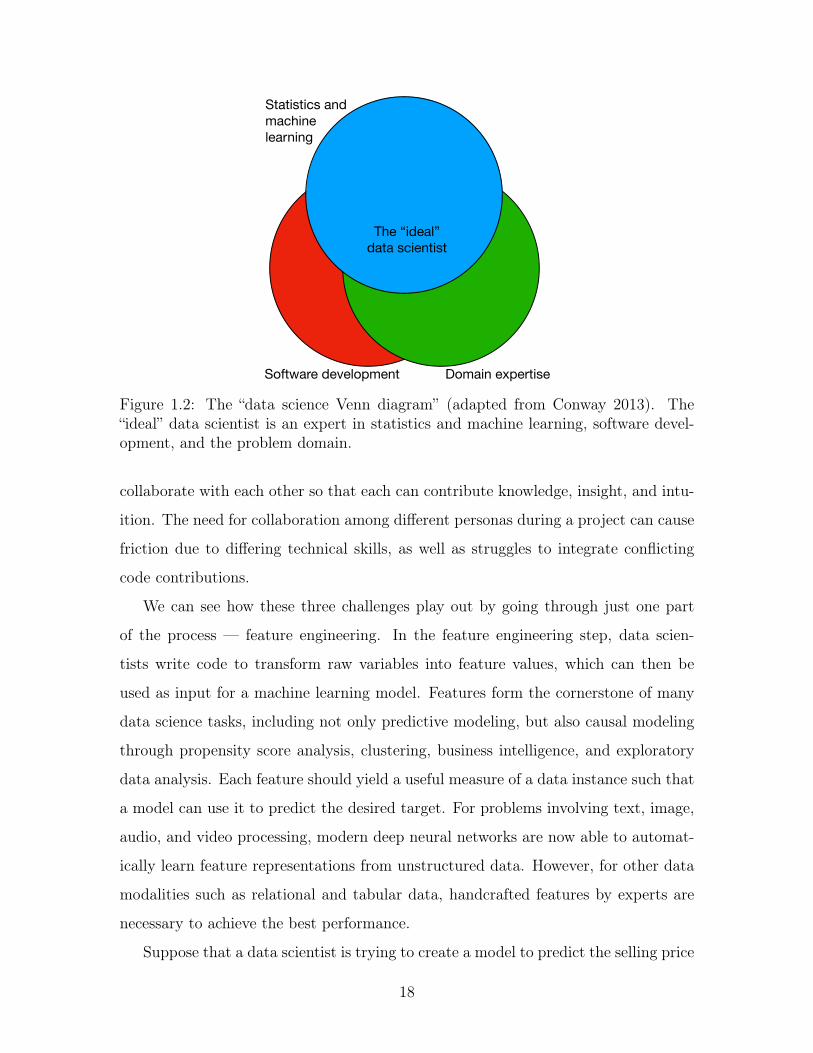
Statistics and machinelearning
Software development Domain expertise
The “ideal”data scientist
Figure 1.2: The “data science Venn diagram” (adapted from Conway 2013). The“ideal” data scientist is an expert in statistics and machine learning, software devel-opment, and the problem domain.
collaborate with each other so that each can contribute knowledge, insight, and intu-
ition. The need for collaboration among different personas during a project can cause
friction due to differing technical skills, as well as struggles to integrate conflicting
code contributions.
We can see how these three challenges play out by going through just one part
of the process — feature engineering. In the feature engineering step, data scien-
tists write code to transform raw variables into feature values, which can then be
used as input for a machine learning model. Features form the cornerstone of many
data science tasks, including not only predictive modeling, but also causal modeling
through propensity score analysis, clustering, business intelligence, and exploratory
data analysis. Each feature should yield a useful measure of a data instance such that
a model can use it to predict the desired target. For problems involving text, image,
audio, and video processing, modern deep neural networks are now able to automat-
ically learn feature representations from unstructured data. However, for other data
modalities such as relational and tabular data, handcrafted features by experts are
necessary to achieve the best performance.
Suppose that a data scientist is trying to create a model to predict the selling price
18

of a house. Many features of this house may be easy to define and calculate, such as
its age or living area. Others may be more difficult, such as its most recent assessed
value as compared to other houses in the vicinity. Still others may be even more
complex, such as the walking distance from the house to the nearest grocery store
or yoga studio, or the average amount of direct sunlight the house receives given its
orientation and latitude. Domain expertise is required to best identify these creative
features, which can be highly predictive. Just as a realtor or property assessor is able
to estimate the value of a house from an inspection, so too does knowledge of real
estate and property assessment allow someone to identify those measurable attributes
of a house that impact its selling price.
But while some steps in predictive modeling, such as feature engineering, still
require collaboration, other steps are reaching full automation and require little to
no human involvement. For example, due to advances in hyperparameter tuning al-
gorithms, an automated search over a predefined configuration space can find the
best-performing hyperparameters for a given machine learning algorithm more effi-
ciently than a data scientist.
These dynamics are complicated even further in the emerging practice of open
data science, where predictive models are developed in an open-source setting by
citizen scientists, volunteers, and machine learning enthusiasts. These models are
meant to help with important societal problems by performing tasks such as pre-
dicting traffic crashes, predicting adverse interactions between police and citizens,
analyzing breakdown and pollution of water wells, and recommending responses to
legal questions for pro bono organizations. Open data science projects are usually
very transparent, with practitioners making source code and data artifacts publicly
available and soliciting community input on project directions. Contributors may use
their own computational resources and/or take advantage of limited shared commu-
nity resources to run test suites, build documentation sites, and host chat rooms. In
these low-resource settings, collaboration and automation cannot rely on commercial
development platforms and cloud infrastructure.
Though these challenges remain pressing, we can take inspiration from related
19

fields, like software engineering, that have surmounted similar ones. Software engi-
neering is a mature field with time-tested processes for team-based development. For
example, the Linux operating system kernel came from humble origins in the early
1990s to become one of the most complex pieces of software ever developed. Using
(and often pioneering) open-source software development processes, the project has
received and integrated code contributions from over 20,000 developers, numbering
over one million commits and over 28 million lines of code, and now runs on billions
of devices (Stewart et al., 2020).
What would it look like to overcome similar challenges in predictive modeling?
Scores of data scientists with different levels of domain expertise, software develop-
ment skills, and statistical and machine learning modeling prowess could work to-
gether on a single, impactful predictive model. Domain experts could easily express
their ideas and have them incorporated into the project, even if they have a limited
ability to write production-grade code. Data scientists could contribute code to a
shared repository while remaining confident that their code will work well with that
of their collaborators. Software developers could easily build in the latest advances
in data science automation and focus their engineering efforts where they are most
needed. And large collaborations in the open data science setting could lead to useful
predictive models for civic technology, public policy, and scientific research.
In this thesis, I describe progress toward this vision in two areas. First, I pro-
pose ways to focus the efforts of data scientists and support structured collaboration
for the most challenging steps in a data science project such as feature engineering.
Second, I propose supplementing human collaborators with advanced automated ma-
chine learning within end-to-end data science and machine learning pipelines. Taken
together, these approaches allow data scientists to collaborate more effectively, fall
back on collaborators or automated agents where they lack skills, and build highly
performing predictive models for the most challenging problems facing our society
and organizations.
20

1.1 Summary of contributions
This thesis makes the following contributions in collaborative, open, and automated
data science and machine learning.
1.1.1 Adapting the open-source development model
First, in Ballet, we show that we can support collaboration in data science develop-
ment by adapting and extending the open-source software development model.
The open-source software development model has led to successful, large-scale
collaborations in building software libraries, software systems, chess engines, and
scientific analyses, with individual projects involving hundreds or even thousands of
unique code contributors. Extensive research into open-source software development
has revealed successful models for large-scale collaboration, such as the pull request
model exemplified by the social coding platform GitHub.
We show that we can successfully adapt and extend this model to support collabo-
ration on important data science steps by introducing a new development process and
ML programming model. Our approach decomposes steps in the data science process
into modular data science “patches” that can be intelligently combined, representing
objects like “feature definition,” “labeling function,” or “slice function.” Prospec-
tive collaborators each write patches and submit them to a shared repository. Our
framework provides a powerful embedded language that constrains the space of new
patches, as well as the underlying functionality to support interactive development,
automatically test and merge high-quality contributions, and compose accepted con-
tributions into a single product. While data science and predictive modeling have
many steps, we focus on feature engineering on tabular data as an important step
that could benefit from a more collaborative approach.
We instantiate these ideas in Ballet, a lightweight software framework for collab-
orative data science that supports collaborative feature engineering on tabular data.
Ballet is the first collaborative feature engineering framework and represents an
exciting new direction for data science collaboration.
21

We present Ballet in Chapter 3.
1.1.2 Understanding collaborative data science in context
Second, we seek to better understand the opportunities and challenges present in
large open data science collaborations.
Research into data science collaborations has mostly focused on projects done by
small teams. Little attention has been given to larger collaborations, partly because
of a lack of real-world examples to study.
Leveraging Ballet as a probe, we create and conduct an analysis of predict-census-
income, a collaborative effort to predict personal income through engineering features
from raw individual survey responses to the U.S. Census American Community Survey
(ACS). We use a mixed-method software engineering case study approach to study
the experiences of 27 developers collaborating on this task, focusing on understanding
the experience and performance of participants from varying backgrounds, the char-
acteristics of collaboratively built feature engineering code, and the performance of
the resulting model compared to alternative approaches. The resulting project is one
of the largest ML modeling collaborations on GitHub, and outperforms both state-of-
the-art tabular AutoML systems and independent data science experts. We find that
both beginners and experts (in terms of their background in software development,
ML modeling, and the problem domain) can successfully contribute to such projects
and that domain expertise in collaborators is critical. We also identify themes of goal
clarity, learning by example, distribution of work, and developer-friendly workflows
as important touchpoints for future design and research in this area.
We present our analysis of the predict-census-income case study in Chapter 4.
1.1.3 Supporting data scientists with automation
Third, we complement collaborative work on data science steps like feature engineer-
ing with a full-fledged framework for ML pipelines and automated machine learning
(AutoML).
22

As data scientists focus their efforts on certain steps, we want to ensure that other
steps in the process are not ignored, but rather automated using the best available
tools. We introduce the Machine Learning Bazaar (ML Bazaar), a framework for
constructing tunable, end-to-end ML pipelines.2 While AutoML is increasingly being
used in large data-native organizations, and is offered as a service by several cloud
providers, there was no existing open-source AutoML system flexible enough to be
incorporated into end-to-end ML pipelines to meet these needs.
ML Bazaar differentiates itself from other AutoML frameworks in several ways.
First, we introduce new abstractions, such as ML primitives — human-driven anno-
tations of components from independent ML software libraries that can be seamlessly
composed within a single program. Second, we emphasize curation as a key principle.
We empower ML experts to identify the best-performing ML primitives and pipelines
from their experience and recommend only these curated components to users. Third,
we design for composability of the libraries that comprise ML Bazaar. Fourth, we en-
able automation over all components in the framework, such that primitives and
pipelines can expose their hyperparameter configuration spaces to be searched. As a
result, our underlying libraries can be used in different combinations, such as for a
black-box AutoML system, an anomaly detection system for satellite telemetry data,
or several other applications that we highlight. The combination of Ballet and ML
Bazaar comprises an important step toward end-to-end ML in a collaborative and
open-source setting.
The Machine Learning Bazaar is presented in Chapter 6.
1.1.4 Putting the pieces together
Fourth, we combine the elements of this thesis and deploy them in a collaborative
project to predict life outcomes.
Social scientists are increasingly using predictive ML modeling tools to gain in-
sights into problems in their field, although the practice and methods of machine
learning are not widely understood within many social science research communities.2https://mlbazaar.github.io
23

One recent attempt to bridge this gap was the Fragile Families Challenge (FFC, Sal-
ganik et al., 2020), which aimed to prompt the development of predictive models for
life outcomes from data collected as part a longitudinal study on a set of disadvan-
taged children and their families. Unfortunately, after a massive effort to design the
challenge and develop predictive models, FFC organizers concluded that “even the
best predictions were not very accurate” and that “the best submissions [...] were
only somewhat better than the results from a simple benchmark model” (Salganik
et al., 2020).
Can collaborative data science offer something that was not achieved by a com-
petitive approach? We use both Ballet and ML Bazaar on this challenging prediction
problem, performing collaborative feature engineering within a larger ML pipeline
that is automatically tuned. We compare our approach to the results of the FFC
challenge, and offer a discussion of the future of collaboration on prediction problems
in the social sciences.
Our exploration of the Fragile Families Challenge using the tools introduced in
this thesis is presented in Chapter 8.
1.2 Statement of prior publication
Chapters 3 to 5 are adapted from and extend the previously published works, En-
abling Collaborative Data Science Development with the Ballet Framework (Smith
et al., 2021a), which will appear at the ACM Conference on Computer-Supported
Cooperative Work and Social Computing (CSCW), and Meeting in the Notebook: A
Notebook-Based Environment for Micro-Submissions in Data Science Collaborations
(Smith et al., 2021b).
Chapters 6 and 7 are adapted from and extend the previously published work, The
Machine Learning Bazaar: Harnessing the ML Ecosystem for Effective System De-
velopment (Smith et al., 2020), which appeared at the ACM International Conference
on Management of Data (SIGMOD).
All co-authors have given permission for these works to be adapted and repro-
24

duced in this thesis. I am grateful for their collaboration on these shared ideas and
projects, and this research would not have been possible without them. In particu-
lar, Carles Sala is the lead developer and designer of several software libraries and
systems described in Chapter 6, including MLBlocks and AutoBazaar, and has been
a wonderful collaborator throughout the ML Bazaar project.
1.3 Thesis summary
In the rest of this thesis, I describe these four aspects of my research. This research
lays building blocks for an emerging type of collaborative data analysis and machine
learning, which can allow us to more effectively use these powerful tools to address
the most important problems facing our society. While the road to fully collaborative,
open, and automated data science is long, I believe that much progress will continue
to be made.
25

Chapter 2
Background
2.1 Data science and feature engineering
The increasing availability of data and computational resources has led many organi-
zations to turn to data science, or a data-driven approach to decision-making under
uncertainty. Consequently, researchers have studied data science work practices on
several levels, and the data science workflow is now understood as a complex, iter-
ative process that includes many stages and steps. The stages can be summarized
as Preparation, Modeling, and Deployment (Muller et al., 2019; Wang et al., 2019b;
Santu et al., 2021) and encompass smaller steps such as task formulation, prediction
engineering, data cleaning and labeling, exploratory data analysis, feature engineer-
ing, model development, monitoring, and analyzing bias. Within the larger set of
data science workers involved in this process, we use data scientists to refer to those
who contribute to a data science project.
Within this broad setting, the step of feature engineering holds special importance
in some applications. Feature engineering is the process through which data scientists
write code to transform raw variables into feature values, which can then be used as
input for a machine learning model. (This process, also called feature creation, devel-
opment, or extraction, is sometimes grouped with data cleaning and data preparation
steps, as in Muller et al. 2019.) Features form the cornerstone of many data science
tasks, including not only predictive ML modeling, in which a learning algorithm finds
26

predictive relationships between feature values and an outcome of interest, but also
causal modeling through propensity score analysis, clustering, business intelligence,
and exploratory data analysis. Practitioners and researchers have widely acknowl-
edged the importance of engineering good features for modeling success, particularly
in predictive modeling (Domingos, 2012; Anderson et al., 2013; Veeramachaneni et al.,
2014).
Before we continue discussing feature engineering, we introduce some terminology
that we will use throughout this thesis. A feature function is a transformation ap-
plied to raw variables that extracts feature values, or measurable characteristics and
properties of each observation. A feature definition is source code written by a data
scientist to create a feature function.1 If many feature functions are created, they
can be collected into a single feature engineering pipeline that executes the computa-
tional graph made up of all of the feature functions and concatenates the result into
a feature matrix.
In an additional step in ML systems, feature engineering is increasingly augmented
by applications like feature stores and feature management platforms to help with
critical functionality like feature serving, curation, and discovery (Hermann and Del
Balso, 2017; Wooders et al., 2021).
Though there have been attempts to automate the feature engineering process in
certain domains, including relational databases and time series analysis (Kanter and
Veeramachaneni, 2015; Khurana et al., 2016; Christ et al., 2018; Katz et al., 2016),
it is widely accepted that in many areas that involve large and complex datasets,
like health and business analytics, human insight and intuition are necessary for
success in feature engineering (Domingos, 2012; Smith et al., 2017; Wagstaff, 2012;
Veeramachaneni et al., 2014; Bailis, 2020).
Human expertise is invaluable for understanding the complexity of a dataset,
theorizing about different relationships, patterns, and representations in the data,
and implementing these ideas in code in the context of the machine learning problem.1Any of these terms may be referred to as “features” in other settings, but we make a distinction
between the source code, the transformation applied, and the resulting values. In cases where thisdistinction is not important, we may also use “feature.”
27

Muller et al. (2019) observe that “feature extraction requires an interaction of domain
knowledge with practices of design-of-data.” As more people become involved in this
process, there is a greater chance that impactful “handcrafted” feature ideas will be
expressed; automation can be a valuable supplement to manual development.
Indeed, in prior work that led to the ideas presented in this thesis, we explored the
potential of FeatureHub, a cloud-hosted feature engineering platform (Smith et al.,
2017; Smith, 2018). In this conception, data scientists log into a cloud platform
and submit source code directly to a machine learning backend server. Features in
FeatureHub are simple Python functions that map a collection of data frames to a
vector of feature values, but have no learning or supervised components and do not
expose any metadata. The feature source code is stored in a database and is compiled
during an automated machine learning process. In experiments with freelance data
scientists, an automated model built using all features submitted to the database
outperformed individual models built using only features from one data scientist at
a time. However, it underperformed models created by data scientists on a machine
learning competition platform.
Figure 2.1: Architecture of the FeatureHub platform from our prior work, compris-ing the JupyterHub-based computing platform, Discourse-based discussion platform,backend feature database and automated machine learning evaluation server (fromSmith et al., 2017).
FeatureHub was a complicated system with many moving parts (Figure 2.1).
Building it posed significant engineering challenges, and it competed with highly-
resourced data science platform companies. We also identified challenges relating to
financial costs, environment flexibility, trust and security, transparency, and freedom
28

(Smith, 2018, Section 6). As a way forward, we proposed a turn toward “platform-
less collaboration,” with the goal of finding free and open-source replacements for the
functionality that a hosted data science platform usually provides.
In this thesis, we address and move well beyond the issues raised in our prior
work. We also build on understanding of the importance of human interaction within
the feature engineering process by creating a workflow that supports collaboration
in feature engineering as a component of a larger data science project. Ballet takes
a lightweight and decentralized approach suitable for the open-source setting, an
integrated development environment, and a focus on modularity and supporting col-
laborative workflows.
2.2 Collaborative and open data work
Just as we explore how multiple human perspectives enhance feature engineering,
there has been much interest within the human-computer interaction (HCI) and
computer-supported cooperative work (CSCW) communities in achieving a broader
understanding of collaboration in data work. For example, within a wider typology
of collaboratories (collaborative organizational entities), Bos et al. (2007) study both
community data systems and open community contribution systems, such as the Pro-
tein Databank and Open Mind Initiative. Zhang et al. (2020) show that data science
workers in a large company are highly collaborative in small teams, using a plethora
of tools for communication, code management, and more. Teams include workers in
many roles such as researchers, engineers, domain experts, managers, and communi-
cators (Muller et al., 2019), and include both experts and non-experts in technical
practices (Middleton et al., 2020). In an experiment with the prototype machine
learning platform described above, Smith et al. (2017) show that 32 data scientists
made contributions to a shared feature engineering project and that a model using
all of their contributions outperformed a model from the best individual performer.
Functionalities including a feature discovery method and a discussion forum helped
data scientists learn how to use the platform and avoid duplicating work.
29

Contrary to popular understandings of collaboration as relying on direct commu-
nication, stigmergy is the phenomenon of collaboration by indirect communication
mediated by modifications of the environment (Marsh and Onof, 2008). Stigmergic
collaboration is a feasible collaborative mode for data science teams, allowing them
to coordinate around a shared work product such as a data science pipeline. Crow-
ston et al. (2019) introduce these ideas in the context of the MIDST project. They
first introduce a conceptual framework for stigmergic collaboration in a data science
project built around the concepts of visibility, combinability, and genre. They then
create an experimental web-based data science application that allows data scientist
to compose a data flow graph based on different “nodes” like executable scripts, data
files, and visualizations. The tool was evaluated on teams of 3–6 data science students
and was shown to be “usable and seemingly useful” and facilitated stigmergic coordi-
nation. Like MIDST, in Ballet we are inspired by open-source software development
practices and the desire to improve development workflows for data science pipelines.
We expand on this body of work by extending the study of collaborative data work
to predictive modeling and feature engineering, and by using the feature engineering
pipeline as a shared work product to coordinate collaborators at a larger scale than
previously observed. Instead of communicating directly, data scientists can collabo-
rate indirectly by browsing, reading, and extending existing feature engineering code
structured within a shared repository.
One finding in common in previous studies is that data science teams are usually
small, with six or fewer members (Zhang et al., 2020). There are a variety of ex-
planations for this phenomenon in the literature. Technical and non-technical team
members may speak “different languages” (Hou and Wang, 2017). Different team
members may lack common ground while observing project progress and may use
different performance metrics (Mao et al., 2019). Individuals may be highly spe-
cialized, and the lack of a true “hub” role on teams (Zhang et al., 2020) along with
the use of synchronous communication forms like telephone calls and in-person dis-
cussion (Choi and Tausczik, 2017) make communication challenges likely as teams
grow larger. In the context of open-source development, predictive modeling projects
30

Software engineering ML modeling
torvalds/linux 20,000+ tesseract-ocr/tesseract 130DefinitelyTyped/DefinitelyTyped 12,600+ CMU-PCL/openpose 79Homebrew/homebrew-cask 6,500+ deepfakes/faceswap 71ansible/ansible 5,100+ JaidedAI/EasyOCR 62rails/rails 4,300+ ageitgey/face_recognition 43gatsbyjs/gatsby 3,600+ predict-census-income (Chapter 4) 27helm/charts 3,400+ microsoft/CameraTraps 21rust-lang/rust 3,000+ Data4Democracy/drug-spending 21
Table 2.1: The number of unique contributors to large open-source collaborations ineither software engineering or predictive machine learning modeling. ML modelingprojects that are developed in open-source have orders of magnitude fewer contribu-tors.2
generally have orders of magnitude fewer collaborators than other types of software
projects (Table 2.1).
One possible implication of this finding is that, in the absence of other tools and
processes, human factors of communication, coordination, and observability make it
challenging for teams to work well at scale. Difficulties with validation and curation
of feature contributions presented challenges for Smith et al. (2017), which points to
the limitations of existing feature evaluation algorithms. Thus, algorithmic challenges
may complement human factors as obstacles to scaling data science teams. However,
additional research is needed into the question of why data science collaborations are
not larger. We provide a starting point through a case study analysis in this work.
Moving from understanding to implementation, other approaches to collaboration
in data science work include crowdsourcing, synchronous editing, and competition.
Unskilled crowd workers can be harnessed for feature engineering tasks within the
Flock platform, such as by labeling data to provide the basis for further manual
feature engineering (Cheng and Bernstein, 2015). Synchronous editing interfaces,
like those of Google Colab and others for computational notebooks (Garg et al.,
2018; Kluyver et al., 2016; Wang et al., 2019a), facilitate multiple users to edit a
machine learning model specification, typically targeting pair programming or other2Details and methodology are available at Smith et al. (2021a, Appendix A) or https://github.
com/micahjsmith/ballet-cscw-2021.
31

very small groups. In our work, we explore different-time, different-place collaboration
(Shneiderman et al., 2016) in an attempt to move beyond the limitations of small
group work. A form of collaboration is also achieved in data science competitions
like the KDD Cup, Kaggle, and the Netflix Challenge (Bennett and Lanning, 2007)
and using networked science hubs like OpenML (Vanschoren et al., 2013). While
these have led to state-of-the-art modeling performance, there is no natural way for
competitors to systematically integrate source code components into a single shared
product. In addition, individual teams formed in competitions hosted on Kaggle are
small, with the mean team having 2.6 members and 90% of teams having four or
fewer members, similar to other types of data science teams as discussed above.3
Closely related is open data analysis or open data science, in which publicly avail-
able datasets are used by “civic hackers” and other technologists to address civic
problems, such as visualizations of lobbyist activity and estimates of child labor us-
age in product manufacturing (Choi and Tausczik, 2017). Existing open data analysis
projects involve a small number of collaborators (median of three) and make use of
synchronous communication (Choi and Tausczik, 2017). A common setting for open
data work is hackathons, during which volunteers collaborate with non-profit organi-
zations to analyze their internal and open data. Hou and Wang (2017) find that civic
data hackathons create actionable outputs and improve organizations’ data literacy,
relying on “client teams” to prepare data for analysis during the events and to broker
relationships between participants. Looking more broadly at collaborative data work
in open science, interdisciplinary collaborations in data science and biomedical science
are studied in Mao et al. (2019), who find that readiness of a team to collaborate is
influenced by its organizational structures, such as dependence on different forms of
expertise and the introduction of an intermediate broker role. In our work, we are
motivated by the potential of open data analysis, but focus more narrowly on data
science and feature engineering.3Author’s calculation from Meta Kaggle of all teams with more than one member.
32

2.3 Open-source development
In the early 1990s, a programmer named Linus Torvalds started working on a new
implementation of a UNIX-like operating system kernel. The development of the new
kernel came as a shock to seasoned companies. A loose group of developers from
around the world were sharing their source code and sending patches over email. The
project, which became known as the Linux kernel, quickly took off. It was only later
in the decade that Eric S. Raymond popularized the term “open-source software” to
define what this process looked like for Linux and similar efforts.
In just thirty years, the open-source phenomenon has had a dramatic impact on
the computing and internet revolutions. By 2020, countless open-source projects
were hosted on popular platforms like GitHub, GitLab, SourceForge, and Bitbucket,
with over 200 million repositories on GitHub alone (GitHub). The largest technology
companies share the source code of ambitious projects that cost millions of engineer
dollars to create and, in turn, receive contributions from growing communities of
users. Linux runs on billions of devices. Open-source has enabled thousands or tens
of thousands of unique contributors from around the world to come together to create
popular and high-performance web frameworks, deep learning libraries, database sys-
tems, chess engines, electronics platforms, and more. The open-source paradigm has
also come to be applied to other artifacts beyond software applications and libraries,
including online courses, books, and resource lists.
The open-source model for developing software has been adopted and advanced by
many individuals and through many projects (Raymond, 1999). In the open-source
model, projects are developed publicly and source code and other materials are freely
available on the internet; the more widely available the source code, the more likely it
is that a contributor will find a defect or implement new functionality (“with enough
eyes, all bugs are shallow”). With freely available source code, open-source projects
may attract thousands of contributors: developers who fix bugs, contribute new func-
tionality, write documentation and test cases, and more. With more contributors
comes the prospect of conflicting patches, leading to the problem of integration. In
33

order to support open-source developers, companies and organizations have made a
variety of lightweight infrastructure and developer tooling freely available for this
community, such as build server minutes and code analysis tools.
Closely associated with the open-source model is the open-source software de-
velopment process, exemplified by the pull-based development model (or pull request
model), a form of distributed development in which changes are pulled from other
repositories and merged locally. As implemented on the social code platform GitHub,
developers fork a repository to obtain their own copy and make changes indepen-
dently; proposed changes — pull requests (PRs) — are subject to discussions and
code reviews in context and are analyzed by a variety of automated tools. The pull
request model has been successful in easing the challenges of integration at scale and
facilitating massive software collaborations.
As of 2013, 14% of active repositories on GitHub used pull requests. An equal
proportion used shared repositories without pull requests, while the remainder were
single-developer projects (Gousios et al., 2014). Pull request authors use contex-
tual discussions to cover low-level issues but supplement this with other channels for
higher-level discussions (Gousios et al., 2016). Pull request integrators play a critical
role in this process but can have difficulty prioritizing contributions at high volume
(Gousios et al., 2015). Additional tooling has continued to grow in popularity partly
based on these observations. Recent research has visited the use of modern devel-
opment tools like continuous integration (Vasilescu et al., 2015; Zhao et al., 2017;
Vasilescu et al., 2014), continuous delivery (Schermann et al., 2016), and crowd-
sourcing (Latoza and Hoek, 2016). In this work, we specifically situate data science
development within the open-source development process and explore what changes
and enhancements are required for this development model to meet the needs of data
scientists during a collaboration.
34

2.4 Testing for machine learning
As part of our framework, we discuss the use of testing in continuous integration to
validate contributions to data science pipelines. Other research has also explored the
use of continuous integration in machine learning. Renggli et al. (2019) investigate
practical and statistical considerations arising from testing conditions on overall model
accuracy in a continuous integration setting. Specific models and algorithms can
be tested (Grosse and Duvenaud, 2014) and input data can be validated directly
(Hynes et al., 2017; Breck et al., 2019). Testing can also be tied to reproducibility
in ML research (Ross and Forde, 2018). We build on this work by designing and
implementing the first system and algorithms that conduct ML testing at the level of
individual feature definitions.
Feature engineering is just one of many steps involved in data science. Other re-
search has looked at the entire endeavor from a distance, considering the end-to-end
process of delivering a predictive model from some initial specification. Automated
machine learning (AutoML) systems like AutoBazaar, AutoGluon, and commercial
offerings from cloud vendors (Smith et al., 2020; Erickson et al., 2020) can automati-
cally create predictive models for a variety of ML tasks. A survey of techniques used
in AutoML, such as hyperparameter tuning, model selection, and neural architec-
ture search, can be found in Yao et al. (2019). On the other hand, researchers and
practitioners are increasingly realizing that AutoML does not solve all problems and
that human factors such as design, monitoring, and configuration are still required
(Cambronero et al., 2020; Xin et al., 2021; Wang et al., 2019c, 2021). In our exper-
iments, we use an AutoML system to evaluate the performance of different feature
sets without otherwise incorporating these powerful techniques into our framework.
2.5 Machine learning systems
Researchers have developed numerous algorithmic and software innovations to make
ML and AutoML systems possible in the first place.
35

ML libraries High-quality ML libraries have been built over a period of decades.
For general ML applications, scikit-learn implements many different algorithms using
a common API centered on the influential fit/predict paradigm (Buitinck et al.,
2013). Libraries more suitable for specialized analysis have been developed in various
academic communities, often with different and incompatible APIs (Bradski, 2000;
Hagberg et al., 2008; Kula, 2015; Kanter and Veeramachaneni, 2015; Bird et al., 2009;
Abadi et al., 2015). In ML Bazaar , we connect and link components of these libraries,
supplementing with our own functionalities only where needed.
ML systems Prior work has provided several approaches that make it easier to
develop ML systems. For example, caret (Kuhn, 2008) standardizes interfaces and
provides utilities for the R ecosystem, but without enabling more complex pipelines.
Recent systems have attempted to provide graphical interfaces, including Gong et al.
(2019) and Azure Machine Learning Studio. The development of ML systems is
closely tied to the execution environments needed to train, deploy, and update the
resulting models. In SystemML (Boehm et al., 2016) and Weld (Palkar et al., 2018),
implementations of specific ML algorithms are optimized for specific runtimes. Velox
(Crankshaw et al., 2015) is an analytics stack component that efficiently serves pre-
dictions and manages model updates.
AutoML libraries AutoML research has often been limited to solving the individ-
ual sub-problems that make up an end-to-end ML workflow, such as data cleaning
(Deng et al., 2017), feature engineering (Kanter and Veeramachaneni, 2015; Khu-
rana et al., 2016), hyperparameter tuning (Snoek et al., 2012; Gomes et al., 2012;
Thornton et al., 2013; Feurer et al., 2015; Olson et al., 2016; Jamieson and Talwalkar,
2016; Li et al., 2017; Baudart et al., 2020), or algorithm selection (van Rijn et al.,
2015; Baudart et al., 2020). AutoML solutions are often not widely applicable or de-
ployed in practice without human support. In contrast, ML Bazaar integrates many
of these existing approaches and designs one coherent and configurable structure for
joint tuning and selection of end-to-end pipelines.
36

AutoML systems AutoML libraries typically make up one component within a
larger system that aims to manage several practical aspects, such as parallel and
distributed training, tuning, and model storage, and even serving, deployment, and
graphical interfaces for model building. These include ATM (Swearingen et al., 2017),
Vizier (Golovin et al., 2017), and Rafiki (Wang et al., 2018), as well as commercial
platforms like Google AutoML, DataRobot, and Azure Machine Learning Studio.
While these systems provide many benefits, they have several limitations. First, they
each focus on a specific subset of ML use cases, such as computer vision, NLP, fore-
casting, or hyperparameter tuning. Second, these systems are designed as proprietary
applications and do not support community-driven integration of new innovations.
ML Bazaar provides a new approach to developing such systems in the first place: It
supports a wide variety of ML task types, and builds on top of a community-driven
ecosystem of ML innovations. Indeed, it could serve as the backend for such ML
services or platforms.
The DARPA D3M program (Lippmann et al., 2016), which we participated in,
supports the development of automated systems for model discovery that can be
used by non-experts. Several differing approaches are being developed for this pur-
pose. For example, Alpine Meadow (Shang et al., 2019) focuses on efficient search
for producing interpretable ML pipelines with low latencies for interactive usage. It
combines existing techniques from query optimization, Bayesian optimization, and
multi-armed bandits to efficiently search for pipelines. AlphaD3M (Drori et al., 2018)
formulates a pipeline synthesis problem and uses reinforcement learning to construct
pipelines. In contrast, ML Bazaar is a framework for developing ML or AutoML
systems in the first place. While we present our open-source AutoBazaar system,
it is not the primary focus of our work and represents a single point in the overall
design space of AutoML systems using our framework libraries. Indeed, one could use
specific AutoML approaches like the ones described by Alpine Meadow or AlphaD3M
for pipeline search within our own framework.
Santu et al. (2021) present a recent survey of AutoML, summarizing seven levels
of automation that can be provided by AutoML systems and contextualizing existing
37

work within the framework. ML Bazaar is categorized as a system with “Level 4”
automation in that it automates machine learning, alternative models exploration,
testing, validation, and some feature engineering, but does not provide automated
prediction engineering, task formulation, or result summary and recommendation.
2.6 Prediction policy problems
The predominant quantitative methodology in the social sciences is that of causal
inference. Social scientists and policy makers use the tools of causal inference to
identify factors that influence outcomes of interest or to explore counterfactual sce-
narios. What is the effect of an increase in the minimum wage on employment levels?
Would increasing the amount of food assistance to needy families lead to less truancy
in school? These are questions typically answered using the tools of causal inference
such as randomized controlled trials or regression analysis.
While causal inference allows us to clearly answer many relevant socio-political
questions, it can be a challenge to a conduct an analysis rigorously. Models must
be well-specified, all confounding variables must be accounted for, assumptions must
be made and validated about the distribution of variables and errors, and statistical
tests must be chosen appropriately for the setting. These methodological challenges
and many others have led to researchers to explore alternative paradigms (Breiman,
2001).
Another increasingly popular approach is to use the toolkit of predictive machine
learning to gain insight into societal problems. With this approach, researchers iden-
tify an outcome of interest and attempt to build a predictive model, often using
machine learning, to predict this outcome using all available information. Prediction
can be used as an actual policy tool (i.e., while implementing a policy intervention,
such as targeting or prioritizing the provision of social services) and as an alterna-
tive method for better understanding different phenomena. The primary validation
method is to estimate generalization performance by evaluating out-of-sample predic-
tive accuracy, rather than by assessing goodness of fit or parsimony. Problems that
38

can be addressed using these tools are known as prediction policy problems (Kleinberg
et al., 2015).
There are many recent examples of prediction policy problems:
• Sadilek et al. (2018) developed a predictive model, “FINDER” to identify sources
of foodborne illness outbreaks and thereby prioritize restaurant health inspec-
tions. Using anonymized cell phone location data and internet search histories,
they can classify whether and where a person experienced foodborne illness.
• Data scientists at Chicago’s Department of Innovation and Technology similarly
built a predictive model to determine which restaurants were at highest risk of
being in violation of health codes, and thereby prioritize health inspector visits
to these sites (Spector, 2016). The source code for the model was released and
it was later adopted by Montgomery County, Maryland.
• Chouldechova et al. (2018) developed a predictive risk modeling tool to be used
in child welfare screening, which they evaluated in Allegheny County, PA. The
tool supplements case workers in determining risks involved in referrals to child
protection agencies. Investigation is prioritized for children identified as highest
risk.
• Kleinberg et al. (2015) also report on a case study predicting which hip replace-
ment surgeries for Medicare beneficiaries are most likely to prove “futile,” in that
they do not improve patients’ quality of life relative to their remaining months
or years, yet still cost the health care system. Those with lower mortality risk,
rather than higher, would benefit most from such procedures.
For every report of machine learning successfully being used in a policy prediction
problem, there are two showing the biases or ethical challenges of such practices. For
example, using machine learning in recidivism risk prediction is a contentious issue,
with competing claims that either using or not using recidivism prediction models
leads to more racial bias. Law enforcement organizations like police departments
use systems for “predictive policing” that aim to identify “hot spots” of crime, but
39

may actually result in over-policing of predominantly communities of color without a
public safety benefit. A common thread in these more controversial uses of machine
learning for public policy is that algorithmic systems may be used to “launder” human
biases — for instance, that they seem to prioritize public resources in a race-neutral
way, but actually perpetuate discrimination. In addition, not every policy problem
can be a prediction policy problem — for example, we may be (rightly) uncomfortable
using the output of a model to deny someone welfare payments because of a predicted
risk of some negative behavior that has not yet occurred (Kleinberg et al., 2016).
2.7 The Fragile Families Challenge
Part of the challenge here is that it is difficult for practitioners, researchers, and pol-
icymakers to think sufficiently rigorously about ML methodology. The practice and
methods of machine learning are not widely understood by experts within many social
science research communities. One recent attempt to connect the social science com-
munity to these new tools was the Fragile Families Challenge (FFC, Salganik et al.,
2020). Here we give some detailed background on the challenge in order to contex-
tualize our later discussions of collaborative data science development (Chapters 3
and 8).
The Fragile Families Challenge spurred the development of models meant to pre-
dict life outcomes from data collected as part of the Fragile Families and Child Well-
being Study (Reichman et al., 2001), which includes detailed longitudinal records on
a set of disadvantaged children and their families. Organizers released anonymized
and merged data on a set of 4,242 families, with data collected from the birth of the
child until age nine. Participants in the challenge were then tasked with predicting
six life outcomes of the child or family when the child reached age 15: child grade
point average, child grit, household eviction, household material hardship, primary
caregiver layoff, and primary caregiver participation in job training. Submissions were
evaluated with respect to the mean squared error on a held-out test set. The FFC
was run over a four month period in 2017 and received 160 submissions from 437
40

entrants, who comprised social scientists, machine learning practitioners, students,
and others.
Organizers cited three reasons for approaching a social science problem through a
machine learning challenge. First, they noted the increased use of machine learning
in prediction policy problems, as we have reviewed above. Second, in the context
of social science research into life outcomes, measuring the predictability itself of life
outcomes gives a measure of “social rigidity,” or the degree to which life outcomes
are dictated by one’s circumstances at birth. Third, the sustained effort involved
in a machine learning challenge could lead to developments in theory, methods, and
data collection, such as has been observed in the Netflix Prize (Bennett and Lanning,
2007) and elsewhere.
In addition to ML performance, organizers sought out solutions that could be
documented, published, and reproduced. Teams were invited to publish descriptions
of their solutions in a special issue of the journal Socius (Salganik et al., 2019), with
an assessment of computational reproducibility as part of the peer review process (Liu
and Salganik, 2019). Organizers found that reproducibility was difficult to achieve,
as only 7/12 accepted manuscripts were able to be reproduced even after an extensive
revision process.
Through an analysis of the solutions included in the special issue, we are able to
broadly describe how the typical challenge participant approached modeling. Orga-
nizers described a four-step process (Salganik et al., 2019):
• Feature engineering. The raw data needed significant processing before it could
be used in modeling, a stage that organizers deemed “data preparation,” but
that we include as part of feature engineering (Section 2.1). The main tasks
in this step include replacing or imputing missing values, encoding categorical
variables, and constructing new variables from other variables. The data exhib-
ited complicated patterns of “missingness,” due to skip patterns, nonresponse,
and data collection errors. Salganik et al. (2019) report that participants “spent
large amounts of time converting the data into a format more suitable for anal-
ysis” and that “anecdotally, many participants spent a lot of time addressing
41
missing data.”
• Feature selection. The feature matrix that resulted from the feature engineering
process was usually very high-dimensional. With tens of thousands of features,
but only two thousand training observations, most learning algorithms require
a dimensionality reduction step such as feature selection. Participants used a
variety of approaches, including manual or automated selection using LASSO
or mutual information.
• ML Modeling. When the feature matrix was ready for ML modeling, partic-
ipants used a variety of learning algorithms, such as linear regression models,
with and without regularization, as well as tree-based models including decision
trees, random forests, and gradient-boosted trees.
• Evaluation. The final step was evaluation, or “model interpretation,” wherein
participants aimed to use their best performing predictive models to better
understand the predictability of life outcomes, pursuant to the goals of the
challenge. They interpreted regression coefficients or computed variable impor-
tance, depending on the type of model used.
After the challenge had closed, organizers scored all submissions using the held-out
test dataset. It turned out that even the winning submissions were not very accurate
in predicting life outcomes. Organizers computed the metric 𝑅2Holdout, a scaled version
of the mean squared error that took the value 1 for perfect predictions, the value 0
for predicting the mean of the training dataset, and was unbounded below. The
most predictable outcomes were material hardship and GPA, with an 𝑅2Holdout = 0.2,
while the other four outcomes had 𝑅2Holdout ≈ 0.05. In other words, these winning
scores were only slightly more accurate than predicting the mean of the training
dataset. This partly arises from the significant class/outcome imbalance in the data
— most families did not experience adverse events such as eviction and layoff. Thus,
predicting the mode (that the event did not occur) for every family leads to a model
that performs reasonably well on the chosen mean-squared error metric, which does
not account for outcome imbalance.
42

Part I
Collaborative and open data science
43

Chapter 3
Ballet: a framework for collaborative,
open-source data science
3.1 Introduction
The open-source software development model has led to successful, large-scale col-
laborations in building software libraries, software systems, chess engines, scientific
analyses, and more (Raymond, 1999; Linux; GNU; Stockfish; Bos et al., 2007). For
these projects, hundreds or even thousands of collaborators contribute code to shared
repositories using well-defined software development processes.
Collaboration is also required during many steps of the data science process. For
example, in feature engineering within predictive modeling, data scientists and do-
main experts collaborate so that creative ideas for features can be expressed and
incorporated into a feature engineering pipeline.
However, workflows in predictive modeling more often emphasize independent
work, and data science collaborations tend to be smaller in scale (Choi and Tausczik,
2017), especially in the context of open-source projects (Table 2.1).
Given this state of affairs, we ask: Can we support larger collaborations in predic-
tive modeling projects by applying successful open-source development models?
In this chapter, we show that we can successfully adapt and extend the pull request
development model to support collaboration during important steps within the data
44
science process by introducing a new development workflow and ML programming
model. Our approach, the Ballet framework, is based on decomposing steps in the
data science process into modular data science “patches” that can then be intelligently
combined, representing objects like “feature definition,” “labeling function,” or “slice
function.” Prospective collaborators work in parallel to write patches and submit
them to a shared repository. Ballet provides the underlying functionality to support
interactive development, test and merge high-quality contributions, and compose the
accepted contributions into a single product. Projects built with Ballet are struc-
tured and organized by these modular patches, yielding additional benefits including
reusability, maintainability, reproducibility, and automated analysis. Our lightweight
framework does not require any computing infrastructure beyond that which is freely
available in open-source software development.
While data science and predictive modeling have many steps, we identify fea-
ture engineering as an important one that could benefit from a more collaborative
approach. We thus instantiate these ideas in Ballet,1 a lightweight software frame-
work for collaborative data science that supports collaborative feature engineering
on tabular data. Data scientists can use Ballet to grow a shared feature engineering
pipeline by contributing feature definitions, which are each subjected to software and
ML performance validation. Together with Assemblé — a data science development
environment customized for Ballet — even novice developers can contribute to large
collaborations.
Having provided background on data science, collaborative data work, and open-
source software development in Chapter 2, the remainder of this chapter proceeds
as follows. We first describe a conceptual framework for collaboration in data sci-
ence projects in Section 3.2, which we then apply to create the Ballet framework in
Section 3.3. We next describe key components of Ballet’s support for collaborative
feature engineering, such as the feature definition and feature engineering pipeline ab-
stractions, in Section 3.4. We present acceptance procedures for feature definitions,
including the use streaming feature definition selection algorithms in Section 3.5. Fi-1https://ballet.github.io and https://github.com/ballet/ballet
45

nally, in Section 3.6, we introduce the Assemblé development environment, which
supports data scientists in collaborating and contributing code entirely from within
a notebook setting.
In the subsequent chapter (Chapter 4), we will present a case study analysis
of a predictive model built by 27 collaborators using Ballet. We discuss our work
and results in Chapter 5, including future directions for designers and researchers in
collaborative data science frameworks.
3.2 Conceptual framework
Having noticed the success of open-source software development along with the chal-
lenges in collaborative data science, we set out to understand whether these two
paradigms could complement each other, as well as to better grasp the current state
of large-scale collaboration in data science. In this section, we describe the formation
of key design concepts that underlie the creation of Ballet. Our methods reflect an
iterative and informal design process that played out over the time we have worked
on this problem as well as through two preliminary user studies (Section 3.7).
The pull request model (Section 2.3) has been particularly successful in enabling
integration of proposed changes in shared repositories, and is already used for well
over one million shared repositories on GitHub (Gousios et al., 2015, 2016). We in-
formally summarize this development model using the concepts of product, patch, and
acceptance procedure. A software artifact is created in a shared repository (product).
An improvement to the product is provided in a standalone source code contribution
proposed as a pull request (patch). Not every contribution is worthy of inclusion, so
high-quality and low-quality contributions must be distinguished (acceptance proce-
dure). If accepted, the pull request can be merged.
Given the success of open-source development processes like the pull request
model, we ask: Can we apply the pull request model to data science projects in order
to collaborate at a larger scale?
46

3.2.1 Challenges
When we set out to apply the pull request model to data science projects, we found
the model was not a natural fit, and discovered key challenges to address, which we
describe here. As people embedded in data science work, we built on our own experi-
ence developing and researching feature engineering pipelines and other data science
steps from a machine learning perspective. We also uncovered and investigated these
challenges in preliminary user studies with prototypes of our framework (Section 3.7).
We synthesize these challenges in the context of the literature on collaborative
data work and machine learning workflows. Previous work outside the context of
open-source development has identified challenges in communication, coordination,
observability, and algorithmic aspects (Section 2.2). In addition, Brooks Jr (1995)
observed that the number of possible direct communication channels in a collabora-
tive software project scales quadratically with the number of developers. As a result,
at small scales, data science teams may use phone calls or video chats, with 74% com-
municating synchronously and in person (Choi and Tausczik, 2017). At larger scales,
like those made possible by the open-source development process, communication can
take place more effectively through coordination around a shared work product, or
through discussion threads and chat rooms.
Ultimately, we list four challenges for a collaborative framework to address. While
not exhaustive, this list comprises the challenges we mainly focus on in this work,
though we review and discuss additional ones in Chapters 2 and 5.
C1 Task management. Working alone, data scientists often write end-to-end scripts
that prepare the data, extract features, build and train model models, and tune
hyperparameters (Subramanian et al., 2020; Rule et al., 2018; Muller et al.,
2019). How can this large task be broken down so that all collaborators can
coordinate with each other and contribute without duplicating work?
C2 Tool mismatch. Data scientists are accustomed to working in computational
notebooks, and have varying expertise with version control tools like
git (Subramanian et al., 2020; Chattopadhyay et al., 2020; Kery et al., 2018;
47

challenge design concept components of Ballet
task management(C1)
data science patches(D1)
feature definition abstraction (3.4.1),feature engineering language (3.4),patch development in Assemblé (3.6)
tool mismatch(C2)
data scienceproducts inopen-sourceworkflows (D2)
feature engineering pipeline abstraction (3.4.5),patch contribution in Assemblé (3.6),CLI for project administration (3.3.1)
evaluating contributions(C3)
software andstatisticalacceptanceprocedures (D3)
feature API validation (3.5.1),streaming feature definition selection (3.5.2),continuous integration (3.3.1),Ballet Bot (3.3.1)
maintaininginfrastructure (C4)
decentralizeddevelopment (D4)
F/OSS package (3.3.1),free infrastructure and services (3.3.1),bring your own compute (3.3.2)
Table 3.1: Addressing challenges in collaborative data science development by apply-ing our design concepts in the Ballet framework.
Rule et al., 2018). How can these workflows be adapted to use a shared codebase
and build a single product?
C3 Evaluating contributions. Prospective collaborators may submit code to a shared
codebase. Some code may introduce errors or decrease the performance of the
ML model (Smith et al., 2017; Renggli et al., 2019; Karlaš et al., 2020; Kang
et al., 2020). How can code contributions be evaluated?
C4 Maintaining infrastructure. Data science requires careful management of data
and computation (Sculley et al., 2015; Smith et al., 2017). Will it be neces-
sary to establish shared data stores and computing infrastructure? Would this
be expensive and require significant technical and DevOps expertise? Is this
appropriate for the open-source setting?
3.2.2 Design concepts
To address these challenges, we think creatively about how certain data science steps
might fit into a modified open-source development process. Our starting point is
48

to look for processes in which some important functionality can be decomposed
into smaller, similarly-structured patches that can be evaluated using standardized
measures. Through our experience researching and developing feature engineering
pipelines and systems, as well as our review of the requirements and key characteris-
tics of the feature engineering process, we found that we could extend and adapt the
pull request model to facilitate collaborative development in data science by following
a series of four corresponding design concepts (Table 3.1), which form the basis for
our framework.
D1 Data science patches. We identify steps of the data science process that can be
broken down into many patches — modular source code units — which can be
developed and contributed separately in an incremental process. For example,
given a feature engineering pipeline, a patch could be a new feature definition
added to the pipeline.
D2 Data science products in open-source workflows. A usable data science artifact
forms a product that is stored in an open-source repository. For example, when
solving a feature engineering task, the product is an executable feature engi-
neering pipeline. The composition of many patches from different collaborators
forms a product that is stored in a repository on a source code host in which
patches are proposed as individual pull requests. We design this process to
accommodate collaborators of all backgrounds by providing multiple develop-
ment interfaces. Notebook-based workflows are popular among data scientists,
so our framework supports creation and submission of patches entirely within
the notebook.
D3 Software and statistical acceptance procedures. ML products have the usual
software quality measures along with statistical/ML performance metrics. Col-
laborators receive feedback on the quality of their work from both of these points
of view.
D4 Decentralized development. A lightweight approach is needed for managing code,
data, and computation. In our decentralized model, each collaborator uses their
49

own storage and compute, and we leverage existing community infrastructure
for source code management and patch acceptance.
Besides feature engineering, how and when can this framework be used? Sev-
eral conditions must be met. First, the data science product must be able to be
decomposed into small, similarly-structured patches. Otherwise, the framework has
a limited ability to integrate contributions. Second, human knowledge and expertise
must be relevant to the generation of the data science patches. Otherwise, automation
or learning alone may suffice. Third, measures of statistical and ML performance, or
good proxies thereof, must be definable at the level of individual patches. Otherwise,
it is difficult for maintainers to reason about how and whether to integrate patches.
Finally, dataset size and evaluation time requirements must not be excessive. Other-
wise, we could not use existing services that are free for open-source development.2
So while we focus on feature engineering, this framework can apply to other steps
in data science pipelines — for example, data programming with labeling functions
and slicing functions (Ratner et al., 2016; Chen et al., 2019). Indeed, we present a
speculative discussion of applying Ballet to data programming projects in Section 9.1.
In the next section, we apply these design principles to describe a framework
for collaboration on predictive modeling projects, referring back to these challenges
and design concepts as they appear. Then in Section 3.4, we implement this general
approach more specifically for collaborative feature engineering on tabular data.
3.3 An overview of Ballet
Ballet extends the open-source development process to support collaborative data
science by applying the concepts of data science patches, data science products in
open-source workflows, software and statistical acceptance procedures, and decen-
tralized development. As this process is complex, we illustrate how Ballet works by
showing the experience of using it from three perspectives — maintainer, collaborator,2As a rough guideline, running the evaluation procedure on the validation data should take no
more than five minutes in order to facilitate interactivity.
50

and consumer — building on existing work that investigates different users’ roles in
open source development and ecosystems (Yu and Ramaswamy, 2007; Berdou, 2010;
Roberts et al., 2006; Barcellini et al., 2014; Hauge et al., 2010). This development
cycle is illustrated in Figure 3.1. In Section 3.4, we present a more concrete example
of feature engineering on tabular datasets.
3.3.1 Maintainer
A maintainer wants to build a predictive model. They first define the prediction
goal and upload their dataset. They install the Ballet package, which includes the
core framework libraries and command line interface (CLI). Next, they use the CLI
to automatically render a new repository from the provided project template, which
contains the minimal files and structure required for their project, such as directory
organization, configuration files, and problem metadata. They define a task for col-
laborators: create and submit a data science patch that performs well (C1/D1) — for
example, a feature definition that has high predictive power. The resulting repository
contains a usable (if, at first, empty) data science pipeline (C2/D2). After pushing
to GitHub and enabling our CI tools and bots, the maintainer begins recruiting col-
laborators.
Collaborators working in parallel submit patches as pull requests with a careful
structure provided by Ballet. Not every patch is worthy of inclusion in the product.
As patches arrive from collaborators in the form of pull requests, the CI service is
repurposed to run Ballet’s acceptance procedure such that only high-quality patches
are accepted (C3/D3). This “working pipeline invariant” aligns data science pipelines
with the aim of continuous delivery in software development (Humble and Farley,
2010). In feature engineering, the acceptance procedure is a feature validation suite
(Section 3.5) which marks individual feature definitions as accepted/rejected, and the
resulting feature engineering pipeline on the default branch can always be executed
to engineer feature values from new data instances.
One challenge for maintainers is to integrate data science patches as they begin
to stream in. Unlike software projects where contributions can take any form, these
51

+ from ballet import Feature+ from ballet.eng.external import SimpleImputer+ input = 'FHINS3C'+ transformer = SimpleImputer(strategy='median')+ feature = Feature(input, transformer)
src/predict_x/features/contrib/user_bob/feature.py
Contribute structured patches
src/predict_x/features/contrib/user_bob/__init__.py
Empty file.
Propose new feature #37Open bob wants to merge 1 commit into alice/ballet-predict-x from bob/ballet-predict-x:submit-feature
c
Pipeline usage
Consumer
$ pip install github.com/alice/ballet-predict-x$ python -m predict_x engineer-features \
—train-dir path/to/train/data \path/to/test/data \path/to/features/output
f
Automatic validation
Job Python State
Project structure validation 3.8 ✓Feature API validation 3.8 ✓ML performance validation 3.8 ✓
d
Maintainer
“We need to build a predictive model for X”
$ ballet quickstartGenerating new ballet project...full_name [Your Name]: Alice
a Create project
README.md
Predict XJoin our data science collaboration! Your task is to develop and submit feature definitions to the project.
e
After validation, your feature was accepted. It will be automatically merged into the project.
Beep beep - I’m a bot that helps manage Ballet projects. Learn more about me or report a problem.
ballet-bot commentedb bot
Continuous delivery
b ballet-bot merged commit c03452e into alice:master
2 checks passedbot
Collaborators
Develop feature definitionsb
from ballet import bentities, targets = b.api.load_data()
[ 1 ]
from ballet import Featureinput = 'FHINS3C'transformer = Nonefeature = Feature(input, transformer)
b.validate_feature_api(feature)
INFO - Building features and target...INFO - Building features and target...DONEINFO - Feature is NOT valid; here is some advice for resolving the feature API issues.INFO - NoMissingValuesCheck: When transforming sample data, the feature produces NaN values. If you reasonably expect these missing values, make sure you clean missing values as an additional step in your transformer list. For example: NullFiller(replacement=replacement)
False
[ 1 ]
[ 8 ]
[ 8 ]
[ 24 ]
[ 24 ]
Submitb
b.validate_feature_acceptance(feature)[ 25 ]
INFO - Building features and target...INFO - Building features and target...DONEINFO - Judging feature using SFDSAccepter: lmbda_1=0.01, lmbda_2=0.01INFO - I(feature ; target | existing_features) = .173
True[ 25 ]
Figure 3.1: An overview of collaborative data science development with the Balletframework for a feature engineering project. (Continued on the following page.)
52

Figure 3.1: An overview of collaborative data science development with the Balletframework for a feature engineering project. (a) A maintainer with a dataset wants tomobilize the power of the open data science community to solve a predictive modelingtask. They use the Ballet CLI to render a new project from a provided template andpush to GitHub. (b) Data scientists interested in collaborating on the project aretasked with writing feature definitions (defining Feature instances). They can launchthe project in Assemblé, a custom development environment built on Binder andJupyterLab. Ballet’s high-level client supports them in automatically detecting theproject configuration, exploring the data, developing candidate feature definitions,and validating feature definitions to surface any API and ML performance issues.Once issues are fixed, the collaborator can submit the feature definition alone byselecting the code cell and using Assemblé’s submit button. (c) The selected code isautomatically extracted and processed as a pull request following the project structureimposed by Ballet. (d) In continuous integration, Ballet runs feature API and MLperformance validation on this one feature definition (e) Feature definitions that passcan be automatically and safely merged by the Ballet Bot. (f) Ballet will collect andcompose this new feature definition into the existing feature engineering pipeline,which can be used by the community to model their own raw data.
types of patches are all structured similarly, and if they validate successfully, they
may be safely merged without further review. To support maintainers, the Ballet
Bot3 can automatically manage contributions, performing tasks such as merging pull
requests of accepted patches and closing rejected ones. The process continues until
either the performance of the ML product exceeds some threshold, or improvements
are exhausted.
Ballet projects are lightweight, as our framework is distributed as a free and
open-source Python package, and use only lightweight infrastructure that is freely
available to open-source projects, like GitHub, Travis, and Binder (C4/D4). This
avoids spinning up data stores or servers — or relying on large commercial sponsors
to do the same.
3.3.2 Collaborators
A data scientist is interested in the project and wants to contribute. They find
the task description and begin learning about the project and about Ballet. They3https://github.com/ballet/ballet-bot
53

can review and learn from existing patches contributed by others and discuss ideas
in an integrated chatroom. They begin developing a new patch in their preferred
development environment (patch development task). When they are satisfied with its
performance, they propose to add it to the upstream project at a specific location
in the directory structure using the pull request model (patch contribution task). In
designing Ballet, we aimed to make it as easy as possible for data scientists with
varying backgrounds to accomplish the patch development and patch contribution
tasks within open-source workflows.
The Ballet interactive client, included in the core library, supports collaborators
in loading data, exploring and analyzing existing patches, validating the performance
of their work, and accessing functionality provided by the shared project. It also
decreases the time to beginning development by automatically detecting and loading
a Ballet project’s configuration. Use of the client is shown in Figure 3.1, Panel B.
We enable several interfaces for collaborators to develop and submit patches like
feature definitions, where different interfaces are appropriate for collaborators with
different types of development expertise, relaxing requirements on development style.
Collaborators who are experienced in open-source development processes can use their
preferred tools and workflow to submit their patch as a pull request, supported by the
Ballet CLI — the project is still just a layer built on top of familiar technologies like
git. However, in preliminary user studies (Section 3.7), we found that adapting from
usual data science workflows was a huge obstacle. Many data scientists we worked
with had never successfully used open-source development processes to contribute to
any shared project.
We addressed this by centering all development in the notebook with Assem-
blé, a cloud-based workflow and development environment for contribution to Ballet
projects (C1/D1). We created a custom experience on top of community tooling that
enables data scientists to develop and submit features entirely within the notebook.
We describe Assemblé in detail in Section 3.6.
The submitted feature definitions are marked as accepted or rejected, and data
scientists can proceed accordingly, either moving on to their next idea or reviewing
54

diagnostic information and trying to fix a rejected submission.
3.3.3 Consumer
Ballet project consumers — members of the wider data science community — are now
free to use the data science product however they desire, such as by executing the
feature engineering pipeline to extract features from new raw data instances, making
predictions for their own datasets. The project can easily be installed using a pack-
age manager like pip as a versioned dependency, and ML engineers can extract the
machine-readable feature definitions into a feature store or other environment for fur-
ther analysis and deployment. This “pipeline as code”/“pipeline as package” approach
makes it easy to use and re-use the pipeline and helps address data lineage/versioning
issues.
For example, the Ballet client for feature engineering projects exposes a method
that fits the feature engineering pipeline on training data and can then engineer
features from new data instances, and an instance of a pipeline that is already fitted
on data from of the upstream project. These can be easily used in other library code.
3.4 A language for feature engineering
We now describe in detail the design and implementation of a feature engineering
“mini-language” within Ballet to enable collaborative feature engineering projects.
While we spoke in general terms about data science patches and products and the
statistical acceptance procedure, here we define these concepts in a “plugin” for feature
engineering.
We start from the insight that feature engineering can be represented as a dataflow
graph over individual features. We structure code that extracts a group of feature val-
ues as a patch, calling these feature definitions and representing them with a Feature
interface. Feature definitions are composed into a feature engineering pipeline prod-
uct. Newly contributed feature definitions are accepted if they pass a two-stage
acceptance procedure that tests both the feature API and its contribution to ML
55

performance. Finally, the plugin specifies the organization of modules within a repos-
itory to allow features to be collected programmatically.
In Ballet, we create a flexible and powerful language for feature engineering that
is embedded within the larger framework. It supports functionality such as learned
feature transformations, supervised feature transformations, nested transformer steps,
syntactic sugar for functional transformations, data frame-style transformations, and
recovery from errors due to type incompatibility.
from ballet import Featurefrom ballet.eng import ConditionalTransformerfrom ballet.eng.external import SimpleImputerimport numpy as np
input = 'Lot Area'transformer = [
ConditionalTransformer(lambda ser: ser.skew() > 0.75,lambda ser: np.log1p(ser)),
SimpleImputer(strategy='mean'),]name = 'Lot area unskewed'feature = Feature(input, transformer, name=name)
Figure 3.2: A feature definition that conditionally unskews lot area (for a house priceprediction problem) by applying a log transformation only if skew is present in thetraining data and then mean-imputing missing values.
from ballet import Featurefrom ballet.eng.external import SimpleImputerimport numpy as np
input = 'JWAP' # Time of arrival at worktransformer = [
SimpleImputer(missing_values=np.nan, strategy='constant', fill_value=0.0),lambda df: np.where((df >= 70) & (df <= 124), 1, 0),
]name = 'If job has a morning start time'description = 'Return 1 if the Work arrival time >=6:30AM and <=10:30AM'feature = Feature(input, transformer, name=name, description=description)
Figure 3.3: A feature definition that defines a transformation of work arrival time (fora personal income prediction problem) by filling missing values and then applying acustom function.
56

3.4.1 Feature definitions
A feature definition is the code that is used to extract semantically related feature
values from raw data. Let us observe data instances 𝒟 = (v𝑖,y𝑖)𝑁𝑖=1, where v𝑖 ∈ 𝒱
are the raw variables and y𝑖 ∈ 𝒴 is the target. In this formulation, the raw variable
domain 𝒱 includes strings, missing values, categories, and other non-numeric types
that cannot typically be inputted to learning algorithms. Thus our goal in feature
engineering is to develop a learned map from 𝒱 to 𝒳 where 𝒳 ⊆ R𝑛 is a real-valued
feature space.
Definition 1. A feature function is a learned map from raw variables in one data
instance to feature values, 𝑓 : (𝒱 ,𝒴)→ 𝒱 → 𝒳 .
We indicate the map learned from a specific dataset 𝒟 by 𝑓𝒟, i.e., 𝑓𝐷(𝑣) =
𝑓(𝐷)(𝑣).
A feature function can produce output of different dimensionality. Let 𝑞(𝑓) be
the dimensionality of the feature space 𝒳 for a feature 𝑓 . We call 𝑓 a scalar-valued
feature if 𝑞(𝑓) = 1 or a vector-valued feature if 𝑞(𝑓) > 1. For example, the embedding
of a categorical variable, such as a one-hot encoding, would result in a vector-valued
feature.
We can decompose a feature function into two parts, its input projection and its
transformer steps. The input projection is the subspace of the variable space that it
operates on, and the transformer steps, when composed together, equal the learned
map on this subspace.
Definition 2. A feature input projection is a projection from the full variable space
to the feature input space, the set of variables that are used in a feature function,
𝜋 : 𝒱 → 𝒱.
Definition 3. A feature transformer step is a learned map from the variable space
to the variable space, 𝑓𝑖 : (𝒱 ,𝒴)→ 𝒱 → 𝒱.
We require that individual feature transformer steps compose together to yield
the feature function, where the first step applies the input projection and the last
57

step maps to 𝒳 rather than 𝒱 . That is, each transformer step applies some arbitrary
transformation as long as the final step maps to allowed feature values.
𝑓0 : (𝑉, 𝑌 ) ↦→ 𝜋
𝑓𝑖 ∘ 𝑓𝑖−1 : (𝑉, 𝑌 ) ↦→ 𝑓𝑖(𝑓𝑖−1(. . . , 𝑌 )(𝑉 ), 𝑌 )
𝑓𝑛 : (𝒱 ,𝒴)→ 𝒱 → 𝒳
𝑓 : (𝑉, 𝑌 ) ↦→ 𝑓𝑛(. . . (𝑓1(𝑓0(𝑉, 𝑌 )(𝑉 ), 𝑌 ) . . . ), 𝑌 )
The Feature class in Ballet is a way to express a feature function in code. It
is a tuple (input, transformer). The input declares the variable(s) from 𝒱 that are
needed by the feature, which will be passed to transformer, one or more transformer
steps. Each transformer step implements the learned map via fit and transform
methods, a standard interface in machine learning pipelines (Buitinck et al., 2013).
A data scientist then simply provides values for the input and transformer of a Feature
object in their code. Additional metadata, including name, description, output, and
source, is also exposed by the Feature abstraction. For example, the feature output
is a column name (or set of column names) for the feature value (or feature values)
in the resulting feature matrix; if it is not provided by the data scientist, it can be
inferred by Ballet using various heuristics.
Two example feature definitions are shown in Figures 3.2 and 3.3.
3.4.2 Learned feature transformations
In machine learning, we estimate the generalization performance of a model by eval-
uating it on a set of test observations that are unseen by the model during training.
Leakage is a problem in which information about the test set is accidentally exposed
to the model during training, artificially inflating its performance on the test set and
thus underestimating generalization error.
Each feature function learns a specific map 𝒱 → 𝒳 from 𝒟, such that any param-
58

eters it uses, such as variable means and variances, are learned from the development
(training) dataset. This formalizes the separation between development and testing
data to avoid any leakage of information during the feature engineering process.
As in the common pattern, a feature engineering pipeline by itself or within a
model has two stages within training: a fit stage and a transform stage. During
the fit stage, parameters are learned from the training data and stored within the
individual transformer steps. During the transform stage, the learned parameters are
used to transform the raw variables into a feature matrix. The same parameters are
also used at prediction time.
3.4.3 Nested feature definitions
Feature definitions or feature functions can also be nested within the transformer field
of another feature. If an existing feature is used as one transformer step in another
feature, when the new feature function is executed, the nested feature is executed
in a sub-procedure and the resulting feature values are available to the new feature
for further transformation. Data scientists can also introspect an existing feature to
access its own input and transformer attributes and use them directly within a new
feature.
Through its support for nested feature definitions, Ballet allows collaborating data
scientists to define an arbitrary directed acyclic dataflow graph from the raw variables
to the feature matrix.
3.4.4 Feature engineering primitives
Many features exhibit common patterns, such as scaling or imputing variables using
simple procedures. And while some features are relatively simple and have no learned
parameters, others are more involved to express in a fit/transform style. Data scien-
tists commonly extract these more advanced features by manipulating development
and test tables directly using popular data frame libraries, often leading to leakage. In
preliminary studies (Section 3.7), we found that data scientists sometimes struggled
59

to create features one at a time, given their familiarity with writing long processing
scripts. Responding to this feedback, we provided a library of feature engineering
primitives that implements many common utilities and learned transformations.
Definition 4. A feature engineering primitive is a class that can be instantiated
within a sequence of transformer steps to express a common feature engineering pat-
tern.
This library, ballet.eng, includes primitives like ConditionalTransformer, which
applies a secondary transformation depending on whether a condition is satisfied
on the development data, and GroupwiseTransformer, which learns a transformer
separately for each group of a group-by aggregation on the development set. We also
organize and re-export 77 primitives4 from six popular Python libraries for feature
engineering, such as scikit-learn’s SimpleImputer (Table 3.2).
Table 3.2: Feature engineering primitives implemented or re-exported in ballet.eng,by library.
Library Number of primitives
ballet 16category_encoders 17feature_engine 29featuretools 1skits 10scikit-learn 19tsfresh 1
3.4.5 Feature engineering pipelines
Features are then composed together in a feature engineering pipeline.
Definition 5. Let 𝑓1, . . . , 𝑓𝑚 be a collection of feature functions, 𝒟 be a development
dataset, and 𝒟′ = (𝑉 ′, 𝑌 ′) be a collection of new data instances. A feature engineering
pipeline ℱ = {𝑓𝑖}𝑚𝑖=1 applies each feature function to the new data instances and
concatenates the result, yielding the feature matrix4As of ballet v0.19.
60

𝑋 = ℱ𝒟(𝑉 ′) = 𝑓𝒟1 (𝑉 ′)⊕ · · · ⊕ 𝑓𝒟
𝑚(𝑉 ′).
A feature engineering pipeline can be thought of as similar to a collection of feature
functions. It is implemented in Ballet in the FeatureEngineeringPipeline class.
In Ballet’s standard configuration, only feature functions that have been explicitly
defined by data scientists (and accepted by the feature validation) are included in the
feature engineering pipeline. Thus, raw variables are not outputted by the pipeline
unless they are explicitly requested (i.e., by a data scientist developing a feature
definition that applies the identity transformation to a raw variable). In alternative
configurations, project maintainers can define a set of fixed feature definitions to
include in the pipeline, which can include a set of important raw variables with the
identity transformation or other transformations applied.
𝒟
𝑓1
𝑓2
𝑓3
𝑓4
⊕ 𝑋
Year Sold
Lot Area
Year BuiltGarageYr Blt
Garage CarsGarage Area
Yearssince sold
Lot areaunskewed
Yearbuilt fill
Garage areaper car
Figure 3.4: A feature engineering pipeline for a house price prediction problem withfour feature functions operating on six raw variables.
3.4.6 Feature execution engine
Ballet’s feature execution engine is responsible for applying the full feature engineer-
ing pipeline or an individual feature to extract feature values from a given set of data
instances. Each feature function within the pipeline is passed the input columns it
requires, which it then transforms appropriately, internally using one or more trans-
former steps (Figure 3.4). It operates as follows, starting from a set of Feature
objects.
1. The transformer steps of each feature are postprocessed in a single step. First,
any syntactic sugar is replaced with the appropriate objects. For example, an
61

anonymous function is replaced by a FunctionTransformer object that applies
the function, or a tuple of an input and another transformer is replaced by an
SubsetTransformer object that applies the transformer on the given subset of
the input and passes through the remaining columns unchanged. Second, the
transformer steps are all wrapped in functionality that allows them to recover
from any errors that are due to type incompatibility. For example, if the under-
lying transformation expects a 1-d array (column vector), but receives as input
a 2-d array with a single column, the wrapper will catch the error, convert the
2-d array to a 1-d array, and retry the transformation. The wrapper pre-defines
a set of these “conversion approaches” (one of which is the identity transfor-
mation), which will be tried in sequence until one is successful. The successful
approach is stored so that it can be re-used during subsequent applications of
the feature.
2. The features are composed together into a feature engineering pipeline object.
3. The fit stage of the feature engineering pipeline is executed. For each feature,
the execution engine indexes out the declared input columns from the raw data
and passes them to the wrapped fit method of the feature’s transformer. (This
stage only occurs during training.)
4. The transform stage of the feature engineering pipeline is executed. For each
feature, the execution engine indexes out the declared input columns from the
raw data and passes them to the wrapped transform method of the feature’s
transformer.
This process can also be parallelized across features. Since support for nested
feature definitions (Section 3.4.3) means that if features were executed independently
there may be redundant computation if there were dependencies between features,
this would necessitate a more careful approach in which the features are first sorted
topologically and then resulting feature values are cached after first computation. For
very large feature sets or datasets, full-featured dataflow engines should be considered.
62

3.5 Acceptance procedures for feature definitions
Contributions of feature engineering code, just like other code contributions, must be
evaluated for quality before being accepted in order to mitigate the risk of introduc-
ing errors, malicious behavior, or design flaws. For example, a feature function that
produces non-numeric values can result in an unusable feature engineering pipeline.
Large feature engineering collaborations can also be susceptible to “feature spam,” a
high volume of low-quality feature definitions (submitted either intentionally or unin-
tentionally) that harm the collaboration (Smith et al., 2017). Modeling performance
can suffer and require an additional feature selection step — violating the working
pipeline invariant — and the experience of other collaborators can be harmed if they
are not able to assume that existing feature definitions are high-quality.
To address these possibilities, we extensively validate feature definition contri-
butions for software quality and ML performance. Validation is implemented as a
test suite that is both exposed by the Ballet client and executed in CI for every pull
request. Thus, the same method that is used in CI for validating feature contri-
butions is available to data scientists for debugging and performance evaluation in
their development environment. Ballet Bot can automatically merge pull requests
corresponding to accepted feature definitions and close pull requests corresponding
to rejected feature definitions.
This automatic acceptance procedure is defined for the addition of new feature def-
initions only, while acceptance procedures for edits or deletions of feature definitions
is important future work.
3.5.1 Feature API validation
User-contributed feature definitions should satisfy the Feature interface and success-
fully deal with common error situations, such as intermediate computations producing
missing values. We fit the feature function to a separate subsampled training dataset
in an isolated environment and extract feature values from subsampled training and
validation datasets, failing immediately on any implementation errors. We then con-
63

IsFeatureCheck HasCorrectInputTypeCheck HasCorrectOutputDimensionsCheckHasTransformerInterfaceCheck CanFitCheck CanFitOneRowCheckCanTransformCheck CanTransformNewRowsCheck CanTransformOneRowCheckCanFitTransformCheck CanMakeMapperCheck NoMissingValuesCheckNoInfiniteValuesCheck CanDeepcopyCheck CanPickleCheck
Table 3.3: Feature API validation suite in (ballet.validation.feature_api.checks)that ensures the proper functioning of the shared feature engineering pipeline.
duct a battery of 15 tests to increase confidence that the feature function would also
extract acceptable feature values on unseen inputs (Table 3.3). Each test is paired
with “advice” that can be surfaced back to the user to fix any issues (Figure 3.1).
Another part of feature API validation is an analysis of the changes introduced
in a proposed PR to ensure that the required project structure is preserved and that
the collaborator has not accidentally included irrelevant code that would need to be
evaluated separately.5 A feature contribution is valid if it consists of the addition
of a valid source file within the project’s src/features/contrib subdirectory that
also follows a specified naming convention using the user’s login name and the given
feature name. The introduced module must define exactly one object — an instance
of Feature — which will then be imported by the framework.
3.5.2 ML performance validation
A complementary aspect of the acceptance procedure is validating a feature contri-
bution in terms of its impact on machine learning performance, which we cast as a
streaming feature definition selection (SFDS) problem. This is a variant of streaming
feature selection where we select from among feature definitions rather than feature
values. Features that improve ML performance will pass this step; otherwise, the con-
tribution will be rejected. Not only does this discourage low-quality contributions,
but it provides a way for collaborators to evaluate their performance, incentivizing
more deliberate and creative feature engineering.
We first compile requirements for an SFDS algorithm to be deployed in our set-
ting, including that the algorithm should be stateless, support real-world data types5This “project structure validation” is only relevant in CI and is not exposed by the Ballet client.
64

(mixed discrete and continuous), and be robust to over-submission. While there has
been a wealth of research into streaming feature selection (Zhou et al., 2005; Wu
et al., 2013; Wang et al., 2015; Yu et al., 2016), no existing algorithm satisfies all
requirements. Instead, we extend prior work to apply to our situation. Our SFDS
algorithm proceeds in two stages.6 In the acceptance stage, we compute the condi-
tional mutual information of the new feature values with the target, conditional on
the existing feature matrix, and accept the feature if it is above a dynamic thresh-
old. In the pruning stage, existing features that have been made newly redundant by
accepted features can be pruned. Full details are presented in the following section.
3.5.3 Streaming feature definition selection
Feature selection is a classic problem in machine learning and statistics (Guyon and
Elisseeff, 2003). The problem of feature selection is to select a subset of the available
feature values such that a learning algorithm that is run on the subset generates a
predictive model with the best performance according to some measure.
Definition 6. The feature selection problem is to select a subset of feature values
that maximizes some utility,
𝑋* = arg max𝑋′∈𝒫(𝑋)
𝑈(𝑋 ′), (3.1)
where 𝒫(𝐴) denotes the power set of 𝐴. For example, 𝑈 could measure the
empirical risk of a model trained on 𝑋 ′.
If there exists a group structure in 𝑋, then this formulation ignores the group
structure and allows feature values to be subselected from within groups. In some
cases, like ours, this may not be desirable, such as if it is necessary to preserve the
coherence and interpretability of each feature group. In the case of feature engineering
using feature functions, it further conflicts with the understanding of each feature
function as extracting a semantically related set of feature values.6Indeed, we abbreviate the general problem of streaming feature definition selection as SFDS,
and also call our algorithm to solve this problem SFDS. We trust that readers can disambiguatebased on context.
65

Thus we instead consider the related problem of feature definition selection.
Definition 7. The feature definition selection problem is to select a subset of feature
definitions that maximizes some utility,
ℱ* = arg maxℱ ′∈𝒫(ℱ)
𝑈(ℱ ′), (3.2)
This constrains the feature selection problem to select either all of or none of the
feature values extracted by a given feature.
In Ballet, as collaborators develop new features, each feature arrives at the project
in a streaming fashion, at which point it must be accepted or rejected immediately.
Streaming feature definition selection is a streaming extension of feature definition
selection.
Definition 8. Let Γ be a feature definition stream of unknown size, let ℱ be the set of
features accepted as of some time, and let 𝑓 ∈ Γ arrive next. The streaming feature
definition selection problem is to select a subset of feature definitions that maximizes
some utility,
ℱ* = arg maxℱ ′∈𝒫(ℱ∪𝑓)
𝑈(ℱ ′). (3.3)
Streaming feature definition selection consists of two decision problems, considered
as sub-procedures. The streaming feature definition acceptance decision problem is to
accept 𝑓 , setting ℱ ← ℱ ∪ 𝑓 , or reject, leaving ℱ unchanged. The streaming feature
pruning decision problem is to remove a subset ℱ0 ⊂ ℱ of low-quality features, setting
ℱ = ℱ ∖ ℱ0.
Design criteria
Streaming feature definition selection algorithms must be carefully designed to best
support collaborations in Ballet. We consider the following design criteria, motivated
by engineering challenges, security risks, and experience from system prototypes:
1. Definitions, not values. The algorithm should have first-class support for feature
definitions (or feature groups) rather than selecting individual feature values.
66

2. Stateless. The algorithm should require as inputs only the current state of
the Ballet project (i.e., the problem data and accepted features) and the pull
request details (i.e., the proposed feature). Otherwise, each Ballet project (i.e.,
its GitHub repository) would require additional infrastructure to securely store
the algorithm state.
3. Robust to over-submission. The algorithm should be robust to processing many
more feature submissions than raw variables present in the data (i.e., |Γ| ≫ |𝒱|).
Otherwise malicious (or careless) contributors can automatically submit many
features, unacceptably increasing the dimensionality of the resulting feature
matrix.
4. Support real-world data. The algorithm should support mixed continuous- and
discrete-valued features, common in real-world data.
Surprisingly, there is no existing algorithm that satisfies these design criteria.
Algorithms for feature value selection might only support discrete data, algorithms
for feature group selection might require persistent storage of decision parameters,
etc. And the robustness criterion remains important given the results of Smith et al.
(2017), in which users of a collaborative feature engineering system programmati-
cally submitted thousands of irrelevant features, constraining modeling performance.
These factors motivate us to create our own algorithm.
Feature definition alpha-investing
As a first (unsuccessful) approach, we consider feature definition alpha-investing.
Alpha-investing (Zhou et al., 2005) is one algorithm for streaming feature selection. It
maintains a time-varying parameter, 𝛼𝑡, which controls the algorithm’s false-positive
rate and conducts a likelihood ratio test to compare the current features with the
resulting features if the new feature is added.
We can extend this method to support feature definitions rather than feature
values as follows. Compute the likelihood ratio 𝑇 = −2(log �̂�(ℱ) − log �̂�(ℱ ∪ 𝑓)),
where �̂�(·) is the maximum likelihood of a linear model. Then 𝑇 ∼ 𝜒2(𝑞(𝑓)) and
67

we compute a p-value accordingly. If 𝑝 < 𝛼𝑡, then 𝑓 is accepted; otherwise it is
rejected. 𝛼𝑡 is adjusted according to an update rule that is a function of the sequence
of accepts/rejects (Zhou et al., 2005).
Unfortunately, the feature definition alpha-investing algorithm does not satisfy the
design criteria of Ballet because it is neither stateless nor robust to over-submission.
The pitfalls are that 𝛼𝑡 must be securely stored somewhere and that it is affected by
rejected features — adversaries could repeatedly submit noisy features that are liable
to be rejected, artificially lowering the threshold for high-quality features.
SFDS
Instead, we present a new algorithm, SFDS, for streaming feature definition selection
based on mutual information criteria. It extends the GFSSF algorithm (Li et al.,
2013) both to support feature definitions rather than feature values and to support
real-world tabular datasets with a mix of continuous and discrete variables.
The algorithm (Algorithm 1) works as follows. In the acceptance stage, we first
determine if a new feature 𝑓 is strongly relevant ; that is, whether the information
𝑓(𝒟) provides about 𝑌 above and beyond the information that is already provided
by ℱ(𝒟) is above some threshold governed by hyperparameters 𝜆1 and 𝜆2, which
penalize the number of features and the number of feature values, respectively. If
so, we accept it immediately. Otherwise, the feature may still be weakly relevant,
in which case we consider whether 𝑓 and some other feature 𝑓 ′ ∈ ℱ provide similar
information about 𝑌 . If 𝑓 is determined to be superior to such an 𝑓 ′, then 𝑓 can
be accepted. Later, in the pruning stage, 𝑓 ′ and any other redundant features are
pruned.
CMI estimation
In the SFDS algorithm, we compute several quantities of the form 𝐼(𝑓(𝒟), 𝑌 |ℱ(𝒟)),
i.e., the conditional mutual information (CMI) of the proposed feature and the target,
given the set of accepted features. Since we do not know the true joint distribution of
feature values and target, we must derive an estimator for this quantity. Let 𝑍 = 𝑓(𝒟)
68

Algorithm 1: SFDSinput : feature stream Γ, evaluation dataset 𝒟output : accepted feature set ℱ
1 ℱ ← ∅2 while Γ has new features do3 𝑓 ← get next feature from Γ4 if 𝑎𝑐𝑐𝑒𝑝𝑡(ℱ , 𝑓,𝒟) then5 ℱ ← 𝑝𝑟𝑢𝑛𝑒(ℱ , 𝑓,𝒟)6 ℱ ← ℱ ∪ 𝑓
7 end8 end9 return ℱ
Procedure accept(ℱ , 𝑓 , 𝒟)input : accepted feature set ℱ , proposed feature 𝑓 , evaluation dataset 𝒟params : penalty on number of feature definitions 𝜆1, penalty on number of
feature values 𝜆2
output : accept/reject
1 if 𝐼(𝑓(𝒟);𝑌 |ℱ(𝒟)) > 𝜆1 + 𝜆2 × 𝑞(𝑓) then2 return true3 end4 for 𝑓 ′ ∈ ℱ do5 ℱ ′ ← ℱ ∖ 𝑓 ′
6 if 𝐼(𝑓(𝒟);𝑌 |ℱ ′(𝒟))− 𝐼(𝑓 ′(𝒟);𝑌 |ℱ ′(𝒟)) > 𝜆1 + 𝜆2 × (𝑞(𝑓)− 𝑞(𝑓 ′)) then7 return true8 end9 end
10 return false
Procedure prune(ℱ , 𝑓 , 𝒟)input : previously accepted feature set ℱ , newly accepted feature 𝑓 , evaluation
dataset 𝒟params : penalty on number of feature definitions 𝜆1, penalty on number of
feature values 𝜆2
output : pruned feature set ℱ1 for 𝑓 ′ ∈ ℱ do2 ℱ ′ ← ℱ ∖ 𝑓 ′ ∪ 𝑓3 if 𝐼(𝑓 ′(𝒟);𝑌 |ℱ ′(𝒟)) < 𝜆1 + 𝜆2 × 𝑞(𝑓 ′) then4 ℱ ← ℱ ∖ 𝑓 ′
5 end6 end7 return ℱ
Figure 3.5: SFDS algorithm for streaming feature definition selection. It relies ontwo lower-level procedures, accept and prune to accept new feature definitions and topossibly prune newly redundant feature definitions.
69

and 𝑋 = ℱ(𝒟), i.e., the feature values extracted by feature 𝑓 and feature set ℱ ,
respectively. Then CMI is given by 𝐼(𝑍;𝑌 |𝑋) = 𝐻(𝑍|𝑋) +𝐻(𝑌 |𝑋)−𝐻(𝑍, 𝑌 |𝑋).
We represent feature values as joint random variables with separate discrete and
continuous components, i.e., 𝑍 = (𝑍𝑑, 𝑍𝑐) and 𝑋 = (𝑋𝑑, 𝑋𝑐). This poses a challenge
in estimation due to the mixed variable types. To address this, we adapt prior work
(Kraskov et al., 2004) on mutual information estimation to handle the calculation of
CMI in the setting of mixed tabular datasets.
Let ℱ be the set of already accepted features with corresponding feature values
𝑋 = ℱ(𝒟). Then a new feature arrives, 𝑓 , with corresponding feature values 𝑍 =
𝑓(𝒟).
The conditional mutual information (CMI) is given by:
𝐼(𝑍;𝑌 |𝑋) = 𝐻(𝑍|𝑋) +𝐻(𝑌 |𝑋)−𝐻(𝑍, 𝑌 |𝑋) (3.4)
Applying the chain rule of entropy, 𝐻(𝐴,𝐵) = 𝐻(𝐴) +𝐻(𝐵|𝐴), we have:
𝐼(𝑍;𝑌 |𝑋) =𝐻(𝑍,𝑋)−𝐻(𝑋) +𝐻(𝑌,𝑋)
−𝐻(𝑋)−𝐻(𝑍, 𝑌,𝑋) +𝐻(𝑋)
=𝐻(𝑍,𝑋) +𝐻(𝑌,𝑋)
−𝐻(𝑍, 𝑌,𝑋)−𝐻(𝑋) (3.5)
We represent feature values in separate components of discrete and continuous
random variables, i.e., 𝑋 = (𝑋𝑑, 𝑋𝑐):
𝐼(𝑍;𝑌 |𝑋) =𝐻(𝑍𝑑, 𝑍𝑐, 𝑋𝑑, 𝑋𝑐) +𝐻(𝑌,𝑋𝑑, 𝑋𝑐)
−𝐻(𝑍𝑑, 𝑍𝑐, 𝑌,𝑋𝑑, 𝑋𝑐)−𝐻(𝑋𝑑, 𝑋𝑐) (3.6)
We expand the entropy terms again using the chain rule of entropy to condition
70

on the discrete components of the random variables:
𝐼(𝑍;𝑌 |𝑋) =𝐻(𝑍𝑐, 𝑋𝑐|𝑍𝑑, 𝑋𝑑) +𝐻(𝑍𝑑, 𝑋𝑑)
+𝐻(𝑌,𝑋𝑐|𝑋𝑑) +𝐻(𝑋𝑑)
−𝐻(𝑍𝑐, 𝑌,𝑋𝑐|𝑍𝑑, 𝑋𝑑)−𝐻(𝑍𝑑, 𝑋𝑑)
−𝐻(𝑋𝑐|𝑋𝑑)−𝐻(𝑋𝑑) (3.7)
After cancelling terms:
𝐼(𝑍;𝑌 |𝑋) =𝐻(𝑍𝑐, 𝑋𝑐|𝑍𝑑, 𝑋𝑑) +𝐻(𝑌,𝑋𝑐|𝑋𝑑)
−𝐻(𝑍𝑐, 𝑌,𝑋𝑐|𝑍𝑑, 𝑋𝑑)−𝐻(𝑋𝑐|𝑋𝑑) (3.8)
We use the definition of conditional entropy and take the weighted sum of the
continuous entropies conditional on the unique discrete values. Let 𝑍𝑑 have support
𝑈 and 𝑋𝑑 have support 𝑉 .
𝐼(𝑍;𝑌 |𝑋) =∑︁𝑢∈𝑈,𝑣∈𝑉
𝑝𝑍𝑑,𝑋𝑑(𝑢, 𝑣)𝐻(𝑍𝑐, 𝑋𝑐|𝑍𝑑 = 𝑢,𝑋𝑑 = 𝑣)
+∑︁𝑣∈𝑉
𝑝𝑋𝑑(𝑣)𝐻(𝑌,𝑋𝑐|𝑋𝑑 = 𝑣)
−∑︁
𝑢∈𝑈,𝑣∈𝑉
𝑝𝑍𝑑,𝑋𝑑(𝑢, 𝑣)𝐻(𝑍𝑐, 𝑌,𝑋𝑐|𝑍𝑑 = 𝑢,𝑋𝑑 = 𝑣)
−∑︁𝑣∈𝑉
𝑝𝑋𝑑(𝑣)𝐻(𝑋𝑐|𝑋𝑑 = 𝑣) (3.9)
Unfortunately, we cannot perform this calculation directly as we do not know the
joint distribution of 𝑋, 𝑌 , and 𝑍. Thus we will need to estimate the quantities 𝑝 and
𝐻 based on samples from their joint distribution observed in 𝒟. For this, we make
use of two existing estimators.
Kraskov entropy estimation Kraskov et al. (2004) present estimators for mutual
71

information (MI) based on nearest-neighbor statistics. From the assumption that the
log density around each point is approximately constant within a ball of small radius,
simple formulas for MI and entropy can be derived. The radius 𝜖(𝑖)/2 is found as the
distance from point 𝑖 to its kth nearest neighbor. Unfortunately, their MI estimator
cannot be used for CMI estimation and also cannot directly handle mixed discrete
and continuous datasets. However, we can adapt their entropy estimator for our own
CMI estimation.
The Kraskov entropy estimator �̂�KSG for a variable 𝐴 is given by:
�̂�KSG(𝐴) =−1
𝑁
𝑁−1∑︁𝑖=1
𝜓(𝑛𝑎(𝑖) + 1) + 𝜓(𝑁)
+ log(𝑐𝑑𝐴) +𝑑𝐴𝑁
𝑁∑︁𝑖=1
log(𝜖𝑘(𝑖)), (3.10)
where 𝑁 is the number of data instances, 𝜓 is the digamma function, 𝑛𝑎(𝑖) is the
number of points within distance 𝜖𝑘(𝑖)/2 from point 𝑖, and 𝑐𝑑𝐴 is the volume of a unit
ball with dimensionality 𝑑𝐴.
Consider the joint random variable 𝑊 = (𝑋, 𝑌, 𝑍). Then 𝜖𝑊𝑘 (𝑖) is twice the
distance from the 𝑖th sample of 𝑊 to its 𝑘th nearest neighbor.
The entropy of 𝑊 is then given by
�̂�KSG(𝑊 ) =𝜓(𝑘) + 𝜓(𝑁) + log(𝑐𝑑𝑋𝑐𝑑𝑌 𝑐𝑑𝑍 )
+𝑑𝑋 + 𝑑𝑌 + 𝑑𝑍
𝑁
𝑁∑︁𝑖=1
log(𝜖𝑊𝑘 (𝑖)), (3.11)
Empirical probability estimation Let 𝐴 be a discrete random variable with an
unknown probability mass function 𝑝𝐴. Suppose we observe realizations 𝑎1, . . . , 𝑎𝑛.
Then the empirical probability mass function is given by
𝑝𝐴(𝐴 = 𝑎) =1
𝑛
𝑛∑︁𝑖=1
1{𝑎𝑖=𝑎}. (3.12)
72

CMI Estimator Formula Now we can substitute our estimators 𝑝 from Equa-
tion (3.12) and �̂�KSG from Equation (3.11) into Equation (3.9).
Finally, we can use estimators for 𝑝 and 𝐻 to estimate 𝐼:
𝐼(𝑍;𝑌 |𝑋) =∑︁𝑢∈𝑈,𝑣∈𝑉
𝑝(𝑢, 𝑣)�̂�KSG(𝑍𝑐, 𝑋𝑐|𝑍𝑑 = 𝑢,𝑋𝑑 = 𝑣)
+∑︁𝑣∈𝑉
𝑝(𝑣)�̂�KSG(𝑌,𝑋𝑐|𝑋𝑑 = 𝑣)
−∑︁
𝑢∈𝑈,𝑣∈𝑉
𝑝(𝑢, 𝑣)�̂�KSG(𝑍𝑐, 𝑌,𝑋𝑐|𝑍𝑑 = 𝑢,𝑋𝑑 = 𝑣)
−∑︁𝑣∈𝑉
𝑝(𝑣)�̂�KSG(𝑋𝑐|𝑋𝑑 = 𝑣) (3.13)
Alternative validators
Maintainers of Ballet projects are free to configure alternative ML performance val-
idation algorithms given the needs of their own projects. While we use SFDS for
the predict-census-income project, Ballet provides implementations of the following
alternative validators: AlwaysAccepter (accept every feature definition),
MutualInformationAccepter (accept feature definitions where the mutual informa-
tion of the extracted feature values with the prediction target is above a threshold),
VarianceThresholdAccepter (accept feature definitions where the variance of each
feature value is above a threshold), and CompoundAccepter (accept feature defini-
tions based on the conjunction or disjunction of the results of multiple underlying
validators). Additional validators can be easily created by defining a subclass of
ballet.validation.base.FeatureAccepter and/or
ballet.validation.base.FeaturePruner.
73

3.6 An interactive development environment for data
science collaborations
In our discussion of Ballet so far, we have largely focused on the software engineering
processes and technical details of feature engineering. However, the development
environment that data scientists use in a Ballet collaboration can be an important
factor in their experience and performance. In this section, we consider more carefully
a development environment for Ballet projects and the interactions it supports.
Typically, a data scientist contributing to a Ballet project (or other kinds of data
science projects) does exploratory work in a notebook before finally identifying a
worthwhile patch to contribute. By this time, their notebook may be “messy” (Head
et al., 2019), and the process of extracting the relevant patch and translating it
into a well-structured contribution to a shared repository becomes challenging. Data
scientists usually need to rely on a completely separate set of tools for this process,
jettisoning the notebook for command line or GUI tools targeting team-based version
control. This patch contribution task is difficult even for data scientists experienced
with open-source practices (Gousios et al., 2015), and this difficulty is only more acute
for data scientists who are less familiar with open-source development workflows.
To address this challenge, we propose a novel development environment, Assem-
blé.7,8 Assemblé solves the patch contribution task for data science collaborations
that use Ballet9 by providing a higher-level interface for contributing code snippets
within a larger notebook to an upstream repository — meeting data scientists where
they are most comfortable. Rather than asking data scientists to productionize their
exploratory notebooks, Assemblé enables data scientists to both develop and con-
tribute back their code without leaving the notebook. A code fragment selected
by a data scientist can be automatically formulated as a pull request to an upstream
GitHub repository using an interface situated within the notebook environment itself,7https://github.com/ballet/ballet-assemble8Assemblé is a ballet move that involves lifting off the floor on one leg and landing on two.9Assemblé targets contributions to Ballet projects because of the structure that these projects
impose on code contributions, but can be extended to support other settings as well.
74

automating and abstracting away use of low-level tools for testing and team-based de-
velopment. It integrates tightly with Binder,10 a community service for cloud-hosted
notebooks, so that developers can get started with no setup required.
Submit
from ballet import bX_raw, y_raw = b.api.load_data()
[ 1 ]
from ballet import Featureinput = 'FHINS3C'transformer = Nonefeature = Feature(input, transformer)
b.validate_feature_api(feature)
INFO - Building features and target...INFO - Building features and target...DONEINFO - Feature is NOT valid; here is some advice for resolving the feature API issues.INFO - NoMissingValuesCheck: When transforming sample data, the feature produces NaN values. If you reasonably expect these missing values, make sure you clean missing values as an additional step in your transformer list. For example: NullFiller(replacement=replacement)
False
[ 1 ]
[ 8 ]
[ 8 ]
[ 24 ]
[ 24 ]
1
2
+ from ballet import Feature+ from ballet.eng import NullFiller+ input = 'FHINS3C'+ transformer = NullFiller(replacement=1.0)+ feature = Feature(input, transformer)
src/predict_x/features/contrib/user_bob/feature.py
src/predict_x/features/contrib/user_bob/__init__.py
Empty file.
Propose new feature #37Open bob wants to merge 1 commit into alice/ballet-predict-x from bob/ballet-predict-x:submit-feature
Figure 3.6: An overview of the Assemblé development environment. Assemblé’s fron-tend (left) extends JupyterLab to add a Submit button and a GitHub authenticationbutton to the Notebook toolbar (top right). Users first authenticate Assemblé withGitHub using a supported OAuth flow. Then, after developing a patch within alarger, messy notebook, users select the code cell containing their desired patch usingexisting Notebook interactions (1), and press Assemblé’s Submit button (2) to causeit to be automatically formulated as a pull request by the backend. The backendperforms lightweight static analysis and validation of the intended submission andthen creates a well-structured PR containing the patch (right). Taken together, thecomponents of Assemblé support the patch contribution task for notebook-based de-velopers.
We here describe the ideation, design, and implementation of a development en-
vironment that supports notebook-based collaborative data science. We will later
report on a user study of 23 data scientists who used Assemblé in a data science
collaboration case study (Section 4.3.5).
3.6.1 Design
To investigate development workflow issues in Ballet, we first conducted a formative
study with eight data scientists recruited from a laboratory mailing list at MIT.
We asked them to write and submit feature definitions for a collaborative project10https://mybinder.org/
75

based around predicting the incidence rates of dengue fever in two different regions.
Although participants created feature definitions successfully, we observed that they
struggled to contribute them to the shared repository using the pull request model,
with only two creating a pull request at all. In interviews, participants acknowledged
that a lack of familiarity and experience with the pull request-based model of open
source development was an obstacle to contributing the code that they had written,
especially in the context of team-based development (Gousios et al., 2015).
In this study, and in other experiments with Ballet, we observed that data scien-
tists predominately used notebooks to develop feature definitions before turning to
entirely different environments and tools to extract the smallest relevant patch and
create a pull request. We thus identified the patch contribution task as an important
interface problem to address in order to improve collaborative data science. Once
working code has been written, we may be able to automate the entire process of
code contribution according to the requirements of the specific project the user is
working on.
With this in mind, we elicited the following design requirements to support patch
contribution in a collaborative data science environment.
R1 Make code easy to contribute. Once a patch has been identified, it should be
easy to immediately contribute it without a separate process to productionize
it.
R2 Hide low-level tools. Unfamiliarity and difficulty with low-level tooling and pro-
cesses, such as git and the pull request model, tend to interrupt data scientists’
ability to collaborate on a shared repository. Any patch submission solution
should not include manual use of these tools.
R3 Minimize setup and installation friction. Finally, the solution should fit seam-
lessly within users’ existing development workflows, and should be easy to set
up and install.
Based on these requirements, we propose a design that extends the notebook
interface to support submission of individual code cells as pull requests. By focusing
76

on individual code cells, we allow data scientists to easily isolate relevant code to
submit. Once a user has selected a code cell using existing Notebook interactions,
pressing a simple, one-click “Submit” button added to the Notebook Toolbar panel
spurs the creation and submission of a patch according to the configuration of the
underlying project.
By abstracting away the low-level details of this process, we lose the ability to
identify some code quality issues that would otherwise be identified by the tooling.
To address this, we run an initial server-side validation using static analysis before
forwarding on the patch, in order to immediately surface relevant problems to users
within the notebook context. If submission is successful, the data scientist can view
their new PR in a matter of seconds. Assemblé is tightly integrated with Binder such
that it can be launched from every Ballet project via a README badge. Installation
of the extension is handled automatically and the project settings are automatically
detected so that data scientists can get right to work. An in-notebook, OAuth-based
authentication flow also allows users to easily authenticate with GitHub without
difficult configuration.
In summary, we design Assemblé to provide the following functionalities:
• isolate relevant code snippets from a messy notebook;
• transparently provide access to take actions on GitHub;
• automatically formulate an isolated snippet as a PR to an upstream data science
project without exposing any git details.
3.6.2 Implementation
Assemblé is implemented in three components: a JupyterLab frontend extension, a
JupyterLab server extension, and an OAuth proxy server.
The frontend extension is implemented in TypeScript on JupyterLab 2. It adds
two buttons to the Notebook Panel toolbar. The GitHub button allows the user
to initiate an authentication flow with GitHub. The Submit button identifies the
77

currently selected code cell from the active notebook and extracts the source. It then
posts the contents to the server to be submitted (R1). If the submission is successful,
it displays a link to the GitHub pull request view. Otherwise, it shows a relevant
error message — usually a Python traceback due to syntax errors in the user’s code.
The server extension is implemented in Python on Tornado 6. It adds routes to
the Jupyter Server under the /assemble prefix. These include /assemble/submit to
receive the code to be submitted, and three routes under /assemble/auth to handle
the authentication flow with GitHub. Upon extension initialization, it detects a Ballet
project by ascending the file system, via the current working directory looking for the
ballet.yml file and loading the project using the ballet library according to that
configuration.
When the server extension receives the code to be submitted, it first runs a static
analysis using Python’s ast module to ensure that it does not have syntax errors
or undefined symbols, and automatically cleans/reformats the code to the target
project’s preferred style. It then prepares to submit it as a pull request. The upstream
repository is determined from the project’s settings and is forked, if needed, via the
pygithub interface to the GitHub API with the user’s OAuth token, and cloned to a
temporary directory. Using the Ballet client library, Assemblé can create an empty
file at the correct path in the directory structure that will contain the proposed
contribution, and writes to and commits this file. Depending on whether the user has
contributed in the past, Assemblé may then also need to create additional files/folders
to preserve the Python package structure (i.e.,__init__.py files). It then pushes to a
new branch on the fork, and creates a pull request with a default description. Finally,
it returns the pull request view link. This replaces what is usually 5–7 manual git
operations with a robust and automated process (R2).
The final piece of the puzzle is authentication with GitHub, such that the server
can act on GitHub as the user to create a new pull request. Most extensions that
provide similar functionality (i.e., take some actions with an external service on behalf
of a user that require authentication) ask the user to acquire a personal access token
from the external service and provide it as a configuration variable, and in some cases
78

register a web application using a developer console (Project Jupyter Contributors,
a,b).
For our purposes, this is not acceptable, due to the high cost of setup for non-
expert software developers (R2, R3). Instead, we would like to use OAuth (OAuth
Working Group, 2012) to allow the user to enter their username and password for the
service, and exchange them for a token that the server can use. However, this cannot
be accomplished directly using the OAuth protocol because OAuth applications on
GitHub (or elsewhere) must register a static callback URL. Instead, Assemblé might
be running at any address, because with its Binder integration, the URLs assigned
to Binder sessions are dynamic and on different domains.11 To address this, we
create github-oauth-gateway, a simple proxy server for GitHub OAuth.12 We host a
reference deployment and register it as an OAuth application with GitHub. Before
the user can submit their code, they click the GitHub icon in the toolbar (Figure 3.6).
This launches the OAuth flow. First the server creates a secret “state” at random.
Then it redirects the user to the GitHub OAuth login page. The user is prompted to
enter their username and password, and if the sign-in is successful, GitHub responds
to the gateway with the token and the state created previously. The server polls
the gateway for a token associated with its unique state, and receives the token in
response when it is available.
3.7 Preliminary studies
We conducted several preliminary studies and evaluation steps during the iterative
design process for Ballet. These preliminary studies informed the design and imple-
mentation of all of the components of Ballet that have been presented in this chapter.11For example, launching the same repository in a Binder can result in first a
hub.gke.mybinder.org URL and then an notebooks.gesis.org URL, depending on theBinderHub deployment selected by the MyBinder load balancer.
12https://github.com/ballet/github-oauth-gateway
79

Disease incidence prediction
We first evaluated an initial prototype of Ballet in a user study with eight data sci-
entists. All participants had at least basic knowledge of collaborative software engi-
neering and open-source development practices (i.e., using git and pull requests). We
explained the framework and gave a brief tutorial on how to write feature definitions.
Participants were then tasked with writing feature definitions to help predict the in-
cidence of dengue fever given historical data from Iquitos, Peru and San Juan, Puerto
Rico (Epidemic Prediction Initiative), for which they were allotted 30 minutes. Three
participants were successfully able to merge their first feature definition within this
period, while the remainder produced features with errors or were unable to write one.
In interviews, participants suggested that they found the Ballet framework helpful for
structuring contributions and validating features, but were unfamiliar with writing
feature engineering code in terms of feature definitions with separate fit/transform
behavior (Section 3.4.1), and struggled to translate exploratory work in notebooks all
the way to pull requests to a shared project. Based on this feedback, we created the
ballet.eng library of feature engineering primitives (Section 3.4.4) and created tuto-
rial materials for new collaborators. We also began the design process that became
the Assemblé environment that supports notebook-based developers (Section 3.6).
House price prediction
We evaluated a subsequent version of Ballet in a user study with 13 researchers and
data scientists. This version included changes made since the first preliminary study
and introduced an alpha version of Assemblé that did not yet include server-side or
in-notebook validation functionality. Five of the participants had little to no prior
experience contributing to open-source projects, six reported contributing occasion-
ally, and two contributed frequently. All self-reported as intermediate or expert data
scientists and Python developers. Participants were given a starter notebook that
guided the development and contribution of feature definitions, and documentation
on the framework. They were tasked with writing feature definitions to help pre-
80

dict the selling price of a house given administrative data collected in Ames, Iowa
(De Cock, 2011). After contributing, participants completed a short survey with a
usability evaluation and provided semi-structured free-text feedback. Participants re-
ported that they were moderately successful at learning to write and submit feature
definitions but wanted more code examples. They also reported that they wanted to
validate their features within their notebook using the same methods that were used
in the automated testing in CI. Based on this feedback, among other improvements,
we expanded and improved our feature engineering guide and the starter notebook.
We also made methods for feature API validation and ML performance validation
available in the interactive client (Section 3.5) and expanded the Assemblé server-
side validation to catch common issues. Various simulation studies for this same
dataset are conducted in (Lu, 2019).
81

Chapter 4
Understanding data science
collaborations
4.1 Introduction
There is great potential for large-scale, collaborative data science to address societal
problems through community-driven analyses of public datasets (Choi and Tausczik,
2017; Hou and Wang, 2017). For example, the Fragile Families Challenge tasked
researchers and data scientists with predicting outcomes, including GPA and evic-
tion, for a set of disadvantaged children and their families (Salganik et al., 2020),
and crash-model is an application for predicting car crashes and thereby directing
safety interventions (Insight Lane). Such projects, which involve complex and un-
wieldy datasets, attract scores of interested citizen scientists and developers whose
knowledge, insight, and intuition can be significant if they are able to contribute and
collaborate.
To make progress toward this outcome, we must first better understand the ca-
pabilities and challenges of collaborative data science as projects scale beyond small
teams in open-source settings. Although much research has focused on elucidating the
diverse challenges involved in data science development (Chattopadhyay et al., 2020;
Yang et al., 2018; Subramanian et al., 2020; Sculley et al., 2015; Choi and Tausczik,
2017; Zhang et al., 2020; Muller et al., 2019), little attention has been given to large,
82

open-source collaborations, partly due to the lack of real-world examples available for
study.
Leveraging Ballet as a probe, we create and conduct an analysis of predict-census-
income, a collaborative effort to predict personal income through engineering features
from raw individual survey responses to the U.S. Census American Community Survey
(ACS). We use a mixed-method software engineering case study approach to study
the experiences of 27 developers collaborating on this task, focusing on understand-
ing the experience and performance of participants from varying backgrounds, the
characteristics of collaboratively built feature engineering code, and the performance
of the resulting model compared to alternative approaches.
4.2 Methods
We conduct a study using the versions of Ballet and Assemblé described in Chapter 3.
To better understand the characteristics of live collaborative data science projects, we
use a mixed-method software engineering case study approach (Runeson and Höst,
2009). The case study approach allows us to study the phenomenon of collaborative
data science in its “real-life context.” This choice of evaluation methodology allows
us to move beyond a laboratory setting and gain deeper insights into how large-
scale collaborations function and perform. Through this study, we aim to answer the
following four research questions:
RQ1 What are the most important aspects of our collaborative framework to support
participant experience and project outcomes?
RQ2 What is the relationship between participant background and participant expe-
rience/performance?
RQ3 What are the characteristics of feature engineering code in a collaborative
project?
RQ4 How does a collaborative model perform in comparison to other approaches?
83

These research questions build on our conceptual framework, allowing us to better
understand the effects of our design choices as well as to move forward our under-
standing of collaborative data science projects in general.
4.2.1 General procedures
We created an open-source project using Ballet, predict-census-income,1 to produce a
feature engineering pipeline for personal income prediction. After invited participants
consented to the research study terms, we asked them to fill out a pre-participation
survey with background information about themselves, which served as the inde-
pendent variables of our study. Next, they were directed to the public repository
containing the collaborative project and asked to complete the task described in the
project README. They were instructed to use either their preferred development
environment or Assemblé. After they completed this task, we surveyed them about
their experience.
4.2.2 Participants
In recruiting participants, we wanted to ensure that our study included beginners
and experts in statistical and ML modeling, software development, and survey data
analysis (the problem domain). To achieve this, we compiled personal contacts with
various backgrounds. After reaching these contacts, we then used snowball sampling
to recruit more participants with similar backgrounds. We expanded our outreach
by posting to relevant forums and mailing lists in data science development, Python
programming, and survey data analysis. Participants were entered into a drawing for
several nominal prizes but were not otherwise compensated.
4.2.3 Dataset
The input data is the raw survey responses to the 2018 U.S. Census American Commu-
nity Survey (ACS) for Massachusetts (Table 4.1). This “Public Use Microdata Sam-1https://github.com/ballet/predict-census-income
84

ple” (PUMS) has anonymized individual-level responses. Unlike the classic ML “adult
census” dataset (Kohavi, 1996) which is highly preprocessed, raw ACS responses are
a realistic form for a dataset used in an open data science project. Following Kohavi
(1996), we define the prediction target as whether an individual respondent will earn
more than $84,770 in 2018 (adjusting the original “adult census” prediction target of
$50,000 for inflation), and filter a set of “reasonable” rows by keeping people older
than 16 with personal income greater than $100 with hours worked in a typical week
greater than zero. We merged the “household” and “person” parts of the survey to
get compound records and split the survey responses into a development set and a
held-out test set.
Development Test
Number of rows 30085 10029Entity columns 494 494High income 7532 2521Low income 22553 7508
Table 4.1: ACS dataset used in predict-census-income project.
4.2.4 Research instruments
Our mixed-method study synthesizes and triangulates data from five sources:
• Pre-participation survey. Participants provided background information about
themselves, such as their education; occupation; self-reported background with
ML modeling, feature engineering, Python programming, open-source devel-
opment, analysis of survey data, and familiarity with the U.S. Census/ACS
specifically; and preferred development environment. Participants were also
asked to opt in to telemetry data collection.
• Assemblé telemetry. To better understand the experience of participants who
use Assemblé on Binder, we instrumented the extension and installed an in-
strumented version of Ballet to collect usage statistics and some intermediate
85

outputs. Once participants authenticated with GitHub, we checked with our
telemetry server to see whether they had opted in to telemetry data collection.
If they did so, we sent and recorded the buffered telemetry events.
• Post-participation survey. Participants who attempted and/or completed the
task were asked to fill out a survey about their experience, including the devel-
opment environment they used, how much time they spent on each sub-task,
and which activities they did and functionality they used as part of the task
and which of these were most important. They were also asked to provide open-
ended feedback on different aspects, and to report how demanding the task was
using the NASA-TLX Task Load Index (Hart and Staveland, 1988), a workload
assessment that is widely used in usability evaluations in software engineering
and other domains (Cook et al., 2005; Salman and Turhan, 2018). Participants
indicate on a scale the temporal demand, mental demand, and effort required
by the task, their perceived performance, and their frustration. The TLX score
is a weighted average of responses (0=very low task demand, 100=very high
task demand).
• Code contributions. For participants who progressed in the task to the point of
submitting a feature definition to the upstream predict-census-income project,
we analyze the submitted source code as well as the performance characteristics
of the submission.
• Expert and AutoML baselines. To obtain comparisons to solutions born from
Ballet collaborations, we also obtain baseline solutions to the personal income
prediction problem from outside data science experts and from a cloud provider’s
AutoML service. First, we asked two outside data science experts working
independently to solve the combined feature engineering and modeling task
(without knowledge of the collaborative project).2 These experts were asked to
work until they were satisfied with the performance of their predictive model,
but not to exceed four hours, and were not compensated. Second, we used2Replication files are available at https://github.com/micahjsmith/ballet-cscw-2021.
86

Google Cloud AutoML Tables,3 an AutoML service for tabular data, which
supports structured data “as found in the wild,” to automatically solve the
task, and ran it with its default settings until convergence.
The study description, pre-participation survey, and post-participation survey can
be found in the supplementary material to Smith et al. (2021a).
4.2.5 Analysis
After linking our data sources together, we performed a quantitative analysis to sum-
marize results (e.g., participant backgrounds, average time spent) and relate measures
to each other (e.g., participant expertise to cognitive load). Where appropriate, we
also conducted statistical tests to report on significant differences for phenomena of
interest. For qualitative analysis, we employed open and axial coding methodology
to categorize the free-text responses and relate codes to each other to form emergent
themes (Böhm, 2004). Two researchers first coded each response independently, and
responses could receive multiple codes, which were then collaboratively discussed. We
resolved disagreements by revisiting the responses, potentially introducing new codes
in relation to themes discovered in other responses. We later revisited all responses
and codes to investigate how they relate to each other, which led us to the emergent
themes we present in our results. Finally, to understand the kind of source code
that is produced in a collaborative data science setting, we performed lightweight
program analysis to extract and quantify the feature engineering primitives used by
our participants.
4.3 Results
We present our results by interleaving the outcomes of quantitative and qualitative
analysis (including verbatim quotes from free-text responses) to form a coherent nar-
rative around our research questions.3https://cloud.google.com/automl-tables/
87

In total, 50 people signed up to participate in the case study and 27 people from
four global regions completed the task in its entirety. To the best of our knowledge,
this makes our project the sixth largest ML modeling collaboration hosted on GitHub
in terms of code contributors (Table 2.1). During the case study, 28 features were
merged that together extract 32 feature values from the raw data. Of case study
participants, 26 submitted at least one feature and 22 had at least one feature merged.
As we went through participants’ qualitative feedback about their experience, several
key themes emerged, which we discuss inline.
4.3.1 RQ1: Collaborative framework design
We identified several themes that relate to the design of frameworks for collaborative
data science. We start by connecting these themes to the design decisions we made
about Ballet.
Goal Clarity. The project-level goal is clear — to produce a predictive model. In
the case of survey data that requires feature engineering, Ballet takes the approach of
decomposing this data into individual goals via the feature definition abstraction, and
asking collaborators to create and submit a patch that introduces a well-performing
feature. Success in this task is validated using statistical tests (Section 3.5). How-
ever, the relationship between the individual and project goals may not always appear
aligned to all participants. This negatively impacted some participants’ experiences
by introducing confusion about the direction and goal of their task. Some of the con-
cerns expressed had to do with specific documentation elements, but others indicated
a deeper confusion: “Do the resulting features have to be ‘meaningful’ for a human or
can they be built as combinations that maximize some statistical measure?” (P2). Us-
ing the concept of software and statistical acceptance procedures, many high-quality
features were merged into the project. However, the procedure was not fully trans-
parent to the case study participants and may have prevented them from optimizing
their features. While a feature that maximizes some statistical measure is best in the
short term, it may constrain group productivity overall, as other participants benefit
from being able to learn from existing features. And while having specific individual
88

goals incentivizes high-quality feature engineering, participants are then less focused
on the project-level goal and maintainers must either implement new project func-
tionality themselves or define additional individual goals. This is a classic tension in
designing collaborative mechanisms when it comes to appropriately structuring goals
and incentives Ouchi (1979).
Learning by Example. We asked participants to rank the functionalities that
were most important for completing the task, focusing both on creating and submit-
ting feature definitions (Figure 4.1). For the patch development task, participants
ranked most highly the ability to refer to example code written by fellow participants
or project maintainers. This form of implicit collaboration was useful for participants
to accelerate the onboarding process, learn new feature engineering techniques, and
coordinate their efforts.
Distribution of Work. However, this led to feedback about difficulties in iden-
tifying how to effectively participate in the collaboration. Participants wanted the
framework to provide more functionality to determine how to partition the input
space: “for better collaboration, different users can get different subsets of variables”
(P1). Some participants specifically asked for methods to review the input variables
that had and had not been used and to limit the number of variables that one person
would need to consider. This is a promising direction for future work, and similar
ideas appear in automatic code reviewer recommendation (Peng et al., 2018). Other
participants, however, were satisfied with a more passive approach in which they used
the Ballet client to programmatically explore existing feature definitions.
Cloud-Based Workflow. In terms of submitting feature definitions, the most
popular element by far was Assemblé. Importantly, all of the nine participants who
reported that they “never” contribute to open-source software were able to successfully
submit a PR to the predict-census-income project with Assemblé— seven in the cloud
and the others locally.4 Attracting participants like these who are not experienced
data scientists is critical for sustaining large collaborations, and prioritizing inter-4Local use involves installing JupyterLab and Assemblé on a local machine, rather than using
the version running on Binder.
89

0 10 20 30 40 50Votes
Refer to rejected featureValidate using other
Review feature API validationTrain model
Use clientValidate using client
Review feature acceptance validationRefer to accepted feature
Run starter code
0 10 20 30 40 50Votes
GitHub UIVirtualenv
Git commandsBallet CLIAssemblé
Figure 4.1: Most important functionality within a collaborative feature engineeringproject for the patch development task (top) and the patch contribution task (bot-tom), according to participant votes. Participants were asked to rank their top threeitems for creating feature definitions (awarded three, two, and one points in aggre-gating votes) and their top two items for submitting feature definitions (awarded twoand one points in aggregating votes).
faces that provide first-class support for collaboration can support these developers.
The adaptation of the open-source development process reflected in Assemblé shows
that concepts of open-source workflows and decentralized development did effectively
address the aforementioned challenges for some developers.
In summary, we found that the feature definition abstraction, the cloud-based
workflow in Assemblé, and the coordination and learning from referring to shared
feature definitions were the aspects that contributed most to the participants’ expe-
riences. While the concept of data science patches makes significant progress toward
addressing task management challenges, frictions remain around goal clarity and di-
vision of work, which should be addressed in future designs.
90

0 50 100
BeginnerIntermediate
Expert
Data Science
0 50 100
Software Development
0 50 100
Domain Expertise TLX - Overall
0 60 120 180
BeginnerIntermediate
Expert
0 60 120 180 0 60 120 180
MinutesSpent
0.0 0.2
BeginnerIntermediate
Expert
0.0 0.2 0.0 0.2
Mutual
Information
0.0 0.2 0.4
BeginnerIntermediate
Expert
0.0 0.2 0.4 0.0 0.2 0.4
FeatureIm
portance
Figure 4.2: Task demand, total minutes spent on task, mutual information of bestfeature with target on the test set, and total global feature importance assigned byAutoML service on development set, for participants of varying experience sorted bytype of background. (Statistical and ML modeling background is labeled as “DataScience.”)
4.3.2 RQ2: Participant background, experience, and perfor-
mance
In considering the relationship between participants’ backgrounds, experiences, and
performance, we look at six dimensions of participants’ backgrounds. Because many
are complementary, for purposes of analysis, we collapse them into the broader cat-
egories of ML modeling background, software development background, and domain
expertise. Our main dependent variables for illustrating participant experience are
the overall cognitive load (TLX - Overall) and total minutes spent on the task (Min-
utes Spent). Our main dependent variables for illustrating participant performance
are two measures of the ML performance of each feature: its mutual information with
the target and its feature importance as assessed by AutoML. We summarize the re-
lationship between background, experience, and performance measures in Figure 4.2.
Beginners find the task accessible. Beginners found the task to be accessible,
as across different backgrounds, beginners had a median task demand of 45.2 (lower is
91
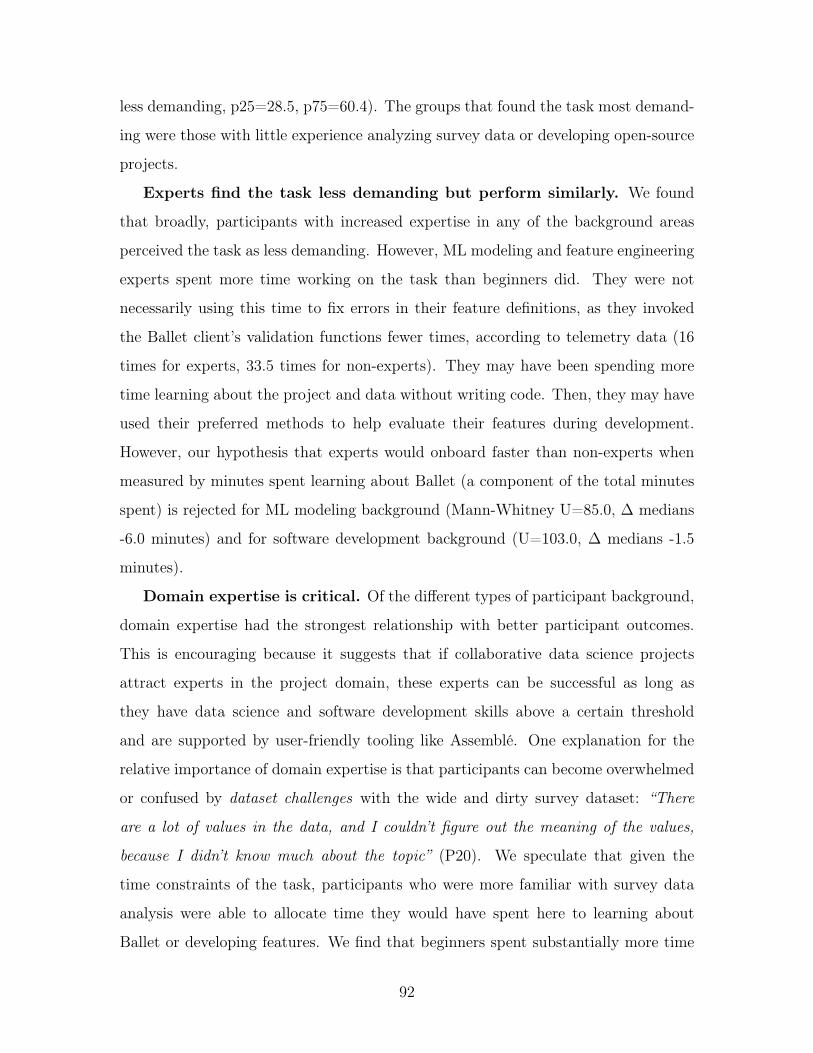
less demanding, p25=28.5, p75=60.4). The groups that found the task most demand-
ing were those with little experience analyzing survey data or developing open-source
projects.
Experts find the task less demanding but perform similarly. We found
that broadly, participants with increased expertise in any of the background areas
perceived the task as less demanding. However, ML modeling and feature engineering
experts spent more time working on the task than beginners did. They were not
necessarily using this time to fix errors in their feature definitions, as they invoked
the Ballet client’s validation functions fewer times, according to telemetry data (16
times for experts, 33.5 times for non-experts). They may have been spending more
time learning about the project and data without writing code. Then, they may have
used their preferred methods to help evaluate their features during development.
However, our hypothesis that experts would onboard faster than non-experts when
measured by minutes spent learning about Ballet (a component of the total minutes
spent) is rejected for ML modeling background (Mann-Whitney U=85.0, ∆ medians
-6.0 minutes) and for software development background (U=103.0, ∆ medians -1.5
minutes).
Domain expertise is critical. Of the different types of participant background,
domain expertise had the strongest relationship with better participant outcomes.
This is encouraging because it suggests that if collaborative data science projects
attract experts in the project domain, these experts can be successful as long as
they have data science and software development skills above a certain threshold
and are supported by user-friendly tooling like Assemblé. One explanation for the
relative importance of domain expertise is that participants can become overwhelmed
or confused by dataset challenges with the wide and dirty survey dataset: “There
are a lot of values in the data, and I couldn’t figure out the meaning of the values,
because I didn’t know much about the topic” (P20). We speculate that given the
time constraints of the task, participants who were more familiar with survey data
analysis were able to allocate time they would have spent here to learning about
Ballet or developing features. We find that beginners spent substantially more time
92

from ballet import Featurefrom ballet.eng.external import SimpleImputer
input = ["JWTR", "JWRIP", "JWMNP"]
def calculate_travel_budget(df):if (df["JWTR"] == 1.0).all():
return df["JWMNP"] * df["JWRIP"]return df["JWMNP"] * df["JWTR"]
transformer = [calculate_travel_budget,SimpleImputer(strategy="mean"),
]name = "work_travel_combined"description = "Combine data for time to travel to work with vehicle. Lower value,
the most likely they have higher income"→˓
feature = Feature(input, transformer, name=name, description=description)
Figure 4.3: A feature definition that computes a cleaned measure of vehicle commutetime (for the predict-census-income project).
learning about the prediction problem and data — a median of 36 minutes vs. 13.6
minutes for intermediate and expert participants (Mann-Whitney U=36.5, p=0.064,
𝑛1=6, 𝑛2=21).
4.3.3 RQ3: Collaborative feature engineering code
We were interested in understanding the kind of feature engineering code that partic-
ipants write in this collaborative setting. Participants in the case study contributed
28 feature definitions to the project, which together extract 32 feature values. The
features had 47 transformers, with most feature functions applying a single trans-
former to their input but some applying up to four transformers sequentially. Two
examples of feature definitions developed by participants are shown in Figures 3.3
and 4.3.
Feature engineering primitives. Participants collectively used 10 different fea-
ture engineering primitives (Section 3.4.4). Our source code analysis shows that 17/47
transformers were FunctionTransformer primitives that can wrap standard statistical
functions or are used by Ballet to automatically wrap anonymous functions. Use of
93

these was broadly split between simple functions to process variables that needed
minimal cleaning/transformation vs. complex functions that extracted custom map-
pings from ordinal or categorical variables based on a careful reading of the survey
codebook.
Feature characteristics. These feature functions consumed 137 distinct vari-
ables from the raw ACS responses, out of a total of 494 present in the entities table.
Most of these variables were consumed by just one feature, but several were trans-
formed in different ways, such as SCHL (educational attainment), which was an input
to five different features. Thus 357 variables, or 72%, were ignored by the collabo-
rators. Some were ignored because they are not predictive of personal income. For
example, the end-to-end AutoML model that operates directly on the raw ACS re-
sponses assigns a feature importance of less than 0.001 to 418 variables (where the
feature importance values sum to one). However, there may still be missed opportuni-
ties by the collaborators, as the AutoML model assigns feature importance of greater
than 0.01 to seven variables that were not used by any of the participants’ features
— such as RELP, which indicates the person’s relationship to the “reference person” in
the household and is an intuitive predictor of income because it allows the modeler
to differentiate between adults who are dependents of their parents. This suggests
an opportunity for developers of collaborative frameworks like Ballet to provide more
formal direction about where to invest feature engineering effort — for example, by
providing methods to summarize the inputs that have or have not been included in
patches, in line with the distribution of work theme that emerged from participant
responses and the challenge of task management. Of the features, 11/28 had a learned
transformer while the remainder did not learn any feature engineering-specific param-
eters from the training data, and 14/47 transformers were learned transformers.
Feature definition abstraction. The Feature abstraction of Ballet yields a
one-to-one correspondence between the task and feature definitions. This new pro-
gramming paradigm required participants to adjust their usual feature engineering
toolbox. For many respondents, this was a positive change, with benefits for reusabil-
ity, shareability, and tracking prior features: “It allows for a better level of abstraction
94

FeatureEngineering Modeling Accuracy Precision Recall F1 Failure
rate
Ballet AutoML 0.876 0.838 0.830 0.834 0.000AutoML AutoML 0.462 0.440 0.423 0.431 0.475Ballet Expert 1 0.828 0.799 0.707 0.734 0.000Ballet Expert 2 0.840 0.793 0.858 0.811 0.000Expert 1 Expert 1 0.814 0.775 0.686 0.710 0.000Expert 2 Expert 2 0.857 0.809 0.867 0.828 0.000
Table 4.2: ML Performance of Ballet and alternatives. The AutoML feature engi-neering is not robust to changes from the development set and fails with errors onalmost half of the test rows. But when using the feature definitions produced by theBallet collaboration, the AutoML method outperforms human experts.
as it raises Features up to their own entity instead of just being a standalone column”
(P16). For others, it was difficult to adjust, and participants noted challenges in learn-
ing how to express their ideas using transformers and feature engineering primitives
and how to debug failures.
4.3.4 RQ4: Comparative performance
While we focus on better understanding how data scientists work together in a col-
laborative setting, ultimately one important measure of the success of a collaborative
model is its ability to demonstrate good ML performance. To evaluate this, we
compare the performance of the feature engineering pipeline built by the case study
participants against several alternatives built from our baseline solutions we obtained
from outside data science experts and a commercial AutoML service, Google Cloud
AutoML Tables (Section 4.2.4).
We found that among these alternatives, the best ML performance came from
using the Ballet feature engineering pipeline and passing the extracted feature values
to AutoML Tables (Table 4.2). This hybrid human-AI approach outperformed end-
to-end AutoML Tables and both of the outside experts. This finding also confirms
previous results suggesting that feature engineering is sometimes difficult to automate,
and that advances in AutoML have led to expert- or super-expert performance on
clean, well-defined inputs.
95

Qualitative differences. The three approaches to the task varied widely. Due
to Ballet’s structure, participants spent all of their development effort on creating a
small set of high-quality features. AutoML Tables performs basic feature engineering
according to the inferred variable type (normalize and bucketize numeric variables,
create one-hot encoding and embeddings for categorical variables) but spends most
of its runtime budget searching and tuning models, resulting in a gradient-boosted
decision tree for solving the census problem. The experts similarly performed minimal
feature engineering (encoding and imputing); the resulting models were a minority
class oversampling step followed by a tuned AdaBoost classifier (Expert 1) and a
custom greedy forward feature selection step followed by a linear probability model
(Expert 2).
4.3.5 Evaluation of Assemblé
As part of the predict-census-income case study, we conduct a nested evaluation of
Assemblé by studying participants who used it. We aim to assess the ability of users
to successfully create pull requests for code snippets within a messy notebook, and
to identify key themes from participants’ experiences.
Procedures
Of 27 data scientists who participated in the case study, 23 participants used Assemblé
(v0.7.2) to develop their code and submit it to the shared repository.
Recall from Section 4.2.4 that participants first completed a short questionnaire in
which they self-reported their background in data science and open-source software
development and their preferred development environments for data science tasks.
Participants were also asked to consent to telemetry data collection. If they did, we
instrumented Assemblé to collect detailed usage data on their development sessions,
their use of the submit button functionality, and their use of the Ballet client library.
After completing their feature development, participants completed a short survey
from which we isolated responses relating to their use of Assemblé, including its
96

Data Science Software Development Domain expertise0
3
6
9
12
15
coun
t
BeginnerIntermediateExpert
(a) Background of 23 developers using Assemblé ina study involving predicting personal income.
0 2 4 6 8 10 12Minutes spent - Submitting Features
0
1
2
3
4
5
Cou
nt
(b) Distribution of total minutesspent submitting features to up-stream repository.
Figure 4.4: Assemblé user study results.
features, their overall experience with the project, and any free-response feedback.
Results
Only five participants reported a preference for performing data science activities
and Python development in notebook environments before the study, with 10 instead
preferring IDEs and four preferring text editors. Seven participants had never con-
tributed to open-source projects at all, while the remainder reported contributing
approximately yearly (eight), monthly (four), or weekly (four). Fifteen participants
opted into telemetry data collection, generating an average of 33 telemetry events
each. A summary of participant background is shown in Figure 4.4.
Quantitative Result Our main finding is that even with their diverse backgrounds
and initial preferences, all participants in the study successfully used Assemblé to
create one or more pull requests to the upstream project repository. According to
telemetry data, the modal user pressed the submit button just once. Since the user
study task was to submit a single feature, this suggests that users were immediately
successful at creating a pull request for their desired contribution. We also find that
participants were able to do this fairly quickly — half were able to create a pull
97

request using Assemblé in three minutes or less (Figure 4.4b). In 16 out of 45 submit
events captured in the telemetry data (belonging to five unique users), Assemblé’s
static analysis identified syntax errors in the intended submissions, each of which
would have led to a pull request that would have failed Ballet’s automated test suite.
In all of these cases, users were able to quickly resolve these errors and submit again.
Qualitative Results From a qualitative perspective, we identified two major themes
from the free text responses in our post-participation survey.
Keep It Simple While Introducing Better Affordances. Users overwhelm-
ingly noted the simplicity with which they were able to submit their features, with one
participant noting “The process of integrating the new feature was very smooth” and
another saying “[Submitting a feature] was extremely and [surprisingly] easy! Most
rewarding part.” However, some participants noted that while the submission process
was seamless, affordances could be better highlighted, e.g.: “Maybe highlight a bit
more that you need to select the feature cell before hitting submit — I got confused
after I missed this part.” Indeed, in the few cases where participants were not able
to submit their feature on their first attempt, we see in our telemetry data that they
either selected the wrong cell or introduced a syntax error.
Tensions between Abstraction and Submission Transparency. Another
theme that emerged in our analysis was submission transparency. While we achieved
our goal of hiding the lower-level procedures required in the pull request model, some
participants were curious about the underlying process. Several wanted to know how
their feature was evaluated, both in server-side validation and in continuous inte-
gration after pull request creation: “It was not clear whether my feature was actually
good, especially compared to other features.” Others expressed a lack of understanding
of what was going on “under the hood”: “I didn’t fully understand how Assemblé was
working on the backend to actually develop the feature with relatively straightforward
commands, but it seemed to work pretty well.” This feedback highlights the tension
between abstraction and transparency. While users clearly appreciated the simplicity
98

facilitated by the submission mechanism, they missed the traceability and feedback
a more classical pull request model would have provided. We see this as an oppor-
tunity to introduce optionally available traces detailing the steps of the underlying
process, partly as a way of onboarding non-experts into the open-source development
workflow.
99

Chapter 5
Discussion of Ballet
In this section, we reflect on Ballet, Assemblé, and the predict-census-income case
study with a particular eye toward scale, human factors, security, privacy, and the
limitations of our research. We also discuss future areas of focus for HCI researchers
and designers of collaborative frameworks.
5.1 Effects of scale
Although Ballet makes strides in scaling collaborative data science projects beyond
small teams, we expect additional challenges to arise as collaborations are scaled even
further.
The number of possible direct communication channels in a project scales quadrat-
ically with the number of developers (Brooks Jr, 1995). At the scale of our case
study, communication among collaborators can take place effectively through discus-
sion threads, chat rooms, and shared work products. But projects with hundreds
or thousands of developers require other strategies, such as search, filtering, and
recommendation of relevant content. The metadata exposed by feature definitions
(Section 3.4.1) makes it possible to explore these functionalities in future work.
A task management challenge that goes hand-in-hand with communication is dis-
tribution of work, a theme from our qualitative analysis in Section 4.3. Even at the
scale of our case study, some collaborators wanted Ballet itself to support them in
100

the distribution of feature engineering work. At larger scales, this need becomes more
pressing if redundant work is to be avoided. In addition to strategies like partition-
ing the variable space and surfacing unused variables for developers, other solutions
may include ticketing systems, clustering of variables and partitioning of clusters, and
algorithms to rank variables by their impact after transformations have been applied.
5.2 Effects of culture
Data science teams are often made up of like-minded people from similar backgrounds.
For example, Choi and Tausczik (2017) report that most of the open data analysis
projects they reviewed were comprised of people who already knew each other —
partly because teammates wanted to be confident that everyone there had the required
expertise.
Our more formalized and structured notion of collaboration may allow data science
developers with few or no personal connections to form more diverse, cross-cultural
teams. For example, the predict-census-income project included collaborators from
four different global regions (North America, Europe, Asia, and the Middle East).
The support for validating contributions like feature definitions with statistical and
software quality measures may allow teammates to have confidence in each other even
without knowing each other’s backgrounds or specific expertise.
5.3 Security
Any software project that receives untrusted code must be mindful of security con-
siderations. The primary threat model for Ballet projects is a well-meaning collab-
orator that submits poorly-performing feature definitions or inadvertently “breaks”
the feature engineering pipeline, a consideration that partly informed the acceptance
procedure in Section 3.5. Ballet’s support for automatic merging of accepted features
presents a risk that harmful code may be embedded within otherwise relevant fea-
tures. While requiring a maintainer to give final approval for accepted features is a
101

practical defense, defending against malicious contributions is an ongoing struggle for
open-source projects (Payne, 2002; Decan et al., 2016; Baldwin, 2018).
5.4 Privacy
Data is, to no surprise, central to data science. This can pose challenges for open
data projects if the data they want to use is sensitive or confidential — for example,
if it contains personally identifiable information. The main way to address this issue
is to secure the dataset but open the codebase. In this formulation, access to the data
is limited to those who have undergone training or signed a restricted use agreement.
But at the same time, the entirety of the code, including the feature definitions, can
be developed publicly without revealing any non-public information about the data.
With this strategy, developers and maintainers must monitor submissions to ensure
that data is not accidentally copied into source code files — a process that can be
automated, similar to scanning for secure tokens and credentials (Meli et al., 2019;
Glanz et al., 2020).
One alternative is to make the entire repository private, ensuring that only people
who have been approved have access to the code and data. However, this curtails most
of the benefits of open data science and makes it more difficult to attract collaborators.
Another alternative is to anonymize data or use synthetic data for development
while keeping the actual data private and secure. Recent advances in synthetic data
generation (Xu et al., 2019; Patki et al., 2016) allow a synthetic dataset to be gener-
ated with the same schema and joint distribution as the real dataset, even for complex
tables. This may be sufficient to allow data science developers to discover patterns
and create feature definitions that can then be executed on the real, unseen dataset.
This follows work releasing sensitive datasets for analysis in a privacy-preserving way
using techniques like differential privacy (Dwork, 2008). Indeed, the U.S. Census is
now using differential privacy techniques in the release of data products such as the
ACS (Abowd et al., 2020). Analyses developed in an open setting could then be re-run
privately on the original data according to the privacy budget of each researcher.
102

5.5 Interpretability and documentation
Zhang et al. (2020) observe that data science workers rarely create documentation
about their work during feature engineering, suggesting that human decision-making
may be reflected in the data pipeline while “simultaneously becoming invisible.” This
poses a risk for replicability, maintenance, and interpretability.
In Ballet, the structure provided by our feature definition abstraction means that
the resulting feature values have clear provenance and are interpretable, in the sense
that for each column in the feature matrix, the raw variables used and the exact
transformations applied are easily surfaced and understood. Feature value names
(columns in the feature matrix) can be provided by data scientists when they create
feature definitions, or reasonable names can be inferred by Ballet from the available
metadata and through lightweight program analysis.
5.6 Feature stores
Feature stores, or applications that ingest, store, and serve feature values for offline
model training and online training and inference, are rapidly becoming part of the
machine learning engineering toolkit. Open-source systems like Feast1 are emerging to
complement the proprietary systems that are known to be used at large technology
companies, such as Zipline within AirBnb’s BigHead platform (Brumbaugh et al.,
2019) or Michelangelo at Uber (Hermann and Del Balso, 2017). However, such feature
stores do not support feature engineering, feature discovery, or feature validation,
but instead focus on the data systems aspect of features (as their name indicates).
Thus, the human process of developing new features and discovering and improving
existing ones remains an area in need of framework support. These two problems — of
developing features, then using them in production systems — remain complementary.1https://github.com/feast-dev/feast
103

5.7 Feature maintenance
Just as software libraries require maintenance to fix bugs and make updates in re-
sponse to changing APIs or dependencies, so too do feature definitions and feature
engineering pipelines. Feature maintenance may be required in several situations.
First, components from libraries used in a feature definition, such as the name or
behavior of an imputation primitive, could change. Second, the schema of the target
dataset could change, such as if a survey is conducted in a new year, with certain
questions from prior years replaced with new ones.2 Third, feature maintenance may
be required due to distribution shift, in which new observations following the same
schema have a different data distribution, causing the assumptions reflected in a
feature definition to be invalidated.
Though we have focused mainly on the scale of a collaboration in terms of the
number of code contributors, another important measure of scale is the length of
time the project remains in a developed, maintained state, and as such is useful to
consumers. As projects age, these secondary issues of feature maintenance, as well as
dataset and model versioning and changing usage scenarios, become more salient.
A similar development workflow to the one presented in this thesis could also
be used for feature maintenance, and researchers have pointed out that the open-
source model is particularly well suited for ensuring software is maintained (Johnson,
2006). Currently, Ballet focuses on supporting the addition of new features; to sup-
port the modification of existing features would require additional design consider-
ations, such as how developers using Assemblé could indicate which feature should
be updated/removed by their pull request. Automatically detecting the need for
maintenance due to distribution shift or otherwise is an important research direction,
and can be supported in the meantime by ad hoc statistical tests created by project
maintainers.2For example, the U.S. Census has modified the language used to ask about respondents’ race
several times in response to an evolving understanding of this construct. A changelog (AmericanCommunity Survey Office, 2019) of a recently conducted survey compared to the prior year contained42 entries.
104

5.8 Higher-order features
While feature definitions allow data scientists to express complex transformations of
their raw variables, the process can become tedious if they have many variables to
process. For example, as we will see in Chapter 8 for the Fragile Families Challenge
data, even with a highly-collaborative feature engineering effort, it is difficult to
process many thousands of variables using Ballet’s existing functionality. However, in
many prediction problems, some variables are quite similar to each other and require
similar processing. This motivates support for higher-order features that generalize
feature definitions to operate on functions on variables, rather than on variables
themselves. That is, while a feature might operate on a single variable, a higher-
order feature might operate on a set of variables, that each satisfy some condition, by
applying the same feature to each individual variable. The input to a higher-order
feature could be a set of variables, a function from the entities data frame to a set
of variables, a function that returns a boolean for each variable indicating whether
it should be operated on, or a data type or other meta-information about a variable.
Higher-order features could be developed and contributed by data scientists alongside
of the development of normal features.
5.9 Combining human and automated feature engi-
neering
In some prediction tasks, automated feature engineering algorithms like DFS (Kan-
ter and Veeramachaneni, 2015) and Cognito (Khurana et al., 2016) can perform well
by themselves with minimal human oversight. And in other prediction tasks, many
simple features are trivial to develop. There is promise in combining together human-
driven and machine-driven (automated) feature engineering approaches. One advan-
tage of Ballet is that it simply expects that code contributions to a shared project
introduce new feature definitions, but leaves open the question of whether the feature
definitions are developed by humans or machines, and whether the code is submit-
105

ted through a graphical user interface, a development environment like Assemblé, or
through an automated process. As a result, human-generated and machine-generated
feature definitions can co-exist peacefully within a single project, and the same fea-
ture validation method can be used for both types of features. Future research in
this area should consider how interfaces can expose automated feature engineering
algorithms to support data scientists developing new features, and whether accep-
tance procedures for features need to be customized when both human and machine
features are being contributed.
5.10 Ethical considerations
As the field of machine learning rapidly advances, more and more ethical consider-
ations are being raised, including of recent models (Bender et al., 2021; Bolukbasi
et al., 2016; Strubell et al., 2019). The same set of concerns could also be raised
about any model developed using Ballet. Addressing the underlying issues is beyond
the scope of our work. However, we emphasize that Ballet provides several benefits
from an ethical perspective. The open-source setting means that models are open and
transparent from the outset. Similarly, we focus on the development of models that
aim to address societal problems, such as vehicle fatality prediction and government
survey optimization.
5.11 Data source support
We described the application of Ballet to a disease incidence forecasting problem, a
house price prediction problem, and a personal income prediction problem, and will
describe the application to a life outcomes prediction problem in Chapter 8. These
tasks are similar in the sense that they use structured data in a single table.
Ballet could also support the following data sources as inputs to its collaborative
feature engineering process:
• Multi-table, relational data that has been denormalized into single-table form.
106

• NoSQL/NewSQL collections that are flattened into a data frame.
• Survey data from various providers, such as Qualtrics, Google Forms, and Sur-
vey Monkey.
To better support these alternative data sources, Ballet could implement “connec-
tors” that transform data from one of these initial forms into the single-table data
frame that Ballet currently supports.
Moreover, Ballet could be extended to support querying on multi-table relational
data directly. The feature definition abstraction requires data science developers
to write a tuple of input and transformer. In the case of a data frame, it is easy to
interpret the input as an index into the data frame’s column index and the transformer
as operations on rectangular data. However, these same concepts could apply to
multi-table data. The input could be a set of tables within a relational database and
the transformer could be an SQL query written over the database. Ballet’s feature
execution engine could be modified to rewrite queries to ensure they do not introduce
leakage. The queries could be written in SQL directly, in a Python-based object-
relational mapper (ORM) such as SQLAlchemy, or in an in-memory representation
of a relational database such as a featuretools.EntitySet.
5.12 Assemblé
To allow developers to select code to submit, we rely upon simple existing interac-
tions provided by Jupyter (i.e. select one cell, select multiple cells). However, some
developers requested better affordances, and other interactions could be incorporated.
For example, code gathering tools (Head et al., 2019) could allow users to more easily
select code to be submitted while staying within the notebook environment.
One reason (of many) that powerful developer tools exist for team-based version
control is to avoid and/or resolve merge conflicts when contributions are scattered
across multiple files. With Assemblé, we can avoid such merge conflicts by tightly
coupling with Ballet projects, in the sense that we can make assumptions about the
107

structure those projects impose on contributions, such as that contributions are in
single Python modules at well-defined locations in the directory structure. By re-
laxing these assumption, or by defining such structures for other settings, Assemblé
could be used more generally to contribute patches to central locations. For example,
the ML Bazaar framework (Chapter 6) organizes data science pipelines into a graph
of “ML primitives,” each a JSON annotation of some underlying implementation that
an expert or experts must create and validate in a notebook. Assemblé could be used
to extract the completed primitive and submit it to the project’s curated catalog of
community primitives. As another example, an educator running an introductory
programming class could invite students to submit their implementations of a ba-
sic algorithm to a joint hosting repository, such that they could share in the code
review process and learn from the implementations of others. Similarly, a Python
language extension for sharing simple functions (Fast and Bernstein, 2016) could use
the functionality of the development environment to share these functions, rather
than requiring the manual addition of function decorators.
5.13 Earlier visions of collaboration
In earlier work preceding the developing of Ballet, we created FeatureHub, a cloud-
hosted feature engineering platform (Section 2.1). Through the experience gained in
that project, we identified drawbacks and challenges that can occur when collabo-
ration is facilitated through hosted platforms and called for the development of new
collaborative paradigms:
I propose the development of a new paradigm for platform-less collaborativedata science, with a focus on feature engineering. Under this approachcollaborators will develop feature engineering source code on their ownmachines, in their own preferred environments. They will submit theirsource code to an authoritative repository that will use still other servicesto verify that the proposed source code is syntactically and semanticallyvalid and to evaluate performance on an unseen test set. If tests passand performance is sufficient, the proposed code can be merged into therepository of features comprising the machine learning model.
(Smith, 2018, page 100)
108

Our work on Ballet fully realizes this earlier vision. The authoritative repository
is the project hosted on GitHub. The still other services are the continuous integra-
tion providers like Travis CI. The syntactically and semantically valid condition is
enforced by the feature API validation. The evaluated performance is given by the
ML performance validation using streaming feature definition selection algorithms.
The proposed code can be merged automatically by the Ballet Bot.
Ballet fully supports collaborators in developing feature definitions using their
preferred environments. However, the earlier vision did not fully grasp the importance
of the development environment itself, and its support for the patch contribution
task. With Ballet, we have found that providing data scientists with tools to solve
the patch contribution task within a notebook environment was critical for facilitating
collaborations among different data science personas.
5.14 Limitations
There are several limitations to our approach. Feature engineering is a complex
process, and we have not yet provided support for several common practices (or
potential new practices). For example, many features are trivial to specify and can
be enumerated by automated approaches (Kanter and Veeramachaneni, 2015), and
some data cleaning and preparation can be performed automatically. We have referred
the responsibility for adding these techniques to the feature engineering pipeline to
individual project maintainers, even as we consider a hybrid approach (Section 5.9).
Similarly, feature engineering with higher-level features (Section 5.8) could enhance
developer productivity.
Feature engineering is only one part of the larger data science process, albeit
an important one. Indeed, many domains, including computer vision and natural
language processing, have largely replaced manually engineered features with learned
ones extracted by deep neural networks. Applying our conceptual framework to other
aspects of data science, like data programming or ensembling in developing predictive
models, can increase the impact of collaborations. Similarly, improving collaboration
109

in other aspects of data work — like data journalism, exploratory data analysis,
causal modeling, and neural network architecture design — remains an important
challenge.
110

Part II
Automated data science
111

Chapter 6
The Machine Learning Bazaar
6.1 Introduction
Once limited to conventional commercial applications, machine learning (ML) is now
widely applied in physical and social sciences, in policy and government, and in a va-
riety of industries. This diversification has led to difficulties in actually creating and
deploying real-world systems, as key functionality becomes fragmented across ML-
specific or domain-specific software libraries created by independent communities. In
addition, the process of building problem-specific end-to-end systems continues to
be marked by ML and data management challenges, such as formulating achievable
learning problems (Kanter et al., 2016), managing and cleaning data and metadata
(Miao et al., 2017; van der Weide et al., 2017; Bhardwaj et al., 2015), scaling tuning
procedures (Falkner et al., 2018; Li et al., 2020), and deploying models and serv-
ing predictions (Baylor et al., 2017; Crankshaw et al., 2015). In practice, engineers
and data scientists often spend significant effort developing ad hoc programs for new
problems: writing “glue code” to connect components from different software libraries,
processing different forms of raw input, and interfacing with external systems. These
steps are tedious and error-prone, and lead to the emergence of brittle “pipeline jun-
gles” (Sculley et al., 2015).
In the Ballet framework, we support collaboration in feature engineering within
predictive machine learning modeling pipelines (Chapter 3). However, this is only one
112

dfs
hog
graph
ResNet50
Xception
MobileNet
DenseNet121
link_prediction
Tokenizer
StringVectorizer
DatetimeFeaturizer
CategoricalEncoder
Feature TransformersFeature Selectors
Imag
eG
rap
hR
elat
iona
lTi
me
serie
sS
ingl
eta
ble
Text
Use
r-ite
mm
atrix
Link
pre
dic
tion A
O++++++
OO
OO
?
Classification
Reg
ress
ion
Fore
cast
ing
Gra
ph
mat
chin
gA
nom
aly
det
ectio
nC
omm
unity
det
ectio
n
Feature ExtractorsFeature Generators
PCA
Imputer
StandardScaler
pad_sequences
ExtraTreesSelector
LassoSelector
Preprocessors
B
C
x1
x2
D
LightFM
XGBClassifier
XGBRegressor
LSTMTextClassifier
RandomForestClassifier
RandomForestRegressor
Estimators
Traditional AutoML
ClassDecoder
AnomalyDetector
BoundaryDetector
Postprocessors
y
x
v
t
?=
X?
TextCleaner
GaussianBlur
ClassEncoder
UniqueCounter
ResNet50Prep
XceptionPrep
MobileNetPrep
DenseNet121Prep
VocabularyCounter
[X] [Y] [X] [Y] [Y]
Figure 6.1: Various ML task types that can be solved in ML Bazaar by combiningML primitives (abbreviated here from fully-qualified names). Primitives are catego-rized into preprocessors, feature processors, estimators, and postprocessors, and aredrawn from many different ML libraries, such as Ballet, scikit-learn, Keras, OpenCV,and NetworkX, as well as custom implementations. Many additional primitives andpipelines are available in our curated catalog.
step of the larger data science process. If data scientists are spending more time on
feature engineering, they in turn have less time to spend on other aspects of creating
an end-to-end modeling solution.
These points raise the question, how can we make it easier to buildML systems in
practical settings? A new approach is needed to designing and developing software
systems that solve specific ML tasks. Such an approach should address a wide variety
of input data modalities, such as images, text, audio, signals, tables, and graphs; and
many learning problem types, such as regression, classification, clustering, anomaly
detection, community detection, and graph matching; it should cover the intermediate
stages involved, such as data preprocessing, munging, featurization, modeling, and
evaluation; and it should fine-tune solutions through AutoML functionality, such as
hyperparameter tuning and algorithm selection. Moreover, it should offer coherent
APIs, fast iteration on ideas, and easy integration of new ML innovations. Combining
these elements would allow almost all end-to-end learning problems to be solved or
built using a single ambitious framework.
To address these challenges, we present the Machine Learning Bazaar,1 a frame-1Just as one open-source community was described as “a great babbling bazaar of different agen-
113

work for designing and developing ML and AutoML systems. We organize the ML
ecosystem into composable software components, ranging from basic building blocks
like individual classifiers, to feature engineering pipelines creating using Ballet, to full
AutoML systems. With our design, a user specifies a task, provides a raw dataset, and
either composes an end-to-end pipeline out of pre-existing, annotated, ML primitives
or requests a curated pipeline for their task (Figure 6.1). The resulting pipelines can
be easily evaluated and deployed across a variety of software and hardware settings,
and tuned using a hierarchy of AutoML approaches. Using our own framework, we
have created an AutoML system which we entered into DARPA’s Data-Driven Dis-
covery of Models (D3M) program; ours was the first end-to-end, modular, publicly
released system designed to meet the program’s goal.
As an example of what can be developed using our framework, we highlight the
Orion project, an MIT-based endeavor that tackles anomaly detection in the field of
satellite telemetry (Figure 6.2), as one of several successful real-world applications
that use ML Bazaar for effective ML system development (Section 7.1). The Orion
pipeline processes a telemetry signal using several custom preprocessors, an LSTM
predictor, and a dynamic thresholding postprocessor to identify anomalies. The en-
tire pipeline can be represented by a short Python snippet. Custom processing steps
are easily implemented as modular components, two external libraries are integrated
without glue code, and the pipeline can be tuned using composable AutoML func-
tionality.
Contributions in this chapter include:
A composable framework for representing and developing ML and AutoML systems.
Our framework enables users to specify a pipeline for any ML task, from image
classification to graph matching, through a unified API (Sections 6.2 and 6.3).
The first general-purpose automated machine learning system. Our system, Auto-
Bazaar, is to the best of our knowledge the first open-source, publicly-available sys-
das and approaches” (Raymond, 1999), our framework is characterized by the availability of manycompatible alternatives, a wide variety of libraries and custom solutions, a space for new contribu-tions, and more.
114

tem with the ability to reliably compose end-to-end, automatically-tuned solutions
for 15 data modalities and problem types (Section 6.4.1).
Industry applications. We describe 5 successful applications of our framework to
real-world problems (Section 7.1).
A comprehensive evaluation. We evaluated our AutoML system against a suite of
456 ML tasks/datasets covering 15 ML task types, and analyzed 2.5 million scored
pipelines (Section 7.2).
primitives = ['mlprimitives.custom.ts_preprocessing.time_segments_average','sklearn.impute.SimpleImputer','sklearn.preprocessing.MinMaxScaler','mlprimitives.custom.ts_preprocessing.rolling_window_sequences','keras.Sequential.LSTMTimeSeriesRegressor','mlprimitives.custom.ts_anomalies.regression_errors','mlprimitives.custom.ts_anomalies.find_anomalies',
]
options = {'init_params': {
'mlprimitives.custom.ts_preprocessing.time_segments_average#1': {'time_column': 'timestamp','interval': 21600,
},'sklearn.preprocessing.MinMaxScaler#1': {'feature_range': [-1, 1]},'mlprimitives.custom.ts_preprocessing.rolling_window_sequences#1': {
'target_column': 0,'window_size': 250,
},'keras.Sequential.LSTMTimeSeriesRegressor': {'epochs': 35},
},'input_names': {
'mlprimitives.custom.ts_anomalies.find_anomalies#1': {'index': 'target_index'
},},'output_names': {
'keras.Sequential.LSTMTimeSeriesRegressor#1': {'y': 'y_hat'},},
}
(a) Python representation.
115

X
X
X
X
X
y
y
errors
index
indexy
UniqueCounter
TextCleaner
VocabularyCounter
time_segments_average
rolling_window_sequences
LSTMTimeSeriesRegressor
regression_errors
SimpleImputer
find_anomalies
MinMaxScaler
SequencePadder
LSTMText
Classifier
Tokenizer
X
X
X
yX
y
vocabularysize
classes
y
X
MLPipeline([ 'UniqueCounter', 'TextCleaner', 'VocabularyCounter', 'Tokenizer', 'SequencePadder', 'LSTMTextClassifier'])
MLPipeline([ 'time_segments_average', 'SimpleImputer', 'MinMaxScaler', 'rolling_window_sequences', 'LSTMTimeSeriesRegressor' 'regression_errors', 'find_anomalies'])
(b) Graph representation.
from mlblocks import MLPipelinefrom orion.data import load_signalfrom orion.pipelines.lstm_dt import
primitives, options→˓
train = load_signal('S-1-train')test = load_signal('S-1-test')
ppl = MLPipeline(primitives, **options)ppl.fit(train)anomalies = ppl.predict(test)
(c) Usage with Python SDK.
Figure 6.2: Representation and usage of the Orion pipeline for anomaly detectionusing the ML Bazaar framework. ML system developers or researchers describe thepipeline in a short Python snippet by a sequence of primitives annotated from severallibraries (and optional additional parameters). Our framework compiles this into agraph representation (Section 6.2.2) by consulting meta-information associated withthe underlying primitives (Section 6.2.1). Developers can then use our Python SDKto train the pipeline on “normal” signals, and identify anomalies in test signals. TheMLPipeline provides a familiar interface but enables more general data engineering andML processing. It also can expose the entire underlying hyperparameter configurationspace for tuning by our AutoML libraries or others (Section 6.3).
Open-source libraries. Components of our framework have been released as the open-
source libraries MLPrimitives, MLBlocks, BTB, piex, and AutoBazaar.
6.2 A framework for machine learning pipelines
The ML Bazaar is a composable framework for developing ML and AutoML systems
based on a hierarchical organization of and unified API for the ecosystem of ML
116

software and algorithms. It is possible to use curated or custom software components
for every aspect of the practical ML process, from featurizers for relational datasets to
signal processing transformers to neural networks to pre-trained embeddings. From
these primitives, data scientists can easily and efficiently construct ML solutions for a
variety of ML task types, and ultimately automate much of the work of tuning these
models.
6.2.1 ML primitives
A primitive is a reusable, self-contained software component for ML paired with the
structured annotation of its metadata. It has a well-defined fit/produce interface,
wherein it receives input data in one of several formats or types, performs computa-
tions, and returns the data in another format or type. With this categorization and
abstraction, the widely varying functionalities required to construct ML pipelines can
be collected in a single location. Primitives can be reused in chained computations
while minimizing glue code written by callers. Example primitive annotations are
shown in Figures 6.3 and 6.4.
Primitives encapsulate different types of functionality. Many have a learning com-
ponent, such as a random forest classifier. Some, categorized as transformers, may
only have a produce method, but are very important nonetheless. For example, the
Hilbert and Hadamard transforms from signal processing would be important primi-
tives to include while building an ML system to solve a task in Internet-of-Things.
Some primitives do not change values in the data, but simply prepare or reshape
it. These glue primitives are intended to reduce the glue code that would otherwise be
required to connect primitives into a full system. An example of this type of primitive
is pandas.DataFrame.unstack.
Annotations
Each primitive is annotated with machine-readable metadata that enables it to be
used and automatically integrated within an execution engine. Annotations allow us
117

{"name": "cv2.GaussianBlur","contributors": [
"Carles Sala <[email protected]>"],"description": "Blur an image using a Gaussian filter.","classifiers":
{"type": "preprocessor", "subtype": "transformer"},"modalities": ["image"],"primitive": "mlprimitives.adapters.cv2.GaussianBlur","produce": {
"args": [{"name": "X", "type": "ndarray"}],"output": [{"name": "X", "type": "ndarray"}]
},"hyperparameters": {
"fixed": {"ksize_width": {"type": "int", "default": 3},"ksize_height": {"type": "int", "default": 3},"sigma_x": {"type": "float", "default": 0.0},"sigma_y": {"type": "float", "default": 0.0}
},"tunable": {}
}}
Figure 6.3: Annotation of the GaussianBlur transformer primitive following the ML-Primitives schema. (Some fields are abbreviated or elided.) This primitive doesnot annotate any tunable hyperparameters, but such a section marks hyperparametertypes, defaults, and feasible values.
to unify a variety of primitives from disparate libraries, reduce the need for glue code,
and provide information about the tunable hyperparameters. This full annotation2
is provided in a single JSON file, and has three major sections:
• Meta-information. This section has the name of the primitive, the fully-qualified
name of the underlying implementation as a Python object, and other detailed
metadata, such as the author, description, documentation URL, categorization,
and what data modalities it is most used for. This information enables searching
and indexing primitives.
• Information required for execution. This section has the names of the methods
pertaining to fit/produce in the underlying implementation, as well as the data2The primitive annotation specification is described and documented in full in the associated
MLPrimitives library.
118

{"name": "ballet.engineer_features","contributors": ["Micah Smith <[email protected]>"],"documentation": "https://ballet.github.io/ballet/mlp_reference
.html#ballet-engineer-features",→˓
"description": "Applies the feature engineering pipeline from the given Balletproject",→˓
"classifiers": {"type": "preprocessor", "subtype": "transformer"},"primitive": "ballet.mlprimitives.make_engineer_features","fit": {
"method": "fit","args": [
{"name": "X", "type": "pandas.DataFrame"},{"name": "y", "type": "pandas.DataFrame"}
]},"produce": {
"method": "transform","args": [{"name": "X", "type": "pandas.DataFrame"}],"output": [{"name": "X", "type": "pandas.DataFrame"}]
},"hyperparameters": {}
}
Figure 6.4: Annotation of the ballet.engineer_features learning primitive followingthe MLPrimitives schema. (Some fields are abbreviated or elided.)
types of the primitive’s inputs and outputs. When applicable, for each primitive,
we annotate the ML data types of declared inputs and outputs; i.e., recurring
objects in ML that have a well-defined semantic meaning, such as a feature
matrix 𝑋, a target vector 𝑦, or a space of class labels classes. We provide
a mapping between ML data types and synonyms used by specific libraries as
necessary. This logical structure will help dramatically decrease the amount of
glue code developers must write (Section 6.2.2).
• Information about hyperparameters. The third section details all the hyper-
parameters of the primitive — their names, descriptions, data types, ranges,
and whether they are tunable or fixed (not appropriate to tune during model
development, such as a parameter indicating how many CPUs/GPUs are avail-
able to use for training). It also captures any conditional dependencies between
hyperparameters.
119

Source Count Source Count
scikit-learn 41 XGBoost 2MLPrimitives (custom) 27 LightFM 1Keras 25 OpenCV 1pandas 17 python-louvain 1Featuretools 4 scikit-image 1NumPy 3 statsmodels 1NetworkX 2
Table 6.1: Primitives in the curated catalog of MLPrimitives, by library source.Catalogs maintained by individual projects may contain more primitives.
We have developed the open-source MLPrimitives3 library, which contains a num-
ber of primitives adapted from different libraries (Table 6.1). For libraries that already
provide a fit/produce interface or similar (e.g., scikit-learn), a primitive developer
has to write the JSON specification and point to the underlying estimator class.
To support the integration of primitives from libraries that need significant adap-
tation to the fit/produce interface, MLPrimitives also provides a powerful set of
adapter modules that assist in wrapping common patterns. These adapter modules
then allow us to integrate many functionalities as primitives from the library with-
out having to write a separate object for each — thus requiring us to write only an
annotation file for each primitive. Keras is an example of such a library.
For developers, domain experts, and researchers, MLPrimitives enables the easy
contribution of new primitives in several ways by providing primitive templates, ex-
ample annotations, and detailed tutorials and documentation. We also provide pro-
cedures for validating proposed primitives against the formal specification and a unit
test suite. Finally, data scientists can also write custom primitives.
Currently, MLPrimitives maintains a curated catalog of high-quality, useful primi-
tives from 13 libraries,4 as well as custom primitives that we have created (Table 6.1).
Each primitive is identified by a fully-qualified name to differentiate primitives across
catalogs. The JSON annotations can then be mined for additional insights.3https://github.com/MLBazaar/MLPrimitives4As of MLPrimitives v0.3.
120

Designing for contributions
We considered multiple alternatives to the primitives API, such as representing all
primitives as Python data structures or classes regardless of their type (i.e., trans-
formers or estimators). One disadvantage of these alternatives is that it makes it more
difficult for domain experts to contribute primitives. We have found that domain ex-
perts, such as engineers and scientists in the satellite industry, prefer writing functions
to other constructs such as classes. We have also found that many domain-specific
processing methods are simply transformers, without a learning component.
Lightweight integration
Another option we considered was to enforce that every primitive — whether brought
over from a library with a compatible API or otherwise — be integrated via a Python
class with wrapper methods. We opted against this approach as it led to excessive
wrapper code and created redundancy, which made it more difficult to write prim-
itives. Instead, for libraries that are compatible, our design only requires that we
create the annotation file.
Language independence
In this work, we focus on the wealth of ML functionality that exists in the Python
ecosystem. Through ML Bazaar ’s careful design, we could also support other com-
mon languages in data science, including R, MATLAB, and Julia, and enable multi-
language pipelines. Starting from our JSON primitive annotation format, a multi-
language pipeline execution backend would be built that uses language-specific kernels
or containers and relies on an interoperable data format such as Apache Arrow. A
language-independent format like JSON provides several additional advantages: It is
both machine- and human- readable and writeable, and it is also a natural format
for storage and querying in NoSQL document stores — allowing developers to easily
query a knowledge base of primitives for the subset appropriate for a specific ML task
type, for example.
121

6.2.2 ML pipelines
To solve practical learning problems, we must be able to instantiate and compose
primitives into usable programs. These programs must be easy to specify with a
natural interface, such that developers can easily compose primitives without sacri-
ficing flexibility. We aim to support end users trying to build an ML solution for
their specific problem who may not be savvy about software engineering, as well as
system developers wrapping individual ML solutions in AutoML components. In ad-
dition, we provide an abstracted execution layer, such that learning, data flow, data
storage, and deployment are handled automatically by various configurable and plug-
gable backends. As one realization of these ideas, we have implemented MLBlocks,5
a library for composing, training, and deploying end-to-end ML pipelines.
from mlblocks import MLPipeline, load_pipelinefrom mlblocks.datasets import load_umls
dataset = load_umls()X_train, X_test, y_train, y_test = dataset.get_splits(1)graph = dataset.graphnode_columns = ['source', 'target']
pipeline = MLPipeline(load_pipeline('graph.link_prediction.nx.xgb'))pipeline.fit(X_train, y_train, graph=graph, node_columns=node_columns)y_pred = pipeline.predict(X_test, graph=graph, node_columns=node_columns)
Figure 6.5: Usage of MLBlocks for a graph link prediction task. Curated pipelines inthe MLPrimitives library can be easily loaded. Pipelines provide a familiar API butenable more general data engineering and ML.
We introduce ML pipelines, which collect multiple primitives into a single compu-
tational graph. Each primitive in the graph is instantiated in a pipeline step, which
loads and interprets the underlying primitive and provides a common interface to run
a step in a larger program.
We define a pipeline as a directed acyclic multigraph 𝐿 = ⟨𝑉,𝐸, 𝜆⟩, where 𝑉 is a
collection of pipeline steps, 𝐸 are the directed edges between steps representing data
flow, and 𝜆 is a joint hyperparameter vector for the underlying primitives. A valid5https://github.com/MLBazaar/MLBlocks
122

pipeline — and its generalizations (Section 6.3.1) — must also satisfy acceptability
constraints that require the inputs to each step to be satisfied by the outputs of
another step connected by a directed edge.
The term “pipeline” is used in the literature to refer to a ML-specific sequence
of operations, and sometimes abused (as we do here) to refer to a more general
computational graph or analysis. In our conception, we bring foundational data
processing operations of raw inputs into this scope, including featurization of graphs,
multi-table relational data, time series, text, and images, as well as simple data
transforms, like encoding integer or string targets. This gives our pipelines a greatly
expanded role, providing solutions to any ML task type and spanning the entire ML
process beginning with the raw dataset.
Pipeline description interface
primitives = ['UniqueCounter','TextCleaner','VocabularyCounter','Tokenizer','SequencePadder','LSTMTextClassifier',
]
(a) Python representation.
UniqueCounter
TextCleaner
VocabularyCounter
SequencePadder
LSTMText
Classifier
Tokenizer
X
X
X
yX
y
vocabularysize
classes
y
X
(b) Graph representation.
Figure 6.6: Recovery of ML computational graph from pipeline description for a textclassification pipeline. The ML data types that enable extraction of the graph, andstand for data flow, are labeled along edges.
Large graph-structured workloads can be difficult to specify for end-users due to
the complexity of the data structure, and such workloads are an active area of research
in data management. In ML Bazaar , we consider three aspects of pipeline representa-
tion: ease of composition, readability, and computational issues. First, we prioritize
123

easy composition of complex ML pipelines by providing a pipeline description inter-
face (PDI) in which developers specify only the topological ordering of all pipeline
steps in the pipeline without requiring any explicit dependency declarations. These
steps can be passed to our libraries as Python data structures or loaded from JSON
files. Full training-time (fit) and inference-time (produce) computational graphs can
then be recovered (Algorithm 2). This is made possible by the meta-information pro-
vided in the primitive annotations, in particular the ML data types of the primitive
inputs and outputs. We leverage the observation that steps that modify the same
ML data type can be grouped into the same subpath. In cases where this information
does not uniquely identify a graph, the user can additionally provide an input-output
map which serves to explicitly add edges to the graph, as well as other parameters to
customize the pipeline.
Though it may be more difficult to read and understand these pipelines from the
PDI alone as the edges are not shown nor labeled, it is easy to accompany them with
the recovered graph representation (Figures 6.2 and 6.6).
The resulting graphs describe abstract computational workloads, but we must
be able to actually execute them for purposes of learning and inference. From the
recovered graphs, we could repurpose many existing data engineering systems as back-
ends for scheduling and executing the workloads (Rocklin, 2015; Zaharia et al., 2016;
Palkar et al., 2018). In our MLBlocks execution engine, a collection of objects and a
metadata tracker in a key-value store are iteratively transformed through sequential
processing of pipeline steps. The Orion pipeline would be executed using MLBlocks
as shown in Figure 6.2c.
6.2.3 Discussion
Why not scikit-learn?
Several alternatives exist to our new ML pipeline abstraction (Section 6.2.2), such as
scikit-learn’s Pipeline (Buitinck et al., 2013). Ultimately, while our pipeline is in-
spired by these alternatives, it aims to provide more general data engineering and ML
124

Algorithm 2: Pipeline-Graph Recoveryinput : pipeline description 𝑆 = (𝑣1, . . . , 𝑣𝑛), source node 𝑣0, sink node 𝑣𝑛+1
output : directed acyclic multigraph ⟨𝑉,𝐸⟩1 𝑆 ← 𝑣0 ∪ 𝑆 ∪ 𝑣𝑛+1
2 𝑉 ← ∅, 𝐸 ← ∅3 𝑈 ← ∅ // unsatisfied inputs4 while 𝑆 ̸= ∅ do5 𝑣 ← popright(𝑆) // last pipeline step remaining6 𝑀 ← popmatches(𝑈, outputs(𝑣))7 if 𝑀 ̸= ∅ then8 𝑉 ← 𝑉 ∪ {𝑣}9 for (𝑣′, 𝜎) ∈𝑀 do
10 𝐸 ← 𝐸 ∪ {(𝑣, 𝑣′, 𝜎)}11 end12 for 𝜎 ∈ inputs(𝑣) do // unsatisfied inputs of 𝑣13 𝑈 ← 𝑈 ∪ {(𝑣, 𝜎)}14 end15 else // isolated node16 return INVALID17 end18 end19 if 𝑈 ̸= ∅ then // unsatisfied inputs remain20 return INVALID21 end22 return ⟨𝑉,𝐸⟩
Figure 6.7: Pipeline steps are added to the graph in reverse order and edges are iter-atively added when the step under consideration produces an output that is requiredby an existing step. Exactly one graph is recovered if a valid graph exists. In caseswhere multiple graphs have the same topological ordering, the user can addition-ally provide an input-output map (which modifies the result of inputs(𝑣)/outputs(𝑣)above) to explicitly add edges and thereby select from among several possible graphs.
functionality. While the scikit-learn pipeline sequentially applies a list of transformers
to 𝑋 and 𝑦 only before outputting a prediction, our pipeline supports general compu-
tational graphs, simultaneously accepts multiple data modalities as input, produces
multiple outputs, manages evolving metadata, and can use software from outside the
scikit-learn ecosystem/design paradigm. For example, we can use our pipeline to
construct entity sets (Kanter and Veeramachaneni, 2015) from multi-table relational
data for input to other pipeline steps. We can also support pipelines in an unsuper-
125

vised learning paradigm, such as in Orion, where we create the target 𝑦 “on-the-fly”
(Figure 6.6).
Where’d the glue go?
To connect learning components from different libraries with incompatible APIs, data
scientists end up writing “glue code.” Typically, this glue code is written within
pipeline bodies. In ML Bazaar , we mitigate the need for this glue by pushing the
need for API adaptation down to the level of primitive annotations, which are writ-
ten once and reside in central locations, amortizing the adaptation cost. Moreover,
the need for glue code arises during data shaping and the creation of intermediate
outputs. We created a number of primitives that support these common program-
ming patterns and miscellaneous needs during the development of an ML pipeline.
These are, for example, data reshaping primitives like pandas.DataFrame.unstack,
data preparation primitives like pad_sequences required for Keras-based LSTMs, and
utilities like UniqueCounter that count the number of unique classes.
Interactive development
Interactivity is an important aspect of data science development for beginners and
experts alike, as they build understanding of the data and iterate on different modeling
ideas. In ML Bazaar , the level of interactivity possible depends on the specific runtime
library. For example, our MLBlocks library supports interactive development in a
shell or notebook environment by allowing for the inspection of intermediate pipeline
outputs and by allowing pipelines to be iteratively expanded starting from a loaded
pipeline description. Alternatively, ML primitives could be used as a backend pipeline
representation for software that provides more advanced interactivity, such as drag-
and-drop. For interfaces that require low latency pipeline scoring to provide user
feedback such as Crotty et al. (2015), ML Bazaar ’s performance depends mainly on
the underlying primitive implementations (Section 7.2).
126

Supporting new task types
While ML Bazaar handles 15 ML task types (Table 7.3), there are many more task
types for which we do not currently provide pipelines in our default catalog (Sec-
tion 7.2.5). To extend our approach to support new task types, it is generally
sufficient to write several new primitive annotations for pre-processing input and
post-processing output — no changes are needed to the core ML Bazaar software li-
braries such as MLPrimitives and MLBlocks. For example, for the anomaly detection
task type from the Orion project, several new simple primitives were implemented:
rolling_window_sequences, regression_errors, and find_anomalies. Indeed, support
for a certain task type is predicated on the availability of a pipeline for that task type
rather than on any characteristics of our software libraries.
Primitive versioning
The default catalog of primitives from the MLPrimitives library is versioned together,
and library conflicts are resolved manually by maintainers through careful specifica-
tion of minimum and maximum dependencies. This strategy ensures that the default
catalog can always be used, even if there are incompatible updates to the underlying
libraries. Automated tools can be integrated to aid both end-users and maintainers
in understanding potential conflicts and safely bumping library-wide versions.
6.3 An automated machine learning framework
From the components of the ML Bazaar , data scientists can easily and effectively
build ML pipelines with fixed hyperparameters for their specific problems. To im-
prove the performance of these solutions, we introduce the more general pipeline tem-
plates and pipeline hypertemplates and then present the design and implementation
of AutoML primitives which facilitate hyperparameter tuning and model selection,
either using our own library for Bayesian optimization or external AutoML libraries.
Finally, we describe AutoBazaar, one specific AutoML system we have built on top
of these components.
127

6.3.1 Pipeline templates and hypertemplates
Frequently, pipelines require hyperparameters to be specified at several places. Un-
less these values are fixed at annotation time, hyperparameters must be exposed in a
machine-friendly interface. This motivates pipeline templates and pipeline hypertem-
plates, which generalize pipelines by allowing a hierarchical tunable hyperparameter
configuration space and provide first-class tuning support.
We define a pipeline template as a directed acyclic multigraph 𝑇 = ⟨𝑉,𝐸,Λ⟩, where
Λ is the joint hyperparameter configuration space for the underlying primitives. By
providing values 𝜆 ∈ Λ for the unset hyperparameters of a pipeline template, a specific
pipeline is created.
In some cases, certain values of hyperparameters can affect the domains of other
hyperparameters. For example, the type of kernel for a support vector machine
results in different kernel hyperparameters, and preprocessors used to adjust for class
imbalance can affect the training procedure of a downstream classifier. We call these
conditional hyperparameters, and accommodate them with pipeline hypertemplates.
We define a pipeline hypertemplate as a directed acyclic multigraph𝐻 = ⟨𝑉,𝐸,⋃︀
𝑗 Λ𝑗⟩,
where 𝑉 is a collection of pipeline steps, 𝐸 are directed edges between steps, and Λ𝑗
is the hyperparameter configuration space for pipeline template 𝑇𝑗. A number of
pipeline templates can be derived from one pipeline hypertemplate by fixing the con-
ditional hyperparameters.
6.3.2 Tuners and selectors
Just as primitives are the components of ML computation, AutoML primitives repre-
sent components of an AutoML system. We separate AutoML primitives into tuners
and selectors. In our extensible AutoML library for developing AutoML systems,
BTB,6 we provide various instances of these AutoML primitives.
Given a pipeline template, an AutoML system must find a specific pipeline with
fully-specified hyperparameter values to maximize some utility. Given pipeline tem-6https://github.com/MLBazaar/BTB
128

plate 𝑇 and a function 𝑓 that assigns a performance score to pipeline 𝐿𝜆 with hyper-
parameters 𝜆 ∈ Λ, the tuning problem is defined as
𝜆* = arg max𝜆∈Λ
𝑓(𝐿𝜆). (6.1)
We introduce tuners, AutoML primitives which provide a record/propose inter-
face in which evaluation results are recorded to the tuner by the user or by an AutoML
controller and new hyperparameters are proposed in return.
Hyperparameter tuning is widely studied and its effective use is instrumental to
maximizing the performance of ML systems (Bergstra et al., 2011; Bergstra and Ben-
gio, 2012; Feurer et al., 2015; Snoek et al., 2012). One widely used approach to hyper-
parameter tuning is Bayesian optimization (BO), a black-box optimization technique
in which expensive evaluations of 𝑓 are kept to a minimum by forming and updating
a meta-model for 𝑓 . At each iteration, the next hyperparameter configuration to
try is chosen according to an acquisition function. We structure these meta-models
and acquisition functions as separate, BO-specific AutoML primitives that can be
combined together to form a tuner. Researchers have argued for different formula-
tions of meta-models and acquisition functions (Oh et al., 2018; Wang et al., 2017;
Snoek et al., 2012). In our BTB library for AutoML, we implement the GP-EI tuner,
which uses a Gaussian Process meta-model primitive and an Expected Improvement
(EI) acquisition function primitive, among several other tuners. Many other tuning
paradigms exist, such as those based on evolutionary strategies (Loshchilov and Hut-
ter, 2016; Olson et al., 2016), adaptive execution (Jamieson and Talwalkar, 2016; Li
et al., 2017), meta-learning (Gomes et al., 2012), or reinforcement learning (Drori
et al., 2018). Though we have not provided implementations of these in BTB, one
could do so using our common API.
For many ML task types, there may be multiple pipeline templates or pipeline
hypertemplates available, each with their own tunable hyperparameters. The aim
is to balance the exploration-exploitation tradeoff while selecting promising pipeline
templates to tune. For a set of pipeline templates 𝒯 , we define the selection problem
129

as
𝑇 * = arg max𝑇∈𝒯
max𝜆𝑇∈Λ𝑇
𝑓(𝐿𝜆𝑇). (6.2)
We introduce selectors, AutoML primitives which provide a compute_rewards/select
API.
Algorithm selection is often treated as a multi-armed bandit problem where the
score returned from a selected template can be assumed to come from an unknown
underlying probability distribution. In BTB, we implement the UCB1 selector, which
uses the upper confidence bound method (Auer et al., 2002), among several other se-
lectors. Users or AutoML controllers can use selectors and tuners together to perform
joint algorithm selection and hyperparameter tuning.
6.4 AutoML systems
6.4.1 AutoBazaar
Using the ML Bazaar framework, we have built AutoBazaar,7 an open-source, end-to-
end, general-purpose, multi-task, automated machine learning system. It consists of
several components: an AutoML controller; a pipeline execution engine; data stores
for metadata and pipeline evaluation results; loaders and configuration for ML tasks,
primitives, etc.; a Python language client; and a command-line interface. AutoBazaar
is an open-source variant of the AutoML system we have developed for the DARPA
D3M program.
We focus here on the core pipeline search and evaluation algorithms (Algorithm 3).
The input to the search is a computational budget and an ML task, which consists
of the raw data and task and dataset metadata — dataset resources, problem type,
dataset partition specifications, and an evaluation procedure for scoring. Based on
these inputs, AutoBazaar searches through its catalog of primitives and pipeline tem-
plates for the most suitable pipeline that it can build. First, the controller loads the7https://github.com/MLBazaar/AutoBazaar
130

train and test dataset partitions, 𝒟(𝑡𝑟𝑎𝑖𝑛) and 𝒟(𝑡𝑒𝑠𝑡), following the metadata spec-
ifications. Next, it loads from its default catalog and the user’s custom catalog a
collection of candidate pipeline templates suitable for the ML task type. Using the
BTB library, it initializes a UCB1 selector and a collection of GP-EI tuners for joint algo-
rithm selection and hyperparameter tuning. The search process begins and continues
for as long as the computation budget has not been exhausted. In each iteration, the
selector is queried to select a template, the corresponding tuner is queried to propose
a hyperparameter configuration, a pipeline is generated and scored using cross val-
idation over 𝒟(𝑡𝑟𝑎𝑖𝑛), and the score is reported back to the selector and tuner. The
best overall pipeline found during the search, 𝐿*, is re-fit on 𝒟(𝑡𝑟𝑎𝑖𝑛) and scored over
𝒟(𝑡𝑒𝑠𝑡). Its specification is returned to the user alongside the score obtained, 𝑠*.
Algorithm 3: AutoBazaar Pipeline Searchinput : task 𝑡 = (𝑀, 𝑓,𝒟(𝑡𝑟𝑎𝑖𝑛),𝒟(𝑡𝑒𝑠𝑡)), budget 𝐵output : best pipeline 𝐿*, best score 𝑠*
1 𝒯 ← load_available_templates(𝑀)2 A ← init_automl(𝒯 ) // bookkeeping
3 𝑠* ← +∞, 𝐿* ← ∅4 while 𝐵 > 0 do5 𝑇 ← select(𝐴) // uses selector.select6 𝜆← propose(𝐴, 𝑇 ) // uses 𝑇 ’s tuner.propose7 𝐿← (𝑇, 𝜆)
8 𝑠← cross_validate_score(𝑓, 𝐿,𝒟(𝑡𝑟𝑎𝑖𝑛))9 record(A, 𝐿, 𝑠) // update selector and tuners
10 if 𝑠 < 𝑠* then11 𝑠* ← 𝑠, 𝐿* ← 𝐿12 end13 decrease(𝐵)14 end
15 𝑠* ← fit_and_score(𝑓, 𝐿*,𝒟(𝑡𝑟𝑎𝑖𝑛),𝒟(𝑡𝑒𝑠𝑡))16 return 𝐿*, 𝑠*
Figure 6.8: Search and evaluation of pipelines in AutoBazaar. Detailed task metadata𝑀 is used by the system to load relevant pipeline templates and scorer function 𝑓 isused to score pipelines.
131

Chapter 7
Evaluations of ML Bazaar
In this section, we report on evaluating ML Bazaar in two dimensions: real-world
applications of ML Bazaar and extensive experimentation on a benchmark corpus.
7.1 Applications
In Chapter 6, we claimed that ML Bazaar makes it easier to develop ML systems.
We now provide evidence for this claim in this section by describing 5 real-world
use cases in which ML Bazaar is currently used to create both ML and AutoML
systems. Through these industrial applications we examine the following questions:
Does ML Bazaar support the needs of ML system developers? If not, how easy was
it to extend?
7.1.1 Anomaly detection for satellite telemetry
ML Bazaar is used by a communications satellite operator which provides video and
data connectivity globally. This company wanted to monitor more than 10,000 teleme-
try signals from their satellites and identify anomalies, which might indicate a looming
failure severely affecting the satellite’s coverage. This time series/anomaly detection
task was not initially supported by any of the pipelines in our curated catalog. Our
collaborators were able to easily implement a recently developed end-to-end anomaly
132

detection method (Hundman et al., 2018) using pre-existing transformation primitives
in ML Bazaar and by adding several new primitives: a primitive for the specific LSTM
architecture used in the paper and new time series anomaly detection postprocessing
primitives, which take as input a time series and time series forecast, and produce as
output a list of anomalies, identified by intervals {[𝑡𝑖, 𝑡𝑖+1]}. This design enabled rapid
experimentation through substituting different time series forecasting primitives and
comparing the results. In subsequent work, they develop a new GAN-based anomaly
detection model as an ML primitive (orion.primitives.tadgan.TadGAN) and evaluate
it within the anomaly detection pipeline on 11 datasets (Geiger et al., 2020). The
work has been released as the open-source Orion project.1
7.1.2 Predicting clinical outcomes from electronic health records
Cardea is an open-source, automated framework for predictive modeling in health
care on electronic health records following the FHIR schema (Alnegheimish et al.,
2020). Its developers formulated a number of prediction problems including predicting
length of hospital stay, missed appointments, and hospital readmission. All tasks in
Cardea are multitable regression or classification. From ML Bazaar , Cardea uses
the featuretools.dfs primitive to automatically engineer features for this highly-
relational data and multiple other primitives for classification and regression. The
framework also presents examples on a publicly available patient no-show prediction
problem.
7.1.3 Failure prediction in wind turbines
ML Bazaar is also used by a multinational energy utility to predict critical failures and
stoppages in their wind turbines. Most prediction problems here pertain to the time
series classification ML task type. ML Bazaar has several time series classification
pipelines available in its catalog and they enable usage of time series from 140 turbines
to develop multiple pipelines, tune them, and produce prediction results. Multiple1https://github.com/signals-dev/Orion
133

outcomes are predicted, ranging from stoppage and pitch failure to less common
issues, such as gearbox failure. This library is released as the open-source GreenGuard
project.2
7.1.4 Leaks and crack detection in water distribution systems
A global water technology provider uses ML Bazaar for a variety of ML needs, ranging
from image classification for detecting leaks from images, to crack detection from time
series data, to demand forecasting using water meter data. ML Bazaar provides a
unified framework for these disparate needs. The team also builds custom primitives
internally and uses them directly with the MLBlocks backend.
7.1.5 DARPA D3M program
DARPA’s Data-Driven Discovery of Models (D3M) program, of which we are partici-
pants, aims to spur development of automated systems for model discovery for use by
non-experts. Among other goals, participants aim to design and implement AutoML
systems that can produce solutions to arbitrary ML tasks without any human involve-
ment. We used ML Bazaar to create an AutoML system to be evaluated against other
teams from US academic institutions. Participants include ourselves (MIT), CMU,
UC Berkeley, Brown, Stanford, TAMU, and others. Our system relies on AutoML
primitives (Section 6.3) and other features of our framework, but does not use our
primitive and pipeline implementations (neither MLPrimitives nor MLBlocks).
We present results comparing our system against other teams in the program.
DARPA organizes an evaluation every six months (Winter and Summer). During
evaluation, AutoML systems submitted by participants are run by DARPA on 95
tasks spanning several task types for three hours per task. At the end of the run,
the best pipeline identified by the AutoML system is evaluated on held-out test data.
Results are also compared against two independently-developed expert baselines (MIT
Lincoln Laboratory and Exline).2https://github.com/signals-dev/GreenGuard
134

System Top pipeline Beats Expert 1 Beats Expert 2 Rank
System 1 29 57 31 1ML Bazaar 18 56 28 2System 3 15 47 22 3System 4 14 46 21 4System 5 10 42 14 5System 6 8 43 15 6System 7 8 33 12 7System 8 6 24 11 8System 9 4 25 13 9System 10 2 27 12 10
Table 7.1: Results from the DARPA D3M Summer 2019 evaluation (the latest evalu-ation as of the publication of Smith et al. 2020). Entries represent the number of MLtasks. “Top pipeline” is the number of tasks for which a system created a winningpipeline. “Beats Expert 1” and “Beats Expert 2” are the number of tasks for whicha system beat the two expert team baselines. We highlight Systems 6 and 7 as theybelong to the same teams as Shang et al. (2019) and Drori et al. (2018), respectively.(We are unable to comment on other systems as they have not yet provided publicreports.) Rank is given based on number of top pipeline lines produced. The top 4teams are consistent in their ranking even if a different column is chosen.
Results from one such evaluation from Spring 2018 were presented by
Shang et al. (2019). We make comparisons from the Summer 2019 evaluation, the
results of which were released in August 2019 — the latest evaluation as of the
publication of Smith et al. (2020). Table 7.1 compares our AutoML system against
nine other teams. Given the same tasks and same machine learning primitives, this
comparison highlights the efficacy of the AutoML primitives (BTB) in ML Bazaar
only — it does not provide any evaluation of our other libraries. In its implementation,
our system uses a GP-MAX tuner and a UCB1 selector. Across all metrics, our system
places 2nd out of the 10 teams.
7.1.6 Discussion
Through these applications using the components of the ML Bazaar , several advan-
tages surfaced.
135

Composability
One important aspect of ML Bazaar is that it does not restrict the user to use a
single monolithic system, rather users can pick and choose parts of the framework
they want to use. For example, Orion uses only MLPrimitives/MLBlocks, Cardea
uses MLPrimitives but integrates the hyperopt library for hyperparameter tuning,
our D3M AutoML system submission mainly uses AutoML primitives and BTB, and
AutoBazaar uses every component.
Focus on infrastructure
The ease of developing ML systems for the task at hand freed up time for teams
to think through and design a comprehensive ML infrastructure. In the case of
Orion and GreenGuard, this led to the development of a database that catalogues
the metadata from every ML experiment run using ML Bazaar . This had several
positive effects: it allowed for easy sharing between team members, and it allowed
the company to transfer the knowledge of what worked from one system to another
system. For example, the satellite company plans to use the pipelines that worked on
a previous generation of the satellites on the newer ones from the beginning. With
multiple entities finding uses for such a database, creation of such infrastructure could
be templatized.
Multiple use cases
Our framework allowed the water technology company to solve many different ML
task types using the same framework and API.
Fast experimentation
Once a baseline pipeline has been designed to solve a problem, we notice that users
can quickly shift focus to developing and improving primitives that are responsible
for learning.
136

Production ready
A fitted pipeline maintains all the learned parameters as well as all the data manip-
ulations. A user is able to serialize the pipeline and load it into production. This
reduces the development-to-production lifecycle.
7.2 Experimental evaluation
In this section, we experimentally evaluate ML Bazaar along several dimensions. We
also leverage our evaluation results to perform several case studies in which we show
how a general-purpose evaluation setting can be used to assess the value of specific
ML and AutoML primitives.
7.2.1 ML task suite
The ML Bazaar Task Suite is a comprehensive corpus of tasks and datasets to be
used for evaluation, experimentation, and diagnostics. It consists of 456 ML tasks
spanning 15 task types. Tasks, which encompass raw datasets and annotated task
descriptions, are assembled from a variety of sources, including MIT Lincoln Labo-
ratory, Kaggle, OpenML, Quandl, and Crowdflower. We create train/test splits and
organize the folder structure, but otherwise do no preprocessing (sampling, outlier
detection, imputation, featurization, scaling, encoding, etc.), instead presenting data
in its raw form as it would be ingested by end-to-end pipelines. Our publicly avail-
able task suite can be browsed online3 or through piex,4 our library for exploration
and meta-analysis of ML tasks and pipelines. The covered task types are shown in
Table 7.3 and a summary of the tasks is shown in Table 7.2.
We made every effort to curate a corpus that was evenly balanced across ML
task types. Unfortunately, in practice, available datasets are heavily skewed toward
traditional ML problems of single-table classification, and our task suite reflects this
deficiency, although 49% of our tasks are not single-table classification. Indeed, among3https://mlbazaar.github.io4https://github.com/MLBazaar/piex
137

min p25 p50 p75 max
Number of examples 7 202 599 3,634 6,095,521Number of classes† 2 2 3 6 115Columns of 𝑋 1 3 9 22 10,937Size (compressed) 3KiB 21KiB 145KiB 2MiB 36GiBSize (inflated) 22KiB 117KiB 643KiB 7MiB 42GiB
Table 7.2: Summary of tasks in ML Bazaar Task Suite (n=456). †for classificationtasks
other evaluation suites, the OpenML 100 and the AutoML Benchmark (Bischl et al.,
2019; Gijsbers et al., 2019) are both exclusively comprised of single-table classifica-
tion problems. Similarly, evaluation approaches for AutoML methods usually target
the black-box optimization aspect in isolation (Golovin et al., 2017; Guyon et al.,
2015; Dewancker et al., 2016) without considering the larger context of an end-to-end
pipeline.
7.2.2 Pipeline search
We run the search process for all tasks in parallel on a heterogenous cluster of 400
AWS EC2 nodes. Each ML task is solved independently on a node of its own over a
2-hour time limit. Metadata and fine-grained details about every pipeline evaluated
are stored in a MongoDB document store. After checkpoints at 10, 30, 60, and 120
minutes of search, the best pipelines for each task are selected by considering the
cross-validation score on the training set and are then re-scored on the held-out test
set.5
7.2.3 Computational bottlenecks
We first evaluate the computational bottlenecks of the AutoBazaar system. To assess
these, we instrument AutoBazaar and our framework libraries (MLBlocks, MLPrimi-
tives, BTB) to determine what portion of overall execution time for pipeline search is5Exact replication files and detailed instructions for the experiments in this section are included
here: https://github.com/micahjsmith/ml-bazaar-2019 and can be further analyzed using ourpiex library.
138

Data Modality Problem Type Tasks Pipeline Template
graph community detection 2 CommunityBestPartition
graph matching 9 link_prediction_feat_extr graph_feat_extr
CategoricalEncoder SimpleImputer StandardScaler
XGBClassifier
link prediction 1 link_prediction_feature_extraction CategoricalEncoder
SimpleImputer StandardScaler XGBClassifier
vertex nomination 1 graph_feature_extraction categorical_encoder
SimpleImputer StandardScaler XGBClassifier
image classification 5 ClassEncoder preprocess_input MobileNet XGBClassifier
ClassDecoder
regression 1 preprocess_input MobileNet XGBRegressor
multi table classification 6 ClassEncoder dfs SimpleImputer StandardScaler
XGBClassifier ClassDecoder
regression 7 dfs SimpleImputer StandardScaler XGBRegressor
single table classification 234 ClassEncoder dfs SimpleImputer StandardScaler
XGBClassifier ClassDecoder
collaborative filtering 4 dfs LightFM
regression 87 dfs SimpleImputer StandardScaler XGBRegressor
timeseries forecasting 35 dfs SimpleImputer StandardScaler XGBRegressor
text classification 18 UniqueCounter TextCleaner VocabularyCounter Tokenizerpad_sequences LSTMTextClassifier
regression 9 StringVectorizer SimpleImputer XGBRegressor
timeseries classification 37 ClassEncoder dfs StandardImputer StandardScaler
XGBClassifier ClassDecoder
Table 7.3: ML task types (data modality and problem type pairs) and associatedML tasks counts in the ML Bazaar Task Suite, along with default templates fromAutoBazaar (i.e., where we have curated appropriate pipeline templates to solve atask).
due to our runtime libraries vs. other factors such as I/O and underlying component
implementation. The results are shown in Figure 7.1. Overall, the vast majority of ex-
ecution time is due to execution of the underlying primitives (p25=90.2%, p50=96.2%,
p75=98.3%). A smaller portion is due to the AutoBazaar runtime (p50=3.1%) and
a negligible (p50<0.1%) portion of execution time is due to our other framework li-
braries and I/O. Thus, performance of pipeline execution/search is largely limited by
the performance of the underlying physical implementation from the external library.
139

ABZ I/O MLB MLB Ext. BTB BTB Ext.0
20
40
60
80
100E
xecu
tion
time
(% o
f tot
al)
Figure 7.1: Execution time of AutoBazaar pipeline search attributable to differentlibraries/components. The box plot shows quartiles of the distribution, 1.5× IQR,and outliers. MLB Ext and BTB Ext refer to calls to external libraries providingunderlying implementations, like the scikit-learn GaussianProcessRegressor used inthe GP-EI tuner. The vast majority of execution time is attributed to the underlyingprimitives implemented in external libraries.
7.2.4 AutoML performance
One important attribute of AutoBazaar is the ability to improve pipelines for different
tasks through tuning and selection. We measure the improvement in the best pipeline
per task, finding that the average task improves its best score by 1.06 standard
deviations over the course of tuning, and that 31.7% of tasks improve by more than
one standard deviation (Figure 7.2). This demonstrates the effectiveness that a user
may expect to obtain from an AutoBazaar pipeline search. However, as we describe
in Section 6.3, there are so many AutoML primitives that can be implemented using
our tuner/selector APIs that a comprehensive comparison is beyond the scope of this
work.
7.2.5 Expressiveness of ML Bazaar
To further examine the expressiveness of ML Bazaar in solving a wide variety of
tasks, we randomly selected 23 Kaggle competitions from 2018, comprising tasks
ranging from image and time series classification to object detection and multi-table
140

0 1 2 3 4 5standard deviations
0.0
0.5
1.0
dens
ity
Figure 7.2: Distribution of task performance improvement due to ML Bazaar Au-toML. Improvement for each task is measured as the score of the best pipeline less thescore of the initial default pipeline, in standard deviations of all pipelines evaluatedfor that task.
regression. For each task, we attempted to develop a solution using existing primitives
and catalogs.
Overall, we were able to immediately solve 11 tasks. While we did not support
four task types — image matching (two tasks), object detection within images (four
tasks), multi-label classification (one task), and video classification (one task) — we
could readily support these within our framework by developing new primitives and
pipelines. For these tasks, multiple data modalities were provided to participants (i.e.,
some combination of image, text, and tabular data). To support these tasks, we would
need to develop a new “glue” primitive that could concatenate separately-featurized
data from each resource to create a single feature matrix. Though our evaluation suite
contains many examples of tasks with multiple data resources of different modalities,
we had written pipelines customized to operate on certain common subsets (i.e.,
tabular + graph). While we cannot expect to have already implemented pipelines
that can work with the innumerable diversity of ML task types, the flexibility of our
framework means that we can write new primitives and pipelines that allow it to solve
these problems.
7.2.6 Case study: evaluating ML primitives
When new primitives are contributed by the ML community, they can be incorporated
into pipeline templates and pipeline hypertemplates, either to replace similar pipeline
141

steps or to form the basis of new topologies. By running the end-to-end system on
our evaluation suite, we can assess the impact of the primitive on general-purpose
ML workloads (rather than overfit baselines).
In this first case study, we compare two similar primitives: annotations for the
XGBoost (XGB) and random forest (RF) classifiers. We ran two experiments, one in
which RF is used in pipeline templates and one in which XGB is substituted instead.
We consider 1.86× 10⁶ relevant pipelines to determine the best scores produced for
367 tasks. We find that the XGB pipelines substantially outperformed the RF pipelines,
winning 64.9% of the comparisons. This confirms the experience of practitioners, who
widely report that XGBoost is one of the most powerful ML methods for classification
and regression.
7.2.7 Case study: evaluating AutoML primitives
The design of the ML Bazaar AutoML system and our extensive evaluation corpus
allows us to easily swap in new AutoML primitives (Section 6.3.2) to see to what
extent changes in components like tuners and selectors can improve performance in
general settings.
In this case study, we revisit Snoek et al. (2012), which was influential for bringing
about widespread use of Bayesian optimization for tuning ML models in practice.
Their contributions include: (C1) proposing the usage of the Matérn 5/2 kernel for
tuner meta-model, (C2) describing an integrated acquisition function that integrates
over uncertainty in the GP hyperparameters, (C3) incorporating a cost model into
an EI per second acquisition function, and (C4) explicitly modeling pending parallel
trials. How important was each of these contributions to the resulting tuner?
Using ML Bazaar , we show how a more thorough ablation study (Lipton and
Steinhardt, 2019), not present in Snoek et al. (2012), would be conducted to address
these questions, by assessing the performance of our general-purpose AutoML system
using different combinations of these four contributions. Here we focus on contribution
C1. We run experiments using a baseline tuner with a squared exponential kernel
(GP-SE-EI) and compare it with a tuner using the Matérn 5/2 kernel (GP-Matern52-EI).
142

In both cases, kernel hyperparameters are set by optimizing the marginal likelihood.
In this way, we can isolate the contributions of the proposed kernel in the context of
general-purpose ML workloads.
In total, 4.31× 10⁵ pipelines were evaluated to find the best pipelines for a subset
of 414 tasks. We find that no improvement comes from using the Matérn 5/2 kernel
over the SE kernel — in fact, the GP-SE-EI tuner outperforms, winning 60.1% of the
comparisons. One possible explanation for this negative result is that the Matérn
kernel is sensitive to hyperparameters which are set more effectively by optimization
of the integrated acquisition function. This is supported by the overperformance of
the tuner using the integrated acquisition function in the original work; however, the
integrated acquisition function is not tested with the baseline SE kernel, and more
study is needed.
143

Part III
Looking forward
144

Chapter 8
Putting the pieces together:
collaborative, open-source, and
automated data science for the
Fragile Families Challenge
8.1 Introduction
The Fragile Families Challenge (Section 2.7) aimed to prompt the development of
predictive models for life outcomes from detailed longitudinal data on a set of dis-
advantaged children and their families. Organizers released anonymized and merged
data on a set of 4,242 families with data collected from the birth of the child until age
nine. Participants in the challenge were then tasked with predicting six life outcomes
of the child or family at age 15: child grade point average, child grit, household evic-
tion, household material hardship, primary caregiver layoff, and primary caregiver
participation in job training.
The FFC was run over a four-month period in 2017, and received 160 submissions
from social scientists, machine learning practitioners, students, and others. Unfor-
tunately, despite the massive effort to design the challenge and develop predictive
145

models, organizers concluded that “even the best predictions were not very accurate”
and that “the best submissions [...] were only somewhat better than the results from
a simple benchmark model [...] with four predictor variables selected by a domain
expert” (Salganik et al., 2020). Much of this disappointing performance may be due
to an inherent unpredictability of outcomes six years into the future. Indeed, it may
even be encouraging, in the sense that the measured factors of young children’s lives
may not predetermine their futures or those of their families.
One limitation of the FFC was that the dataset required extensive data prepara-
tion and feature engineering in order to be suitable for ML modeling. Overall, 12,942
variables were released in the background data, and 73% of all values were missing
(Salganik et al., 2019). Given the nature of the challenge, the small teams that were
competing were ill-equipped to handle the data preparation necessary. Participants
generally addressed this in one of two ways. First, some teams expended extensive
effort on manually preparing the data, often at the expense of experimenting with
different modeling techniques. Many such teams duplicated or approximated work
done by other teams working independently. Second, many teams used simple auto-
mated techniques to arrive at a small set of reasonably clean features. This had the
effect of losing out on potentially highly predictive information.
Considering the design and results of the FFC, I ask two questions. First, what
would it take to enable collaboration rather than competition in predictive modelling?
Second, would new ML development tools and methodologies increase the impact of
data science on societal problems? Rather than working independently, the 160 teams
could have pooled their resources to carefully and deliberately prepare the data for
analysis in a single data preparation pipeline, while exploring a larger range of manual
and automated modeling choices.
In this chapter, we describe a novel collaborative approach to solving the Fragile
Families Challenge using the tools of Ballet and ML Bazaar that were presented earlier
in this thesis. In our approach, a group of data scientists works closely together to
create feature definitions to process the challenge dataset. We embed our shared
feature engineering pipeline within an ML pipeline that is tuned automatically. As a
146

result, the human effort involved in our approach is overwhelmingly spent on feature
engineering.
8.2 Collaborative modeling
8.2.1 Methods
We created an open-source project using Ballet, predict-life-outcomes ,1 to produce a
feature engineering pipeline and predictive model for life outcomes.
Dataset
We use the exact dataset used in the FFC, which is archived by Princeton’s Office
of Population Research. Researchers can request access to the challenge dataset,
agreeing to a data access agreement that protects the privacy of the individuals in
the FFCWS.
The challenge dataset contains a “background” table of 4,242 rows (one per child
in the training set) and 12,942 columns (variables). The “train” split contains 2,121
rows (half of the background set), the “leaderboard” split contains 530 rows, and
the “test” split contains 1,591 rows. The background variables represent responses
to survey questions asked over five “waves”: collected in the hospital at the child’s
birth, and collected at approximately age one, three, five, and nine of the child. Each
wave includes questions asked to different sets of individuals, including the mother,
the father, the primary caregiver, the child themselves, a childcare provider, the
kindergarten teacher, and the elementary school teacher.
Each split contains the full set of variables plus six prediction targets, which are
constructed from survey questions asked during the age 15 survey:
1. Grit. Grit is a measure of passion and perseverance of the child on a scale from
1–4. It is constructed from the child’s responses to four survey questions, such
as whether they agree that they are a hard worker.1https://github.com/ballet/predict-life-outcomes
147

2. GPA. Grade point average (GPA) is a measure of academic achievement of the
child on a scale from 1.0–4.0, according to the self-reported grades earned by
the child in their most recent grading period in four subjects.
3. Material hardship. Material hardship is a measure of extreme poverty of the
family on a scale from 0–1. It is constructed from answers to 11 survey ques-
tions about topics like food insecurity and difficulty paying rent. The number
of different ways in which the family experienced hardship are summed and
rescaled to the unit interval.
4. Eviction. Eviction is an outcome in which a family is forced from their home due
to nonpayment of rent or mortgage. This prediction target measures whether
the family had been evicted at any point in the six year period between the age
nine interview and the age 15 interview.
5. Layoff. Layoff is an indicator of whether the family’s primary caregiver was
laid off from their job at any point in the six year period. Those who had not
worked in that time period were coded as missing.
6. Job training. Job training is an indicator for whether the primary caregiver
had taken any job training in the six year period, such as computer training or
literacy classes.
Unlike in many machine learning challenges — but very much like in real-world
data science problems — the targets themselves contain many missing values. For the
purpose of validating feature contributions to this project with a supervised feature
validator, we focus on the Material Hardship prediction problem. However, we want
our feature definitions to be useful for all six problems.
While Ballet’s default ML performance validator uses the SFDS algorithm (Sec-
tion 3.5.3), in this problem we use a different validator that combines two different
feature filtering techniques. The first is a variance threshold filter that ensures that
the variance of given feature values is above a threshold. (If the feature is vector-
valued, then each feature value must exceed the threshold individually.) The second
148

is a mutual information-based filter that ensures that the mutual information of the
feature values with the target is above a threshold. A candidate feature must pass
both filters to be accepted.
Collaborators
Collaborators were recruited to join the project from a variety of sources. First,
we contacted data scientists who had previously participated in a Ballet project,
such as the predict-census-income project. Second, we asked additional personal and
professional contacts. Third, we reached out to researchers who had competed in the
original Fragile Families Challenge in 2017. Importantly, this last set of people had
already been granted access to the dataset as part of their original entry and already
had strong familiarity with the data.
Collaborators who had not previously worked with the data were asked to apply for
data access with Princeton’s Office of Population Research. Once access was granted,
we generated a unique keypair for each collaborator that would allow collaborators
to securely download our copy of the data from secure cloud storage. This copy of
the data was identical to the official challenge dataset except that we had split the
background table into separate tables corresponding to the train, leaderboard, and
test sets. We also restricted access to the leaderboard and test targets. This removed
the ability to develop on these held-out datasets and ensured fair comparison with
the original competition results.
8.2.2 Feature development
Data scientists collaborating on the project developed features in an iterative process
following the workflow described in Section 3.3.2 and Fig. 3.1. After first obtaining
access to the data, data scientists were next provided with documentation and tutorial
materials describing how to contribute to a Ballet project, how to use Ballet’s feature
engineering language (Section 3.4), and the background and data details of the FFC.
Once they were comfortable with this material, they could browse the set of existing
149

features contributed by their collaborators.
Finally, data scientists were ready to begin developing features. They could choose
their own development environment, with Assemblé being a typical choice. They
could then step through a notebook-based guide that introduced the use of different
API methods to load the dataset, search the metadata repository, discover existing
features, and validate a new feature. In this environment, they could write and submit
new feature definitions to the shared repository.
Two feature definitions created through this collaboration are shown in Figures 8.1
and 8.2. These features are typical of the features in the project, and show the
extensive manipulations required to produce even a single feature definition from
such a complex dataset. We can see how:
• The input column names are identified by highly-abbreviated, inscrutable codes
that must be interpreted using a codebook or metadata API.
• Categorical input columns have multiple levels, identified by negative numbers
that indicate different kinds of missingness.
• Some missing values can be imputed using simple strategies.
• Many columns can be combined together using simple arithmetic operations.
• Many features use complex transformations even if they do not have any learned
parameters.
• Detailed metadata, such as a short name, a longer human-readable description,
and the exact provenance of the feature values, can be extracted programmati-
cally from the feature definition.
In Sections 4.3.1 and 5.1, we discussed how the theme of distribution of work
emerged from our analysis of the predict-census-income case study. Given the scale
of the variable space in the FFC, we propose and implement one solution to the dis-
tribution of work problem by introducing the idea of feature development partitions.
150

from ballet import Featurefrom ballet.eng import NullFillerimport numpy as np
input = ["cm1hhinc", "cm2hhinc", "cm3hhinc", "cm4hhinc", "cm5hhinc", "m4f3a"]transformer = [
("m4f3a", lambda x: np.where(x < 0, 1, x)), # impute unanswered with 1# average income in all waves(
["cm1hhinc", "cm2hhinc", "cm3hhinc", "cm4hhinc", "cm5hhinc"],lambda df: df.where(df>0, np.nan).mean(axis=1),"income",
),NullFiller(0),lambda x: x["income"] / x["m4f3a"], # ratio
]name = "HH income ratio"description = "the ratio of household (HH) income by the number of people in HH
surveyed in wave 4"→˓
feature = Feature(input, transformer, name=name, description=description)
Figure 8.1: A feature definition for the predict-life-outcomes project that computesthe household income ratio (total household income per member of the household)for each family.
A feature development partition describes a subset of variables for a data scientist to
focus on while developing feature definitions for a project.
In this project, we allow any collaborator to propose a new feature development
partition as a ticket (i.e., GitHub Issue) on the shared repository that follows a
certain structure. The partition has a name, a specification of the variables that
comprise it, and any helpful background about the variables or why this partition is
promising for development. While the variable specification can be expressed in any
language, including natural language, specifications are usually written in Python
for convenience, such that a collaborator working on the partition can get started
quickly by running the snippet to access the full variable list in their development
environment. Any collaborator, including the one who proposed the partition, can
comment on the discussion thread to “claim” the partition, indicating that they are
working on it. Multiple data scientists who claim the same partition can communicate
with each other directly or follow each other’s work. A stylized partition is shown in
Figure 8.3.
151

from ballet import Featurefrom ballet.eng.external import SimpleImputer
input = ["cf1edu", "cm1edu"]transformer = [
lambda df: df.max(axis=1),lambda df: df >= 4,SimpleImputer(strategy="mean"),
]name = "college-educated parents"description = "Whether the father or the mother has a degree of college education
or above in wave 1."→˓
feature = Feature(input, transformer, name=name, description=description)
Figure 8.2: A feature definition for the predict-life-outcomes project that computeswhether either of the parents of the child had a college degree as of the child’s birth.
8.2.3 Automated modeling
Our collaboratively developed feature engineering pipeline is embedded within a larger
ML pipeline that can be automatically tuned. To do this, we use the ML Bazaar
framework in three ways.
First, we create several ML primitives to annotate components in the project.
The feature engineering pipeline is annotated in the ballet.engineer_features prim-
itives. The target encoder is annotated in the ballet.encode_target primitive (which
is further modified in the fragile_families.encode_target primitive with an argu-
ment indicating which prediction target is being considered). Then, the additional
primitive ballet.drop_missing_targets drops rows with missing targets at runtime,
a necessity given missing targets for some families in the FFC data. We pair these
primitives with existing primitives from the MLPrimitives catalog that define addi-
tional preprocessing steps and estimators, such as sklearn.linear_model.ElasticNet
and xgboost.XGBRegressor.
Second, we create multiple pipeline templates (Section 6.3.1) that connect the
feature engineering pipeline with different estimators. The pipeline templates are
shown in Table 8.1. In this case, we also encode the prediction target (i.e. select
a single target at a time from the set of six life outcomes) and drop rows in which
the target value is missing. For classification targets, we design pipelines that output
152

[PARTITION] Kindergarten teacher #7Open
feature-partition
Name Kingergarten teacher
Specification Variables corresponding to the kindergarten teacher’s responses.
Background The kindergarten teacher is surveyed in Wave 4, when the child is about 5 years old…
from fragile_families.load_data import load_codebookcodebook = load_codebook()codebook.loc[ codebook['name'].str.startswith('kind_'), 'name']
Figure 8.3: A stylized feature development partition for the predict-life-outcomesproject. This partition proposes focusing effort on the subset of variables that rep-resent responses by the kindergarten teacher of the child in Wave 4 (when they werefive years old). The specification of the partition is a code snippet that outputs theexact variable names.
the predicted probability of the positive class (rather than the most likely class, see
Section 8.2.4).
Third, we use the AutoBazaar search algorithm (Algorithm 3) to automatically
select from among the pipeline templates and tune hyperparameters in a given ML
pipeline. Recall that AutoBazaar uses the BTB library (Section 6.4.1) for its search,
and here we use BTB’s UCB1 selector, which uses the upper-confidence bound bandit
algorithm, and GCP-MAX tuner, which uses a Gaussian copula process meta-model and
a predicted score acquisition function.
We ran the AutoML search procedure over our set of pipeline templates for 500
iterations for each of the six targets. We selected the ML pipeline that performed
the best on the held-out leaderboard set. We then used the test set to evaluate the
best-performing pipeline for each prediction target and pipeline template pair.
153

Name Reg Clf Pipeline Template
ballet-elasticnet ! ! ballet.engineer_features fragile_families.encode_target
ballet.drop_missing_targets sklearn.linear_model.ElasticNet
ballet-randomforest ! ballet.engineer_features fragile_families.encode_target
ballet.drop_missing_targets
sklearn.ensemble.RandomForestRegressor
ballet-randomforest-proba ! ballet.engineer_features fragile_families.encode_target
ballet.drop_missing_targets
sklearn.ensemble.RandomForestClassifier
fragile_families.squeeze_predicted_probabilities
ballet-knn ! ballet.engineer_features fragile_families.encode_target
ballet.drop_missing_targets
sklearn.neighbors.KNeighborsRegressor
ballet-knn-proba ! ballet.engineer_features fragile_families.encode_target
ballet.drop_missing_targets
sklearn.neighbors.KNeighborsClassifier
fragile_families.squeeze_predicted_probabilities
ballet-xgboost ! ballet.engineer_features fragile_families.encode_target
ballet.drop_missing_targets xgb.XGBRegressor
ballet-xgboost-proba ! ballet.engineer_features fragile_families.encode_target
ballet.drop_missing_targets xgb.XGBClassifier
fragile_families.squeeze_predicted_probabilities
Table 8.1: Pipeline templates used for automated modeling in the predict-life-outcomes project for either regression (Reg) or classification (Clf) targets targets.The difference between regression and classification pipelines is that the classificationpipelines predict the probability of each class and then “squeeze” the predictions toemit the probability of the positive class only.
154

8.2.4 Metrics
We primarily evaluate the predictive performance of our collaborative model against
the performance obtained by entrants to the original FFC in 2017. For comparison
purposes, we use the same metrics defined by the challenge organizers, mean squared
error (MSE) and 𝑅2Holdout. The 𝑅2
Holdout metric is a scaled version of the mean squared
error that accounts for baseline performance:
𝑅2Holdout = 1−
∑︀𝑖∈Holdout(𝑦𝑖 − 𝑦𝑖)2∑︀
𝑖∈Holdout(𝑦𝑖 − 𝑦Train)2(8.1)
A score of 1 indicates a perfect prediction. A score of 0 means that the prediction
is only as good as predicting the mean of the training set, and scores can be arbitrarily
negative indicating worse performance.
Given a predictive probability distribution over outcomes, this metric is optimized
by predicting the mean of the distribution. Thus, in binary classification problems
(Eviction, Job Training, Layoff ), the best performing models according to this eval-
uation metric should emit the predicted probability of the outcome rather than the
class label. This motivates our choice of pipeline templates for classification problems,
in which we choose final estimators that emit the predicted probability according to
the learned classifier (using the predict_proba method).
8.3 Results
We now report the preliminary results from our collaborative modeling efforts.2 These
results represent 42 days of collaborative feature development. As of the time of
writing, there were 16 data scientists collaborating on the project from 7 different
institutions.2These results are current as of commit f50b2db.
155

8.3.1 Feature definitions
At the time of this writing, 28 features have been accepted to the project, committed
by 9 different collaborators.
Table 8.2 shows the top features ranked by estimated mutual information of the
feature values with the material hardship target. Top features consume from 2–30
input columns and all produce scalar-valued features (though other features produce
vector-valued features). Estimated conditional mutual information (CMI) is low after
conditioning on all other feature values, indicating that no one feature is much more
important than the others and that all features are somewhat correlated with each
other.
Inputs Dimensionality MI CMIname
Income per adult ratio 20 1 1.271 0.000HH income ratio 6 1 0.946 0.000father_buy_stab_in_mothers_view 25 1 0.749 0.000father_buy_stab 24 1 0.387 0.000f5_buy_diff 18 1 0.216 0.000t5_social 30 1 0.201 0.000f1iwc 16 1 0.173 0.000f2_buy_diff 12 1 0.160 0.000normalized student-teacher ratio 2 1 0.159 0.000f4_buy_diff 10 1 0.115 0.000
Table 8.2: The top features in the predict-life-outcomes feature engineering pipeline,ranked by estimated mutual information (MI) of the feature values with the materialhardship target.
A fundamental difficulty in the FFC is the large number of input variables. To
what extent is the collaboration able to process these variables? In Figure 8.5, we show
the coverage of the variable space over time, i.e., the fraction of overall variables that
are used as input to at least one feature definition. As the collaboration progresses,
more input variables are used, with the distribution of input variables per feature
shown in Figure 8.4.
156

5 10 15 20 25 30Input variables per feature
0
2
4
6
8
10
12
14
Cou
nt
Figure 8.4: Distribution of input variables per feature with kernel density estimate.
t0 t1 t2 t3 t4 t5 t6 t7 t8 t9 t10 t11 t12 t13 t14 t15 t16 t17 t18 t19 t20 t21 t22 t23 t24 t25 t26 t27Feature acceptance times
50
100
150
200
Vari
able
s co
vere
d
Figure 8.5: Variable coverage over time in the predict-life-outcomes project. As newfeatures arrive, they increase coverage of the variable space by using as their inputvariables that had not previously been transformed.
8.3.2 Predictive performance
We report our predictive performance on all six prediction targets, with a focus on
material hardship in some cases as this was the target on which FFC entrants per-
formed the best and which we used for feature validation.
For the material hardship target, we show the best pipeline from each pipeline
template searched during automated modeling in Table 8.3, and compare it against
two baseline methods. The best-performing model in terms of test 𝑅2Holdout is the
ballet feature engineering pipeline with a tuned gradient-boosted decision trees (XGB)
regressor. The train-mean model simply predicts the mean of the train set, and scores
𝑅2Holdout = 0.0 by definition. The test-mean model “cheats” by predicting the mean
of the test set, but since the sets are split using systematic sampling
157

(Salganik et al., 2019, Page 5), the target means are almost equal, and this model
does not perform any better.
train leaderboard testpipeline metric
train-mean 𝑅2Holdout 0.000 0.000 0.000
MSE 0.024 0.029 0.025test-mean 𝑅2
Holdout 0.000 0.000 0.000MSE 0.024 0.029 0.025
ballet-elasticnet 𝑅2Holdout 0.087 0.051 0.085
MSE 0.022 0.027 0.023ballet-xgboost 𝑅2
Holdout 0.178 0.079 0.034MSE 0.020 0.027 0.024
ballet-knn 𝑅2Holdout 0.061 0.050 0.060
MSE 0.023 0.027 0.023ballet-randomforest 𝑅2
Holdout 0.070 0.043 0.066MSE 0.023 0.028 0.023
Table 8.3: Performance of ML pipelines in the predict-life-outcomes project in pre-dicting Material Hardship, in terms of mean squared error and normalized 𝑅2.
We compare the best pipeline found in our automated modeling for each target
against the models produced by FFC entrants in Table 8.4. Out of the 161 FFC
entrants, the best Ballet pipeline beats over two thirds of entrants in all cases, and
performs best in classification problems such as Layoff (96th percentile).
Pipeline 𝑅2Holdout Wins Percentile
Target
Material Hardship ballet-elasticnet 0.085 110 68.3GPA ballet-xgboost 0.140 122 75.8Grit ballet-elasticnet 0.017 124 77.0Eviction ballet-elasticnet 0.012 125 77.6Layoff ballet-elasticnet 0.021 154 95.7Job Training ballet-knn-proba 0.007 122 75.8
Table 8.4: Performance of the best ML pipelines in the predict-life-outcomes projectfor each target, compared to FFC entrants. Wins is the number of FFC entrantsthat the pipeline outperforms, and Percentile is the percent of FFC entrants that thepipeline outperforms.
One particular struggle of FFC entrants was avoiding overfitting their models to
158

the training dataset, which partly reflects the small number of training observations.
In fact, Salganik et al. (2019, Figure 7) report that there was only “modest” correla-
tion between performance on the training set and performance on the held-out test
set, ranging from −0.12 to 0.44 depending on the prediction target. We reproduce
this analysis and add the generalization performance of our own ML pipelines in Fig-
ure 8.6. Our ML pipelines do not exhibit overfitting, likely for two reasons. First,
the structure imposed by Ballet’s feature engineering language (Section 3.4) means
that features can only be created using the development (train) set, and learn pa-
rameters from the development set only, such that no information can leak from the
held-out sets. Second, due to the automated modeling facilitated by ML Bazaar, we
evaluate candidate learning algorithms and hyperparameter configurations by their
performance on a split that was not used for training. This leads to better estimates
of generalization error, and correspondingly better performance on the unseen test
set.
8.4 Discussion
In the predict-life-outcomes project, we set out to assess whether data scientists can
fruitfully collaborate on a machine learning challenge at the scale of the FFC, and
what sort of performance results from such a collaboration. In our preliminary anal-
ysis, the results are promising.
8.4.1 Private data, open-source model
In contrast to other Ballet projects like predict-census-income, the dataset used in
predict-life-outcomes is private and restricted to researchers approved by the data
owners. As a result, new collaborators had to onboard for one week or longer before
they could begin feature development. One appeal of open-source software develop-
ment is the low barrier to entry for contributing even the smallest of patches. The
lengthy onboarding process of the FFC presents a high barrier to entry and may
dissuade potential collaborators from joining.
159

0.00
0.25
0.50
0.75
1.00Material Hardship GPA Grit
0.0 0.5 1.00.00
0.25
0.50
0.75
1.00Eviction
0.0 0.5 1.0
Job Training
0.0 0.5 1.0
Layoff
R2Train
R2 H
oldo
ut
Figure 8.6: Generalization to the test set of collaborative predict-life-outcomes modelin terms of 𝑅2 (red stars), compared to generalization of the entrants to Fragile Fam-ilies Challenge who scored above 0 (black dots). We show the relationship between𝑅2
Train and 𝑅2Holdout (on the test set). A model that generalizes perfectly would lie on
the dashed 45-degree line. For the Grit, Eviction, Job Training, and Layoff targets,even the FFC winning models barely outperformed predictions of the train mean.
As considered in Section 5.4, one solution here is to generate synthetic data follow-
ing the schema of the Fragile Families dataset that does not represent nor violate the
privacy of any FFCWS respondents. New predict-life-outcomes collaborators could
begin developing features immediately from the synthetic data, though the features
would be validated in continuous integration using the real data. If a collaborator was
inspired to fully join the project, they could then apply for the private data access.
8.4.2 Collaborative modeling without redundancy
Collaborators have been successful in submitting feature definitions to the shared
project without redundancy. Most input variables are used only once, with variables
being used at most twice. At one point, there were 131 variables used without any
redundancy.
160

There are at least three possible explanations for this success. The first is that
the functionalities provided by Ballet for work distribution have been successful in
avoiding redundant work — namely the feature discovery and querying functionality,
the feature development partitions, the visibility of existing features due to the open-
source development setting, and the use of synchronous discussion rooms. The second
is that the input variables are not completely “independent,” but rather that a group
of variables may represent the responses to one set of related questions and are likely
to be used as a group by a data scientist developing features.
The third is that the lack of redundancy so far has been due to pure luck. For
example, fixing the number of input variables of each existing feature, if each in-
put variable set were chosen completely at random from the available variables, the
probability of observing no duplicates among input variables is given by
𝑝 =𝑛!
(𝑛−∑︀
𝑖 𝜋𝑖)!
(︃∏︁𝑖
𝑛!
(𝑛− 𝜋𝑖)!
)︃−1
(8.2)
where 𝜋𝑖 is the number of input variables to feature 𝑖, and 𝑛 is the number of
variables available. The left term in the product represents the number of ways to
choose the input variables with no duplicates and the right term represents the total
number of ways to choose the input variables given their group structure. This is a
lower bound on the probability of observing any overlap if all of the input variables
were chosen with replacement one at a time, rather than in groups, because it is not
possible for the variables within a single group to be duplicated.
In our preliminary analysis on the first 131 variables used, we find that 𝑝 ≈ .56;
that is, the probability that there would be no duplicates if the input variable groups
were chosen at random is 56%. With the full 220 variables, 𝑝 falls to 21%.
To investigate this further, we compute the probability of observing no duplicates
among input variables as new features arrive and consume more input variables.
We estimate a kernel density of the number of variables used per feature from the
existing features in the repository. We then simulate a sequence of features using
those numbers of variables up to a fixed total number of variables. In Figure 8.7, we
161

0 50 100 150 200Total number of input variables
0.0
0.2
0.4
0.6
0.8
1.0
Prob
abili
ty
Probability of observing no duplicates,given sampling strategy
individualgroups
Figure 8.7: The probability of observing no duplicate input variables, given a fixedtotal number of input variables across features, according to Equation (8.2). Theindividual sampling strategy occurs if there are 𝑚 features each with one input vari-able. The group sampling strategy occurs if there are 𝑘 features with 𝜋1, . . . , 𝜋𝑘 inputvariables and
∑︀𝑖 𝜋𝑖 = 𝑚. We simulate feature sets of this sort and show the mean
and 95% interval of the computed probability over the feature sets.
compare the probability of no duplicates for this simulated data as well as a baseline
of all features that consume exactly one variable. At about 140 total inputs, the
probability of observing no duplicates crosses below 50%.
This all goes to show the unique challenges of scaling the distribution of work of
feature development when there are on the order of tens of thousands of variables, as is
the case in the FFC. Very quickly (about 1% of all variables being used), collaborators
may begin to do redundant work without additional support.
Redundant features (in the statistical sense) are definitely harmful to predictive
performance, but duplicate input variables are not necessarily bad. One variable
might be used to construct two or more complex features that are each useful. How-
ever, given the scale of the FFC data, human effort should focus on untapped regions
of the variable space.
162

8.4.3 Modeling performance is competitive
We describe several highlights of the modeling performance achieved by the collabo-
rative project, including the ability for automated modeling to improve on untuned
ML pipelines and the lack of overfitting. However, our performance in this prelimi-
nary analysis ranges from the 68th percentile to the 96th percentile of FFC entrants.
While a strong start, this result does not yet improve upon modeling outcomes from
the FFC, which were mediocre at best. As our collaborative project matures, we
expect our performance to improve further. The 220 variables used so far as feature
inputs represent only 1.7% of all available variables in the data, and many variables
that are expected to yield useful information about the targets have not yet been
processed by collaborators.
8.4.4 Models and features are interpretable
One immediate and “free” advantage from collaborative and structured development
with Ballet is an interpretable model, or at least, interpretable features. Interpretabil-
ity is critical for a context as sensitive as the FFC. For example, one of the pipelines
we automatically tuned is an elastic net pipeline. For the prediction target of predict-
ing a child’s GPA six years into the future, we can look at the impact on the predicted
outcome from changing a feature value by 1 standard deviation (Figure 8.8).
0.06 0.04 0.02 0.00 0.02 0.04 0.06Change in outcome
college_educated_parentsfather_s_job_training
cidi_alcohol_drug_depression_anxietycheck_the_age_of_the_mother_for_her_first_birth_18_21_and_1821_x0_0check_the_age_of_the_mother_for_her_first_birth_18_21_and_1821_x0_1check_the_age_of_the_mother_for_her_first_birth_18_21_and_1821_x0_2
father_incarceratedf3_buy_difff5_buy_difff4_buy_diff
t5_socialchild_is_in_special_education_classes_0child_is_in_special_education_classes_1
race_ethnicity_of_child_1race_ethnicity_of_child_3
married_or_cohabiting_at_birthchild_controls_temper
child_s_year_9_math_skills
Impact on GPA from 1 SD increase in feature
Figure 8.8: Feature importance in predicting GPA using the best performing elasticnet model. Feature value names are either given by collaborators in the optionalfeature definition metadata fields, or are inferred automatically by Ballet.
163

We find that there is a natural interpretability to the feature importance analysis.
For example, the feature father_incarcerated (whether the child’s father was ever
incarcerated) has a large negative impact on GPA. This is reasonable as research
widely finds that incarceration has a profound negative impact not only on those
who are incarcerated but also their families and loved ones. Meanwhile, the feature
child_s_year_9_math_skills (teacher’s assessment of child’s math skills in year 9
compared to other students in the same grade) has a large positive impact on GPA.
This too makes sense as math is one of the four subjects measured in the age 15 GPA
prediction target.
164

Chapter 9
Future directions
9.1 Beyond feature engineering
To any reader who has made it this far, it will be quite apparent that much of
the focus of this thesis has been on feature engineering, as a prominent example of
collaborative workflows that can be used to create data science pipelines. Throughout
the thesis, we have seen demonstrations of the importance of features in real-world
data science applications, and the difficulties involved in properly specifying features
and engineering those that will be the most useful for a given machine learning task.
But features are just one small part of machine learning and data science. In
many applications, such as image, video, audio, and signal processing, modern deep
neural networks learn a feature representation of unstructured input as part of the
training process. In these applications, where handcrafted features are of little use,
collaboration is still very important.
In Chapter 3, we contended that our conceptual framework can be applied to
many steps in the data science process, but that we focus on feature engineering as an
important manifestation of that process. In this section, we consider the application
of Ballet’s conceptual framework to another import step, data labeling.
While many machine learning researchers assume that supervised learning pro-
grams already contain both features and associated labels, in practice data scientists
often must apply labels to observations. Sometimes this is trivial, such as obtaining
165

the selling price of a house from public records and linking it to the house details, but
sometimes human experts or crowd workers must manually label each observation.
Somewhere in the middle of this spectrum is a new approach to data labeling
called data programming (Ratner et al., 2016), in which analysts create heuristics to
automatically apply labels to subsets of the observations. Functions can apply these
heuristics to the entire dataset, such that one observation may have multiple, possibly
conflicting labels. A statistical model is learned that tries to recover the “true” label
of an observation given the patterns of agreement and disagreement among labels.
The resulting labels are probabilistic, leading to a paradigm called weakly-supervised
learning.
Following Section 3.2, our goal is to define the three concepts of data science
patches, data science products, and software and statistical acceptance procedures.
In the context of data programming, the data science patch is an individual la-
beling function. In the Snorkel framework (Ratner et al., 2017), a Python function
can be annotated with a decorator to create a labeling function with just a few lines
of code.
The data science product in this context is a labeling pipeline that can take batches
of unlabeled observations and produce probabilistic labels.
The software and statistical acceptance procedures in this context are to (1) val-
idate that the function satisfies the labeling function interface (2) validate that the
function applies labels to unseen observations and (3) compare the performance of
the labeling pipeline with and without the proposed labeling function on a set of
held-out, gold-standard labels obtained manually or from another source.
9.2 Potential impact
What are the biggest challenges facing humans right now? According to the United
Nation’s Sustainable Development Goals, the top three goals are eliminating poverty,
eliminating hunger, and promoting good health and well-being. These goals are just
as pressing in the United States as they are in developing countries. To what extent
166

are successes in machine learning aligned with these national and global priorities?
The most visible successes of academic machine learning concern playing games,
detecting objects in images, or translating text. The progress that has been made in
these areas is remarkable and reflects technical breakthroughs and enormous compu-
tational power.
We can see some areas in which machine learning successes are contributing toward
development goals:
• Advances in computer vision and image recognition are leading to smart farming
equipment that could improve output while reducing reliance on pesticides.
• Machine learning on satellite images can lead to detailed, real-time maps of soil
and crop conditions for smallholder farmers.
• Machine learning on electronic health records, medical imaging, and genomes
can lead to better and more personalized medical treatments.
While these directions are laudable, most of the current machine learning research
only helps the richest producers or consumers in the world’s developed countries. Even
within the United States, many observers think that the current direction of machine
learning progress is likely to perpetuate inequalities in what is largely a winner-take-
all system, rather than lifting the living standards and well-being of the less well-off.
Meanwhile, there is an urgent need for machine learning and artificial intelligence
technologies that can supplement policy efforts and activism in addressing the most
critical problems like poverty, hunger, and health. As described in this thesis, survey
data is an important data modality that is widely used in better understanding and
intervening in situations affecting humans.
The research introduced in this thesis, including Ballet and ML Bazaar, serves to
improve the ability of data scientists and machine learning researchers to use survey
data in prediction policy problems. However, much work remains in creating better
developer tools and statistical methods for processing such data.
The following are important future directions for machine learning on survey data:
167

• Building better tools for automatically detecting and processing survey meta-
data. This includes detecting column data types, column relationships (i.e., re-
sponses to multiple choice questions coded across several columns), and making
inferences about columns through processing question descriptions and labels.
• Developing algorithms for detecting and imputing missing values due to the
complex skip patterns in survey responses.
168

Chapter 10
Conclusion
This thesis describes our research in collaborative, open, and automated data science,
and our contributions in designing and implementing frameworks for data scientists to
use and better understand collaborations in practice. As machine learning and data
science continue to grow in influence, the ability of data scientists and other stake-
holders with varying experience, skills, roles, and responsibilities to work together on
impactful projects will be increasingly important. I expect that continued research in
this area will enhance the ability of close-knit data science teams and wide-ranging
open collaborations alike to deliver models and analyses.
169

Bibliography
Martín Abadi, Ashish Agarwal, Paul Barham, Eugene Brevdo, Zhifeng Chen, CraigCitro, Greg S. Corrado, Andy Davis, Jeffrey Dean, Matthieu Devin, Sanjay Ghe-mawat, Ian Goodfellow, Andrew Harp, Geoffrey Irving, Michael Isard, YangqingJia, Rafal Jozefowicz, Lukasz Kaiser, Manjunath Kudlur, Josh Levenberg, Dande-lion Mané, Rajat Monga, Sherry Moore, Derek Murray, Chris Olah, Mike Schus-ter, Jonathon Shlens, Benoit Steiner, Ilya Sutskever, Kunal Talwar, Paul Tucker,Vincent Vanhoucke, Vijay Vasudevan, Fernanda Viégas, Oriol Vinyals, Pete War-den, Martin Wattenberg, Martin Wicke, Yuan Yu, and Xiaoqiang Zheng. Ten-sorFlow: Large-scale machine learning on heterogeneous systems, 2015. URLhttps://www.tensorflow.org/. Software available from tensorflow.org.
John M. Abowd, Gary L. Benedetto, Simson L. Garfinkel, Scot A. Dahl, Aref N. Da-jani, Matthew Graham, Michael B. Hawes, Vishesh Karwa, Daniel Kifer, HangKim, Philip Leclerc, Ashwin Machanavajjhala, Jerome P. Reiter, Rolando Ro-driguez, Ian M. Schmutte, William N. Sexton, Phyllis E. Singer, and Lars Vilhuber.The modernization of statistical disclosure limitation at the U.S. Census Bureau.Working Paper, U.S. Census Bureau, August 2020.
Sarah Alnegheimish, Najat Alrashed, Faisal Aleissa, Shahad Althobaiti, Dongyu Liu,Mansour Alsaleh, and Kalyan Veeramachaneni. Cardea: An Open AutomatedMachine Learning Framework for Electronic Health Records. In 2020 IEEE 7thInternational Conference on Data Science and Advanced Analytics (DSAA), pages536–545, October 2020. doi: 10.1109/DSAA49011.2020.00068.
American Community Survey Office. American community survey 2018 ACS 1-yearPUMS files readme. https://www2.census.gov/programs-surveys/acs/tech_docs/pums/ACS2018_PUMS_README.pdf, November 2019. Accessed 2021-08-21.
Michael Anderson, Dolan Antenucci, Victor Bittorf, Matthew Burgess, Michael Ca-farella, Arun Kumar, Feng Niu, Yongjoo Park, Christopher Ré, and Ce Zhang.Brainwash: A Data System for Feature Engineering. In 6th Biennial Conferenceon Innovative Data Systems Research, pages 1–4, 2013.
Peter Auer, Nicolò Cesa-Bianchi, and Paul Fischer. Finite-time Analysis of the Mul-tiarmed Bandit Problem. Machine Learning, 47(2):235–256, May 2002. ISSN 1573-0565. doi: 10.1023/A:1013689704352.
170

Peter Bailis. Humans, not machines, are the main bottleneck in mod-ern analytics. https://sisudata.com/blog/humans-not-machines-are-the-bottleneck-in-modern-analytics, December 2020.
Adam Baldwin. Details about the event-stream incident — the npm blog.https://blog.npmjs.org/post/180565383195/details-about-the-event-stream-incident, 2018. Accessed 2018-11-30.
Flore Barcellini, Françoise Détienne, and Jean-Marie Burkhardt. A situated approachof roles and participation in open source software communities. Human–ComputerInteraction, 29(3):205–255, 2014.
Guillaume Baudart, Martin Hirzel, Kiran Kate, Parikshit Ram, and Avraham Shin-nar. Lale: Consistent Automated Machine Learning. arXiv:2007.01977 [cs], July2020.
Denis Baylor, Eric Breck, Heng-Tze Cheng, Noah Fiedel, Chuan Yu Foo, ZakariaHaque, Salem Haykal, Mustafa Ispir, Vihan Jain, Levent Koc, Chiu Yuen Koo,Lukasz Lew, Clemens Mewald, Akshay Naresh Modi, Neoklis Polyzotis, SukritiRamesh, Sudip Roy, Steven Euijong Whang, Martin Wicke, Jarek Wilkiewicz,Xin Zhang, and Martin Zinkevich. TFX: A TensorFlow-Based Production-ScaleMachine Learning Platform. In Proceedings of the 23rd ACM SIGKDD Inter-national Conference on Knowledge Discovery and Data Mining, KDD ’17, pages1387–1395, New York, NY, USA, 2017. ACM. ISBN 978-1-4503-4887-4. doi:10.1145/3097983.3098021.
Emily M. Bender, Timnit Gebru, Angelina McMillan-Major, and ShmargaretShmitchell. On the dangers of stochastic parrots: Can language models be toobig? In Proceedings of the 2021 ACM Conference on Fairness, Accountability, andTransparency, FAccT ’21, pages 610–623, New York, NY, USA, 2021. Associationfor Computing Machinery. ISBN 9781450383097. doi: 10.1145/3442188.3445922.
James Bennett and Stan Lanning. The Netflix prize. In Proceedings of KDD Cupand Workshop 2007, pages 1–4, 2007.
Evangelia Berdou. Organization in open source communities: At the crossroads ofthe gift and market economies. Routledge, 2010.
James Bergstra and Yoshua Bengio. Random Search for Hyper-Parameter Optimiza-tion. Journal of Machine Learning Research, 13:281–305, 2012. ISSN 1532-4435.doi: 10.1162/153244303322533223.
James Bergstra, Rémi Bardenet, Yoshua Bengio, and Balázs Kégl. Algorithms forhyper-parameter optimization. In Proceedings of the 24th International Conferenceon Neural Information Processing Systems, NIPS’11, pages 2546–2554, Red Hook,NY, USA, December 2011. Curran Associates Inc. ISBN 978-1-61839-599-3.
171

Anant Bhardwaj, Amol Deshpande, Aaron J. Elmore, David Karger, Sam Madden,Aditya Parameswaran, Harihar Subramanyam, Eugene Wu, and Rebecca Zhang.Collaborative data analytics with DataHub. Proceedings of the VLDB Endowment,8(12):1916–1919, August 2015. ISSN 21508097. doi: 10.14778/2824032.2824100.
Steven Bird, Ewan Klein, and Edward Loper. Natural language processing withPython: analyzing text with the natural language toolkit. O’Reilly Media, Inc.,2009.
Bernd Bischl, Giuseppe Casalicchio, Matthias Feurer, Frank Hutter, Michel Lang,Rafael G. Mantovani, Jan N. van Rijn, and Joaquin Vanschoren. OpenML Bench-marking Suites. arXiv:1708.03731 [cs, stat], September 2019.
Matthias Boehm, Michael Dusenberry, Deron Eriksson, Alexandre V. Evfimievski,Faraz Makari Manshadi, Niketan Pansare, Berthold Reinwald, Frederick R. Reiss,Prithviraj Sen, Arvind C. Surve, and Shirish Tatikonda. SystemML: DeclarativeMachine Learning on Spark. Proceedings of the VLDB Endowment, 9(13):1425–1436, 2016. ISSN 21508097. doi: 10.14778/3007263.3007279.
Andreas Böhm. Theoretical coding: Text analysis in. A companion to qualitativeresearch, 1, 2004.
Tolga Bolukbasi, Kai-Wei Chang, James Y. Zou, Venkatesh Saligrama, and A. Kalai.Man is to computer programmer as woman is to homemaker? debiasing wordembeddings. In NIPS, 2016.
Nathan Bos, Ann Zimmerman, Judith Olson, Jude Yew, Jason Yerkie, Erik Dahl,and Gary Olson. From shared databases to communities of practice: A taxonomyof collaboratories. Journal of Computer-Mediated Communication, 12(2):318–338,2007.
G. Bradski. The OpenCV Library. Dr. Dobb’s Journal of Software Tools, 2000.
Eric Breck, Neoklis Polyzotis, Sudip Roy, Steven Euijong Whang, and Martin Zinke-vich. Data Validation for Machine Learning. In Proceedings of the 2nd SysMLConference, pages 1–14, 2019.
Leo Breiman. Statistical Modeling: The Two Cultures. Statistical Science, 16(3):199–231, 2001. ISSN 08834237. doi: 10.2307/2676681.
Frederick P. Brooks Jr. The mythical man-month: essays on software engineering.Pearson Education, 1995.
Eli Brumbaugh, Atul Kale, Alfredo Luque, Bahador Nooraei, John Park, Krishna Put-taswamy, Kyle Schiller, Evgeny Shapiro, Conglei Shi, Aaron Siegel, Nikhil Simha,Mani Bhushan, Marie Sbrocca, Shi-Jing Yao, Patrick Yoon, Varant Zanoyan, Xiao-Han T. Zeng, Qiang Zhu, Andrew Cheong, Michelle Gu-Qian Du, Jeff Feng, NickHandel, Andrew Hoh, Jack Hone, and Brad Hunter. Bighead: A Framework-Agnostic, End-to-End Machine Learning Platform. In 2019 IEEE International
172

Conference on Data Science and Advanced Analytics (DSAA), pages 551–560,Washington, DC, USA, October 2019. IEEE. ISBN 978-1-72814-493-1. doi:10.1109/DSAA.2019.00070.
Lars Buitinck, Gilles Louppe, Mathieu Blondel, Fabian Pedregosa, Andreas Mueller,Olivier Grisel, Vlad Niculae, Peter Prettenhofer, Alexandre Gramfort, Jaques Grob-ler, Robert Layton, Jake VanderPlas, Arnaud Joly, Brian Holt, and Gaël Varo-quaux. API design for machine learning software: experiences from the scikit-learnproject. In ECML PKDD Workshop: Languages for Data Mining and MachineLearning, pages 108–122, 2013.
José P. Cambronero, Jürgen Cito, and Martin C. Rinard. AMS: Generating AutoMLsearch spaces from weak specifications. In Proceedings of the 28th ACM Joint Meet-ing on European Software Engineering Conference and Symposium on the Founda-tions of Software Engineering, pages 763–774, Virtual Event USA, November 2020.ACM. ISBN 978-1-4503-7043-1. doi: 10.1145/3368089.3409700.
Souti Chattopadhyay, Ishita Prasad, Austin Z. Henley, Anita Sarma, and Titus Barik.What’s wrong with computational notebooks? pain points, needs, and design op-portunities. In Proceedings of the 2020 CHI Conference on Human Factors inComputing Systems, pages 1–12. ACM, Apr 2020. ISBN 978-1-4503-6708-0. doi:10.1145/3313831.3376729.
Vincent Chen, Sen Wu, Alexander J. Ratner, Jen Weng, and Christopher Ré. Slice-based learning: A programming model for residual learning in critical data slices.In 33rd Conference on Neural Information Processing Systems, pages 1–11, 2019.
Justin Cheng and Michael S. Bernstein. Flock: Hybrid Crowd-Machine LearningClassifiers. Proceedings of the 18th ACM Conference on Computer Supported Co-operative Work & Social Computing - CSCW ’15, pages 600–611, 2015.
Joohee Choi and Yla Tausczik. Characteristics of Collaboration in the EmergingPractice of Open Data Analysis. In Proceedings of the 2017 ACM Conference onComputer Supported Cooperative Work and Social Computing - CSCW ’17, pages835–846, Portland, Oregon, USA, 2017. ACM Press. ISBN 978-1-4503-4335-0. doi:10.1145/2998181.2998265.
Alexandra Chouldechova, Emily Putnam-Hornstein, Suzanne Dworak-Peck, DianaBenavides-Prado, Oleksandr Fialko, Rhema Vaithianathan, Sorelle A. Friedler, andChristo Wilson. A case study of algorithm-assisted decision making in child mal-treatment hotline screening decisions. In Proceedings of Machine Learning Research,volume 81, pages 1–15, 2018.
Maximilian Christ, Nils Braun, Julius Neuffer, and Andreas W. Kempa-Liehr. Timeseries feature extraction on basis of scalable hypothesis tests (tsfresh–a pythonpackage). Neurocomputing, 307:72–77, 2018.
173

Drew Conway. The Data Science Venn Diagram. http://drewconway.com/zia/2013/3/26/the-data-science-venn-diagram, March 2013.
Carl Cook, Warwick Irwin, and Neville Churcher. A user evaluation of synchronouscollaborative software engineering tools. In 12th Asia-Pacific Software EngineeringConference (APSEC’05), pages 1–6, December 2005. doi: 10.1109/APSEC.2005.22.
Daniel Crankshaw, Peter Bailis, Joseph E. Gonzalez, Haoyuan Li, Zhao Zhang,Michael J. Franklin, Ali Ghodsi, and Michael I. Jordan. The Missing Piece inComplex Analytics: Low Latency, Scalable Model Management and Serving withVelox. In 7th Biennial Conference on Innovative Data Systems Research (CIDR’15), Asilomar, California, USA, 2015.
Andrew Crotty, Alex Galakatos, Emanuel Zgraggen, Carsten Binnig, and TimKraska. Vizdom: Interactive analytics through pen and touch. Proceedings ofthe VLDB Endowment, 8(12):2024–2027, August 2015. ISSN 21508097. doi:10.14778/2824032.2824127.
Kevin Crowston, Jeff S. Saltz, Amira Rezgui, Yatish Hegde, and Sangseok You.Socio-technical Affordances for Stigmergic Coordination Implemented in MIDST,a Tool for Data-Science Teams. Proceedings of the ACM on Human-ComputerInteraction, 3(CSCW):1–25, November 2019. ISSN 2573-0142, 2573-0142. doi:10.1145/3359219.
Dean De Cock. Ames, iowa: Alternative to the boston housing data as an end ofsemester regression project. Journal of Statistics Education, 19(3), 2011.
Alexandre Decan, Tom Mens, and Maelick Claes. On the topology of package de-pendency networks: A comparison of three programming language ecosystems. InProccedings of the 10th European Conference on Software Architecture Workshops,ECSAW ’16, pages 21:1–21:4, New York, NY, USA, 2016. ACM.
Dong Deng, Raul Castro Fernandez, Ziawasch Abedjan, Sibo Wang, Michael Stone-braker, Ahmed Elmagarmid, Ihab F. Ilyas, Samuel Madden, Mourad Ouzzani, andNan Tang. The Data Civilizer System. In 8th Biennial Conference on InnovativeData Systems Research (CIDR ‘17), pages 1–7, Chaminade, California, USA, 2017.
Ian Dewancker, Michael McCourt, Scott Clark, Patrick Hayes, Alexandra Johnson,and George Ke. A Strategy for Ranking Optimization Methods using MultipleCriteria. In Workshop on Automatic Machine Learning, pages 11–20. PMLR, De-cember 2016.
Pedro Domingos. A few useful things to know about machine learning. Com-munications of the ACM, 55(10):78–87, October 2012. ISSN 00010782. doi:10.1145/2347736.2347755.
174

Iddo Drori, Yamuna Krishnamurthy, Remi Rampin, Raoni de Paula Lourenco,Jorge Piazentin Ono, Kyunghyun Cho, Claudio Silva, and Juliana Freire. Al-phaD3M: Machine Learning Pipeline Synthesis. JMLR: Workshop and ConferenceProceedings, 1:1–8, 2018.
Cynthia Dwork. Differential privacy: A survey of results. In International conferenceon theory and applications of models of computation, pages 1–19. Springer, 2008.
Epidemic Prediction Initiative. Dengue forecasting project. https://web.archive.org/web/20190916180225/https://predict.phiresearchlab.org/post/5a4fcc3e2c1b1669c22aa261. Accessed 2018-04-30.
Nick Erickson, Jonas Mueller, Alexander Shirkov, Hang Zhang, Pedro Larroy, Mu Li,and Alexander Smola. AutoGluon-Tabular: Robust and Accurate AutoML forStructured Data. arXiv:2003.06505 [cs, stat], March 2020.
Stefan Falkner, Aaron Klein, and Frank Hutter. BOHB: Robust and Efficient Hyper-parameter Optimization at Scale. In Proceedings of the 35th International Confer-ence on Machine Learning, Stockholm, Sweden, 2018. ISBN 978-1-5108-6796-3.
Ethan Fast and Michael S. Bernstein. Meta: Enabling programming languages tolearn from the crowd. In Proceedings of the 29th Annual Symposium on UserInterface Software and Technology - UIST ’16, pages 259–270. ACM Press, 2016.ISBN 978-1-4503-4189-9. doi: 10.1145/2984511.2984532.
Matthias Feurer, Aaron Klein, Katharina Eggensperger, Jost Springenberg, ManuelBlum, and Frank Hutter. Efficient and Robust Automated Machine Learning.Advances in Neural Information Processing Systems 28, pages 2944–2952, 2015.ISSN 10495258.
Utsav Garg, Viraj Prabhu, Deshraj Yadav, Ram Ramrakhya, Harsh Agrawal, andDhruv Batra. Fabrik: An online collaborative neural network editor. arXiv e-prints, art. arXiv:1810.11649, 2018.
Alexander Geiger, Dongyu Liu, Sarah Alnegheimish, Alfredo Cuesta-Infante, andKalyan Veeramachaneni. TadGAN: Time Series Anomaly Detection Using Gen-erative Adversarial Networks. In 2020 IEEE International Conference on BigData (Big Data), pages 33–43, December 2020. doi: 10.1109/BigData50022.2020.9378139.
Pieter Gijsbers, Erin Ledell, Janek Thomas, Sébastien Poirier, Bernd Bischl, andJoaquin Vanschoren. An Open Source AutoML Benchmark. 6th ICML Workshopon Automated Machine Learning, pages 1–8, 2019.
GitHub. About github - where the world builds software. https://web.archive.org/web/20210609020420/https://github.com/about, June 2021. Accessed2021-06-08.
175

Leonid Glanz, Patrick Müller, Lars Baumgärtner, Michael Reif, Sven Amann, PaulineAnthonysamy, and Mira Mezini. Hidden in plain sight: Obfuscated strings threat-ening your privacy. In Proceedings of the 15th ACM Asia Conference on Computerand Communications Security, pages 694–707, 2020.
GNU. The gnu operating system. https://www.gnu.org.
Daniel Golovin, Benjamin Solnik, Subhodeep Moitra, Greg Kochanski, John Karro,and D. Sculley. Google Vizier: A Service for Black-Box Optimization. In Pro-ceedings of the 23rd ACM SIGKDD International Conference on Knowledge Dis-covery and Data Mining, KDD ’17, pages 1487–1495, New York, NY, USA, Au-gust 2017. Association for Computing Machinery. ISBN 978-1-4503-4887-4. doi:10.1145/3097983.3098043.
Taciana A.F. Gomes, Ricardo B.C. Prudêncio, Carlos Soares, André L.D. Rossi, andAndré Carvalho. Combining meta-learning and search techniques to select parame-ters for support vector machines. Neurocomputing, 75(1):3–13, January 2012. ISSN09252312. doi: 10.1016/j.neucom.2011.07.005.
Ming Gong, Linjun Shou, Wutao Lin, Zhijie Sang, Quanjia Yan, Ze Yang, FeixiangCheng, and Daxin Jiang. NeuronBlocks: Building Your NLP DNN Models LikePlaying Lego. In Proceedings of the 2019 Conference on Empirical Methods inNatural Language Processing and the 9th International Joint Conference on NaturalLanguage Processing (EMNLP-IJCNLP): System Demonstrations, pages 163–168,Hong Kong, China, 2019. Association for Computational Linguistics. doi: 10.18653/v1/D19-3028.
Georgios Gousios, Martin Pinzger, and Arie van Deursen. An exploratory study of thepull-based software development model. In Proceedings of the 36th InternationalConference on Software Engineering - ICSE 2014, pages 345–355, Hyderabad, In-dia, 2014. ACM Press. ISBN 978-1-4503-2756-5. doi: 10.1145/2568225.2568260.
Georgios Gousios, Andy Zaidman, Margaret-Anne Storey, and Arie van Deursen.Work Practices and Challenges in Pull-Based Development: The Integrator’s Per-spective. In 2015 IEEE/ACM 37th IEEE International Conference on SoftwareEngineering, volume 1, pages 358–368, May 2015. doi: 10.1109/ICSE.2015.55.
Georgios Gousios, Margaret-Anne Storey, and Alberto Bacchelli. Work Practices andChallenges in Pull-Based Development: The Contributor’s Perspective. In 2016IEEE/ACM 38th International Conference on Software Engineering (ICSE), pages285–296, May 2016. doi: 10.1145/2884781.2884826.
Roger B. Grosse and David K. Duvenaud. Testing MCMC code. In 2014 NIPSWorkshop on Software Engineering for Machine Learning, pages 1–8, 2014.
Isabelle Guyon and André Elisseeff. An Introduction to Variable and Feature Selec-tion. Journal of Machine Learning Research (JMLR), 3(3):1157–1182, 2003.
176

Isabelle Guyon, Kristin Bennett, Gavin Cawley, Hugo Jair Escalante, Sergio Escalera,Tin Kam Ho, Nuria Macia, Bisakha Ray, Mehreen Saeed, Alexander Statnikov,and Evelyne Viegas. Design of the 2015 ChaLearn AutoML challenge. In 2015International Joint Conference on Neural Networks (IJCNN), pages 1–8, Killarney,Ireland, July 2015. IEEE. ISBN 978-1-4799-1960-4. doi: 10.1109/IJCNN.2015.7280767.
Aric A. Hagberg, Daniel A. Schult, and Pieter J. Swart. Exploring network structure,dynamics, and function using networkx. In Gaël Varoquaux, Travis Vaught, andJarrod Millman, editors, SciPy, pages 11–15, 2008.
Sandra G. Hart and Lowell E. Staveland. Development of NASA-TLX (Task LoadIndex): Results of Empirical and Theoretical Research, volume 52, pages 139–183.Elsevier, 1988. ISBN 978-0-444-70388-0. doi: 10.1016/s0166-4115(08)62386-9.
Øyvind Hauge, Claudia Ayala, and Reidar Conradi. Adoption of open source softwarein software-intensive organizations–a systematic literature review. Information andSoftware Technology, 52(11):1133–1154, 2010.
Andrew Head, Fred Hohman, Titus Barik, Steven M. Drucker, and Robert DeLine.Managing messes in computational notebooks. In Proceedings of the 2019 CHIConference on Human Factors in Computing Systems, CHI ’19, pages 270:1–270:12,New York, NY, USA, 2019. ACM.
Jeremy Hermann and Mike Del Balso. Meet michelangelo: Uber’s machinelearning platform. https://eng.uber.com/michelangelo-machine-learning-platform/, 2017. Accessed 2019-07-01.
Youyang Hou and Dakuo Wang. Hacking with NPOs: Collaborative Analytics andBroker Roles in Civic Data Hackathons. Proceedings of the ACM on Human-Computer Interaction, 1(CSCW):1–16, December 2017. ISSN 2573-0142. doi:10.1145/3134688.
Jez Humble and David Farley. Continuous delivery: reliable software releases throughbuild, test, and deployment automation. Pearson Education, 2010.
Kyle Hundman, Valentino Constantinou, Christopher Laporte, Ian Colwell, and TomSoderstrom. Detecting Spacecraft Anomalies Using LSTMs and NonparametricDynamic Thresholding. In Proceedings of the 24th ACM SIGKDD InternationalConference on Knowledge Discovery & Data Mining - KDD ’18, pages 387–395,London, United Kingdom, 2018. ACM Press. ISBN 978-1-4503-5552-0. doi: 10.1145/3219819.3219845.
Nick Hynes, D Sculley, and Michael Terry. The Data Linter: Lightweight, AutomatedSanity Checking for ML Data Sets. Workshop on ML Systems at NIPS 2017, 2017.
Insight Lane. Crash model. https://github.com/insight-lane/crash-model,2019.
177

Kevin Jamieson and Ameet Talwalkar. Non-stochastic Best Arm Identification andHyperparameter Optimization. In Artificial Intelligence and Statistics, pages 240–248. PMLR, May 2016.
Justin P. Johnson. Collaboration, peer review and open source software. InformationEconomics and Policy, 18(4):477–497, November 2006. ISSN 01676245. doi: 10.1016/j.infoecopol.2006.07.001.
Daniel Kang, Deepti Raghavan, Peter Bailis, and Matei Zaharia. Model Assertionsfor Monitoring and Improving ML Models. arXiv:2003.01668 [cs], March 2020.
James Max Kanter and Kalyan Veeramachaneni. Deep Feature Synthesis: TowardsAutomating Data Science Endeavors. In 2015 IEEE International Conference onData Science and Advanced Analytics (DSAA), pages 1–10, 2015. ISBN 978-1-4673-8273-1. doi: 10.1109/DSAA.2015.7344858.
James Max Kanter, Owen Gillespie, and Kalyan Veeramachaneni. Label, segment,featurize: A cross domain framework for prediction engineering. Proceedings - 3rdIEEE International Conference on Data Science and Advanced Analytics, DSAA2016, pages 430–439, 2016.
Bojan Karlaš, Matteo Interlandi, Cedric Renggli, Wentao Wu, Ce Zhang, DeepakMukunthu Iyappan Babu, Jordan Edwards, Chris Lauren, Andy Xu, and MarkusWeimer. Building Continuous Integration Services for Machine Learning. In Pro-ceedings of the 26th ACM SIGKDD International Conference on Knowledge Dis-covery & Data Mining, pages 2407–2415, Virtual Event CA USA, August 2020.ACM. ISBN 978-1-4503-7998-4. doi: 10.1145/3394486.3403290.
Gilad Katz, Eui Chul Richard Shin, and Dawn Song. ExploreKit: Automatic FeatureGeneration and Selection. In 2016 IEEE 16th International Conference on DataMining (ICDM), pages 979–984, Barcelona, Spain, December 2016. IEEE. ISBN978-1-5090-5473-2. doi: 10.1109/ICDM.2016.0123.
Mary Beth Kery, Marissa Radensky, Mahima Arya, Bonnie E. John, and Brad A.Myers. The Story in the Notebook: Exploratory Data Science using a LiterateProgramming Tool. In Proceedings of the 2018 CHI Conference on Human Factorsin Computing Systems, CHI ’18, pages 1–11, New York, NY, USA, April 2018.Association for Computing Machinery. ISBN 978-1-4503-5620-6. doi: 10.1145/3173574.3173748.
Udayan Khurana, Deepak Turaga, Horst Samulowitz, and Srinivasan Parthasrathy.Cognito: Automated feature engineering for supervised learning. In 2016 IEEE16th International Conference on Data Mining Workshops (ICDMW), pages 1304–1307. IEEE, 2016.
Jon Kleinberg, Jens Ludwig, Sendhil Mullainathan, and Ziad Obermeyer. PredictionPolicy Problems. American Economic Review, 105(5):491–495, May 2015. ISSN0002-8282. doi: 10.1257/aer.p20151023.
178

Jon Kleinberg, Jens Ludwig, and Sendhil Mullainathan. A Guide to Solving SocialProblems with Machine Learning. Harvard Business Review, December 2016. ISSN0017-8012.
Thomas Kluyver, Benjamin Ragan-Kelley, Fernando Pérez, Brian Granger, MatthiasBussonnier, Jonathan Frederic, Kyle Kelley, Jessica Hamrick, Jason Grout, SylvainCorlay, Paul Ivanov, Damián Avila, Safia Abdalla, and Carol Willing. Jupyternotebooks – a publishing format for reproducible computational workflows. InF. Loizides and B. Schmidt, editors, Positioning and Power in Academic Publishing:Players, Agents and Agendas, pages 87–90. IOS Press, 2016.
Ron Kohavi. Scaling up the accuracy of naive-bayes classifiers: a decision-tree hybrid.In KDD, pages 1–6, 1996.
Alexander Kraskov, Harald Stögbauer, and Peter Grassberger. Estimating mutualinformation. Physical Review E - Statistical Physics, Plasmas, Fluids, and RelatedInterdisciplinary Topics, 69(6):1–16, 2004.
Max Kuhn. Building Predictive Models in R Using the caret Package. Journal ofStatistical Software, 28(5):159–160, 2008.
Maciej Kula. Metadata embeddings for user and item cold-start recommendations. InProceedings of the 2nd Workshop on New Trends on Content-Based RecommenderSystems, volume 1448, pages 14–21, 2015.
Thomas D. Latoza and André Van Der Hoek. Crowdsourcing in Software Engineering:Models, Opportunities, and Challenges. IEEE Software, pages 1–13, 2016.
Haiguang Li, Xindong Wu, Zhao Li, and Wei Ding. Group feature selection withstreaming features. Proceedings - IEEE International Conference on Data Mining,ICDM, pages 1109–1114, 2013.
Liam Li, Kevin Jamieson, Afshin Rostamizadeh, Ekaterina Gonina, Jonathan Ben-tzur, Moritz Hardt, Benjamin Recht, and Ameet Talwalkar. A System for MassivelyParallel Hyperparameter Tuning. Proceedings of Machine Learning and Systems,2:230–246, March 2020.
Lisha Li, Kevin Jamieson, Giulia DeSalvo, Afshin Rostamizadeh, and Ameet Tal-walkar. Hyperband: A novel bandit-based approach to hyperparameter optimiza-tion. The Journal of Machine Learning Research, 18(1):6765–6816, January 2017.ISSN 1532-4435.
Linux. The Linux kernel organization. https://www.kernel.org.
Richard Lippmann, William Campbell, and Joseph Campbell. An Overview of theDARPA Data Driven Discovery of Models (D3M) Program. In NIPS Workshop onArtificial Intelligence for Data Science, pages 1–2, 2016.
179

Zachary C. Lipton and Jacob Steinhardt. Troubling Trends in Machine LearningScholarship: Some ML papers suffer from flaws that could mislead the public andstymie future research. Queue, 17(1):45–77, February 2019. ISSN 1542-7730, 1542-7749. doi: 10.1145/3317287.3328534.
David M. Liu and Matthew J. Salganik. Successes and Struggles with ComputationalReproducibility: Lessons from the Fragile Families Challenge. Socius: SociologicalResearch for a Dynamic World, 5:1–21, 2019. doi: 10.1177/2378023119849803.
Ilya Loshchilov and Frank Hutter. CMA-ES for Hyperparameter Optimization ofDeep Neural Networks. arXiv:1604.07269 [cs], April 2016.
Kelvin Lu. Feature engineering and evaluation in lightweight systems. M.eng. thesis,Massachusetts Institute of Technology, 2019.
Yaoli Mao, Dakuo Wang, Michael Muller, Kush R. Varshney, Ioana Baldini, CaseyDugan, and Aleksandra Mojsilović. How Data Scientists Work Together WithDomain Experts in Scientific Collaborations: To Find The Right Answer Or To AskThe Right Question? Proceedings of the ACM on Human-Computer Interaction, 3(GROUP):1–23, December 2019. ISSN 2573-0142. doi: 10.1145/3361118.
Leslie Marsh and Christian Onof. Stigmergic epistemology, stigmergic cognition.Cognitive Systems Research, 9(1):136–149, March 2008. ISSN 1389-0417. doi:10.1016/j.cogsys.2007.06.009.
Michael Meli, Matthew R. McNiece, and Bradley Reaves. How Bad Can It Git?Characterizing Secret Leakage in Public GitHub Repositories. In Network and Dis-tributed Systems Security (NDSS) Symposium, pages 1–15, San Diego, CA, USA,2019. doi: 10.14722/ndss.2019.23418.
Meta Kaggle. Meta Kaggle: Kaggle’s public data on competitions, users, submis-sion scores, and kernels. https://www.kaggle.com/kaggle/meta-kaggle, August2021. Version 539.
Hui Miao, Ang Li, Larry S. Davis, and Amol Deshpande. Towards Unified Dataand Lifecycle Management for Deep Learning. In 2017 IEEE 33rd InternationalConference on Data Engineering (ICDE), pages 571–582, April 2017. doi: 10.1109/ICDE.2017.112.
Justin Middleton, Emerson Murphy-Hill, and Kathryn T. Stolee. Data Analysts andTheir Software Practices: A Profile of the Sabermetrics Community and Beyond.Proceedings of the ACM on Human-Computer Interaction, 4(CSCW1):1–27, May2020. ISSN 2573-0142, 2573-0142. doi: 10.1145/3392859.
Michael Muller, Ingrid Lange, Dakuo Wang, David Piorkowski, Jason Tsay, Q. VeraLiao, Casey Dugan, and Thomas Erickson. How Data Science Workers Work withData: Discovery, Capture, Curation, Design, Creation. In Proceedings of the 2019CHI Conference on Human Factors in Computing Systems, CHI ’19, pages 1–15,
180

New York, NY, USA, May 2019. Association for Computing Machinery. ISBN978-1-4503-5970-2. doi: 10.1145/3290605.3300356.
OAuth Working Group. The OAuth 2.0 authorization framework. RFC 6749, RFCEditor, October 2012. URL https://www.rfc-editor.org/rfc/rfc6749.
ChangYong Oh, Efstratios Gavves, and Max Welling. BOCK : Bayesian Optimizationwith Cylindrical Kernels. In International Conference on Machine Learning, pages3868–3877. PMLR, July 2018.
Randal S. Olson, Nathan Bartley, Ryan J. Urbanowicz, and Jason H. Moore. Evalu-ation of a Tree-based Pipeline Optimization Tool for Automating Data Science. InProceedings of the Genetic and Evolutionary Computation Conference 2016, pages485–492, Denver Colorado USA, July 2016. ACM. ISBN 978-1-4503-4206-3. doi:10.1145/2908812.2908918.
William G. Ouchi. A conceptual framework for the design of organizational controlmechanisms. Management science, 25(9):833–848, 1979.
Shoumik Palkar, James Thomas, Deepak Narayanan, Pratiksha Thaker, Rahul Pala-muttam, Parimajan Negi, Anil Shanbhag, Malte Schwarzkopf, Holger Pirk, SamanAmarasinghe, Samuel Madden, and Matei Zaharia. Evaluating end-to-end opti-mization for data analytics applications in weld. Proceedings of the VLDB En-dowment, 11(9):1002–1015, May 2018. ISSN 2150-8097. doi: 10.14778/3213880.3213890.
Neha Patki, Roy Wedge, and Kalyan Veeramachaneni. The Synthetic Data Vault.In 2016 IEEE International Conference on Data Science and Advanced Analytics(DSAA), pages 399–410, October 2016. doi: 10.1109/DSAA.2016.49.
Christian Payne. On the security of open source software. Information systemsjournal, 12(1):61–78, 2002.
Zhenhui Peng, Jeehoon Yoo, Meng Xia, Sunghun Kim, and Xiaojuan Ma. Exploringhow software developers work with mention bot in github. In Proceedings of theSixth International Symposium of Chinese CHI on – ChineseCHI ’18, pages 152–155. ACM Press, 2018. ISBN 978-1-4503-6508-6. doi: 10.1145/3202667.3202694.
Project Jupyter Contributors. jupyterlab-google-drive. https://github.com/jupyterlab/jupyterlab-google-drive, a. Accessed on 2021-01-10 (commitab727c4).
Project Jupyter Contributors. Jupyterlab github. https://github.com/jupyterlab/jupyterlab-github, b. Accessed on 2021-01-10 (commit 065aa44).
Alexander Ratner, Christopher De Sa, Sen Wu, Daniel Selsam, and Christopher Ré.Data programming: Creating large training sets, quickly. Advances in neural in-formation processing systems, 29:3567–3575, 2016.
181

Alexander Ratner, Stephen H. Bach, Henry Ehrenberg, Jason Fries, Sen Wu, andChristopher Ré. Snorkel: Rapid Training Data Creation with Weak Supervi-sion. Proceedings of the VLDB Endowment, 11(3):269–282, November 2017. ISSN21508097. doi: 10.14778/3157794.3157797.
Eric Raymond. The cathedral and the bazaar. Knowledge, Technology & Policy, 12(3):23–49, 1999.
Nancy E. Reichman, Julien O. Teitler, Irwin Garfinkel, and Sara S. McLanahan.Fragile Families: Sample and design. Children and Youth Services Review, 23(4-5):303–326, 2001. ISSN 01907409. doi: 10.1016/S0190-7409(01)00141-4.
Cedric Renggli, Bojan Karlaš, Bolin Ding, Feng Liu, Kevin Schawinski, WentaoWu, and Ce Zhang. Continuous Integration of Machine Learning Models Withease.ml/ci: Towards a Rigorous Yet Practical Treatment. In Proceedings of the 2ndSysML Conference, pages 1–12, 2019.
Jeffrey A. Roberts, Il-Horn Hann, and Sandra A. Slaughter. Understanding the mo-tivations, participation, and performance of open source software developers: Alongitudinal study of the apache projects. Management science, 52(7):984–999,2006.
Matthew Rocklin. Dask: Parallel Computation with Blocked algorithms and TaskScheduling. In Python in Science Conference, pages 126–132, Austin, Texas, 2015.doi: 10.25080/Majora-7b98e3ed-013.
Andrew Slavin Ross and Jessica Zosa Forde. Refactoring Machine Learning. InWorkshop on Critiquing and Correcting Trends in Machine Learning at NeuRIPS2018, pages 1–6, 2018.
Adam Rule, Aurélien Tabard, and James D. Hollan. Exploration and Explanation inComputational Notebooks. In Proceedings of the 2018 CHI Conference on HumanFactors in Computing Systems, pages 1–12, Montreal QC Canada, April 2018.ACM. ISBN 978-1-4503-5620-6. doi: 10.1145/3173574.3173606.
Per Runeson and Martin Höst. Guidelines for conducting and reporting case studyresearch in software engineering. Empirical Software Engineering, 14(2):131–164,Apr 2009. ISSN 1382-3256, 1573-7616. doi: 10.1007/s10664-008-9102-8.
Adam Sadilek, Stephanie Caty, Lauren DiPrete, Raed Mansour, Tom Schenk, MarkBergtholdt, Ashish Jha, Prem Ramaswami, and Evgeniy Gabrilovich. Machine-learned epidemiology: Real-time detection of foodborne illness at scale. npj DigitalMedicine, pages 1–7, December 2018. ISSN 2398-6352. doi: 10.1038/s41746-018-0045-1.
Matthew J. Salganik, Ian Lundberg, Alexander T. Kindel, and Sara McLanahan.Introduction to the Special Collection on the Fragile Families Challenge. Socius:Sociological Research for a Dynamic World, 5:1–21, January 2019. ISSN 2378-0231,2378-0231. doi: 10.1177/2378023119871580.
182

Matthew J. Salganik, Ian Lundberg, Alexander T. Kindel, et al. Measuring thepredictability of life outcomes with a scientific mass collaboration. Proceedings ofthe National Academy of Sciences, 117(15):8398–8403, April 2020. ISSN 0027-8424,1091-6490. doi: 10.1073/pnas.1915006117.
Iflaah Salman and Burak Turhan. Effect of time-pressure on perceived and actualperformance in functional software testing. In Proceedings of the 2018 InternationalConference on Software and System Process - ICSSP ’18, pages 130–139. ACMPress, 2018. ISBN 978-1-4503-6459-1. doi: 10.1145/3202710.3203148.
Shubhra Kanti Karmaker Santu, Md Mahadi Hassan, Micah J. Smith, Lei Xu,ChengXiang Zhai, and Kalyan Veeramachaneni. AutoML to Date and Beyond:Challenges and Opportunities. arXiv:2010.10777 [cs], May 2021.
Gerald Schermann, Jürgen Cito, Philipp Leitner, and Harald Gall. Towards qualitygates in continuous delivery and deployment. In 2016 IEEE 24th InternationalConference on Program Comprehension (ICPC), pages 1–4, May 2016. doi: 10.1109/ICPC.2016.7503737.
D. Sculley, Gary Holt, Daniel Golovin, Eugene Davydov, Todd Phillips, DietmarEbner, Vinay Chaudhary, Michael Young, Jean-François Crespo, and Dan Den-nison. Hidden technical debt in machine learning systems. Advances in NeuralInformation Processing Systems, pages 2494–2502, 2015.
Zeyuan Shang, Emanuel Zgraggen, Benedetto Buratti, Ferdinand Kossmann, PhilippEichmann, Yeounoh Chung, Carsten Binnig, Eli Upfal, and Tim Kraska. Democra-tizing Data Science through Interactive Curation of ML Pipelines. In Proceedings ofthe 2019 International Conference on Management of Data - SIGMOD ’19, pages1171–1188, Amsterdam, Netherlands, 2019. ACM Press. ISBN 978-1-4503-5643-5.doi: 10.1145/3299869.3319863.
Ben Shneiderman, Catherine Plaisant, Maxine Cohen, Steven Jacobs, NiklasElmqvist, and Nicholas Diakopoulos. Designing the user interface: strategies foreffective human-computer interaction. Pearson, 2016.
Micah J. Smith. Scaling collaborative open data science. S.M. Thesis, MassachusettsInstitute of Technology, 2018.
Micah J. Smith, Roy Wedge, and Kalyan Veeramachaneni. FeatureHub: Towardscollaborative data science. In 2017 IEEE International Conference on Data Scienceand Advanced Analytics (DSAA), pages 590–600, October 2017.
Micah J. Smith, Carles Sala, James Max Kanter, and Kalyan Veeramachaneni. TheMachine Learning Bazaar: Harnessing the ML Ecosystem for Effective SystemDevelopment. In Proceedings of the 2020 ACM SIGMOD International Conferenceon Management of Data, SIGMOD ’20, pages 785–800, Portland, OR, USA, 2020.Association for Computing Machinery. ISBN 978-1-4503-6735-6. doi: 10.1145/3318464.3386146.
183

Micah J. Smith, Jürgen Cito, Kelvin Lu, and Kalyan Veeramachaneni. Enablingcollaborative data science development with the Ballet framework. Proceedings ofthe ACM on Human-Computer Interaction, 5(CSCW2):1–39, October 2021a. doi:10.1145/3479575.
Micah J. Smith, Jürgen Cito, and Kalyan Veeramachaneni. Meeting in the notebook:A notebook-based environment for micro-submissions in data science collabora-tions. arXiv:2103.15787 [cs], March 2021b.
Jasper Snoek, Hugo Larochelle, and Ryan P. Adams. Practical Bayesian optimizationof machine learning algorithms. In Proceedings of the 25th International Conferenceon Neural Information Processing Systems - Volume 2, NIPS’12, pages 2951–2959,Red Hook, NY, USA, December 2012. Curran Associates Inc.
Julian Spector. Chicago Is Using Data to Predict Food Safety Violations. So WhyAren’t Other Cities? Bloomberg.com, January 2016.
Kate Stewart, Shuah Khan, Daniel M. German, Greg Kroah-Hartman, Jon Cor-bet, Konstantin Ryabitsev, David A. Wheeler, Jason Perlow, Steve Winslow, MikeDolan, Craig Ross, and Alison Rowan. 2020 Linux Kernel History Report. Technicalreport, The Linux Foundation, August 2020.
Stockfish. Stockfish: A strong open source chess engine. https://stockfishchess.org. Accessed 2019-09-05.
Emma Strubell, Ananya Ganesh, and Andrew McCallum. Energy and Policy Con-siderations for Deep Learning in NLP. In Proceedings of the 57th Annual Meetingof the Association for Computational Linguistics, pages 3645–3650, Florence, Italy,2019. Association for Computational Linguistics. doi: 10.18653/v1/P19-1355.
Krishna Subramanian, Nur Hamdan, and Jan Borchers. Casual notebooks and rigidscripts: Understanding data science programming. In 2020 IEEE Symposiumon Visual Languages and Human-Centric Computing (VL/HCC), pages 1–5, Aug2020. doi: 10.1109/VL/HCC50065.2020.9127207.
Thomas Swearingen, Will Drevo, Bennett Cyphers, Alfredo Cuesta-Infante, ArunRoss, and Kalyan Veeramachaneni. ATM: A distributed, collaborative, scalablesystem for automated machine learning. In 2017 IEEE International Conferenceon Big Data (Big Data), pages 151–162, Boston, MA, December 2017. IEEE. ISBN978-1-5386-2715-0. doi: 10.1109/BigData.2017.8257923.
Chris Thornton, Frank Hutter, Holger H. Hoos, and Kevin Leyton-Brown. Auto-WEKA: Combined selection and hyperparameter optimization of classification al-gorithms. In Proceedings of the 19th ACM SIGKDD International Conference onKnowledge Discovery and Data Mining, KDD ’13, pages 847–855, New York, NY,USA, August 2013. Association for Computing Machinery. ISBN 978-1-4503-2174-7. doi: 10.1145/2487575.2487629.
184

Tom van der Weide, Dimitris Papadopoulos, Oleg Smirnov, Michal Zielinski, andTim van Kasteren. Versioning for End-to-End Machine Learning Pipelines. InProceedings of the 1st Workshop on Data Management for End-to-End MachineLearning - DEEM’17, pages 1–9, Chicago, IL, USA, 2017. ACM Press. ISBN 978-1-4503-5026-6. doi: 10.1145/3076246.3076248.
Jan N. van Rijn, Salisu Mamman Abdulrahman, Pavel Brazdil, and Joaquin Van-schoren. Fast Algorithm Selection Using Learning Curves. In Elisa Fromont, TijlDe Bie, and Matthijs van Leeuwen, editors, Advances in Intelligent Data AnalysisXIV, volume 9385, pages 298–309. Springer International Publishing, Cham, 2015.ISBN 978-3-319-24464-8 978-3-319-24465-5. doi: 10.1007/978-3-319-24465-5_26.
Joaquin Vanschoren, Jan N. van Rijn, Bernd Bischl, and Luís Torgo. OpenML:Networked science in machine learning. SIGKDD Explorations, 15:49–60, 2013.
Bogdan Vasilescu, Stef van Schuylenburg, Jules Wulms, Aerebrenik Serebrenik,and Mark. G. J. van den Brand. Continuous Integration in a Social-CodingWorld: Empirical Evidence from GitHub. In 2014 IEEE International Confer-ence on Software Maintenance and Evolution, pages 401–405, September 2014.doi: 10.1109/ICSME.2014.62.
Bogdan Vasilescu, Yue Yu, Huaimin Wang, Premkumar Devanbu, and VladimirFilkov. Quality and productivity outcomes relating to continuous integration inGitHub. Proceedings of the 2015 10th Joint Meeting on Foundations of SoftwareEngineering - ESEC/FSE 2015, pages 805–816, 2015.
Kalyan Veeramachaneni, Una-May O’Reilly, and Colin Taylor. Towards Feature En-gineering at Scale for Data from Massive Open Online Courses. arXiv:1407.5238[cs], 2014.
Kiri L. Wagstaff. Machine Learning that Matters. In Proceedings of the 29th Inter-national Conference on Machine Learning, pages 1–6, Edinburgh, Scotland, UK,2012.
April Yi Wang, Anant Mittal, Christopher Brooks, and Steve Oney. How DataScientists Use Computational Notebooks for Real-Time Collaboration. Proceedingsof the ACM on Human-Computer Interaction, 3(CSCW):1–30, November 2019a.ISSN 2573-0142. doi: 10.1145/3359141.
Dakuo Wang, Justin D. Weisz, Michael Muller, Parikshit Ram, Werner Geyer, CaseyDugan, Yla Tausczik, Horst Samulowitz, and Alexander Gray. Human-AI Col-laboration in Data Science: Exploring Data Scientists’ Perceptions of AutomatedAI. Proceedings of the ACM on Human-Computer Interaction, 3(CSCW):1–24,November 2019b. ISSN 2573-0142, 2573-0142. doi: 10.1145/3359313.
Dakuo Wang, Q. Vera Liao, Yunfeng Zhang, Udayan Khurana, Horst Samulowitz,Soya Park, Michael Muller, and Lisa Amini. How Much Automation Does a DataScientist Want? arXiv:2101.03970 [cs], January 2021.
185

Hao Wang, Bas van Stein, Michael Emmerich, and Thomas Back. A new acquisitionfunction for Bayesian optimization based on the moment-generating function. In2017 IEEE International Conference on Systems, Man, and Cybernetics (SMC),pages 507–512, October 2017. doi: 10.1109/SMC.2017.8122656.
Jing Wang, Meng Wang, Peipei Li, Luoqi Liu, Zhongqiu Zhao, Xuegang Hu, andXindong Wu. Online Feature Selection with Group Structure Analysis. IEEETransactions on Knowledge and Data Engineering, 27(11):3029–3041, 2015.
Qianwen Wang, Yao Ming, Zhihua Jin, Qiaomu Shen, Dongyu Liu, Micah J. Smith,Kalyan Veeramachaneni, and Huamin Qu. ATMSeer: Increasing Transparencyand Controllability in Automated Machine Learning. In Proceedings of the 2019CHI Conference on Human Factors in Computing Systems, pages 1–12, GlasgowScotland Uk, May 2019c. ACM. ISBN 978-1-4503-5970-2. doi: 10.1145/3290605.3300911.
Wei Wang, Jinyang Gao, Meihui Zhang, Sheng Wang, Gang Chen, Teck Khim Ng,Beng Chin Ooi, Jie Shao, and Moaz Reyad. Rafiki: Machine learning as an analyticsservice system. Proceedings of the VLDB Endowment, 12(2):128–140, October 2018.ISSN 21508097. doi: 10.14778/3282495.3282499.
Sarah Wooders, Peter Schafhalter, and Joseph E. Gonzalez. Feature Stores: TheData Side of ML Pipelines. https://medium.com/riselab/feature-stores-the-data-side-of-ml-pipelines-7083d69bff1c, April 2021.
Xindong Wu, Kui Yu, Wei Ding, Hao Wang, and Xingquan Zhu. Online featureselection with streaming features. IEEE Transactions on Pattern Analysis andMachine Intelligence, 35(5):1178–1192, 2013.
Doris Xin, Eva Yiwei Wu, Doris Jung-Lin Lee, Niloufar Salehi, and AdityaParameswaran. Whither AutoML? Understanding the Role of Automation in Ma-chine Learning Workflows. arXiv:2101.04834 [cs], January 2021.
Lei Xu, Maria Skoularidou, Alfredo Cuesta-Infante, and Kalyan Veeramachaneni.Modeling tabular data using conditional gan. In NeurIPS, 2019.
Qian Yang, Jina Suh, Nan-Chen Chen, and Gonzalo Ramos. Grounding interactivemachine learning tool design in how non-experts actually build models. Proceedingsof the 2018 on Designing Interactive Systems Conference 2018 - DIS ’18, pages573–584, 2018. doi: 10.1145/3196709.3196729.
Quanming Yao, Mengshuo Wang, Yuqiang Chen, Wenyuan Dai, Yu-Feng Li, Wei-WeiTu, Qiang Yang, and Yang Yu. Taking Human out of Learning Applications: ASurvey on Automated Machine Learning. arXiv:1810.13306 [cs, stat], December2019.
Kui Yu, Xindong Wu, Wei Ding, and Jian Pei. Scalable and accurate online featureselection for big data. TKDD, 11:16:1–16:39, 2016.
186

Liguo Yu and Srini Ramaswamy. Mining CVS repositories to understand open-sourceproject developer roles. In Fourth International Workshop on Mining SoftwareRepositories (MSR’07: ICSE Workshops 2007), pages 1–8. IEEE, 2007.
Matei Zaharia, Reynold S. Xin, Patrick Wendell, Tathagata Das, Michael Armbrust,Ankur Dave, Xiangrui Meng, Josh Rosen, Shivaram Venkataraman, Michael J.Franklin, Ali Ghodsi, Joseph Gonzalez, Scott Shenker, and Ion Stoica. ApacheSpark: A unified engine for big data processing. Communications of the ACM, 59(11):56–65, October 2016. ISSN 0001-0782, 1557-7317. doi: 10.1145/2934664.
Amy X. Zhang, Michael Muller, and Dakuo Wang. How do Data Science WorkersCollaborate? Roles, Workflows, and Tools. Proceedings of the ACM on Human-Computer Interaction, 4(CSCW1):1–23, May 2020. ISSN 2573-0142, 2573-0142.doi: 10.1145/3392826.
Yangyang Zhao, Alexander Serebrenik, Yuming Zhou, Vladimir Filkov, and BogdanVasilescu. The impact of continuous integration on other software developmentpractices: A large-scale empirical study. In 2017 32nd IEEE/ACM InternationalConference on Automated Software Engineering (ASE), pages 60–71, October 2017.doi: 10.1109/ASE.2017.8115619.
Jing Zhou, Dean Foster, Robert Stine, and Lyle Ungar. Streaming feature selectionusing alpha-investing. Proceeding of the eleventh ACM SIGKDD international con-ference on Knowledge discovery in data mining - KDD ’05, pages 384–393, 2005.
187