A Cognitive Model of Collaborative Acts John T. Nosek Temple University ©2002.

Collaborative Learning Team Formation:A Cognitive Modeling Perspective
Yuping Liu1, Qi Liu1, Runze Wu1, Enhong Chen1(B), Yu Su2,Zhigang Chen1, and Guoping Hu3
1 University of Science and Technology of China, Hefei 230026, China{liuyup,wrz179}@mail.ustc.edu.cn,
{qiliuql,cheneh}@ustc.edu.cn, [email protected] Anhui University, Hefei, China
[email protected] Anhui USTC IFLYTEK Co., Ltd., Hefei, China
Abstract. With a number of students, the purpose of collaborativelearning is to assign these students to the right teams so that the pro-motion of skills of each team member can be facilitated. Although someteam formation solutions have been proposed, the problem of extract-ing more effective features to describe the skill proficiency of studentsfor better collaborative learning is still open. To that end, we provide afocused study on exploiting cognitive diagnosis to model students’ skillproficiency for team formation. Specifically, we design a two-stage frame-work. First, we propose a cognitive diagnosis model SDINA, which canautomatically quantify students’ skill proficiency in continuous values.Then, given two different objectives, we propose corresponding algo-rithms to form collaborative learning teams based on the cognitive mod-eling results of SDINA. Finally, extensive experiments demonstrate thatSDINA could model the students’ skill proficiency more precisely andthe proposed algorithms can help generate collaborative learning teamsmore effectively.
1 Introduction
Collaborative learning is the instructional use of small heterogeneous group ofstudents who team together (e.g., 5 to 8 students [10]) to work on a structuredactivity. Over the past decades, many researches have confirmed the effective-ness of this type of learning [23]. By maximizing the promotion of skills of stu-dents, collaborative learning can not only help stdd,ents exhibit higher academicachievement, but also can reduce the workload of instructors [22].
Indeed, the success of collaborative learning can be only guaranteed by assign-ing each student to the right team. Generally speaking, two types of solutions,based on manual decisions or automatical algorithms, have been studied for thisteam formation problem. In manual approaches, students may select their ownteammates [11], or teams are assigned by instructors [20]. Unfortunately, by
c© Springer International Publishing Switzerland 2016S.B. Navathe et al. (Eds.): DASFAA 2016, Part II, LNCS 9643, pp. 383–400, 2016.DOI: 10.1007/978-3-319-32049-6 24
384 Y. Liu et al.
self-selecting best students tend to cluster and leave weak ones to shift for them-selves. By instructors-assigning, it is almost impossible for instructors to assignall students effectively. Thus, it is necessary to form learning teams automati-cally. Based on students’ specific characteristics, some researchers focus on gen-erating heterogenous teams which mix students of different levels [14], while oth-ers try to form teams which can quantize and maximize the gain of students [1].Usually, characteristics of students in these studies are directly extracted fromthe biographical data, simple performance attributes or personality traits [27].Meanwhile, without the real-world data, simulated values on these characteris-tics are used to design the team formation algorithms [2,12,13,18,27]. In spite ofthe importance of the existing research, features in these studies are too simpleto capture students’ skill proficiency very well, and thus, the performance of thecorresponding team formation solutions could be further improved. Actually, oneof the best ways to get the skill proficiency of students is to model the cognitiveinformation of them, e.g., from their performance in the exams [4,8]. However,there are still two challenges to be addressed for exploiting cognitive diagnosis.Firstly, how to precisely quantify the skill proficiency of students? Secondly, howto design the appropriate algorithms to automatically get collaborative learningteams based on this type of feature?
To conquer these two challenges, we propose a two-stage framework to applycognitive diagnosis for collaborative learning team formation. Specifically, in thefirst stage we propose a novel cognitive diagnosis model Soft-DINA (SDINA).Compared to the existing diagnosis model DINA [4,21], which quantifies thestudents’ skill proficiency in binary values (either 0 or 1), SDINA is able tomodel students with continuous values. Then, the output of SDINA is furtherexploited to generate collaborative learning teams in the second stage. Followingthe views that students in the same team should be diverse and the improvementof each student should be maximized, we consider two optimization objectives –dissimilarity based objective and gain based objective, and we propose effectivealgorithms to generate collaborative learning teams for each of these objectives.Finally, the results of extensive experiments demonstrate that (1) SDINA couldmodel the students’ skill proficiency by predicting their performance (i.e., examscores) more precisely, and (2) the proposed algorithms can help generate col-laborative learning teams effectively under several evaluation metrics. The maincontributions of this paper could be summarized as:
– To the best of our knowledge, this is the first comprehensive attempt for theproblem of collaborative learning team formation by introducing cognitivediagnosis to extract features of students’ skill proficiency.
– We propose a novel cognitive diagnosis model SDINA, which improves exist-ing model DINA. SDINA automatically quantifies students’ skill proficiencyin continuous values for more accurate analysis of students.
– Given students’ skill proficiency, we propose two objectives following the exist-ing research achievements, and then we design effective algorithms to generatecollaborative learning teams for each of these objectives.
Collaborative Learning Team Formation: A Cognitive Modeling Perspective 385
2 Related Work
In this section, we will introduce the related studies in two categories.
2.1 Student Modeling
Here we focus on team formation-oriented student modeling methods. In tradi-tional collaborative team formation problems, the students were modeled by fea-tures extracted directly from biographical data like age, gender, or some simpleperformance attributes like grades, self-evaluation, peer-assessment, or personal-ity traits like learning styles [27]. For instance, Hwang et al. [15] considered thenumber of already known concepts and scores of a pre-test to model students.
Though few of existing team formation studies explored examination records,this kind of data has been widely used for other student modeling tasks, e.g.,performance prediction. Many data mining efforts have been conducted, forinstance, matrix factorization (MF) technique [19] has been adopted by con-sidering student as user, problem as item, and student’s score on a problemas rating. E.g., Toscher et al. [25] utilized singular value decomposition (SVD)to model and predict students. But, latent factors of students inferred by MFare unexplainable which limits the applicability of MF in scenarios where theexplanation of skills need to be specified.
To model students with examination data in an interpretative way, psycho-metricians in education psychology have developed a series of cognitive diagnosismodels (CDMs) [8]. By capturing the students’ cognitive characteristics, CDMscan predict students’ performance and obtain targeted remedy plan for eachstudent. Generally speaking, there are two main categories of CDMs: continuousones and discrete ones. The fundamental continuous CDMs are item responsetheory (IRT ) models [9], which characterize a student by a continuous variable,i.e., latent trait. However, IRT is unable to get the latent cognitive character likestudents’ skill proficiency. For discrete CDMs, the basic method is determinis-tic inputs, noisy “and” gate model (DINA) [4,21]. DINA describes a studentby a latent binary vector variable which denotes whether she masters the skillsrequired by the exam or not. And the specific relationship between problems andskills is a prior knowledge given by education experts (e.g. the exam designer).E.g., based on fuzzy system, Runze Wu et al. [26] proposed a solution for cogni-tive examinee modeling from both objective and subjective problems.
2.2 Team Formation
Existing studies on collaborative learning team formation can be broadly split intotwo basic types. The first type focuses on forming heterogenous or homogeneousteams considering multiple student characteristics. E.g., authors in [18] designedan algorithm named SPOS to form heterogeneous teams. Similarly, the fuzzy c-means and random selection algorithm were used in [2] for formulating homoge-nous and heterogeneous teams. Unfortunately, all these works implemented theiralgorithms based on simulated student characteristics. The second type focuses on

386 Y. Liu et al.
forming teams which can maximize the gain of students. E.g., Rakesh et al. [1] pro-posed a framework for grouping students in order to maximize the overall gain ofstudents. Given specific objectives, there are also researches which formed teamsthrough optimization methods. E.g.,Virginia et al. [27] proposed a deterministiccrowing evolutionary algorithm to form teams. However, few of the existing teamformations exploit cognitive diagnosis results as features to better model students.Therefore, the problem of how to apply this type of feature to design more suitableteam formation solutions is still open.
Besides collaborative learning team formation, the traditional team forma-tion problem usually focused on forming a team from a large set of candidatesof experts such that the resulting team is best suited to perform the assign-ment. This kind of team formation entails set-cover and is modeled by experts’skills and their collaboration network [16]. In contrast, the collaborative teamformation problem is a partition problem rather than a set-cover one.
3 Collaborative Learning Team Formation
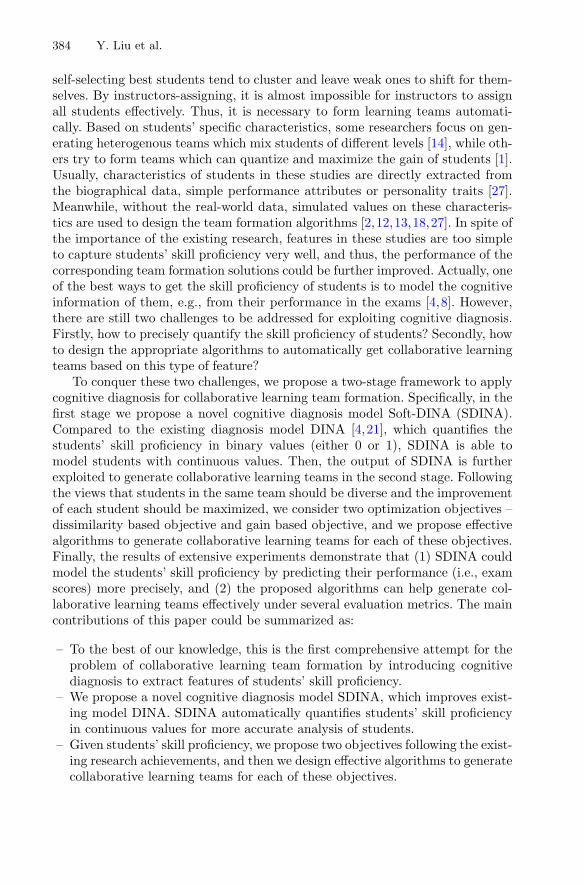
We will introduce details of our two-stage framework in this section. The flow-chart is shown in Fig. 1. Given students’ examination results, we propose a cog-nitive diagnosis model SDINA to automatically quantify the skill proficiencyof students. Then, we propose two objectives with heuristic algorithms to formcollaborative learning teams which can facilitate the promotion of all students.
Teamformation
Teams
00.20.40.60.8
1Skill proficiency
Studentmodeling
Exam Students
Gainbased
objec veTeam formation
Algorithms
Dissimilarity based
objec ve
Input
Stage1
Stage2
Output
Cognitivediagnostic model
(SDINA)
Fig. 1. Our two-stage framework.
S1S2
S3
S4
S5
S6S7
S8
S9
S10
S11
1
2
Fig. 2. Example of students’ pro-ficiency in skills S1 to S11.
3.1 Cognitive Modeling of Students’ Skill Proficiency
In the following, we assume there are U students P = {P1, P2, . . . , PU}, partic-ipating in the same course, e.g., math. We also assume S ={S1, S2, . . . , SV } tobe a universe of V skills in this course, e.g., skills in a math course may includemath concepts like set, formulas like computing sphere volume, process skills

Collaborative Learning Team Formation: A Cognitive Modeling Perspective 387
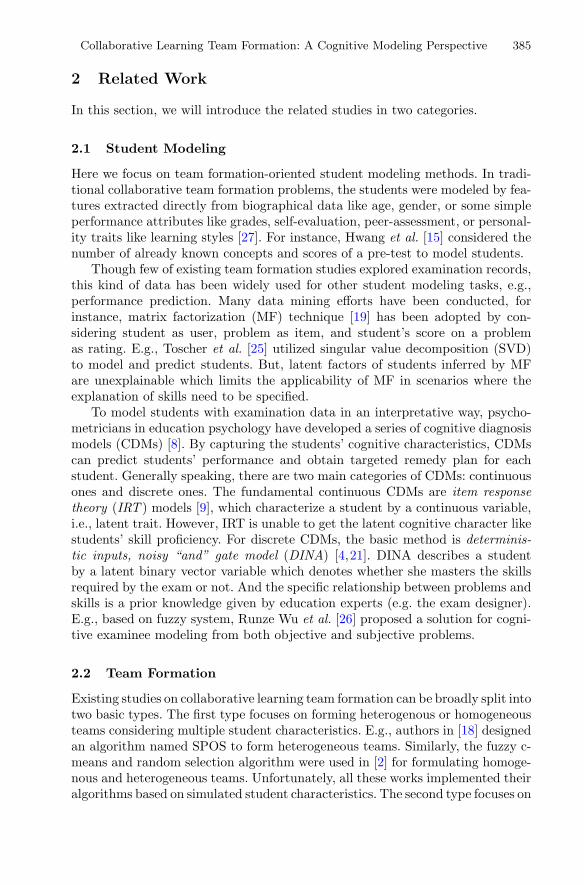
like calculation or induction. After cognitive modeling, each Pi will be associ-ated with a vector of skill proficiency αi = {αi1, αi2, . . . , αiV }, where αij rangesfrom 0 to 1 and represents that Pi’ proficiency in Sj is αij . We summarize theproficiency of all students in all skills as α = {α1, α2, . . . , αU}, which need tobe evaluated according to an examination. Actually, Fig. 2 shows the proficiencyof 2 real-world students in skills S1 to S11, which is the output by our SDINA.Although the two students have similar average abilities (about 0.5), there arestill distinctively differences in their proficiency in certain skills. If these twostudents are put into a same team, they can learn from others’ strong points tooffset their own weakness. We will first briefly review the traditional cognitivediagnosis model DINA, and then show the way to get α by our SDINA.
DINA Review. DINA [4] (the deterministic inputs, noisy and gate model)assumes that each problem in an exam is involved with multiple predefined skills(tagged by education experts in advance), and then it characterizes a studentby a binary vector variable, which denotes whether she has mastered the skillsrequired in the exam. Specifically, for an exam designed to assess V skills ofstudents, given a problem l, a student i, we observe a dichotomous responsewhich is a binary variable Ril with a value in {0, 1}. The response indicatesthe correctness of the answer provided by the student i to the problem l, i.e., 1represents true and 0 represents false. Then, DINA is defined as:
P (Ril = 1|αi, sl, gl) = (1 − sl)ηilg1−ηil
l . (1)
Here, student i is characterized by a latent binary vector variable αi =(αi1, αi2, . . . , αiV ), i.e., αij = 1 represents that student i has mastered skill jand vice versa, and problem l is characterized by two parameters: sl representscarelessness or slipping; gl is a guessing parameter. ηil is a latent variable thatindicates whether student i is able to solve the problem l, and is defined asηil =
∏Vj=1 α
qlj
ij where qlj indicates whether problem l requires skill j. It meansstudent i is disable to solve problem l unless all of the skills required for probleml have already been mastered by her. As for parameter estimation, we couldmaximize the marginalized likelihood of Eq. (1), which can be implementedusing EM algorithm [3]. Then, with the estimated parameters s1, s2, · · · , sZ andg1, g2, · · · , gZ (Z is the number of problems), αi can be determined via maxi-mizing the posterior probability given student i’s response vector:
αi = argmaxαP (α|Ri) = argmaxαL(Ri|α, sl, gl)P (α)= argmaxαL(Ri|α, sl, gl) = argmaxα
∏Zl=1 P (Ri|α, sl, gl),
(2)
Thus, for an exam with V skills, α has 2V possible patterns and each patternis assumed to be with an equal prior distribution without loss of generality.
Soft-DINA. In DINA, binary skill vector αi of each student i can be found bymaximizing the posterior probability. Though it is intuitive, this binary repre-sentation of students’ skill proficiency is too coarse to characterize the mastery

388 Y. Liu et al.
degree (cognitive level) of students. For instance, a student with a mastery degreeof 0.9 in a specific skill and a student with 0.6 may have the same binary valueof 1 based on DINA, while the significant difference is missing. For the sake ofkeeping as much information of vectors of proficiency as possible, we proposeanother cognitive model Soft-DINA or SDINA for short, which is an improve-ment of DINA, to get vectors of proficiency with continuous values.
Specifically, considering the 2V kinds of α from all zeros (0, 0, . . . , 0) to allones (1, 1, . . . , 1) and given the responses of a student i, Ri, each of these α isinvolved with one posterior probability P (α|Ri), DINA only chooses the specificskill vector α which can maximize the posterior probability. To precisely measurethe probability that the student i masters a specific skill j, we propose to considerthe posterior probability from all the possible α. Formally, in SDINA, we redefinethe estimated skill vector αi and calculate the posterior probability that studenti masters skill j as follows:
αij = P (αij = 1|Ri) =∑
αxj=1 P (αx|Ri)∑2V
x=1 P (αx|Ri)
=∑
αxj=1 L(Ri|αx,sl,gl)P (αx)∑2V
x=1 P (αx|Ri)=∑
αxj=1∏Z
l=1 L(Ril|αx,sl,gl)P (αx)∑2V
x=1 P (αx|Ri),
(3)
where x = 1, 2, . . . , 2V , represents the 2V kinds of possible αi, and the numeratorpart computes the probability of αij = 1 in these 2V kinds of possible αx. Tosimplify the formulation, we also assume each αx has an equal prior probability,then the equation above can be rewritten as follows:
αij =
∑αxj=1
∏Zl=1 L(Ril|αx, sl, gl)
∑2V
x=1
∏Zl=1 L(Ril|αx, sl, gl)
. (4)
In this way, we get αi = (αi1, αi2, . . . , αiV ), a vector of continuous values between0 and 1, where αij represents student i’s proficiency(i.e. probability) in skill j.That is to say, αij = 1 means i has fully mastered skill j, and αij = 0 means ihas not mastered skill j at all.
Note that, although the skills accessed by each problem are manually labeled,it is feasible and commonly used in pedagogy [8]. In fact, to construct an exami-nation, designers must clearly delineate the assement purpose, specically describewhat skills are measured and develop proper assessment tasks1.
3.2 Collaborative Learning Team Formation
In this subsection, we show the way to form teams based on α. Assume G ={G1, G2, . . . , GM} to be a set of M teams. We will put students into teams, withtwo basic constraints. Firstly, only one team is assigned to a student, makingsure that a student only belongs to one team. Secondly, the team size is betterto be equal, with a difference of no more than one student, to ensure fairness and1 There are also studies about the automatic labeling of skills [7], which is beyond the
scope of our research.

Collaborative Learning Team Formation: A Cognitive Modeling Perspective 389
team balance. Formally, given the students’ skill proficiency, the collaborativelearning team formation problem can be formulated as follows.
Problem 1 (Collaborative Learning Team Formation): Given a set of studentsP, each student Pi’s proficiency αi = (αi1, αi2, . . . , αiV ), and a set of teamsG = {G1, G2, . . . , GM}. Under the following constraints,
Gk1
⋂Gk2 = ∅,
−1 ≤ |Gk1 | − |Gk2 | ≤ 1,k1, k2 = 1, 2, . . . ,M, k1 �= k2
(5)
assign every student Pi to a team Gk, Pi ⊆ Gk, k = 1, 2, . . . ,M . In order that,the promotion of all students in these V skills can be facilitated.
With this definition, we should first clarify the measurements/objectives of agood team, and then, the specific algorithms to generate effective collaborativelearning teams in terms of these objectives could be designed. Generally, thereare two types of different objectives in existing studies, i.e., the skill proficiencyof students in the same team should be heterogeneous [14] and the improvementof each student should be maximized [1]. In terms of these objectives and ourextracted feature, we propose a dissimilarity based objective to form teams bymaximizing the average dissimilarity of students within a team and a gain basedobjective to form teams by maximizing the average gain of students, respectively.
Dissimilarity Based Objective. According to [13], in a reasonably hetero-geneous group student-scores reveal a combination of low, average and highstudent-scores. However, this measurement is limited to 3 discrete classes ofonly one attribute value (student-score). Indeed, a better mechanism is to usecontinuous values of several attributes, e.g., the continuous value of students’proficiency in several skills. Inspired by the heterogeneity definition in [12], wealso use the average dissimilarity between team members as the metric of het-erogeneous degree. Without loss of generality, the difference between Pi1 andPi2 in the proficiency of Sj , Dj(Pi1 , Pi2), is defined as |αi1j − αi2j |. Thus, theheterogeneity of Gk consisting of N students with respect to Sj , is defined as
HGk(Sj) =∑N
i=2Dj(Pi, Pi−1). (6)
Here, the students in Gk have been sorted by values of skill proficiency in Sj ,i.e., α1j ≤ α2j ≤ . . . ≤ αNj . Then, the heterogeneity of Gk is computed as
HGk =∑V
j=1HGk(Sj). (7)
One step further, the heterogeneity of the solution G is the average of the het-erogeneity of all teams in the solution, i.e.,
HG(G) =
∑Gk∈G HGk
|G| . (8)
390 Y. Liu et al.
Since not only heterogeneity but also the team balance, i.e., the difference of theheterogeneity among the teams, should be considered for the quality of the teamformation solutions [18], we also define the balance of the solution G as
B(G) = V ariance({HGk|∀Gk ∈ G}). (9)
That is, the teams in each solution should be as balanced as possible to ensurethe fairness. Overall, the higher the solution heterogeneity is and the lower thesolution balance is, the better the team formation result is.
Given this dissimilarity based objective, consisting of both solution hetero-geneity HG(G) and solution balance B(G), we utilize the idea of clustering tosolve the team formation problem. Intuitively, students could be first clusteredusing clustering algorithm, e.g., k-means [17], where features are their skill profi-ciency vectors. Then students of same cluster will be assigned to different teams.However,clusters under the classical k-means settings are often of different size,and this will have a negative effect on the team’s heterogeneity. For instance,if there is a cluster with a very large size, which is bigger than the number ofteams, according to the pigeon-hole principle , at least two students in the samecluster will be assigned to the same team. To address this problem, we think ofan improved clustering method called uniform k-means to get uniform clusterswith the same size. More specifically, in the process of k-means, the number ofclusters is set to be � U
M . Then, for every object(student), after calculating thedistance between it and the center of every cluster, this student will be put intocluster which is not merely with shortest distance but also is not full, i.e., sizeof this cluster is no larger than M . After this, students are equally divided into� U
M clusters. Next, students in same cluster should be assigned into M differentcandidate teams. In this way, as students with similar skill proficiency will beput into different teams, the dissimilarity based objective can be easily achieved.The Uniform K -means Based algorithm (UKB), is summarized in Algorithm 1.
Algorithm 1. UKB: the uniform k-means based algorithmRequire:
The set of U students P = {P1, P2, . . . , PU}; The number of teams M ;Ensure:
The set of teams G = {G1, G2, . . . , GM};1: Divide U students into � U
M� clusters using uniform k-means;
2: Determine the size of teams, each one with student number of � UM
� or � UM
� + 1;3: Calculate the number of students that every team still needs;4: for each cluster c do5: while c is not empty do6: Put one student into every not-full team;7: Calculate the number of students that every team still needs;8: end while9: end for
10: return G;

Collaborative Learning Team Formation: A Cognitive Modeling Perspective 391
Gain Based Objective. In addition to the dissimilarity based objective,another intuitive approach of measuring the quality of a team is to quantizethe promotion of every student. Inspired by [1], we define a gain function tomeasure the promotion of students in terms of their skill proficiency.
In collaborative learning teams, the students can promote their skills throughmutual exchanges and emulations. As a general rule, there are two factors whichcan influence the students’ promotion. The first factor is the proficiency of eachstudent, i.e., a student with higher proficiency is easier to promote than a studentwith lower proficiency. Another factor is the gap between her and the otherstudents in the team, i.e., a student who collaborates with more capable team-mate can get more knowledge. According to these facts, we define a student’spromotion in a skill as follows.
Suppose there is a non-empty team Gk with N students Gk = {P1, P2, . . . ,PN}. Gk has a vector of maximum proficiency in every skill ak = {ak1, ak2, . . . ,akV }, akj is the maximum proficiency in Sj among the students in Gk, i.e.,akj = MAX(α1j , α2j , . . . , αNj). Then the leader of Gk in Sj , namely Lkj is thestudent with maximum proficiency in Sj ,
Lkj = {Pi|αij = akj , i = 1, 2, . . . , N}. (10)
Now, we put a new student Pi into Gk, if Pi is not the leader in Sj , i.e., αij < akj ,then Pi’s promotion in Sj , Qj(Pi, Gk), is defined as:
Qj(Pi, Gk) = (akj − αij) · αij . (11)
Here, (akj −αij) is as the gap between Pi and Lkj , which is always positive. Thedefinition is in conformity with the actual situation. For instance, there is a teamwith a leader who has a proficiency of 0.9 in a certain skill, suppose we put threenew students A, B, C with proficiency of 0.2, 0.5, 0.8 respectively in the team.According to our definition, the promotions of them will be 0.14, 0.20, 0.08.A gets a small promotion of 0.14 because A has a low proficiency which bringsbad influence for the promotion, C only gets 0.08 because there is only a littlegap between C and the leader. Only B gets a big promotion of 0.20 due to B’shigher proficiency and the bigger gap between B and the leader. For simplicity,we ignore the leader’s promotion in her leading skill. Then, we define Q(Pi, Gk),the gain of Pi as the overall promotion in every skill,
Q(Pi, Gk) =∑V
j=1Qj(Pi, Gk)= (ak − αi) · αT
i .(12)
Next,the average gain of Gk will be:
Q(Gk) =
∑Pi∈Gk
Q(Pi, Gk)|Gk| . (13)
Here, |Gk| is the number of students in Gk. Finally, the average gain of a solutionG, Q(G), can be defined as the average gain of all the teams,
Q(G) =
∑Gk∈G Q(Gk)
|G| . (14)

392 Y. Liu et al.
We use the solution gain Q(G) as the evaluative criterion for the quality of teamformation solutions. We also propose a team formation algorithm which consistsof two steps: First, the leader in each skill is chosen for each team; Then, all thenon-leader students are put into teams according to their gains.
Specifically, Q(G) is a monotone-increasing function of akj , so for maximizingQ(G), the leader in each skill for each team should have proficiency as greateras possible. Given a set of U students and the number of teams M , the leader-choosing process is as follows. For each skill Sj , firstly we pick out M studentsP = {P1, P2, . . . , PM} with maximum proficiency. Secondly, for every studentPi ∈ P, if Pi has been a leader in a team, then Pi will be the leader in Sj of thisteam; Otherwise, we choose a team Gk which still has no leader in Sj , and if Gk
is not full, then Pi will be the leader in Sj of Gk, or else, a student in Gk withthe maximum proficiency in Sj will be picked out as the leader.
After the leaders have been chosen, we show the way to put all non-leaderstudents into teams. Assume all teams have the same size of λ, and the λ studentsin team Gk are presented by Pki, i = 1, 2, . . . , λ. Then Q(G) will be
Q(G) =∑
Gk∈G Q(Gk)
|G|= 1
|G|·λ · ∑Gk∈G
∑λi=1Q(Pki, Gk).
(15)
Obviously, Q(G) will only be determined by∑
Gk∈G∑λ
i=1 Q(Pki, Gk) since1
|G|·λ is a constant. Also, Q(G) increases with Q(Pki, Gk). As one student can onlybelong to one team, it is naturally to put Pi to Gk which can maximize Q(Pi, Gk).In addition, since size of teams is limited, students with higher proficiency shouldbe put into teams in priority. However, such team formation result violates theprinciple of heterogeneity because students with higher proficiency tend to be putinto teams with higher maximum proficiency. To avoid this unbalanced result,we propose an algorithm which takes both the gain of students and the averagelevel of teams into consideration, to get balanced teams.
To be specific, there are two factors determining the selection of groups fornon-leader students. One is the gain of this student, another is the average levelof the team. Here, we define LPi, the level of a student Pi, as the average ofPi’s proficiency in every skill, and LGk, the average level of a team Gk, as theaverage level of all the students in team Gk,
LPi =
∑Vj=1 αij
V, LGk =
∑Pi∈Gk
LPi
|Gk| .
Then we define a balanced gain vector BGi = {BGi1, BGi2, . . . , BGiM}, whereBGik is called the balanced gain of Pi if putting her to Gk,
BGik =Q(Pi, Gk)
LGk. (16)
With the above definition, the entire process of Balanced Gain Based algo-rithm (BGB), is shown in Algorithm 2. In summary, we first choose the leaders

Collaborative Learning Team Formation: A Cognitive Modeling Perspective 393
Algorithm 2. BGB: the balanced gain based algorithmRequire:
The set of U students P = {P1, P2, . . . , PU}; The number of teams M ;Ensure:
The set of teams G = {G1, G2, . . . , GM};1: Determine the size of teams, each one with student number of � U
M� or � U
M� + 1;
2: Select the leaders in every skill for each team.3: Sort all the non-leader students by their levels LP in descending order;4: for each sorted students Pi do5: Calculate the balanced gain vector BGi;6: Put student Pi in a not-full team Gk with maximum BGik;7: end for8: return G;
in each skill for each team, and then sort all the non-leader students by theirlevels LP in descending order. Next, for each sorted student Pi we put her intoa not-full team Gk with maximum BGik. In this way, the higher level studentswill be put into relatively low level teams and vice versa, getting her a relativelyhigh gain and keeping the heterogeneity of the teams, simultaneously.
4 Experiments
Firstly, we use the prediction of students’ scores to evaluate the effectivenessof SDINA. Secondly, we make an expert evaluation to explore the effectivenessof features extracted by SDINA. At last, we evaluate the performance of ourproposed team formation algorithms from various aspects.
4.1 Experimental Setup
Our experiments are conducted on three real-world datasets and two simulatedones. The real-world datasets contain two real private datasets and a publiconline dataset. The public dataset is Tatsuoka’s fraction subtraction dataset [5],consisting of scores from middle school students on fraction subtraction prob-lems. The two private datasets2 are from two final math exams for high schoolstudents. Each of these three datasets is represented by a score matrix and alsohas multiple predefined skills. We denote these datasets as FrcSub, Math1 andMath2. The brief summary is shown in Table 1. Figure 3 gives a brief previewof these datasets, where each column for each subfigure stands for a problemand each row for a student. The black element means the student is wrong inthe problem, while white one means right. The two simulated datasets are madeup of 500 and 1,000 students with 10 features3. The value of each feature is
2 They will be publicly available after the paper acceptance.3 Unlike the real-world datasets, the simulated ones only consist of students with
values between 0 and 1 on some features rather than students’ test scores.

394 Y. Liu et al.
generated by random sampling from a uniform distribution of 0 to 1. We denotethese two datasets as SiData1 and SiData2.
All experiments are implemented by Matlab on a Core i5 3.10 Ghz machinewith Window 7 and 4 GB memory.
Table 1. Datasets Summary.
Dataset #Student #Skill #Problem
FrcSub 536 8 20
Math1 4,206 11 12
Math2 3,907 16 12
FrcSub
10 20
100
200
300
400
500
Math1
2 4 6 8 10 12
1000
2000
3000
4000
Math2
2 4 6 8 10 12
1000
2000
3000
Fig. 3. The preview of the datasets.
4.2 Evaluation on Student Modeling
To demonstrate the effectiveness of SDINA on modeling students’ skill profi-ciency, we conduct experiments of predicting students’ scores (right as 1 andwrong as 0) on each problem. We perform 5-fold cross validation on the real-world datasets, i.e., 80 % of the students are randomly selected for training whilethe rest for testing. We consider two baseline approaches:
– DINA [4]: a cognitive diagnosis model which is detailed in Sect. 3.1.– PMF [19]: a latent factor model, widely used in recommending system.
We record the best performance of each method by tuning their parameters, e.g.,the latent dimension of PMF is set to be 10. As this task is actually a binaryclassification problem, Accuracy and F1-measure are used as evaluation metrics.
The experimental results are shown in Fig. 4. SDINA performs better thanDINA and PMF in both Accuracy and F1 over all datasets. In Accuracy DINAperforms better than PMF but in F1 PMF performs better than DINA. As acognitive diagnosis model, SDINA is effective in modeling students’ skill profi-ciency.
4.3 Evaluation on Feature Selection
After evaluating SDINA’s effectiveness on student modeling, to demonstrateSDINA’s effectiveness on team formation, first the performance of three differentkinds of features on team formation are evaluated by educational experts, thenteams based on these features are visually displayed for better illustration.
Specifically, we compare reasonablity of teams formed with the same algo-rithm based on three kinds of features, i.e., the continuous skill proficiencyinferred by SDINA, the binary skill proficiency inferred by DINA and the rawexamination scores4. Since conducting large-scale in-classroom experiments are4 The latent factor getting by PMF has not been used here since it’s unexplainable.

Collaborative Learning Team Formation: A Cognitive Modeling Perspective 395
DataSets
Acc
urac
y
0.55
0.6
0.65
0.7
0.75
0.8 SDINADINAPMF
DataSetsFrcSub Math1 Math2 FrcSub Math1 Math2
F1
0.5
0.6
0.7
0.8SDINADINAPMF
Fig. 4. Performance on score prediction.
Table 2. Gold standard evaluation.
Feature HR
Raw score 0.066
DINA 0.267
SDINA 0.667
currently impractical, we choose to collect a Gold Standard [24] to evaluate effec-tiveness of team formation by various features. As educational experts, teach-ers are obviously able to give a relatively fair and convincing assessment withdecades of educating experience. We will first specify the process of collecting agold standard and then compare the performance of three kinds of teams.
To construct a gold standard, we simulate the team formation on real datasetand then ask corresponding teachers who are familiar with the chosen students,to evaluate the effectiveness of different methods. Specifically speaking, due tothe labour cost of manual assessment, we first randomly draw five classes with283 students in total, then we form teams with a fixed size (e.g. 5) by threedifferent features based on UKB. And for each class, we randomly draw threeformed teams for each method, that is, nine teams will be chosen and randomlyordered. Subsequently, we ask teachers of the five classes to pick three mostreasonable teams for each class out of their understanding of students. So, nineof the forty-five formed teams are chosen and regarded as most effective.
Taking the gold standard as ground truth, we compute hit rate (HR) [6] foreach method. Here this metric measures how closely the output of a method is tothe gold standard and is defined as HRi = |Ti∩GS|
|GS| . Here, HRi is the HR of theith team formation method, Ti represents the teams formed by the ith methodand GS means the teams picked by the gold standard. As is shown in Table 2,the effectiveness of team formation by SDINA greatly outperforms DINA andRaw score methods by a quantitative and more accurate cognitive diagnosis, andat the meanwhile DINA obtains more satisfying results than Raw score method.
S5S4S3S2S1(a)SD-Stu5
SD-Stu4SD-Stu3
SD-Stu2SD-Stu1
1
0
0.5
Pro
ficie
ncy
S5S4S3S2S1(b)DI-Stu5
DI-Stu4DI-Stu3
DI-Stu2DI-Stu1
0.5
1
0
Pro
ficie
ncy
P5P4P3P2P1(c)SC-Stu5
SC-Stu4SC-Stu3
SC-Stu2SC-Stu1
0
0.5
1
Sco
re
Fig. 5. An example of teams by using three kinds of features.

396 Y. Liu et al.
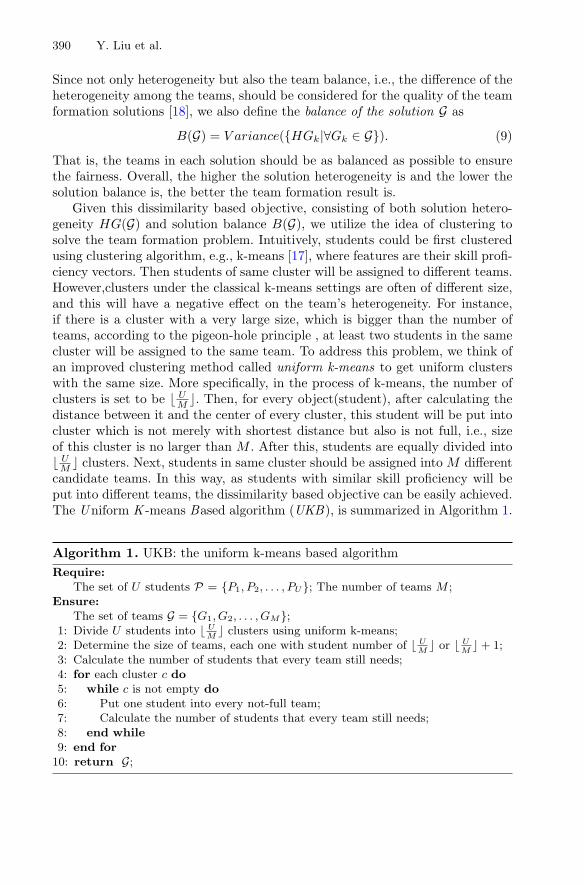
One step further, for better illustration about the difference between teamsformed by three kinds of features, Fig. 5 shows a toy visualized example. We useUKB to form five-students teams on public dataset FrcSub. Figure 5(a) showsa team formed through continuous skill proficiency output by SDINA. Here,SD-Stu1 to SD-Stu5 represent five students and S1 to S5 represent five skills.Figure 5(b) shows a team formed through binary skill proficiency output byDINA. DI-Stu1 to DI-Stu5 represent students and S1 to S5 represent skills whichare the same with Fig. 5(a). Figure 5(c) shows a team formed directly usingstudents’ score on every problem. P1 to P5 represent five problems respectively.Only five skills or problems are shown for better visualization. We can observethat team in Fig. 5(a) contains different levels of students, SD-Stu1 and SD-Stu2 are of highest ability. Others can promote skills following the lead of them.Since proficiency of students in each skill is also of great difference, students canpromote their skills through learning from each other. Compared with other twokinds of features team formation using SDINA has better explanation. SDINAnot only can support automatic team formation but also can provide guidancefor manually forming teams.
4.4 Evaluation on Team Formation
In this subsection, we first fix features as continuous skill proficiency inferredby SDINA and evaluate performance of UKB and BGB on real-world datasets.Then, to demonstrate that UKB is not just effective with features of SDINA’soutput, we evaluate its performance on two simulated datasets. Quality of teamformation solutions is evaluated with Heterogeneity, Balance and Gain, whichare defined in Sect. 3.2. For Heterogeneity and Gain, higher value is better whilefor Balance, lower value is better. Our algorithms are compared with:
– SPOS : short for Semi-Pareto Optimal Set, which is proposed in [18].– RANDOM : a standard random algorithm to form heterogeneity teams [2].
We should note that the algorithm in [1] is not chosen as a baseline, because itcan only be applied to form teams for students with 1-dimensional ability.
Firstly, we perform team formation experiments on three real-world datasetsand use the output of SDINA as input features for all the algorithms, to makesure grouping algorithms will be comparable. Figure 6 shows the experimentalresults. The subfigures in row 1 to row 3 represent three datasets and columnsrepresent three measurements. The X-axis in each subfigure represents team sizefrom 5 to 8 since the optimal team for collaborative learning should contain 5 to8 students [10]. Please note that, if the student number is not evenly divisible bythe team size, then actually team size here represents the basic student amountin every team, and there is at least one team which has one more student.The result shows the effectiveness of our proposed algorithms. In terms of thedissimilarity based objective, i.e., Heterogeneity and Balance, UKB outperformsthe two baselines among all the team sizes in three datasets, and among thebaselines, SPOS has a relatively good performance. Similarly, in terms of thegain based objective, BGB outperforms the two baselines in all cases.

Collaborative Learning Team Formation: A Cognitive Modeling Perspective 397
F
rcS
ub-
H
eter
ogen
eity
5.5
6
6.5
(a)
Bal
ance
0.5
1
1.5
(b)
Gai
n
0.75
0.8
0.85
(c)
M
ath1
-
H
eter
ogen
eity
2.4
2.6
2.8
3
3.2
(d)
Bal
ance
0.2
0.3
0.4
0.5
(e)
Gai
n
0.5
0.6
0.7
(f)
Team Size
M
ath2
-
Het
erog
enei
ty
4
4.5
5
(g)Team Size
Bal
ance
0.6
0.8
1
1.2
(h)Team Size
7 8 8 5 6 7 8
7 8 8 5 6 7 8
7 8
5 6 5 6 7
5 6 5 6 7
5 6 5 6 7 8 5 6 7 8
Gai
n
1
1.2
1.4
1.6
(i)
UKB BGB SPOS RANDOM
Fig. 6. Collaborative team formation performance on three real-world datasets.
Team Size
SiD
ata1
-
H
eter
ogen
eity
7
7.5
8
(a)Team Size
SiD
ata1
-B
alan
ce
0.35
0.4
0.45
0.5
0.55
(b)Team Size
8 8 8
SiD
ata2
-
H
eter
ogen
eity
7
7.5
8
(c)Team Size
7 7 5 6 75 6 5 6 5 6 7 8
SiD
ata2
-B
alan
ce
0.4
0.5
0.6
(d)
UKB SPOS RANDOM
Fig. 7. Collaborative team formation performance on simulated datasets.
Table 3. Runtime(seconds).
Datasets UKB BGB SPOS RANDOM
FrcSub 1.936 0.174 1.811 0.122
Math1 595.2 16.89 750.3 22.7
Math2 664.2 10.73 620.4 19.5
Secondly, to demonstrate that UKB is not just effective with features ofSDINA’s output, we perform team formation experiments on datasets with sim-ulated features. We can see from Fig. 7 that UKB has larger Heterogeneity andlower Balance among all team sizes on both datasets. We don’t test BGB as itonly focuses on features of students’ skill proficiency.
Moreover, Table 3 shows runtime of each method to form five-students teams.BGB and RANDOM run much faster in general. For our methods UKB run fasterthan SPOS on Math1, BGB run faster than RANDOM on Math1 and Math2.

398 Y. Liu et al.
5 Discussion
The experimental results demonstrate that SDINA could better model studentswith continuous skill proficiency. Through more accurate analysis on studentsand following the existing research achievements, UKB and BGB could generatemore effective collaborative learning teams for dissimilarity based objective andgain based objective. In the meanwhile, the team formation results are explain-able, which makes the framework has more practical value.
Both stages of this general framework may be further improved. Firstly, wecan employ SDINA on more data (e.g., the homework data) for feature extrac-tion. Secondly, relationship between these two objectives could be studied andmaybe the trade-off between them can be researched. Optimization methodsshould be tried to formulate an optimization problem for maximizing gain andheterogeneity, and minimizing balance. Thirdly, we plan to design more efficientsolutions than UKB and we would like to consider more influence factors to geta more reasonable definition of students’ promotion in BGB. Finally, we planto apply this theoretical research in the real-world teaching and learning, e.g.,we already served high schools where we collected the data. Indeed, given thatmodeling students’ cognitive skills for collaborative learning has largely beenneglected, there are many research directions remain to be explored.
6 Conclusion
In this paper, we designed a two-stage framework to exploit cognitive diagnosisfor collaborative learning team formation. Firstly, we proposed a cognitive diag-nosis model SDINA, which can automatically quantify students’ skill proficiencyin continuous values. Secondly, we proposed two objectives, the dissimilaritybased objective and the gain based objective with heuristic algorithms to solvethe team formation problem. At last, extensive experiments on several datasetsdemonstrated that our SDINA could model the students’ skill proficiency moreprecisely and the proposed algorithms can help generate collaborative learningteams more effectively. We hope this work could lead to more future studies.
Acknowledgements. This research was partially supported by grants from theNational Science Foundation for Distinguished Young Scholars of China (Grant No.61325010), the Natural Science Foundation of China (Grant No. 61403358) and theScience and Technology Program for Public Wellbeing (Grant No. 2013GS340302). QiLiu gratefully acknowledges the support of the Youth Innovation Promotion Associa-tion of CAS and acknowledges the support of the CCF-Intel Young Faculty ResearcherProgram (YFRP).

Collaborative Learning Team Formation: A Cognitive Modeling Perspective 399
References
1. Agrawal, R., Golshan, B., Terzi, E.: Grouping students in educational settings. In:SIGKDD, pp. 1017–1026. ACM (2014)
2. Christodoulopoulos, C.E., Papanikolaou, K.: Investigation of group formation usinglow complexity algorithms. In: Proceeding of PING, Workshop, pp. 57–60 (2007)
3. De La Torre, J.: Dina model and parameter estimation: a didactic. J. Educ. Behav.Stat. 34(1), 115–130 (2009)
4. De La Torre, J.: The generalized dina model framework. Psychometrika 76(2),179–199 (2011)
5. DeCarlo, L.T.: On the analysis of fraction subtraction data: the dina model, clas-sification, latent class sizes, and the q-matrix. APM (2010)
6. Deshpande, M., Karypis, G.: Item-based top-N recommendation algorithms. ACMTrans. Inf. Syst. (TOIS) 22(1), 143–177 (2004)
7. Desmarais, M.C.: Mapping question items to skills with non-negative matrix fac-torization. ACM SIGKDD Explor. Newsl. 13(2), 30–36 (2012)
8. DiBello, L.V., Roussos, L.A., Stout, W.: 31a review of cognitively diagnostic assess-ment and a summary of psychometric models. Handb. Stat. 26, 979–1030 (2006)
9. Embretson, S.E., Reise, S.P.: Item response theory for psychologists. PsychologyPress, New York (2013)
10. Gall, M.D., Gall, J.P.: The discussion method. The psychology of teaching methods,(75 ppt 1), pp. 166–216 (1976)
11. Gibbs, G.: Learning in teams: a tutor guide. Oxford Centre for Staff and LearningDevelopment (1995)
12. Gogoulou, A., Gouli, E., Boas, G., Liakou, E., Grigoriadou, M.: Forming homo-geneous, heterogeneous and mixed groups of learners. In: Proceeding ICUM, pp.33–40 (2007)
13. Graf, S., Bekele, R.: Forming heterogeneous groups for intelligent collaborativelearning systems with ant colony optimization. In: Ikeda, M., Ashley, K.D., Chan,T.-W. (eds.) ITS 2006. LNCS, vol. 4053, pp. 217–226. Springer, Heidelberg (2006)
14. Hooper, S., Hannafin, M.J.: Cooperative cbi: The effects of heterogeneous versushomogeneous grouping on the learning of progressively complex concepts. J. Educ.Comput. Res. 4(4), 413–424 (1988)
15. Hwang, G.-J., Yin, P.-Y., Hwang, C.-W., Tsai, C.-C., et al.: An enhanced geneticapproach to composing cooperative learning groups for multiple grouping criteria.Educ. Technol. Soc. 11(1), 148–167 (2008)
16. Lappas, T., Liu, K., Terzi, E.: Finding a team of experts in social networks. In:Proceedings of the 15th SIGKDD, pp. 467–476. ACM (2009)
17. Li, Q., Wang, P., Wang, W., Hu, H., Li, Z., Li, J.: An efficient K-means ClusteringAlgorithm on MapReduce. In: Bhowmick, S.S., Dyreson, C.E., Jensen, C.S., Lee,M.L., Muliantara, A., Thalheim, B. (eds.) DASFAA 2014, Part I. LNCS, vol. 8421,pp. 357–371. Springer, Heidelberg (2014)
18. Mahdi, B., Fattaneh, T.: A semi-pareto optimal set based algorithm for groupingof students. In: ICELET, pp. 10–13. IEEE (2013)
19. Mnih, A., Salakhutdinov, R.: Probabilistic matrix factorization. In: Advances inneural information processing systems, pp. 1257–1264 (2007)
20. Ounnas, A., Davis, H., Millard, D.: A framework for semantic group formation. In:ICALT, pp. 34–38. IEEE (2008)
21. Ozaki, K.: Dina models for multiple-choice items with few parameters consideringincorrect answers. In: APM (2015)

400 Y. Liu et al.
22. Slavin, R.E.: Cooperative learning: theory, research, and practice, vol. 14. Allynand Bacon, Boston (1990)
23. Smith, K.A., Sheppard, S.D., Johnson, D.W., Johnson, R.T.: Pedagogies of engage-ment: classroom-based practices. JEE 94(1), 87–101 (2005)
24. Stajner, T., Thomee, B., Popescu, A.-M., Pennacchiotti, M., Jaimes, A.: Automaticselection of social media responses to news. In: 19th ACM SIGKDD, pp. 50–58.ACM (2013)
25. Toscher, A., Jahrer, M.: Collaborative filtering applied to educational data mining.In: KDD Cupp (2010)
26. Wu, R., Liu, Q., Liu, Y., Chen, E., Su, Y., Chen, Z., Hu, G.: Cognitive modellingfor predicting examinee performance. In: Proceedings of the 24th InternationalConference on Artificial Intelligence, pp. 1017–1024. AAAI Press (2015)
27. Yannibelli, V., Amandi, A.: A deterministic crowding evolutionary algorithm toform learning teams in a collaborative learning context. Expert Syst. Appl. 39(10),8584–8592 (2012)