colin mues and veronica boero rodriguez march 2007...
46
colin mues and veronica boero rodriguez march 2007 abare research report 07. 6 abare abare innovation in economics mildura–wentworth a case study of horticultural farm performance abareconomics.com
Transcript of colin mues and veronica boero rodriguez march 2007...
colin mues and veronica boero rodriguez
march 2007
abare research report 07. 6
abare abar
ein
nova
tion
in e
cono
mic
s
mildura–wentwortha case study of horticultural farm performance
abareconomics.com

ii
© Commonwealth of Australia 2007
This work is copyright. The Copyright Act 1968 permits fair dealing for study, research, news reporting, criticism or review. Selected passages, tables or diagrams may be reproduced for such purposes provided acknowledgment of the source is included. Major extracts or the entire document may not be reproduced by any process without the written permission of the Executive Director, ABARE.
ISSN 1037-8286ISBN 1 920929 87 2
Mues, C. and Boero Rodriguez, V. 2007, Mildura–Wentworth – A Case Study of Horticultural Farm Performance, ABARE Research Report 07.6 Prepared for the Australian Government Department of Agriculture, Fisheries and Forestry, Canberra, March.
Australian Bureau of Agricultural and Resource EconomicsGPO Box 1563 Canberra 2601
Telephone +61 2 6272 2000 Facsimile +61 2 6272 2001Internet www.abareconomics.com
ABARE is a professionally independent government economic research agency.
ABARE project 3159

iii
mildura–wentworth » abare research report 07.6
foreword
Early in 2006 it became apparent that the horticultural industries in the Mildura–Wentworth region of north west Victoria and south west New South Wales were being adversely affected by a coincidence of factors affecting their fi nancial viability. Increasing import competition, diminished export prospects and, in the case of the wine industry, signifi cant oversupply all served to reduce farmgate prices for the main horticultural crops of the region. These market pressures raised the question about the long term viability of horticultural production in the region.
The Mildura–Wentworth Horticultural Task Force was formed to investigate the nature of the pressures on local producers and to develop strategies that would improve the prospects for farm viability and sustainability over the medium to long term. As part of the work overseen by the task force, the Australian Government Department of Agriculture, Fisheries and Forestry commissioned ABARE to analyse the future market prospects for key horticultural commodities and to conduct a farm survey of horticultural producers in the region. The survey data were used to identify the distinguishing production and fi nancial performance characteristics of farms of varying sizes and enterprise mixes that are likely to be critical for the longer term sustainability of farms.
The information contained in this report is expected to highlight the critical factors and issues infl uencing farm profi tability in the region. The report, along with other work being overseen by the task force, will contribute to the identifi cation of strate-gies that can be pursued to improve farm profi tability in the future.
Phillip GlydeExecutive Director
March 2007

iv
mildura–wentworth » abare research report 07.6
acknowledgments
The authors wish to acknowledge the considerable assistance provided by horti-cultural producers in the region through their participation in the survey. Substantial assistance was also provided by Phillip Chidgzey from the Australian Dried Fruits Association and Vesna Simic from Australian Citrus Growers. The contribution and feedback provided by members of the project steering committee is also gratefully acknowledged, particularly Charles Thompson who coordinated the projects, including this one, being done for the Mildura–Wentworth Horticultural Task Force.
Within ABARE the authors wish to acknowledge the assistance provided by Melanie Watson, Teresa Foster and Neil Bingham in preparing the data for analysis.

v
mildura–wentworth » abare research report 07.6
contents
summary 1
1 introduction 8
2 market conditions for key commodities 9
wine grapes 9citrus 14dried vine fruit 17
3 mildura–wentworth regional profi le of horticultural producers 21
physical characteristics, by activity 22fi nancial characteristics, by activity 23
4 performance, by farm size 26
viticulture industry 26citrus industry 32
appendix
A survey methodology 35
references 38
fi guresA shares in global alcohol consumption, by type 10B Australian citrus exports 14C composition of Australian citrus exports 14D unit value of Australia’s main citrus exports 15E wholesale citrus prices in Melbourne 15F Australian dried vine fruit production and imports 17

vi
G Australian dried vine fruit consumption 18H unit value of Australian dried vine fruit imports, by country
of origin 18I German dried vine fruit import prices, by country of origin 20J United Kingdom dried vine fruit import prices, by country
of origin 20K sources of farm household income, viticulture farms, by size 30L off-farm income, viticulture industry, by size 31
tables1 world alcohol and wine consumption trends 92 wine production in selected countries 113 grapevine areas in major wine producing countries 124 Australian citrus production 165 Australian dried grape prices 196 mildura–wentworth horticulture farms – key physical
characteristics, by activity 227 mildura–wentworth horticulture farms – fi nancial
performance, by activity 248 key physical characteristics of viticulture farm in
mildura–wentworth, by size of operation 269 wine grape production, viticulture industry in
mildura–wentworth, by size of operation 2710 winery contracts held by viticulture farms in
mildura–wentworth, by size of operation 2811 receipts and costs ratios of viticulture farms in
mildura–wentworth, by size of operation 2812 fi nancial performance of viticulture farms in
mildura–wentworth, by size of operation 2913 key physical characteristics of citrus farms in
mildura–wentworth, by size of operation 3214 fi nancial performance of citrus farms in
mildura–wentworth, by size of operation 33
mildura–wentworth » abare research report 07.6

1
mildura–wentworth » abare research report 07.6
summary
market prospects for key commodities» The commodities produced by horticultural growers in the Mildura–Went-
worth region are sold into an increasingly competitive global market place. Improvements in storage, transport and logistics, and management of pests and diseases, coupled with aggressive market development by exporters, mean that the domestic market for many agricultural commodities produced in Australia is heavily infl uenced by developments in the global market.
wine grapes
» Australian wine grape production in 2006-07 has been signifi cantly affected by drought and severe frosts. This is expected to bring Australian supply and demand back into balance much sooner than would have been the case if yields remained close to the long term average. The effect on domestic wine grape prices is already apparent and ABARE now forecasts that the average wine grape price in 2006-07 will be more than 20 per cent above that in the previous year. This is in strong contrast to the much more pessimistic forecasts prepared a year earlier.
» However, over the medium term, Australian wine makers will still be confronted with the challenge of marketing wine in a global market that is characterised by modest demand growth and strong but slowing growth in production. Consequently, real prices for wine grapes are projected to fall until at least the end of the decade.
» Per person global consumption of wine has dropped in each of the past four decades as wine has consistently lost ground to both beer and spirits. Demo-graphic changes in large traditional wine consuming countries and changing tastes among young consumers are major contributing factors.
» This is not a global phenomenon. Rising incomes and changes to preferences and lifestyle that are positive for wine consumption are boosting prospects for increased wine sales in the main export markets for Australia, such as the United States and the United Kingdom, as well as in nontraditional wine consuming countries such as China and the Russian Federation.

2
mildura–wentworth » abare research report 07.6
» However, the combination of subdued growth in demand and substantially increased output from ‘new world’ producers means that competition in world markets will remain intense in the medium term. It is not until market forces act to correct the supply demand imbalance that the trend of declining real prices for wine grapes may be reversed. ABARE projects that this is not expected to happen until beyond the end of this decade.
citrus
» Severe frosts, while devastating for some citrus growers, have had a positive impact on citrus prices. Prices in the early part of 2006-07 were higher than in recent years, reversing the trend of steadily falling returns.
» Continued income growth is projected over the medium term in many Asian countries, such as China. While this is likely to increase food demand, low income consumers are unlikely to be able to afford expensive high quality imported fruit. However, high income consumers in these countries may begin to demand more high quality products or processed foods and meals in restaurants. The size of the high income group in these countries is also likely to grow in future. Consequently, there may be opportunities for producers of high quality produce, such as Australia, to increase sales into these growing markets.
» However, Australian citrus producers will have to compete with other world exporters for these market opportunities. With the inevitable reduc-tion in production costs by competing exporters, it will be very important for Australian producers to achieve similar productivity gains to remain cost competitive. This will serve to maintain or improve Australia’s price competitive-ness in these emerging markets.
dried vine fruit
» Australian production of dried vine fruit has been trending down for most of the past two decades, with the expansion of the wine industry being a major factor during the late 1990s and early 2000s. Australian per person consumption of dried vine fruit has also fallen steadily over this period even though population growth has been large enough to marginally increase total domestic consumption.
» While Australia was once a net exporter of dried vine fruit, it is now a net importer and this has reinforced the infl uence of world market conditions on returns to local producers. Not only have recent domestic returns been affected by lower world prices, there have also been reports of diffi culties in maintaining price premiums for high quality fruit in some of Australia’s major export markets.
3
mildura–wentworth » abare research report 07.6
» Into the medium term there appears to be considerable potential for some of the major world producers, such as Turkey and Iran, to continue to lift produc-tivity in their industries through greater use of mechanisation and improved production methods. Furthermore, production in emerging dried vine fruit producing countries, such as China, can also be expected to grow in the future. If the expected increase in production serves to displace imports in these countries, then this will be an additional factor contributing to increased competition in Australia’s export markets.
» On balance, global prices of dried vine fruit are likely to fall in real terms in the medium to long term even though some new market opportunities may be emerging in Asia for producers capable of producing high quality fruit. Consequently, productivity improvements will assume particular importance in the medium term. Only by improving productivity so that price competitiveness is maintained or improved will Australian exporters be able to capitalise on emerging opportunities in Asia where growing incomes may lead to increased demand for premium quality fruit.
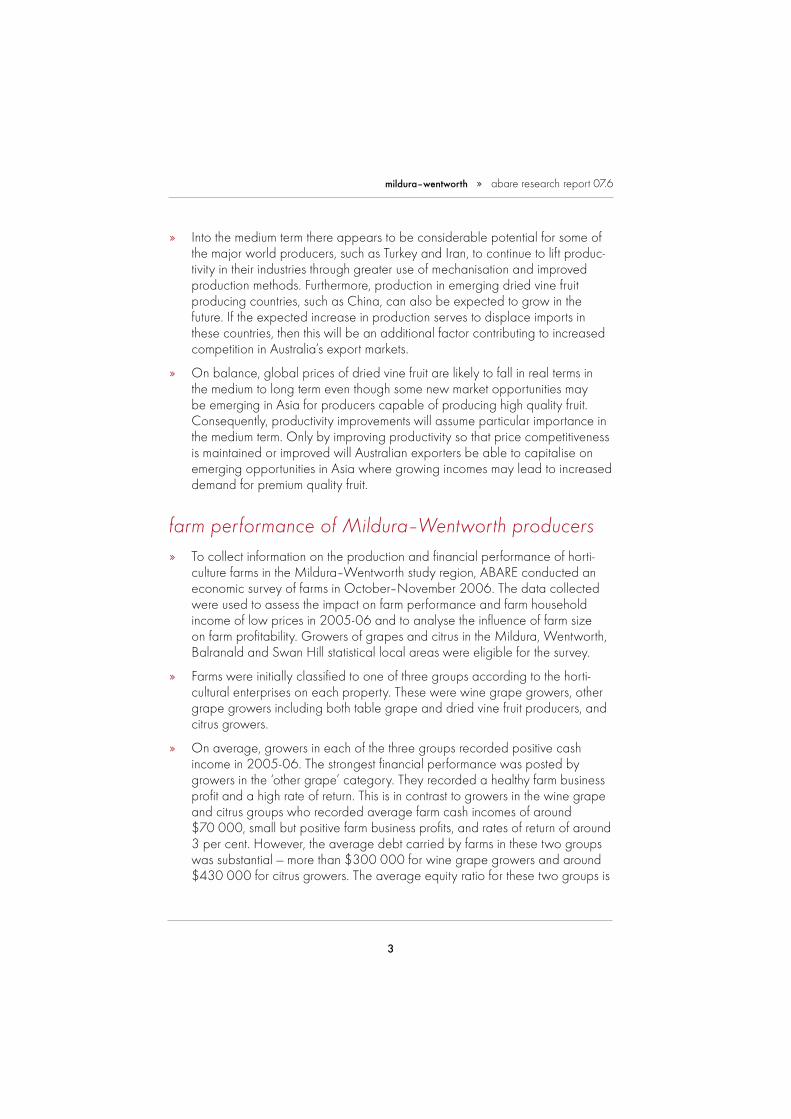
farm performance of Mildura–Wentworth producers» To collect information on the production and fi nancial performance of horti-
culture farms in the Mildura–Wentworth study region, ABARE conducted an economic survey of farms in October–November 2006. The data collected were used to assess the impact on farm performance and farm household income of low prices in 2005-06 and to analyse the infl uence of farm size on farm profi tability. Growers of grapes and citrus in the Mildura, Wentworth, Balranald and Swan Hill statistical local areas were eligible for the survey.
» Farms were initially classifi ed to one of three groups according to the horti-cultural enterprises on each property. These were wine grape growers, other grape growers including both table grape and dried vine fruit producers, and citrus growers.
» On average, growers in each of the three groups recorded positive cash income in 2005-06. The strongest fi nancial performance was posted by growers in the ‘other grape’ category. They recorded a healthy farm business profi t and a high rate of return. This is in contrast to growers in the wine grape and citrus groups who recorded average farm cash incomes of around $70 000, small but positive farm business profi ts, and rates of return of around 3 per cent. However, the average debt carried by farms in these two groups was substantial — more than $300 000 for wine grape growers and around $430 000 for citrus growers. The average equity ratio for these two groups is

4
mildura–wentworth » abare research report 07.6
73 per cent and 81 per cent respectively and interest payments account for a substantial proportion of cash costs.
» Off-farm income was an important supplement to income for farm house-holds in the wine grape and, to a lesser extent, citrus producing groups in the Mildura–Wentworth region. The average off-farm income earned by wine grape growers was almost $40 000.
survey results, by size of horticultural operation
» In order to investigate the infl uence of farm size on farm fi nancial performance and farm household income, further analysis was conducted separating farms into groups based on the size of their horticultural operation. Grape growers were separated into three groups and citrus growers into two.
assessing viability
» While analysis of farm performance and farm household income is often driven by concerns about viability, making direct judgments about the fi nancial viability of any business is a diffi cult task. This is because different owners of farm businesses, and any other business for that matter, have different personal motivations and, hence, expectations about what is an acceptable fi nancial return to their labour and management. For example, farm operators and their spouses may enjoy a rural lifestyle and, as a result, be prepared to accept a slightly lower farm cash income or seek off-farm employment to supplement income from the farm business.
» If an individual feels that their farm is unviable, they will consider the options of changing their enterprise mix, or selling their property and pursuing employ-ment elsewhere. An effi cient and freely operating rural land market is espe-cially important for individuals considering the latter as it provides an avenue for exit from the industry. Consequently, work to remove any impediments to the effi cient operation of the rural land market in the Mildura–Wentworth region would particularly benefi t growers currently weighing up their future if their options include possible exit from the industry.
» Rather than make judgments about the fi nancial viability or otherwise of horticultural farms in the study region, the analysis focused more on the farm fi nancial performance and farm household income characteristics of farm busi-nesses in each size group.

5
mildura–wentworth » abare research report 07.6
grape growers
» Large grape farms focus very heavily on wine grape production. The average small and medium sized farm has a more diversifi ed enterprise mix, including some table grape and dried vine fruit production.
» The different enterprise mix of farms in the small, medium and large size classes is refl ected in their cost profi le. Small and, to a lesser extent, medium size farms have higher average costs of production per hectare of vines. Hired labour is an especially large cost for small farms. However, the small and medium size farms also record higher average receipts per hectare, which mitigates the effect of higher cost structures on farm fi nancial performance.
» Notwithstanding this, the most telling result from the survey is that the margin between receipts and costs is strongly and positively associated with farm size. The margin between receipts and cost and the scale of operation are therefore the principal factors that infl uence the level of farm cash income earned by the farm business.
» On average, small grape farms earned just enough receipts to cover costs in 2005-06. However, they recorded a negative farm business profi t and rate of return. Consequently, the operator and spouse on these farms have either chosen, or have been forced, to turn to off-farm employment to provide income for the farm household. As mentioned earlier, this should not be interpreted as suggesting that these farms are all unviable. There are likely to be some farms in the small size group that record above average fi nancial performance results and these farms may be profi table businesses despite their small size. Alternatively, operators may expect returns to improve in the future to the point where the farm business will generate a positive cash income. Finally, there may be others who are willing to supplement their modest farm income with income from off-farm employment. This would be more feasible where management of the farm business requires less than a full time equiva-lent unit of the operator’s labour.
» Although medium size farms generated a modest average farm cash income of around $38 000 in 2005-06, the owners of these businesses also relied heavily on off-farm employment to supplement income from the farm business.
» Only grape growers in the large size group generated a suffi ciently large cash surplus to record a positive farm business profi t and rate of return. The average farm debt on large viticultural farms was just over $450 000 at the end of 2005-06. However, notwithstanding the low prices received for wine grapes in 2005-06 these farm businesses generated suffi cient cash surplus to make their interest payments and provide substantial farm cash income for the owners.

6
mildura–wentworth » abare research report 07.6
citrus growers
» Citrus growers were separated into two groups based on area of trees and vines and there was very little difference between these two groups in terms of average cost structure and receipts per hectare. One notable difference in costs was that small farms made greater use of contractors as it would be uneconomical for farms of this scale to purchase or lease all necessary plant and machinery. However, scale of operation is clearly a factor that enables larger citrus farms to generate higher farm income and business profi t. Not only is a positive gross margin being generated across a larger area, but capital and overhead costs are spread across a larger enterprise.
» Consequently, the survey results highlight some important differences between the two groups of citrus growers. The group of larger farms reported healthy profi ts and a positive rate of return in 2005-06 and the owners of these businesses were not heavily reliant on off-farm income. However, the second group, comprising small and medium sized farms, recorded smaller profi ts in 2005-06 and, as a consequence, the owners of these farm businesses relied more heavily on off-farm income to support the needs of the farm household.
concluding comments» Over the medium term there are likely to be further increases in competition in
global wine, citrus and dried vine fruit markets. The effects of this competition will inevitably be refl ected in returns to domestic producers as export pros-pects will be affected and competition from imports will intensify.
» For Australian producers to maintain or improve their competitive position in these markets, they will need to improve farm productivity to keep pace with, or ahead of, overseas competitors. This may apply to either improvements in the quality of production, or reductions in production costs. Any reduction in production costs will fl ow through to improved farm fi nancial performance. However, given the scale of their operations any per hectare or per tonne reduction in costs will provide greater benefi ts to larger growers.
» Smaller growers may also need to investigate other strategies to capture some of the benefi ts of economies of size. The most obvious strategy is for opera-tors of smaller farms to look for opportunities for farm amalgamation. This would enable them to make more effi cient use of their own labour and spread capital and overhead costs over a broader production base.

7
mildura–wentworth » abare research report 07.6
» Property amalgamation, through outright purchase, leasing agreements or sharefarming, is likely to be driven by market forces. However, it is important that the rural land market be free of any unnecessary impediments for this to occur effi ciently.
» Alternatively, growers may look to jointly purchase plant and machinery as an alternative to using contractors. The principal attraction of this strategy is the potential for more effi cient utilisation of the operators’ labour. However, issues such as arrangements for access to jointly owned machinery during times of peak demand would need to be addressed. A more detailed discussion of the strategies for gaining economies of scale through collaboration has been prepared by another of the projects commissioned by the Australian Govern-ment Department of Agriculture, Fisheries and Forestry for the Mildura–Went-worth study region (see Street Ryan and Associates 2006).

8
introduction
The Mildura–Wentworth horticultural region produces viticultural, citrus and other tree and vegetable crops. In recent years the wine grape, citrus and dried fruit industries have faced weaker prices, market access issues and changes to the management of water resources. Of most concern to producers has been the impact of lower farmgate prices for most crops, which has been affecting industry and individual grower viability.
In April and May 2006 the Mildura Rural City Council (MRCC) conducted an economic sustainability study of horticultural producers in the region. That study identifi ed two key issues affecting the economic sustainability of the region — price downturns for the region’s wine grapes, dried fruit and citrus industries; and the majority of farm businesses being too small to achieve economies of scale.
In response to that study, ABARE was commissioned by the Australian Government Department of Agriculture Fisheries and Forestry (DAFF) to undertake an enterprise scale planning project for horticultural industries, one of four projects funded by DAFF in response to the initial MRCC study. This report presents the results of the survey of horticultural growers in the region, from Wentworth to Swan Hill, along the lower Darling and Murray Rivers.
The key objective in the project was to identify the distinguishing production and fi nancial performance characteristics of farms of varying sizes and enterprise mixes that are likely to be critical for the longer term sustainability of farms. This has been done using data collected during the ABARE farm survey conducted in the region between October and November 2006.
1

9
market conditions for key commodities
wine grapesThe Australian wine industry is facing the challenge of maintaining profi tability in a market environment of relatively fl at demand, increasing supplies and declining prices. In October 2006 ABARE published a report discussing the key global and domestic developments contributing to the current situation and the potential implications for the Australian industry into the future. This section is based on much of the information contained in that report (Sheales et al. 2006) along with some commentary on production from the current vintage. This information is used to establish the likely market conditions and trends over the medium term.
global consumption
The Australian wine industry is selling increasing amounts of product into a global market that is showing little or no growth. The total volume of wine consumed globally has increased only slightly over the past four decades and, of particular concern for wine producers, per person wine consumption has dropped as wine has consistently lost ground to both beer and spirits (table 1).
2
table 1 world alcohol and wine consumption trends
1961–64 1985–89 change b 2000–04 change b % %
total alcohol a ML 6 352 12 544 2.8 17 466 2.2total alcohol per person a L 2.0 2.5 0.9 2.8 0.8
total wine ML 22 344 24 181 0.3 24 616 0.1total wine per person L 7.1 4.8 –1.6 4.0 –1.2
total beer per person L 14.7 19.8 1.2 22.1 0.7total spirits per person a L 0.5 1.1 3.2 1.4 1.6a Litres of alcohol content. b Average annual percentage change from the previous time period.Note: The data represent average annual consumption for each period indicated.Source: Wittwer and Rothfi eld (2005).

10
mildura–wentworth » abare research report 07.6
Data showing world wine consumption to be relatively stable in absolute terms fail to reveal the divergence between growing consumption in the main export markets for Australian wine (the United Kingdom and the United States) and falling consumption in the large traditional wine consuming countries (France, Italy and Spain). It is therefore useful to consider briefl y some of the important factors affecting consumption in the major consuming countries and regions of principal interest to Australia.
The principal factors determining current and future consumption are the level and rate of growth in consumer incomes, the age structure of the population, social customs and tastes. However, the balance of these factors is clearly different in different countries.
In the United States and the United Kingdom, rising incomes and changing prefer-ences and lifestyles are generally regarded as the main contributors to increased demand. The same is true in the Russian Federation and China even though they are not among the traditional wine consuming countries.
However, the effect of rising incomes is more than outweighed by that of demo-graphic changes and changing consumer tastes in the traditional wine consuming countries of France, Spain and Italy. Wine consumption has been falling in these
countries for several decades, despite rising incomes. Demand has fallen as more wine drinkers have moved into retirement and reduced their wine consumption as a result of their lower income, and the younger age groups have displayed a preference for other alcoholic and nonalcoholic bever-ages (fi gure A; Wittwer and Rothfi eld 2006). In Spain and Italy this trend is expected to continue over the next decade, meaning that the net export potential from these countries may increase. Changing demographics in the United States beyond the medium term also looms as a negative for future wine demand in that country.
shares in global alcohol consumption, by type
figA
%
80
40
20
60
‘61–64
‘65–69
‘70–74
‘75–79
‘80–84
‘85–89
‘90–94
‘95–99
2000–04
spirits
beer
wine
11
mildura–wentworth » abare research report 07.6
global production
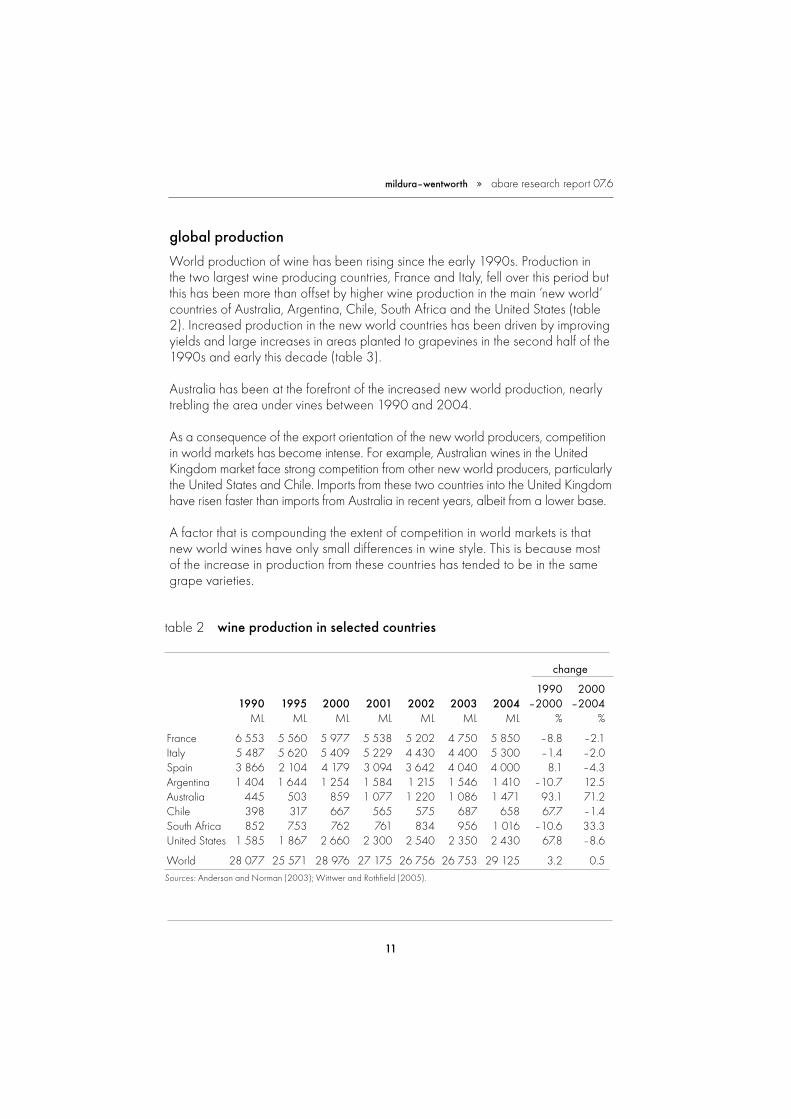
World production of wine has been rising since the early 1990s. Production in the two largest wine producing countries, France and Italy, fell over this period but this has been more than offset by higher wine production in the main ‘new world’ countries of Australia, Argentina, Chile, South Africa and the United States (table 2). Increased production in the new world countries has been driven by improving yields and large increases in areas planted to grapevines in the second half of the 1990s and early this decade (table 3).
Australia has been at the forefront of the increased new world production, nearly trebling the area under vines between 1990 and 2004.
As a consequence of the export orientation of the new world producers, competition in world markets has become intense. For example, Australian wines in the United Kingdom market face strong competition from other new world producers, particularly the United States and Chile. Imports from these two countries into the United Kingdom have risen faster than imports from Australia in recent years, albeit from a lower base.
A factor that is compounding the extent of competition in world markets is that new world wines have only small differences in wine style. This is because most of the increase in production from these countries has tended to be in the same grape varieties.
table 2 wine production in selected countries
change
1990 2000 1990 1995 2000 2001 2002 2003 2004 –2000 –2004 ML ML ML ML ML ML ML % %
France 6 553 5 560 5 977 5 538 5 202 4 750 5 850 –8.8 –2.1Italy 5 487 5 620 5 409 5 229 4 430 4 400 5 300 –1.4 –2.0Spain 3 866 2 104 4 179 3 094 3 642 4 040 4 000 8.1 –4.3Argentina 1 404 1 644 1 254 1 584 1 215 1 546 1 410 –10.7 12.5Australia 445 503 859 1 077 1 220 1 086 1 471 93.1 71.2Chile 398 317 667 565 575 687 658 67.7 –1.4South Africa 852 753 762 761 834 956 1 016 –10.6 33.3United States 1 585 1 867 2 660 2 300 2 540 2 350 2 430 67.8 –8.6
World 28 077 25 571 28 976 27 175 26 756 26 753 29 125 3.2 0.5Sources: Anderson and Norman (2003); Wittwer and Rothfi eld (2005).

12
mildura–wentworth » abare research report 07.6
Despite the preponderance of similar varieties being produced in new world countries, market forces can be expected to correct supply–demand imbalances over time. Growth in output from the new world wine producers is expected to moderate as growers respond to lower wine grape prices and cut back the net rate of plantings (new plantings less the area grubbed) of those varieties in apparent overabundance.
implications for Australia
As a relatively small wine producer with a growing dependence on exports, Australia will need to adapt to developments in the global market. Even though world prices had begun to weaken in the fi rst few years of this decade, a relatively weak Australian dollar helped to maintain export returns and, hence, prices that could be offered to Australian growers. But as production has continued to grow faster than consumption, world prices have weakened further. The effect of these lower world prices on Australian farmgate prices for wine grapes has been exac-erbated in recent times by a rising Australian dollar.
table 3 grapevine areas in major wine producing countries
change
1990 2000 1990 1995 2000 2001 2002 2003 2004 –2000 –2004 ‘000 ha ‘000 ha ‘000 ha ‘000 ha ‘000 ha ‘000 ha ‘000 ha % %old worldFrance 936 903 889 886 853 843 844 –5 –5Italy 971 851 836 818 798 719 715 –14 –14Spain 1 393 1 154 1 186 1 175 1 160 1 142 1 200 –15 1
subtotal 3 301 2 909 2 912 2 879 2 810 2 704 2 759 –12 –5
new worldArgentina 197 197 176 190 194 196 196 –11 11Australia 56 69 133 141 151 150 156 138 17Chile 71 74 113 123 125 127 127 59 12South Africa 85 88 93 96 102 106 106 9 14United States 130 146 204 214 216 213 211 57 3
subtotal 539 574 719 764 788 792 796 33 11Sources: ABS (2005); Anderson and Norman (2003); European Commission (2006); Wittwer and Rothfi eld (2006); Attaché Reports and National Agricultural Statistics Service, US Department of Agriculture.

13
mildura–wentworth » abare research report 07.6
Apart from the drop in prices, the recent supply–demand imbalance for wines has also been manifested in rising stocks of wine as wineries have found it increasingly diffi cult to make sales at preferred prices in the market. Wine stocks have been increasing in most of the main wine producing countries, but most of all in Australia and France. Although there is some question about the exact size of wine stocks in Australia, it is estimated that they were between 1.9 and 2.3 years of sales in 2005, and stocks are likely to have risen further in 2006.
Given the production forecasts at the beginning of the 2006-07 season, it was estimated that if domestic and export sales continued to grow at the same pace as in the past couple of years, it would take around four to fi ve years for Australian stocks to fall to the industry’s preferred fi gure of about 1.5 times annual sales.
However, the 2007 vintage has been signifi cantly affected by two factors that are likely to accelerate the reduction in stocks. First, drought conditions have signifi -cantly reduced irrigation water availability, even for growers with high security water entitlements. This has particularly affected growers in the Riverland and Sunraysia where some yields may by down by around 20 per cent.
Second, severe frosts have also affected vines in much of Victoria, and the Coonawarra and Padthaway regions of South Australia. This has led to substantial downgrades of expected yields in 2007 with some prospects of 2008 yields also being affected.
Based on expected below average yields in 2007 and consequent lower produc-tion, there is likely to be a reduction in the volume of wine stocks that had been accumulated in 2005 and 2006. The reduction in production estimates for the 2007 vintage is already being refl ected in wine grape prices as wineries seek to secure grapes to meet their requirements. In March 2007, ABARE forecast that the average wine grape price in 2006-07 would be around 6 per cent above the average for the previous year. This is in contrast to the more pessimistic price forecasts prepared in March 2006 (Rose and Gordon 2006).
Over the medium term, however, Australian wine makers will still face the chal-lenge of marketing wine in a global market characterised by modest demand growth and strong but slowing growth in production. Consequently, the expecta-tion is for real prices to fall over the medium term.

14
mildura–wentworth » abare research report 07.6
citrusThe Australian citrus industry grows a range of fruit, including oranges, mandarins, lemons, limes and grape-fruit. Around 95 per cent of plantings are of oranges and mandarins (Horti-culture Australia 2004). Australian producers fi nd it diffi cult to compete with frozen concentrate orange juice (FCOJ) imports (PIRSA 2005), which originate principally from Brazil. As a result, the Australian industry has undergone signifi cant structural change following reductions in govern-ment assistance between 1989 and
1996 (Productivity Commission 2002). As the tariffs on FCOJ were reduced from 35 per cent to 5 per cent, the industry developed a focus on producing fresh fruit and fresh juices for the domestic and export markets.
Australia can export high quality fresh navel oranges and mandarins when these fruits are out of season in the northern hemisphere, including to Asian markets where it has the advantage of proximity. Local producers of fresh juice have natural insulation from imports because of the seasonality of citrus fruit and the high cost of transporting these products.
Australian production of citrus has been steadily growing over the past fi fty years, from around 150 000 tonnes in the early 1950s, to 400 000 tonnes in the early 1970s, and 600 000 tonnes by the late 1980s. Since the beginning of the current decade, citrus production has averaged just under 700 000 tonnes (Citrus Growers Australia 2006).
Much of the growth in production over the past fi fteen years has been directed to export markets (fi gure B; ABS 2006). The average value of Australian fresh citrus exports in the fi ve years up to 2005-06 was around $170 million.
Australian citrus exportsfigB
kt
100
50
150
1993–94
1996–97
1999–2000
2002–03
2005–06
composition of Australian citrus exports
figC
%
50
40
30
20
10
60
1993–94
1996–97
1999–2000
2002–03
2005–06
lemons and limesgrapefruit
mandarins
navel oranges
valencia oranges

15
mildura–wentworth » abare research report 07.6
As a result of growers expanding their plantings of navel oranges and mandarins to position themselves for the fresh fruit markets, the composition of Australian exports has changed. The proportion of valencia oranges in total orange exports has fallen steadily since 1992-93 and valencias have been replaced by signifi cantly increased exports of navel oranges and manda-rins (fi gure C; ABS 2006). These structural changes within the industry were in response to price signals from Australia’s export markets. The unit values of navel orange and mandarin exports over the past fi fteen years have been higher than that of valencia exports (fi gure D; ABS 2006).
Planting statistics from the Murray Valley Citrus Board (MVCB) show that the Mildura–Wentworth region is following the national trend toward greater produc-tion of navel oranges and mandarins. At the end of January 2006, nearly a quarter of mandarin plantings in the MVCB region were under six years of age. The equiva-lent statistic for navel oranges was 15 per cent. The expansion of these two crops is in strong contrast to the almost unchanged plantings of valencia oranges. Just 1.5 per cent or 22 hectares of valencia oranges were under six years of age.
Notwithstanding the structural adjust-ment that has occurred within the industry over many years, the profi t-ability of Australian citrus growers was negatively affected by signifi cantly lower prices in 2004-05 and 2005-06. Compared with previous seasons, Melbourne wholesale prices for oranges were lower in 2004-05 and 2005-06, especially for navels (fi gure E). Around that time, export prices were also lower (fi gure D). These lower prices were partly a result of above average production in 2005-06, and export returns were also affected by the strong Australian currency.
wholesale citrus prices inMelbourne figE
$/18kg citrus pack
2002 2004 2006Dec Dec Dec Dec
monthly, ended October 2006
navel oranges
valencia oranges
30
20
10
unit value of Australia’s main citrus exports
figD
$/t
1993–94
1996–97
1999–2000
2002–03
2005–06
mandarins
navel oranges
valencia oranges
1500
1000
500

16
mildura–wentworth » abare research report 07.6
However, wholesale price data for the early part of 2006-07 show that prices have at least partly recovered as a result of a drop in domestic availability. The 2006-07 citrus crop in the Murray Valley was affected by frosts in late May and early June and this led to a substantial downgrading of production forecasts at both the regional and national levels (table 4). Total Australian citrus produc-tion is now expected to be around 17 per cent below the previous year. More recently, prices may have received further support from news that frosts in January 2007 affected the citrus crop in California, which is the source of the majority of Australian imports of fresh citrus.
Over the medium term, Australian producers will continue to face increasing competition from other southern hemisphere producers. For example, over the past ten years, South Africa has begun exporting fresh citrus to the United States and by 2005 had captured more than 40 per cent of the market. Even though the volume of Australian exports to the United States had increased over the 1996–2005 period, Australia’s market share fell from 49 per cent in 1996 to less than 40 per cent in 2005.
On the other hand, there is likely to be continued income growth in many Asian countries, particularly China. While this is likely to increase food demand, low income consumers are unlikely to be able to afford expensive high quality imported fruit. However, US Department of Agriculture (2007) research has concluded that as incomes continue to grow, the group of Chinese households with the highest incomes are likely to begin to demand more high quality products
table 4 Australian citrus production
2004 2005 2006 2004 2005 2006 2004 2005 2006 -05 -06 -07 -05 -06 -07 -05 -06 -07
navel valencia mandarin
kt kt kt kt kt kt kt kt kt
Victoria a 72 105 78 40 50 28 11 9 9Australia 225 274 237 228 297 216 121 102 103
lemon/lime grapefruit total
kt kt kt kt kt kt kt kt kt
Victoria a 6 6 4 6 5 6 135 176 150Australia 36 38 28 11 11 12 620 722 596a Includes Murray River areas of southern New South Wales (Sunraysia and Mid Murray).Source: Australian Citrus Growers.

17
mildura–wentworth » abare research report 07.6
or processed foods and meals in restaurants. With future income growth, this group is likely to grow in size. Hence, with the signing of the phytosanitary protocol for the export of Australian citrus to China in October 2005, this may represent a signifi cant opportunity for producers of high quality produce such as Australia to increase sales to a growing market.
Nonetheless, Australian producers will have to compete with other world exporters for these market opportunities. Therefore, over the medium term it will be very important to achieve productivity gains so that Australian producers can reduce the cost of producing higher quality fruit. This will serve to maintain or improve Austral-ia’s price competitiveness in these emerging markets.
dried vine fruitThe Australian dried vine fruit industry is predominantly located in the Sunraysia region of north west Victoria and south west New South Wales. There is also some production in the Riverland region of South Australia, along with a small quantity of dried vine fruit produced in the Swan Valley and Bindoon regions of Western Australia.
Australia is a relatively small producer of dried vine fruit by world standards, typi-cally accounting for somewhere between 3 and 4 per cent of world production in recent years. The main producers are the United States and Turkey, which together account for more than 95 per cent of northern hemisphere production and about 80 per cent of global production. Along with Iran, these two countries also dominate world trade.
Australian production of dried vine fruit has been trending down for most of the past two decades (fi gure F). Expan-sion of the wine industry during the late 1990s and early 2000s was a contrib-uting factor as this created competition for grapes suitable for wine production.
It has only been in the past three seasons that production of dried vine fruit has shown sustained recovery, with production averaging 28 000 tonnes
Australian dried vine fruitproduction and imports
figF
kt
80
60
40
20
1993–94
1990–91
1996–97
1999–2000
2002–03
2005–06
imports
production
18
mildura–wentworth » abare research report 07.6
over that period. In part, this refl ected the reduction in wine grape prices offered by wineries as wine grape production had grown to the point where availability was in excess of their requirements.
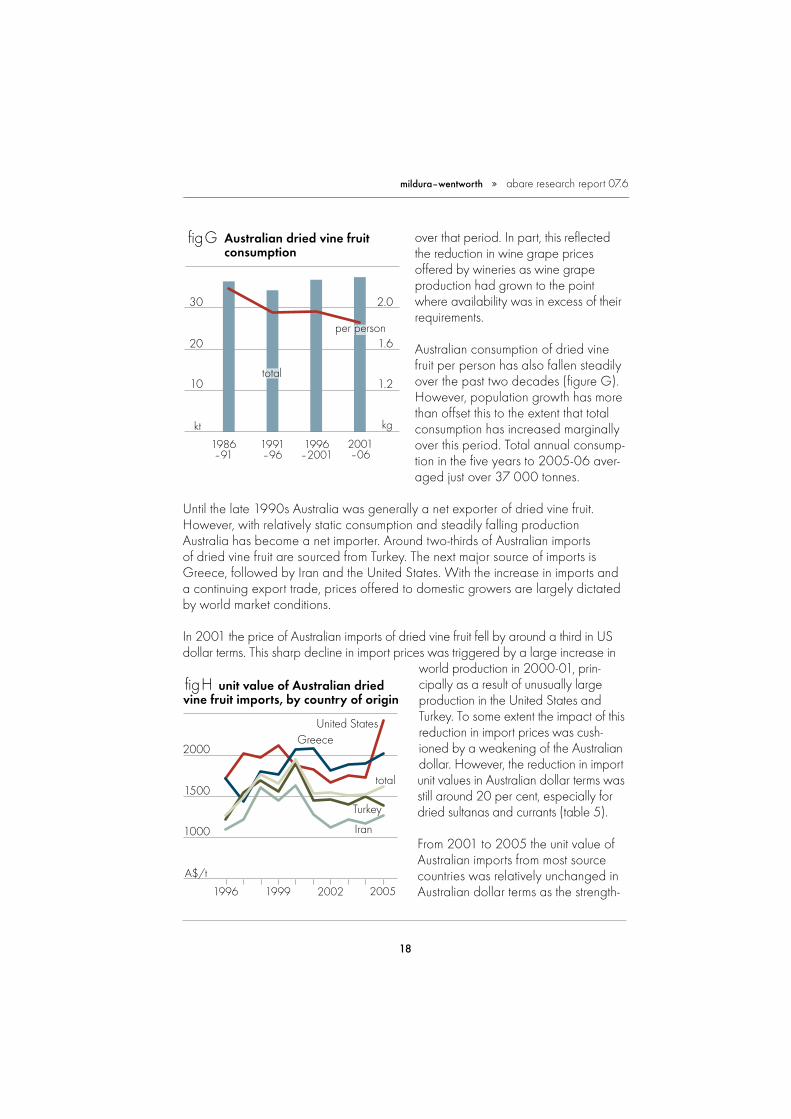
Australian consumption of dried vine fruit per person has also fallen steadily over the past two decades (fi gure G). However, population growth has more than offset this to the extent that total consumption has increased marginally over this period. Total annual consump-tion in the fi ve years to 2005-06 aver-aged just over 37 000 tonnes.
Until the late 1990s Australia was generally a net exporter of dried vine fruit. However, with relatively static consumption and steadily falling production Australia has become a net importer. Around two-thirds of Australian imports of dried vine fruit are sourced from Turkey. The next major source of imports is Greece, followed by Iran and the United States. With the increase in imports and a continuing export trade, prices offered to domestic growers are largely dictated by world market conditions.
In 2001 the price of Australian imports of dried vine fruit fell by around a third in US dollar terms. This sharp decline in import prices was triggered by a large increase in
world production in 2000-01, prin-cipally as a result of unusually large production in the United States and Turkey. To some extent the impact of this reduction in import prices was cush-ioned by a weakening of the Australian dollar. However, the reduction in import unit values in Australian dollar terms was still around 20 per cent, especially for dried sultanas and currants (table 5).
From 2001 to 2005 the unit value of Australian imports from most source countries was relatively unchanged in Australian dollar terms as the strength-
2000
1500
1000
unit value of Australian dried vine fruit imports, by country of originfigH
A$/t
1996 1999 2002 2005
United States
Iran
Greece
Turkey
total
30
20
10
2.0
1.6
1.2
Australian dried vine fruitconsumption
figG
kt kg
1986–91
1991–96
1996–2001
2001–06
total
per person

19
mildura–wentworth » abare research report 07.6
ening Australian currency served to offset the impact of higher world prices (fi gure H; UN Comtrade database).
However, prices paid to Australian growers fell signifi cantly in 2005-06. Sunbeam Foods Group, the major Australian processor of dried vine fruit, signifi cantly reduced schedule prices in part to address the falling profi tability of their operation. Other factors behind the reduction in prices were signifi cantly lower world currant prices and some reported diffi culties in maintaining price premiums for high quality fruit in some of Australia’s major export markets.
The effects of changes in Australia’s cost competitive-ness relative to the other major world exporters have also been evident in Australia’s two major export markets, Germany and the United Kingdom. Since the mid 1990s the price of Australian DVF in Germany and the United Kingdom has tended to be higher than the price of Turkish and Iranian product which would be consistent with Australia providing a product of higher quality (fi gures I, J; UN Comtrade database). However, in 2004 and 2005 there was an increase in the price differ-ential between Australian dried vine fruit and product from competing suppliers that was driven largely by the strength-ening Australian currency. This served to reduce the competi-tiveness of Australian dried vine fruit in these markets, which would have been a factor contributing to lower Australian exports to these markets in those years.
table 5 Australian dried grape prices a
sun- sultanas currants raisins muscats $/t $/t $/t $/t
1979-80 980 970 600 1980-81 550 1981-82 780 984 620 1982-83 860 1 200 750 1983-84 590 870 790 1984-85 1 020 980 1 390 1986-86 1 125 1 150 1 340 1986-87 1 360 1 430 1 040 1987-88 1 230 1 625 1 215 1988-89 1 300 1 640 880 1989-90 1 491 1 675 1 230 1990-91 1 260 1 720 927 1991-92 995 2 000 790 1992-93 1 165 1 630 725 1993-94 1 360 1 410 1 215 1994-95 1 480 1 550 1 500 1995-96 1 260 1 850 1 520 1996-97 1 560 1 870 1 750 1997-98 1 600 1 600 1 700 2 0001998-99 1 770 1 750 1 200 2 2001999-2000 1 755 1 860 1 200 2 0052000-01 1 480 1 690 1 200 1 9502001-02 1 330 1 800 1 550 1 8002002-03 1 435 1 825 1 650 1 4302003-04 1 485 1 850 1 675 1 4852004-05 1 435 1 800 1 675 1 4352005-06 1 250 1 300 1 625 1 285a All prices are the schedule price offered by processors for the best grades of fruit.Source: Australian Dried Fruit Association.

20
mildura–wentworth » abare research report 07.6
Into the medium term there seems to be considerable potential for some of the major world producers, such as Turkey and Iran, to continue to lift productivity within their industries through greater use of mechanisation and improved production methods.
Furthermore, production in emerging producing countries, such as China, can also be expected to grow into the future. The US Department of Agricul-ture (2006) forecasts that China’s raisin production will increase by 10–20 per cent a year in the next three years
as producers respond to high prices supported by strong consumer demand. To the extent that the increase in domestic production displaces imports, which are principally from the United States, then this will serve to increase competition in other export markets.
Consequently, it is likely that global prices of dried vine fruit will fall in the medium to long term. While removing or reducing any of the subsidies provided to over-seas producers may reduce the likelihood of increased production of dried vine fruit and lower prices in the future, any substantial change appears to be unlikely to occur over the short to medium term.
However, some market opportunities may be emerging in countries, such as China, for producers capable of producing high quality fruit, such as Australia. But given the competition in the global market, as highlighted by recent diffi culties in maintaining price premiums for high quality fruit, then productivity improvements assume particular importance into the medium term. Only by maintaining or improving price competitiveness will Australian exporters be able to capitalise on emerging opportuni-ties in Asia where growing incomes may lead to increased demand for premium quality fruit.
United Kingdom dried vine fruitimport prices, by country of origin
figJ
index 1996=100
1996 1999 2002 2005
120
80
100
40
60
Australia
United States
Iran
Turkey
German dried vine fruit import prices, by country of origin
fig I
index 1996=100
1996 1999 2002 2005
120
80
100
40
60
AustraliaUnited States
IranTurkey

21
mildura–wentworth regional profi le of horticultural producers
As outlined in the previous chapter, 2005-06 was a challenging year for horticul-tural producers in the Mildura–Wentworth region. Prices for major commodities in 2005-06 were substantially below those received in previous years. Low prices in 2005-06 have had an even greater impact on growers than would normally be the case because the wine grape, citrus, dried grape and table grape industries have all been operating in an environment of depressed returns for some time and producers have already seized on many of the opportunities to reduce costs (Scholefi eld Robinson Horticultural Services 2006).
In order to collect information on the production and fi nancial performance charac-teristics of horticultural farms in the Mildura–Wentworth study region, and to under-stand the impact of the lower prices in 2005-06 in particular, ABARE conducted an economic survey of farms in October and November 2006. The survey included a comprehensive set of questions on the production and fi nancial performance of the enterprise, and particular issues affecting the local horticultural industries.
The survey was designed to produce estimates for growers of grapes and citrus in the Mildura, Wentworth, Balranald and Swan Hill statistical local areas. A population list of all horticultural producers in this region was obtained from the Australian Bureau of Statistics (ABS). Only farms with an estimated value of agricultural production greater than $22 500 were included in the survey, to exclude subcommercial hobby farms. Interviews were conducted on-farm. Additional detail on the survey design and a guide to the interpretation of survey estimates is provided in appendix A.
This chapter provides information on the production and fi nancial performance profi le of horticultural producers in the Mildura–Wentworth study region. Surveyed farms have been classifi ed to one of three groups according to the horticultural enterprises on each property. Producers classifi ed by the ABS as being in the grape industry are separated into wine grape producers and other grape producers according to whether or not they sold grapes for wine production in 2005-06. It was not possible to separate ‘other grape’ producers into table grape and dried vine fruit producers owing to the small sample in this group. All other farms surveyed were principally involved in citrus production and form the third group. All survey data presented in this and the following chapter is for the 2005-06 fi nancial year.
3

22
mildura–wentworth » abare research report 07.6
physical characteristics, by activityThe most notable differences between citrus and grape growing farms in the Mildura–Wentworth region relate to farm size and the intensity of the farming operation (table 6). Citrus farms are, on average, more than twice the size of grape growing farms. However, farms growing grapes have a larger proportion of their total farm area planted to tree and vine crops. For wine grape growers
table 6 mildura–wentworth horticulture farms – key physical characteristics, by activity average per farm
wine grapes other grapes citrus
total area operated ha 39.4 (13) 17.2 (14) 98.7 (31)
wine grapes bearing area ha 22.5 (12) na na 8.2 (38)
nonbearing area ha 1.8 (28) na na 0.4 (91)
total area ha 24.3 (12) na na 8.6 (37)
other grapes bearing area ha 2.8 (27) 12.7 (17) 0.7 (56)
nonbearing area ha 0.4 (45) 0.9 (57) 0.0 natotal area ha 3.2 (25) 13.6 (16) 0.7 (56)
citrus bearing area ha 1.0 (42) na na 23.2 (13)
nonbearing area ha 0.1 (63) na na 3.1 (58)
total area ha 1.1 (40) na na 26.3 (14)
total trees and vines bearing area ha 26.5 (12) 12.7 (17) 33.8 (11)
nonbearing area ha 2.3 (22) 0.9 (57) 3.5 (52)
total area ha 28.8 (11) 13.6 (16) 37.4 (12)
production wine grapes t 478 (13) na na 162 (35)
other grapes t 67 (29) 316 (25) 18 (55)
citrus t 30 (45) na na 820 (16)
yield wine grapes t/ha 21 (4) na na 20 (6)
other grapes t/ha 24 (18) 25 (14) 24 (17)
citrus t/ha 29 (10) na na 35 (8)
irrigation application rate wine grapes ML/ha 7.7 (6) na na 5.0 (5)
other grapes ML/ha 7.8 (8) 8.6 (5) 7.8 (11)
citrus ML/ha 11.1 (8) na na 8.9 (5)
na Not applicable.

23
mildura–wentworth » abare research report 07.6
and other grape growers, this proportion is around 73 per cent and 79 per cent respectively. This is double that for citrus producers. Each group has a proportion of their crop area that is nonbearing, ranging between 7 and 9 per cent of total tree and vine area, which refl ects the replacement or expansion of trees and vines that has occurred in recent years.
Mildura–Wentworth citrus producers appear to be slightly less dependent on their main agricultural crop than their wine grape growing counterparts. On average, farms in the citrus group have more than 9 hectares or around 25 per cent of tree and vine area allocated to noncitrus crops. However, there is little cropping other than the tree and vine crops on the remaining area of these farms. By comparison, the average wine grape producing farm has 15 per cent of total planted area under crops other than wine grapes.
Grape yields are fairly similar for each of the three groups of producers. However, citrus growers achieved higher citrus yields in 2005-06 than wine grape growers who also grew that crop, possibly refl ecting greater management expertise.
fi nancial characteristics, by activityGrowers in each of the three groups are heavily reliant on their primary crops for income. While citrus growers appear to be the less specialised of the three groups in terms of area planted, they earned more than two-thirds of their receipts in 2005-06 from sales of citrus (table 7). It should be noted that the level of receipts per hectare of grapes for growers in the other grapes group is considerably higher than that reported in the Bizcheck benchmarking analysis for dried fruit producers (RMCG and Scholefi eld Robinson Horticultural Services 2005). However, this is explained by the grouping together of dried vine fruit and table grape producers in the one group.
Labour costs, repairs and maintenance, contracts and interest payments are the major cost items for producers in each of the three groups. The combined cost of chemicals and fertilisers also represent a sizable proportion of total costs for each group.
On average, growers in each of the three groups recorded a positive cash margin in 2005-06. Growers in the other grapes group recorded the largest farm cash income of around $170 000. The ratio of average cash costs to cash receipts in this group was nearly 60 per cent, which is similar to the level recorded for the middle 50 per cent of growers in the Bizcheck business analysis for dried fruit growers conducted in the 2002-03 and 2003-04 seasons (RMCG and Schole-fi eld Robinson Horticultural Services 2005).

24
mildura–wentworth » abare research report 07.6
table 7 mildura–wentworth horticulture farms – fi nancial performance, by activity average per farm
wine grapes other grapes citrus cash receipts wine grapes $ 150 666 (15) na na 40 818 (34)
other grapes $ 26 965 (41) 351 222 (19) 4 915 (54)
citrus $ 8 051 (51) na na 242 943 (13)
total cash receipts $ 238 730 (12) 405 998 (18) 381 894 (12)
cash costs hired labour $ 30 324 (16) 38 142 (33) 100 918 (13)
fertiliser $ 8 241 (17) 5 887 (34) 24 546 (22)
crop and pasture chemicals $ 7 720 (19) 9 854 (27) 12 821 (24)
fuel, oil and grease $ 8 438 (15) 10 738 (24) 12 804 (13)
repairs and maintenance $ 12 074 (11) 21 536 (25) 23 348 (16)
tree and vine replacement $ 1 382 (58) 2 020 (94) 2 524 (42)
contracts $ 16 785 (13) 37 616 (24) 16 221 (29)
interest $ 21 923 (16) 5 698 (35) 26 966 (34)
other costs $ 66 071 (10) 102 722 (12) 85 065 (14)
total cash costs $ 172 957 (8) 234 212 (15) 305 214 (11)
farm cash income $ 65 773 (29) 171 786 (28) 76 680 (27)
less depreciation $ 14 435 (9) 18 023 (15) 15 811 (11)
less imputed family labour $ 35 291 (11) 50 055 (12) 31 824 (12)
farm business profi t $ 16 047 (104) 103 708 (42) 29 044 (68)
profi t at full equity $ 36 795 (56) 108 057 (41) 48 863 (60)
capital appreciation $ –105 160 (37) –1 641 (1587) 17 964 (271)
profi t at full equity including– capital appreciation $ – 68 365 (67) 106 416 (52) 66 827 (89)
total value of capital at 30 June $ 1 154 989 (10) 867 669 (20) 2 215 679 (10)
rate of return – excl. capital appreciation % 3.6 (42) 13.0 (29) 2.9 (37)
– incl. capital appreciation % –4.8 (75) 12.8 (40) 3.7 (70)
total farm debt a $ 306 976 (15) 85 836 (31) 431 248 (31)
equity ratio a % 73 (5) 90 (5) 81 (7)
total liquid assets b $ 162 796 (54) 67 320 (37) 165 874 (25)
off-farm income $ 39 337 (15) 19 146 (29) 22 479 (32)
a Only includes farms that provided information on debt. b Only includes farms that provided information on liquid assets.

25
mildura–wentworth » abare research report 07.6
After allowance is made for depreciation and a cost attributed to family labour, growers in this group recorded a farm business profi t of just over $100 000 per farm in 2005-06. This strong profi t result also underpinned the very high rate of return. Growers in this group recorded an average rate of return excluding capital appreciation of 13 per cent, which compares well against that recorded by wine grape and citrus growers (3.6 and 2.9 per cent respectively), as well as broa-dacre cereal cropping and grazing farms (1.3 per cent).
Farms in the other grapes group are carrying, on average, quite modest debt and have high equity level. Even after allowing for the slight fall in the value of farm capital in 2005-06, the average equity ratio among this group of growers was 90 per cent.
The fi nancial performance recorded by growers in the wine grape and citrus groups was more modest than that recorded by other grape producers. Average farm cash income in 2005-06 for both groups was around $70 000. Most of this cash surplus was accounted for by depreciation and the imputed cost of family labour, leaving only a small farm business profi t. The average rate of return excluding capital appreciation for these two groups was around 3 per cent, which was higher than that recorded by Australian broadacre farms in 2005-06.
However, the average debt carried by farms in these groups is substantial. Average farm debt for wine grape growers is more than $300 000 and for citrus growers around $430 000. Not only does this explain why interest payments account for such a substantial proportion of cash costs, but it also leads to the much lower average equity ratios for these groups.
In the wine grape grower group, the impact of a large debt on the average equity ratio was further compounded in 2005-06 by a substantial drop in the value of farm capital of more than $100 000. However, both of these groups have accu-mulated substantial off-farm assets which can be drawn upon to retire some of the farm debt if necessary.
As the average farm cash income for wine grape and citrus growers was relatively modest in 2005-06 compared with other grape producers in the Mildura–Went-worth region and broadacre producers across Australia, off-farm income was an important supplement to farm income for these households. In particular, the average off-farm income earned by wine grape growers was almost $40 000, which is substantially more than that recorded by farm households in the Mildura–Wentworth citrus and other grapes groups, or in the Australian broadacre industries.

26
performance, by farm size
While the estimates presented in the previous chapter were averages for each of the three groups of growers in the Mildura–Wentworth region, there is always vari-ability around average fi nancial performance estimates. An issue that is of particular interest is whether there is an identifi able relationship between farm size and farm fi nancial performance. To investigate this, farms in the two grape growing groups were divided into three size subgroups, based on the area of vines planted. As the available sample for citrus growers was smaller, farms in this group were divided into just two subgroups based on total crop area such that sample points repre-senting around a third of the estimated population were in the largest size group.
viticulture industryWhen viticultural farms in the Mildura–Wentworth region are separated into subgroups according to farm size, the most noticable difference between these
4
table 8 key physical characteristics of viticulture farms in mildura–wentworth, by size of operation average per farm
small medium large farm area total farm area operated ha 8.1 (13) 15.0 (8) 73.0 (12)
wine grapes bearing area ha 1.2 (52) 6.8 (17) 38.7 (12)
nonbearing area ha 0.5 (69) 0.4 (58) 3.0 (33)
total area ha 1.6 (35) 7.2 (17) 41.7 (12)
other grapes bearing area ha 3.6 (28) 5.1 (21) 7.6 (34)
nonbearing area ha 0.3 (74) 0.4 (66) 0.9 (55)
total area ha 3.9 (24) 5.5 (21) 8.5 (33)
production wine grapes t 30 (49) 136 (19) 826 (13)
other grapes t 75 (28) 136 (21) 189 (42)
irrigation application rate wine grapes ML/ha 7.2 (10) 7.9 (12) 7.7 (8)
other grapes ML/ha 7.4 (16) 8.0 (10) 8.8 (5)

27
mildura–wentworth » abare research report 07.6
groups is that large farms focus much more heavily on wine grape production (table 8), both in terms of total hectares as well as the proportion of total grape plantings. On average, large farms have a relatively even balance between red and white wine varieties, whereas small and medium sized producers focus more on red and white wine varieties respectively (table 9). The importance of wine grape production to the larger farms is also refl ected in the higher proportion of farms in this group that have a delivery contract with wineries (table 10).
table 9 wine grape production in mildura–wentworth, by size of operationaverage per farm
small medium large area planted cabernet sauvignon ha na na na na 7.3 (13)
merlot ha na na na na 3.7 (30)
shiraz ha na na 0.6 (56) 8.8 (20)
chardonnay ha na na 3.7 (22) 15.5 (16)
colombard ha na na na na 1.8 (26)
red wine varieties ha 1.1 (40) 1.3 (35) 21.6 (13)
white wine varieties ha 0.5 (47) 5.8 (20) 20.2 (14)
all wine varieties ha 1.6 (35) 7.2 (17) 41.7 (12)
production cabernet sauvignon t na na na na 132 (14)
merlot t na na na na 67 (22)
shiraz t na na 11 (59) 157 (19)
chardonnay t na na 70 (25) 300 (18)
colombard t na na na na 50 (31)
red wine varieties t 16 (64) 28 (35) 390 (13)
white wine varieties t 15 (52) 108 (22) 435 (16)
all wine varieties t 30 (49) 136 (19) 826 (13)
yield cabernet sauvignon t/ha na na na na 19 (7)
merlot t/ha na na na na 19 (25)
shiraz t/ha na na 22 (8) 20 (6)
chardonnay t/ha na na 20 (7) 21 (5)
colombard t/ha na na na na 28 (12)
red wine varieties t/ha 24 (1) 22 (4) 19 (7)
white wine varieties t/ha 29 (18) 20 (6) 24 (6)
all wine varieties t/ha 26 (10) 20 (5) 21 (5)

28
mildura–wentworth » abare research report 07.6
Around 70 per cent of plantings on small farms and nearly 45 per cent of plant-ings on medium size farms are of nonwine grape varieties, indicating farms in these two groups focus more on table grape and dried vine fruit production compared with large viticultural farms.
Refl ecting the different focus of grape production by farms in each of these groups, small farms have the highest average production costs when calculated as dollars per hectare of vines (table 11). This is also true for almost every cash cost category recorded in the ABARE survey (table 12). Hired labour is an especially large cost for small farms, averaging more than $2000 per hectare, refl ecting the labour intensive nature of table grape and dried vine fruit production and small scale wine grape vineyards that are less suited to mechanised production methods.
table 10 winery contracts held by viticulture farms in mildura–wentworth, by size of operation
small medium large
contracted to winery 2006 % 22 (63) 46 (22) 61 (16)
contracted to winery at fi xed price 2006 % 22 (63) 30 (40) 40 (29)
contracted to winery 2007 % 22 (63) 39 (28) 58 (17)
contracted to winery at fi xed price 2007 % 22 (63) 30 (40) 29 (38)
table 11 receipts and costs ratios of viticulture farms in mildura–wentworth, by size of operation average per farm
small medium large
receipts per hectare a $/ha 16 270 (17) 13 294 (17) 12 071 (16)
price – wine grapes $/t 424 (14) 392 (9) 300 (8)
price – red wine grapes $/t 431 (14) 406 (12) 297 (9)
price – white wine grapes $/t 416 (30) 388 (10) 302 (9)
price – other grapes $/t 684 (24) 575 (35) 1 123 (33)
costs per hectare a $/ha 15 034 (17) 10 104 (14) 7 377 (14)
hired labour costs – per hectare a $/ha 2 304 (35) 1 766 (22) 1 276 (21)
– per tonne produced $/t 105 (42) 77 (20) 57 (21)
a Bearing area.

29
mildura–wentworth » abare research report 07.6
table 12 fi nancial performance of viticulture farms in mildura–wentworth, by size of operation average per farm
small medium large cash receipts wine grapes $ 12 812 (54) 53 187 (21) 247 328 (17)
other grapes $ 51 104 (27) 78 062 (38) 212 203 (43)
citrus $ 1 057 (99) 75 (103) 15 591 (54)
other crops $ 0 na 48 (94) 8 188 (88)
previous year crop $ 11 818 (56) 13 899 (40) 38 189 (46)
total cash receipts $ 79 100 (13) 159 225 (16) 588 124 (14)
cash costs hired labour $ 11 200 (35) 21 149 (25) 62 182 (20)
fertiliser $ 2 471 (52) 2 528 (26) 17 004 (18)
crop and pasture chemicals $ 3 596 (39) 6 007 (45) 14 685 (16)
fuel,oil and grease $ 4 853 (23) 4 730 (17) 17 011 (17)
repairs and maintenance $ 5 355 (25) 8 150 (22) 29 257 (15)
tree and vine replacement $ 21 (81) 11 (91) 4 413 (51)
contracts $ 7 265 (40) 12 983 (17) 45 283 (19)
interest $ 6 583 (38) 9 670 (27) 34 479 (17)
other costs $ 31 749 (16) 55 789 (20) 135 086 (12)
total cash costs $ 73 093 (13) 121 018 (15) 359 399 (11)
farm cash income $ 8 494 (89) 38 207 (33) 228 724 (22)
less depreciation $ 8 033 (8) 13 647 (9) 23 637 (12)
less imputed family labour $ 29 491 (20) 42 006 (8) 45 475 (12)
farm business profi t $ –26 468 (31) –17 446 (75) 159 613 (30)
profi t at full equity $ –27 832 (32) –3 958 (359) 189 410 (24)
capital appreciation $ –4 388 (172) –18 054 (79) –196 523 (41)
profi t at full equity including capital appreciation $ –32 219 (37) –22 012 (104) –7 113
total value of capital at 30 June $ 487 748 (12) 724 927 (17) 1 931 309 (12)
rate of return – exc. capital appreciation % –4 (52) –0.3 (614) 9 (22)
– inc. capital appreciation % –5 (54) –3 (118) 0.24 (1940)
total farm debt a $ 105 175 (31) 160 157 (21) 452 040 (21)
equity ratio a % 78 (9) 78 (8) 76 (8)
total liquid assets b $ 21 731 (73) 42 869 (40) 327 793 (55)
off-farm income $ 35 463 (22) 28 598 (23) 37 253 (23)
a Only includes farms that provided information on debt. b Only includes farms that provided information on liquid assets.

30
mildura–wentworth » abare research report 07.6
Notwithstanding the higher average receipts and costs per hectare for small and, to a lesser extent, medium size farms, the most telling result from the survey is that the per hectare margin between receipts and costs is strongly associated with farm size.
In 2005-06, the average farm in the small size group barely covered costs and recorded a farm cash income of just $8000. Due to the low level of income, the average fi nancial outcome for farms in this group was a negative farm business profi t and a negative rate of return. The average farm debt of small size farms was in excess of $100 000 and interest payments accounted for 9 per cent of cash costs. However, it should be noted these are average results. Some farms within this group are earning incomes well above the average for this group, possibly to the point where the farm would be considered a profi table business despite its small size.
As a consequence of their low level of farm income, operators of these farms rely heavily on off-farm sources to provide for household income. This off-farm income is almost entirely comprised of wages (fi gure K), with operators accounting for the majority (fi gure L).
Although medium size farms were able to generate a larger margin between per hectare receipts and costs, they were only able to generate a relatively modest farm cash income of around $38 000 per farm in 2005-06. Compared with the small farm group, these farms have lower costs per hectare, both in total and for the majority of individual cost items. However, their per hectare receipts are also commensurately lower.
The average debt carried by these farms at the end of 2005-06 was around $160 000 and interest payments in 2005-06 accounted for almost 8 per cent of cash costs. As these farms hold only limited liquid assets that could potentially be used to retire some debt, debt servicing will continue to represent a major commit-ment for the farm business in the near future.
Even though the average farm cash income recorded by medium size viticultural farms was more favourable than that for small farms, it was insuf-
200
150
100
50
sources of farm household income, viticulture farms, by size
fig K
$’000
largemediumsmall
off-farm investmentsoff-farm salaries or wagesfarm cash income

31
mildura–wentworth » abare research report 07.6
fi cient to cover the costs of depreciation and unpaid family labour, meaning that these farms recorded an average farm business loss and negative rate of return.
Medium size farms also rely heavily on off-farm wages and investment income in order to support the farm household income (fi gure L). This income is earned primarily from salaries and wages, with the spouse accounting for almost three quarters of this total (fi gure L).
Only grape growing farms in the large size group could be considered profi t-able in 2005-06. Although their per hectare receipts were lower than either of the fi rst two groups, their costs were commensurately lower. These farms recorded an average farm cash income of more than $220 000, a positive farm business profi t and rate of return of 9 per cent. This was considerably higher than the average rate of return for the other two groups of grape growing farms as well as that earned by Australian broadacre farms in 2005-06. However, a substantial writ-edown in the average capital value of large viticultural farms in the region during 2005-06 as a result of the downturn in the wine grape market completely eroded this otherwise positive result.
Large viticultural farms carry an average debt of around $450 00, although interest payments account for only a slightly larger proportion of cash costs than for the other two groups of grape growers. However, notwithstanding the low prices received for wine grapes in 2005-06, these farm businesses generated suffi cient cash surplus to make their interest payments and provide substantial farm cash income for the owners.
The owners of these farms also earn a substantial amount of off-farm income, further boosting farm household income. In contrast to farms in the other two groups, the composition of off-farm income is almost 50:50 from wages and from off-farm investments, the latter accounting for a more substantial proportion as a result of the accumulation of a larger portfolio of liquid assets by the farm business.
20
15
10
5
off-farm income, viticulture industry, by size
figL
$’000
largemediumsmall
otherspouse – wages and salariesoperator – wages and salaries

32
mildura–wentworth » abare research report 07.6
citrus industryAlthough there is only a small difference in the average area operated of farms in the two citrus industry size groups, the larger farms have a much larger proportion of the property developed for production (table 13). The average area of citrus on large farms is nearly three times more than that on small farms. There are also some signs that more large farms have been replacing or expanding tree and vine plantings in recent years, as around 12 per cent of tree and vine area on large farms is currently non-bearing, compared with just 4 per cent on small farms.
Apart from the area of the farming operation, there are no other major differences in the production aspects of the groups with similar yields and irrigation applica-tion rates.
There are only minor differences in the average cost structure of farms in these two groups (table 14). Average cash costs per hectare of trees and vines are around $7600 and $8600 for small and large farms respectively. Large farms have higher per hectare costs of hired labour, fertiliser and chemicals but lower per hectare costs of contracts. The latter is because it becomes economical to purchase or lease the required plant and machinery as farm size increases, meaning that they
rely less heavily on contract services.
Receipts from citrus and grapes for farms in these two size groups are roughly proportional to production of these crops. However, large farms also earned around $140 000 of revenue from other crops such as nuts, and from produce sales in the previous fi nancial year.
In many respects these survey results reinforce the general conclusions made by Murray Valley Citrus Marketing Board in their 2001 submission to the
table 13 key physical characteristics of citrus farms in mildura–wentworth, by size of operation average per farm
small large farm area total farm area operated ha 95 (47) 105 (39)
citrus bearing area ha 14 (16) 38 (9)
nonbearing area ha 1 (39) 6 (76)
total area ha 15 (14) 44 (12)
total trees and vines bearing area ha 24 (16) 50 (12)
nonbearing area ha 1 (39) 7 (64)
total area ha 25 (17) 57 (11)
production citrus t 478 (23) 1 368 (15)
citrus yield t/ha 34 (15) 36 (9)
irrigation application rate citrus ML/ha 9.2 (7) 8.6 (8)

33
mildura–wentworth » abare research report 07.6
Productivity Commission inquiry into citrus growing and processing. That submis-sion noted that in six years of benchmarking of citrus growers’ fi nancial business performance, participants reported, on average, losses in four of the six years (Murray Valley Citrus Marketing Board 2002). However, the submission also noted that the top 25 per cent of growers achieved some good results in some years. The ABARE survey results also highlight how the smallest two-thirds of farms recorded modest farm incomes in 2005-06 and a small farm business loss, which is in contrast to the strong fi nancial performance of the largest third of farms.
The larger citrus farms in this region achieved good results in 2005-06, with positive average farm cash income and farm business profi t underpinning an average rate of return of 3.9 per cent. This compares favourably with the average rate of return for broadacre grazing and cereal crop-ping farms of around 1.3 per cent in 2005-06 and was well above that earned by small and medium grape growing farms. However, it is much lower than the
table 14 fi nancial performance of citrus farms in mildura–wentworth, by size of operation average per farm
small large
cash receipts citrus $ 140 113 (20) 408 207 (7)
grapes $ 39 262 (47) 43 320 (56)
other crops $ 13 592 (59) 101 299 (47)
previous year crop $ 15 343 (76) 40 838 (34)
total cash receipts $ 229 277 (16) 627 171 (10)
cash costs hired labour $ 61 297 (20) 164 595 (11)
fertiliser $ 11 408 (28) 45 662 (22)
crop and pasture chemicals $ 5 656 (30) 24 336 (23)
fuel,oil and grease $ 8 462 (13) 19 784 (17)
repairs and maintenance $ 14 486 (12) 37 592 (19)
tree and vine replacement $ 1 868 (57) 3 579 (67)
contracts $ 18 604 (40) 12 391 (30)
interest $ 20 780 (41) 36 908 (58)
other costs $ 48 252 (16) 144 230 (11)
total cash costs $ 190 812 (14) 489 076 (8)
farm cash income $ 38 465 (44) 138 095 (34)
less depreciation $ 11 761 (9) 22 319 (17)
less imputed family labour $ 28 466 (17) 37 221 (19)
farm business profi t $ –1 762 (1041) 78 555 (55)
profi t at full equity $ –4 829 (649) 135 153 (42)
capital appreciation $ 14 449 (226) 23 613 (521)
profi t at full equity including capital appreciation $ 9 621 (495) 158 766 (89)
total value of capital at 30 June $ 1 438 382 (9) 3 464 907 (8)rate of return – excl. capital appreciation % 1.4 (112) 3.9 (40)
– incl. capital appreciation % 2.4 (112) 4.6 (92)
total farm debt a $ 250 730 (49) 721 366 (43)
equity ratio a % 83 (9) 79 (11)
total liquid assets b $ 164 925 (39) 167 398 (28)
off-farm income $ 22 314 (49) 22 745 (37)
a Only includes farms that provided information on debt. b Only includes farms that provided information on liquid assets.

34
mildura–wentworth » abare research report 07.6
average rate of return (excluding capital appreciation) for large viticultural farms in the region.
At the other end of the scale, it is estimated that the average farm cash income for the smallest two-thirds of farms was just under $40 000 and these farms recorded a small farm business loss.
It appears that the level of indebtedness and debt servicing ability among citrus growers in the region has deteriorated since the late 1990s. The results from the ABARE survey indicate that the average equity ratio at the end of 2005-06 was 83 per cent and 79 per cent for small and large farms respectively. This is substan-tially below the median values reported in the Bizcheck results for citrus growers in the Murray Valley, which ranged from 88 to 93 per cent from 1994-95 to 1998-99 (Murray Valley Citrus Marketing Board 2001). Furthermore, the ratio of debt to farm receipts has also increased substantially from a median level around 0.4 during the late 1990s to an average of more than one in 2005-06.
While these results may appear to lead to the conclusion reached by the Murray Valley Citrus Marketing Board in 2002 that ‘this could hardly be summarised as the performance of a healthy industry’ (Murray Valley Citrus Marketing Board 2002, p. 1), as discussed earlier, it is important that off-farm income also be considered when analysing the situation of farm households.
Given the modest farm fi nancial performance of smaller farms, off-farm income represents a very important component of farm household income. Off-farm income for small farms was around $22 000 in 2005-06 and accounted for a little over a third of average farm household income in this group.
In summary, not unlike the conclusion drawn by the Murray Valley Citrus Marketing Board in late 2001, ABARE’s survey results point to citrus growers falling into one of two categories. The fi rst comprises large farms that are reporting healthy profi ts and a positive rate of return and the owners of these businesses are not heavily reliant on off-farm income. The second category comprises small and medium size farms that record smaller profi ts and, as a consequence, the owners of these farm businesses rely more heavily on off-farm income to support the needs of the farm household.

35
appendix
survey methodology
target populationsABARE surveys are designed and samples selected on the basis of a framework drawn from the Business Register maintained by the Australian Bureau of Statistics (ABS). This framework includes agricultural establishments in each statistical local area classifi ed by size and major industry. The estimates published in this report cover establishments with an estimated value of agricultural operations of $22 500 or more. A defi nition of the estimated value of agricultural operations is given in Australian Standard Industrial Classifi cation (ABS 1983, cat. no. 1201.0).
defi nition of industriesIndustry defi nitions are based on the Australian and New Zealand Standard Industrial Classifi cation (ANZSIC). This classifi cation is in line with an international standard that is applied comprehensively across Australian industry, permitting comparisons between industries, both within Australia and internationally. Farms assigned to a particular ANZSIC class have a high proportion of their total output characterised by that class. Further information on ANZSIC and on the farming activities included in each of these industries is provided in Australian and New Zealand Standard Industrial Classifi cation (ABS 1993, cat. no. 1292.0).
For the purpose of this survey, farms are included in the grape growing industry if they are classifi ed in ANZSIC 114 and the population of citrus growers comprise farms in ANZSIC 119 who grow citrus.
survey design and sample weightingThe population was fi rst stratifi ed by industry. Each stratum was then stratifi ed by operation size using EVAO. The size stratum boundaries were determined using the Dalenius-Hodges method. The sample allocation to each stratum was done using a mixture of Neyman allocation, which takes into account the variability within strata of the auxiliary variable, in this case EVAO, and proportional alloca-tion, which only considers the population number in each stratum. Neyman alloca-
A

36
mildura–wentworth » abare research report 07.6
tion allocates large proportions of sample to strata with large variability, in the case of this survey, strata of larger farms.
The estimates presented in this report are calculated by appropriately weighting the data collected from each sample farm and then using the weighted data to calculate population estimates. Generally, larger farms have small weights and smaller farms have larger weights, refl ecting the strategy of sampling a higher fraction of the larger farms than of small farms (the former having a wider range of variability of key characteristics).
reliability of estimatesThe reliability of the estimates of population characteristics presented in this report depends on the design of the sample and the accuracy of the measurement of characteristics for the individual sample farms.
sampling errors
Only a small number of farms out of the total number of farms in a particular industry are surveyed. The data collected from each sample farm are weighted to calculate population estimates. Estimates derived from these farms are likely to be different from those that would have been obtained if information had been collected from a census of all farms. Any such differences are called ‘sampling errors’.
The size of the sampling error is most infl uenced by the survey design and the estimation procedures, as well as the sample size and the variability of farms in the population. The larger the sample size, the lower the sampling error is likely to be. Hence, national estimates are likely to have smaller sampling errors than industry and state estimates.
To give a guide to the reliability of the survey estimates, sampling errors have been calculated for all estimates in this report. These estimated errors, expressed as percentages of the survey estimates and termed ‘relative standard errors’, are given next to each estimate in italics inside parentheses.

37
mildura–wentworth » abare research report 07.6
comparing estimates
When comparing estimates between two groups, it is important to recognise that the differences are subject to sampling error. As a rough rule of thumb, a conserva-tive estimate (an overestimate) of the standard error of the difference can be constructed by adding the squares of the estimated standard errors of the compo-nent estimates and taking the square root of the result. An example is given below.
The estimates of farm cash income are $59334 for grapes growers and $51664 for citrus growers — a difference of $7670 — and the relative standard errors are given as 38 and 42 per cent respectively. The standard error of the difference can be estimated as:
38 x $59334 /100 42 x $51664 /100 $312922 2( ) ( )+ =
Then, it is possible to calculate a 95 per cent confi dence interval for the difference as:
$7670 ± 1.96 x $31292 = (–$53662, $69002)
Hence, if 100 different samples are taken, in 95 of them, the difference between these two estimates is between –$53 662 and $69 002. Also, since zero is in this confi dence interval, it is possible to say that the difference between the estimates is not statistically signifi cantly different from zero at the 95 per cent confi dence level.
When more than one pair wise comparison was made the Bonferroni inequality was used to construct the confi dence intervals.

38
mildura–wentworth » abare research report 07.6
references
ABS (Australian Bureau of Statistics) 2005, Australian Wine and Grape Industry, cat. no. 1329.0, Canberra (and previous issues).
—— 2006, International Trade – Australia, cat. no. 5465.0, Canberra (and previous issues).
Anderson, K. and Norman, D., 2003, Global Wine Production, Consumption and Trade, 1961 to 2001, Centre for International Economic Studies, Adelaide.
Citrus Growers Australia (CGA) 2006, Citrus Growers Australia 58th Annual Report, Mildura.
European Commission 2006, Eurostat database, Brussels (http://epp.eurostat.ec.europa.eu).
Horticulture Australia Limited 2004, Australian Horticulture Statistics Handbook 2004, Sydney.
Murray Valley Citrus Marketing Board 2001, Strengthening the Citrus Growing Business, A submission to the Productivity Commission Inquiry into the Citrus Industry, November.
Murray Valley Citrus Marketing Board 2002, Response to Productivity Commis-sion Position Paper on Citrus Growing and Processing, Submission DR98, Mildura (www.pc.gov.au/inquiry/citrus/subs/subdr098.pdf).
Primary Industries and Resources South Australia (PIRSA) 2005, The Price of Frozen Concentrate Orange Juice, Adelaide, December.
Productivity Commission 2002, Citrus Growing and Processing, Report no. 20, AusInfo, Canberra.
RMCG and Scholefi eld Robinson Horticultural Services 2005, Benchmarking Final Report 2002-03 and 2003-04, part 1,Report on Results ‘Bizcheck’ Survey Dried Fruits, Report prepared for the Australian Dried Fruit Association, Mildura.
Rose, R. and Gordon, W. 2006, ‘Wine industry- strategic global directions and Australian outlook to 2010-11’, Australian Commodities, vol. 13, no. 1, March quarter, pp. 162–74.
Scholefi eld Robinson Horticultural Services 2006, Opportunities for Value Adding and Regional Diversifi cation, Report prepared for Mildura Rural City Council, Victoria, November.

39
mildura–wentworth » abare research report 07.6
Sheales, T., Apted, S., Dickson, A., Kendall, R. and French, S. 2006, Australian Wine Industry: Challenges for the Future, ABARE Research Report 06.16, Canberra, October.
Street Ryan and Associates 2006, Australian Irrigated Horticulture – Oppor-tunities for Gaining Economies of Scale Through Collaboration, Draft Report, Gisborne, December.
US Department of Agriculture 2005, Australia Dried Fruit Annual 2005, Foreign Agriculture Service Global Agriculture Information Network Report, Washington DC, November.
—— 2006, Peoples Republic of China – Dried Fruit 2006, Foreign Agriculture Service Global Agriculture Information Network Report, Washington DC, October.
—— 2007, Demand for Food Quantity and Quality in China, Economic Research Service Research Report no. 32, Washington DC, January.
Wittwer, G. and Rothfi eld, J. 2006, The Global Wine Statistical Compendium 1961 to 2004, Australian Wine and Brandy Corporation, Adelaide.

40
RESEARCH FUNDING ABARE relies on fi nancial support from external organ isations to complete its research program. As at the date of this publication, the following organisations had provided fi nancial support for ABARE’s research program in 2005-06 and 2006-07. We gratefully acknowledge this assistance.
Agricultural Production Systems Research Unit
Asia Pacifi c Economic Cooperation Secretariat
AusAid
Australian Centre for International Agricultural Research
Australian Greenhouse Offi ce
Australian Government Department of the Environment and Heritage
Australian Government Department of Industry, Tour-ism and Resources
Australian Government Department of Prime Minister and Cabinet
Australian Government Department of Transport and Regional Services
Australian Wool Innovation Limited
CRC – Plant Biosecurity
CSIRO (Commonwealth Scientifi c and Industrial Research Organisation)
Dairy Australia
Department of Business, Economic and RegionalDevelopment, Northern Territory
Department of Premier and Cabinet, Western Australia
Department of Primary Industries, New South Wales
Department of Primary Industries, Victoria
East Gippsland Horticultural Group
Fisheries Research and Development Corporation
Fisheries Resources Research Fund
Forest and Wood Products Research and Development Corporation
Grains Research and Development Corporation
Grape and Wine Research and Development Corporation
GHD Services
Independent Pricing and Regulatory Tribunal
International Food Policy Research Institute
Land and Water Australia
Meat and Livestock Australia
Minerals Council of Australia
Ministry for the Environment, New Zealand
National Australia Bank
Newcastle Port Corporation
NSW Sugar
Rio Tinto
Rural Industries Research and Development Corporation
Snowy Mountains Engineering Corporation
University of Queensland
US Environmental Protection Agency
Wheat Export Authority
Woolmark Company
02.07