Cole & Associates, LLC - Somerville 2 Table Contents . I. Introduction 3 . II Previous Municipal...
42
Cole & Associates, LLC 3986 Princeton Pike Lawrenceville, NJ 08648 [email protected] Borough of Somerville Municipal Parking Lots 1, 2, 4 & 6 Capacity Analysis 1/2010 Prepared for the Somerville Borough Planning Board By, Michael Cole, PE, PP, AICP, CME, CPG 609-306-2877 609-688-0363 fax
Transcript of Cole & Associates, LLC - Somerville 2 Table Contents . I. Introduction 3 . II Previous Municipal...

Cole & Associates, LLC 3986 Princeton Pike Lawrenceville, NJ 08648
Borough of Somerville Municipal Parking Lots 1, 2, 4 & 6
Capacity Analysis 1/2010
Prepared for the Somerville Borough Planning Board
By,
Michael Cole, PE, PP, AICP, CME, CPG
609-306-2877 609-688-0363 fax

Page 2
Table Contents
I. Introduction 3 II Previous Municipal Parking Lot Studies 3 III. Existing Municipal Lot Sizes & Location 3 IV. Parking Capacity Analysis Approach 4 V. Parking Count Data 5 VI. Comparison Between Parking Count Data 5 VII. Analysis of Parking Count Data 14 VIII. Analysis of the Parking Count Data Summary Table 16 IX. Impact of Additional Residential Parking in the Parking Lots 19 X. Walking Distance to Surface Parking Lots 19 XI. Parking Management Approach 20 Appendix A 22

Page 3
I. Introduction
The Central Business District (CBD) B-1 zone district contains municipal surface parking lots. Specifically, municipal parking lot #1, #2, #4 and #6 are within the B-1 zone district. Due to number and location of the municipal surface lots, the B-1 zone district does not require onsite parking for non residential land development applications. However, onsite parking is required for residential use. The primary purpose of the municipal parking lots is to provide parking for patrons and employees of the businesses located within the CBD. To create more foot traffic and a more vibrant CBG, mixed use developments with one and two bedroom apartments located on the upper floors is encouraged. A parking capacity analysis was performed to determine if sufficient capacity exists in the municipal lots to accommodate residential uses. The results of this study are as follows:
II. Previous Municipal Parking Lot Studies
Over the last eight (8) years the Borough has performed five (5) parking studies as specified below:
1. Borough of Somerville Parking Conditions & Management Report by Urbitran Associates, Inc., dated March 2002;
2. Borough of Somerville Operations Report by Bier Associates, dated June 6, 2006;
3. Borough of Somerville Parking Report Executive Summary, Revenue & Expenses Summary by Bier Associates, dated May 16, 2007; and
4. Parking System Formation Study, Borough of Somerville, NJ, by Level G Associates, LLC, dated August 18, 2008.
5. Parking counts performed on municipal lots 1, 2, 4, 6 & 7 by Sean Decker and Richard Reitman, February, 2008.
We have reviewed the above referenced documents and included applicable data within our analysis.
III. Existing Municipal Lot Sizes and Location
All of the municipal parking lots located within the B-1 Central Business District are located directly behind property that front on Main Street. Municipal lots #1, #2 and #6 are located north of Main Street and municipal lot #4 is located south of Main Street. The specific location of each lot is as follows:

Page 4
Municipal Lot #1
This parking lot is located between and accessed by Davenport and Maple Street and currently has 174 parking spaces. The lot is currently being redesigned and, based upon the preliminary layout, will increase in size by 5 parking spaces. The area also contains private parking lots which abuts the public spaces. Generally, the private spaces are identified by signage and the municipal spaces have parking meters. The redesign includes removal of the parking meters, installation of two (2) pay stations, landscaping, granite block curbing, new lighting and numbering of the spaces.
Municipal Lot #2
Municipal lot #2 is accessed by Hunterdon Street and Doughty Avenue. The lot is currently 130 parking spaces. The lot is currently being redesigned and the size of the lot will decrease by approximately four spaces (based on the preliminary design). The area also contains private parking lots which abuts the public spaces. Generally, the private spaces are identified by signage and the municipal spaces have parking meters. The redesign includes removal of the parking meters, installation of two (2) pay stations, landscaping, granite block curbing, new lighting and numbering of the spaces.
Municipal Lot #4
The parking lot is accessed by Union and South Street and contains 113 parking spaces.
Municipal Lot #6
Ingress/egress to this parking lot is by North Bridge Street. In addition, the egress is also provided via a alley way to Maple Street. The lot has thirty six (36) parking spaces.
IV. Parking Capacity Analysis Approach
The heart of the CBG is Main Street. The buildings located along Main Street are used for a wide range of uses. These uses include retail shops, restaurants, commercial offices, boutique stores, nail salons, etc. Therefore, the adjoining municipal lots are used by the public for many
Page 5
different reasons, shopping, dining, working, etc. Shared parking is the “use of a parking space to serve two or more individual land uses without conflict or encroachment”. “The ability to share parking spaces is the result of two conditions; 1) variations in the accumulation of vehicles by hour, by day or by season at the individual land uses, and 2) relationships among the land uses that result in visiting multiple land uses on the same auto trip” (quoted from Shared Parking by the Urban Land Institute, 2nd edition). By definition, these parking lots are used for shared parking. Under these conditions, the Institute of Transportation Engineers (ITE) recommends using methodology recommended in the 2nd edition of Shared Parking, by Urban Land Institute (ULI). The methodology stated in the 2nd edition of Shared Parking will be employed herein.
V. Parking Count Data
The data from the parking counts obtained from Urbitran Associates, Inc. Decker/Reitman and Cole and Associates, LLC are presented a graphical format for each parking lot. The data is included in appendix A of this report.
VI. Comparison Between Parking Count Data
The following tables provide a graphic comparison of the 2001, 2008 & 2009 parking data:

Weekday Parking Utilization Municipal Parking Lot #1 Comparison
Between Data Collected 2001 through 2009
137
163
108
129
86
6360
109
85
122
65
72
59
71
108
57
90
73
56
76
115
141
77
0
20
40
60
80
100
120
140
160
180
10:00:00 AM 12:00:00 PM 2:00:00 PM 4:00:00 PM 6:00:00 PM 7:00:00 PM 8:00:00 PM
Count Hours
Tota
l N
um
ber
of
Car
s
6/28/2001Feb-0811/10/200911/13/2009
Total Number of Parking Spaces = 174
Note: The Data Collected in February 2008 at 3:00 PM is depicted as 4:00 PM for Comparison purposes
Page 6

Weekday Parking Utilization Municipal Parking Lot #2 Comparison
Between Data Collected 2001 through 2009
107
113
103
98
57
69
84
91
61
78
55
73
64
39
80
53
77
54
42
49
63
80
73
0
10
20
30
40
50
60
70
80
90
100
110
120
130
10:00:00 AM 12:00:00 PM 2:00:00 PM 4:00:00 PM 6:00:00 PM 7:00:00 PM 8:00:00 PM
Count Hours
Tota
l N
um
ber
of
Car
s
6/28/2001Feb-0811/10/200911/13/2009
Total Number of Parking Spaces = 130
Note: The Data Collected in February 2008 at 3:00 PM is depicted as 4:00 PM for Comparison
purposes
Page 7

Weekday Parking Utilization Municipal Parking Lot #4 Comparison
Between Data Collected 2001 through 2009
35
111
46
30
48
56
76
113
73
113
40
52 53
64
61
47
112
65 65
70
96
104
101
0
10
20
30
40
50
60
70
80
90
100
110
120
10:00:00 AM 12:00:00 PM 2:00:00 PM 4:00:00 PM 6:00:00 PM 7:00:00 PM 8:00:00 PM
Count Hours
Tota
l N
um
ber
of
Car
s
6/28/2001Feb-0811/10/200911/13/2009
Total Number of Parking Spaces = 113 Note: The Data Collected in February 2008 at 3:00 PM is depicted as 4:00 PM for Comparison purposes
Page 8

Weekday Parking Utilization Municipal Parking Lot #6 Comparison
Between Data Collected 2001 through 2009
31
3736
28
20
38
36 36
29 29
33
35
26
12
14
3536
31
18
9
28
36
26
0
10
20
30
40
10:00:00 AM 12:00:00 PM 2:00:00 PM 4:00:00 PM 6:00:00 PM 7:00:00 PM 8:00:00 PM
Count Hours
Tota
l N
um
ber
of
Car
s
6/28/2001Feb-0811/10/200911/13/2009
Total Number of Parking Spaces = 36 Note: The Data Collected in February 2008 at 3:00 PM is depicted as 4:00 PM for Comparison
purposes
Page 9

Weekend Parking Utilization Municipal Parking Lot #1 Comparison
Between Data Collected 2001 through 2009
115
141
122
6157
6763
65
79
59
133
105
79
53
106
159
165
137
0
20
40
60
80
100
120
140
160
180
Friday,7:00 PM
Friday ,8:00 PM
10:00:00AM
12:00:00PM
2:00:00PM
4:00:00PM
6:00:00PM
7:00:00PM
8:00:00PM
9:00:00PM
Count Hours
Tota
l N
um
ber
of
Car
s
11/13/2009 Feb-086/30/2001 11/7/200911/14/2009
Total Number of Parking Spaces = 174
Page 10

Weekend Parking Utilization Municipal Parking Lot #2 Comparison
Between Data Collected 2001 through 2009
63
8078
47
5350
24
3027
32
99
109
25
39
57
99
122
104
0
10
20
30
40
50
60
70
80
90
100
110
120
130
Frid
ay, 7
:00
PM
Frid
ay, 8
:00
PM
10:0
0:00
AM
12:0
0:00
PM
2:00
:00
PM
4:00
:00
PM
6:00
:00
PM
7:00
:00
PM
8:00
:00
PM
9:00
:00
PM
Count Hours
Tota
l N
um
ber
of
Car
s
11/13/2009 Feb-086/30/2001 11/7/200911/14/2009
Total Number of Parking Spaces = 130
Page 11

Weekend Parking Utilization Municipal Parking Lot #4 Comparison
Between Data Collected 2001 through 2009
96
104
113
63
70
66
53
85
94
67
111
101
71
63
85
113111
97
0
20
40
60
80
100
120
Friday,7:00 PM
Friday,8:00 PM
10:00:00AM
12:00:00PM
2:00:00PM
4:00:00PM
6:00:00PM
7:00:00PM
8:00:00PM
9:00:00PM
Count Hours
Tota
l N
um
ber
of
Car
s
11/13/2009 Feb-086/30/2001 11/7/200911/14/2009
Total Number of Parking Spaces = 113
Page 12

Weekend Parking Utilization Municipal Parking Lot #6 Comparison
Betwen Data Collected 2001 through 2009
28
36
29
11
14
16
6
3
5
3
34
19
9
4
10
35
36
29
0
10
20
30
40
Friday,7:00 PM
Friday,8:00 PM
10:00:00AM
12:00:00PM
2:00:00PM
4:00:00PM
6:00:00PM
7:00:00PM
8:00:00PM
9:00:00PM
Count Hours
Tota
l N
um
ber
of
Car
s
11/13/2009 Feb-086/30/2001 11/7/200911/14/2009
Total Number of Parking Spaces = 36
Page 13

Page 14
VII. Analysis of Parking Count Data
Parking lots are generally considered full when 85% to 95% of the spaces are occupied. For the purposes of this analysis parking lots are considered full when 90% of the spaces are occupied. Using this definition the lots are considered full when the following thresholds are reached:
Parking Lot # Total # of Spaces Capacity (90% of total #)
1 174 157
2 130 117
4 113 102
6 36 32
The analysis of the parking counts per parking lot is as follows:
Municipal Parking Lot #1
During weekday hours this lot was daily full at 12:00 PM and was at 89% and 82% capacity, respectively at 10:00 AM and 4:00 PM in 2001. There has been a dramatic drop in usage during work hours as the lot capacity peaks during the lunch hour at 70% in February, 2008. Currently, the lot peaks at 57% during the week. Under current conditions, the lot has an additional capacity of 67 spaces (during work hours during the week).
The use of the lot after work hours has almost doubled since 2001 as 63 cars used the lot in 2001 and 122 cars were parked in 2008 (comparison of 7:00 PM on a Thursday night in 2001 and a Friday, night in February, 2008). The Friday night data between 2008 and 2009 is very similar at 7:00 PM (122 versus 115 cars parked). Currently, during the work week the lot reaches maximum use at 8:00 PM on a Friday night when the lot is 90% full. It is not clear whether the lot is routinely this full on a Friday night as only data for only one night exists for a Friday night at 8:00 PM. It is our opinion that the increase in use of the lot in the evenings represents the increase in popularity in the CBD for dining and socializing.
On the weekend, the lot is at 41% capacity during the day. The use of the lot on the weekend during the day has remained consistent over the data sets. The peak use of the lot occurs on Saturday night during the hours of 7:00 PM and 9:00 PM where the use of the lot ranges from full (165 cars) to 67% capacity (105 cars).
Municipal Parking Lot #2

Page 15
As was the case in parking lot #1, the use of the parking lot during the week day work hours has decreased. The lot was between 97% and 84% full during the work week day in 2001. In 2008, the parking lot utilization ranged 77% and 72%. Currently, the utilization of the parking lot during the work week day is between 66% and 47%. Under current conditions the lot has an additional capacity of 40 spaces (during work hours during the week).
The use of the lot after work hours has marginally increased since 2001 as 69 cars used the lot in 2001 and 122 cars were parked in 2008 (comparison of 7:00 PM on a Thursday night in 2001 and a Friday night in February, 2008). The Friday night data between 2008 and 2009 indicates a decrease in use (78 versus 63 cars parked). If a comparison is made between the 2001 and 2009 data, the use of the lot after work hours during the week has actually decreased. Currently, during the work week the lot reaches maximum use at 8:00 PM on a Friday night when the lot is 68% full.
On the weekend, the lot is currently used at 26% capacity during the day. The use of the lot on the weekend during the day decreased from a maximum of 53 cars parked in 2001 to a max of 30 cars parked in 2009. The peak use of the lot occurs on Saturday night during the hours of 7:00 PM and 9:00 PM where the use of the lot ranges from full (122 cars) to 85% capacity (99 cars).
Municipal Parking Lot #4
This lot is, on a daily basis, full at 12:00 PM on all parking count data sets during week days. On any given hour of the week day the lot is used 10% to 40% more in 2008 & 2009 than in 2001. If the noon hour is not counted the lot is currently 52% full throughout the day (the average of the 10:00 AM, 2:00 PM and 4:00 PM data). A parking lot the reaches daily capacity at noon indicates that the lot daily being used by patrons of the restaurants for lunch.
After work hours Monday through Thursday, the lot is currently used at 62% capacity (the 11/10/09 & 6/28/09 parking counts were collected on a Tuesday and Thursday, respectively).
On Friday and Saturday nights the lot is between 94% and 100% full during the hours of 7:00 PM and 9:00 PM. During Saturday the lot is currently between 92% and 83% full during the hours of 12:00 PM and 2:00 PM and this represents a 20% to 30% increase in usage as compared to the parking count data from 2001.

Page 16
Municipal Parking Lot #6
During the weekday the lot capacity ranges between 82% and 100% full on all parking count data sets. Currently in the evenings of Monday through Thursday, the lot is 43% occupied whereas in 2001 the lot ranged between full and 62% full during the same period. During Friday and Saturday nights between 7:00 and 8:00 PM the lot is 88% to 100% full. The lot receives very little use during the day on Saturday and (maximum of 16% of its spaces used) and this is approximately 50% less use than 2001.
VIII. Analysis of the Parking Count Data Summary Table
The data presented in Section VII is depicted in the following tables:
Weekday Data- Work Hours
Municipal Parking Lot #
Total Number of Parking spaces*
Spaces Used 2001/ 2008/2009
Percent Full Inventory Remaining
1 157 163/109/90
100/70/57 0/48/67
2 117 113/91/77
97/78/66 4/26/40
4 102 111/113/112
100
0/0/0
6 32 37/36/36
100 0/0/0
Weekday Data- Monday Thru Thursday

Page 17
6:00 PM to 8:00 PM
Municipal Parking Lot #
Total Number of Parking spaces*
Spaces Used 2001/2009
Percent Full Inventory Remaining
1 157 86/108
55/69 71/49
2 117 69/80
59/68 48/37
4 102 48/64
47/63
54/38
6 32 38/14
100/44 0/18
Friday Night
7:00 PM to 8:00 PM
Municipal Parking Lot #
Total Number of Parking spaces*
Spaces Used 2008/2009
Percent Full Inventory Remaining
1 157 122/141
77/90 35/16
2 117 78/80
59/68 48/37
4 102 113/104
100/100
0/0
6 32 38/36
100/100 0/0
Saturday Night
7:00 PM to 9:00 PM

Page 18
Municipal Parking Lot #
Total Number of Parking spaces*
Spaces Used 2009
Percent Full Inventory Remaining
1 157 165
100 0
2 117 122
100 0
4 102 113
100
0
6 32 36
100 0
Saturday Day
Municipal Parking Lot #
Total Number of Parking spaces*
Spaces Used 2001/2009
Percent Full Inventory Remaining
1 157 67/79
43/50 114/78
2 117 53/39
45/33 64/84
4 102 70/94
69/92
32/8
6 32 16/5
50/16 16/27
Table notes: 1. Number of parking spaces indicated in the above tables is 90% of the
total number of parking spaces 2. The parking counts listed in the tables are the maximum numbers per
the time interval specified. For example if the parking counts were 78, 88 & 98 respectively between the hours of 7:00 PM & 9:00 PM the value listed in the table would be 98.
3. The number of parking spaces per parking lot in the 6/2001 parking
study is greater than the current size of each parking lot. IX. Impact of Additional Residential Parking in the Parking Lots

Page 19
The ULI Shared Parking Report recommends the following time of day factors for residential uses for weekends and weekdays:
Land Use
6 AM 7 AM
8 AM
9 AM
10 AM
11 AM
Noon 1PM- 3PM
4 PM 5 PM 6 PM 7-8PM
Resident
Guest
- 20% 20% 20% 20% 20% 20% 20% 20% 40% 60% 100%
Resident 100% 90% 85% 80% 75% 70% 65% 70% 75% 85% 90% 97%
As the above chart indicates the impact to the parking lots by residential parking is offset during the day but no offset exists after 7:00 PM. The ULI also has tables for monthly variation in parking demand per land use. Since the parking lots in question serve many different businesses, these factors were not applied to the above stated parking counts since the actual percentages of each land use are not known.
X. Walking Distance to Surface Parking Lots
The ULI Shared Parking Report ranks the walking distance from surface parking lots using a level-of- service (LOS) similar to employed in traffic engineering. This data is as follows:
Maximum Walking Distance
LOS D LOS C LOS B LOS A
Surface Lot Parking to Destination
1,600 Ft. 1,200 Ft. 800 Ft. 400 Ft.
There are many factors used in determining the appropriate level of service. These factors include the following items;
1. Long/short term;
2. Low/high turnover;
3. familiarity/unfamiliar;
4. Age of drivers
5. Setting (urban/rural)
6. Trip purpose (special event, single product purchase, etc.)
Page 20
In evaluating whether these municipal lots should be used for residential use the Board should also consider the walking distance from the Building to the surface parking lots. In general terms, long term, low turnover parking can have a LOS of C or D. Parking for residences can be categorized as long term low turnover parking. Should the Board determine that the municipal lots #1 & #2 can be used residential parking we recommend that the ordinance be amended to require that the mixed use buildings be located within 800 feet of one of the surface lots. This is conservative as it equates to a LOS B.
XI. Parking Management Approach
For shopping centers ULI states that the 20th highest hour of the year as the appropriate hour for determining parking requirements. For shopping centers this translates to designing the parking lot for a mid December day. This criteria is not appropriate for parking lots in a urban setting that serve a CBD. Ideally these parking lots should be 100% occupied everyday as this produces the maximum amount of foot traffic to the CBD from the parking lot. Using this approach our recommendation is as follows:
1. Do not recommend to Mayor and Council that municipal lots #4 & #6 be used for residential parking because these lots are, on a daily basis, 100% full.
2. Lots #1 & #2 are underutilized everyday and only reach capacity for two (2) hours on Saturday night. The Planning Board should consider recommending to Mayor & Council that these parking lots be used for residential parking for apartments located in the B-1 Central Business District. It is our opinion that any additional demand on a Saturday or Friday night for a two (2) or three (3) hour time period (greater than the parking lots can accommodate) will be handled on the nearby streets or the Warren Street parking deck.
3. A total of 107 spaces are available during the weekday for parking in lots #1 & #2. If the Board recommends 50% or 53 spots be used for apartments, the parking lots would not exceed capacity by 53 spaces during peak use since actual number of cars generated from each apartment is less than the Borough required parking. For example, the Borough ordinance requires 1.8 and 2.0 parking spaces, respectively for a one (1) and two (2) bedroom apartment for a mid rise or garden apartment building. The ULI recommends using a ratio of 1.2 parking spaces for apartment not located downtown but well served by transit and a ratio of 0.75 spaces/rental unit for urban CBD. The ITE, Parking Generation, 3rd edition states average ratio of 1.2 spaces for suburban low-rise apartment and 1.00 spaces for a urban low rise apartment.
If the split in one (1) and two (2) bedrooms apartments is 50% the Borough ordinance would require 1.9 spaces per apartment. If the actual parking generation is 1.1 spaces, the actual number of cars would be reduced by 58%. Therefore, the actual number of cars that would be looking for on-street parking when the lots are full on a

Page 21
Friday or Saturday night (or parking in the Warren Street garage) would be 53 x 0.58 or 31 cars). It is our opinion that on- street parking in the CBD or nearby High Street can accommodate an additional 30 or 40 cars for a few hours on a Friday or Saturday night.
4. The use of the lots #1 & #2 should be limited to apartments located within 800 feet of said lots and a monthly impact fee imposed for the use of the lots. The ULI states that the monthly revenue to break even on a surface lot, using 2004 dollars is $32.00 per space (Table 6-3 of Shared Parking). On a previous Board application the fee of $ 40 dollars was used as the monthly impact fee per space. While the structure of the payment and amount of the fee is between the Governing Body and developer, the Planning Board may want to provide a recommendation to the Governing Body regarding said fee.
5. The parking lots #1 & #2 could be used to accommodate the parking needs of the buildings located within in the PO-R that are within 800 feet of said lots. It is our opinion that these parking lots should be used entirely for activities located within the CBD. Therefore, we are not in favor of recommending this approach.
6. The parking data collected in February, 2008, was during the initial start of the recession. This data, while limited, suggests that the data collected on a Friday night in November, 2009 may be impacted by the recession by 10% or 20% (122 versus 115 cars on lot #1 at 7:00 PM and 78 versus 63 cars at lot #2 at 7:00 PM). Given the limited amount of data the Board is cautioned on drawing any firm conclusions on the impact of the recession on said data.
7. We recommend that the Borough Land Use and Development Ordinance be amended regarding the parking requirements for residential parking in the CBG. Although briefly mentioned herein, a separate analysis/report should be performed to thoroughly review current parking residential parking demand data in an urbanized CBD, in the state, region and country.
8. This report references the monthly cost to operate a surface parking space as $ 32.00 (as per table 6-3 of the ULI Shared Parking Report). All the costs and analysis used to generate this monthly fee is not discussed herein. Since the impact fee discussed with the developer is within the ball park of breakeven fee of $ 32.00 per space and the actual amount of the fee imposed will be determined by the Mayor & Council, a detailed analysis of the monthly fee is not herein discussed. A detailed analysis of the monthly parking fee per space will be prepared and provided to the Mayor and Council (in the near future).

Page 22
Appendix A

Weekday Parking Utilization Municipal Parking Lot #1
6/28/01
100
125
137
149
163
142
108
141
129
85
57
63
0
20
40
60
80
100
120
140
160
180
8:00:00AM
9:00:00AM
10:00:00AM
11:00:00AM
12:00:00PM
1:00:00PM
2:00:00PM
3:00:00PM
4:00:00PM
5:00:00PM
6:00:00PM
7:00:00PM
Count Hours
Tota
l N
um
ber
of
Car
s
Total Number of Parking Spaces = 178
Source: “Borough of Somerville Parking Conditions & Management Report”
by Urbitran Associates, Inc., dated March 2002
Page 23

Weekday Parking Utilization Municipal Parking Lot #2
6/28/01
64
103
107 108
113
107
103
97 98
80
57
69
0
10
20
30
40
50
60
70
80
90
100
110
120
130
8:00:00AM
9:00:00AM
10:00:00AM
11:00:00AM
12:00:00PM
1:00:00PM
2:00:00PM
3:00:00PM
4:00:00PM
5:00:00PM
6:00:00PM
7:00:00PM
Count Hours
Tota
l N
um
ber
of
Car
s
Total Number of Parking Spaces = 132
Source:
“Borough of Somerville Parking Conditions & Management Report” by Urbitran Associates, Inc., dated March 2002
Page 24

Weekday Parking Utilization Municipal Parking Lot #4
6/28/01
26
34 35
44
111
79
46
35
30
34
48
56
0
20
40
60
80
100
120
8:00:00AM
9:00:00AM
10:00:00AM
11:00:00AM
12:00:00PM
1:00:00PM
2:00:00PM
3:00:00PM
4:00:00PM
5:00:00PM
6:00:00PM
7:00:00PM
Count Hours
Tota
l N
um
ber
of
Car
s
Total Number of Parking Spaces = 115 Source:
“Borough of Somerville Parking Conditions & Management Report” by Urbitran Associates, Inc., dated March 2002
Page 25

Weekday Parking Utilization Municipal Parking Lot #6
6/28/01
25
33
31
23
37
20
36
30
28
14
20
38
0
5
10
15
20
25
30
35
40
8:00:00AM
9:00:00AM
10:00:00AM
11:00:00AM
12:00:00PM
1:00:00PM
2:00:00PM
3:00:00PM
4:00:00PM
5:00:00PM
6:00:00PM
7:00:00PM
Count Hours
Tota
l N
um
ber
of
Car
s
Total Number of Parking Spaces = 38
Source:
“Borough of Somerville Parking Conditions & Management Report” by Urbitran Associates, Inc., dated March 2002
Page 26

Weekend Parking Utilization
Municipal Parking Lot #16/30/01
61 6357
7467
0
20
40
60
80
100
120
140
160
180
10:00AM 11:00:00 AM 12:00:00 PM 1:00:00 PM 2:00:00 PM
Count Hours
To
tal
Nu
mb
er
of
Ca
rs
Total Number of Parking Spaces = 178
Source: “Borough of Somerville Parking Conditions & Management Report”
by Urbitran Associates, Inc., dated March 2002
Page 27

Weekend Parking Utilization Municipal Parking Lot #2
6/30/01
47
5153
50 50
0
10
20
30
40
50
60
70
80
90
100
110
120
130
10:00:00 AM 11:00AM 12:00:00 AM 1:00:00 PM 2:00:00 PM
Count Hours
Tota
l N
um
ber
of
Car
s
Total Number of Parking Spaces = 132
Source:
“Borough of Somerville Parking Conditions & Management Report” by Urbitran Associates, Inc., dated March 2002
Page 28

Weekend Parking Utilization Municipal Parking Lot #4
6/30/01
26
34 35
44
111
79
46
35
30
34
48
56
0
20
40
60
80
100
120
8:00:00AM
9:00:00AM
10:00:00AM
11:00:00AM
12:00:00PM
1:00:00PM
2:00:00PM
3:00:00PM
4:00:00PM
5:00:00PM
6:00:00PM
7:00:00PM
Count Hours
Tota
l N
um
ber
of
Car
s
Total Number of Parking Spaces = 115
Source:
“Borough of Somerville Parking Conditions & Management Report” by Urbitran Associates, Inc., dated March 2002
Page 29

Weekend Parking Utilization Municipal Parking Lot #6
6/30/01
11
18
14
1716
0
5
10
15
20
25
30
35
40
10:00:00 AM 11:00:00 AM 12:00:00 PM 1:00:00 PM 2:00:00 PM
Count Hours
Tota
l N
um
ber
of
Car
s
Total Number of Parking Spaces = 38
Source:
“Borough of Somerville Parking Conditions & Management Report” by Urbitran Associates, Inc., dated March 2002
Page 30

Weekday Parking Utilization Municipal Parking Lot #1
February, 2008
69
60
109
85
122
0
20
40
60
80
100
120
140
160
180
9:00:00 AM 10:00:00 AM 12:00:00 PM 3:00:00 PM 7:00:00 PM
Count Hours
Tota
l N
um
ber
of
Car
s
Total Number of Parking Spaces = 174
Source: Counts Performed by Sean Decker & Richard Reitman
Page 31

Weekday Parking Utilization Municipal Parking Lot #2
February, 2008
71
84
91
61
78
0
10
20
30
40
50
60
70
80
90
100
110
120
130
9:00:00 AM 10:00:00 AM 12:00:00 PM 3:00:00 PM 7:00:00 PM
Count Hours
Tota
l N
um
ber
of
Car
s
Total Number of Parking Spaces = 130
Source:
Counts Performed by Sean Decker & Richard Reitman
Page 32
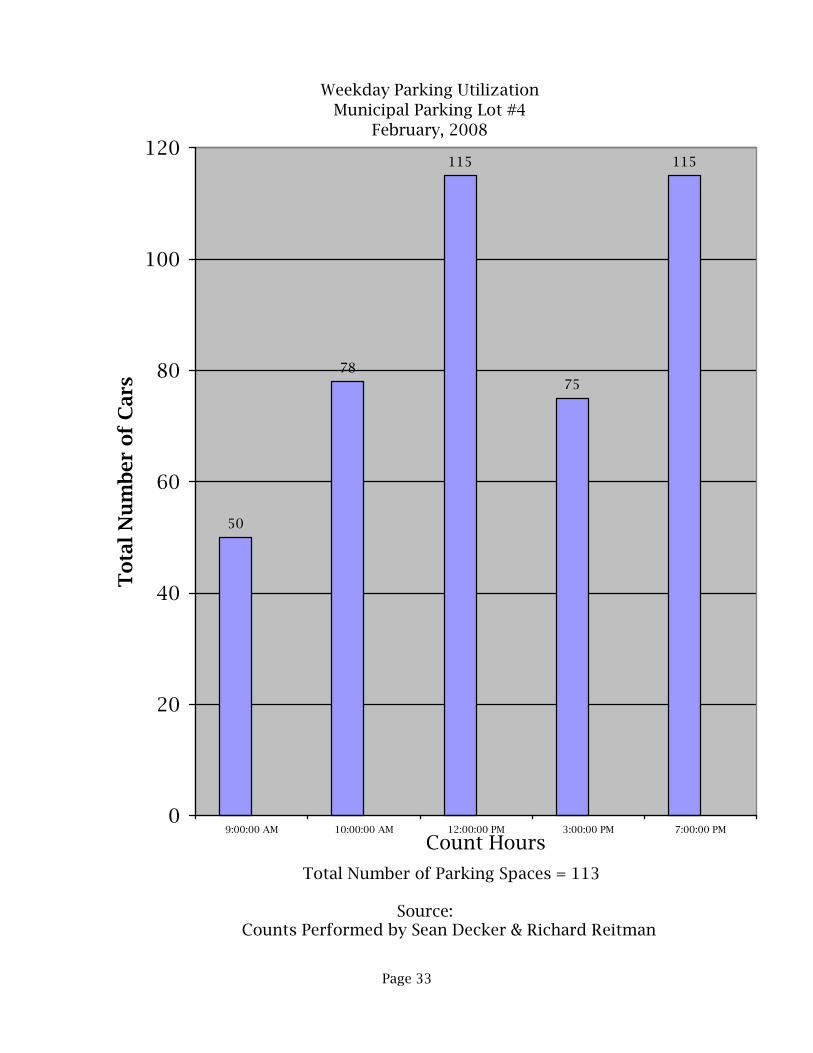
Weekday Parking Utilization Municipal Parking Lot #4
February, 2008
50
78
115
75
115
0
20
40
60
80
100
120
9:00:00 AM 10:00:00 AM 12:00:00 PM 3:00:00 PM 7:00:00 PM
Count Hours
Tota
l N
um
ber
of
Car
s
Total Number of Parking Spaces = 113
Source: Counts Performed by Sean Decker & Richard Reitman
Page 33
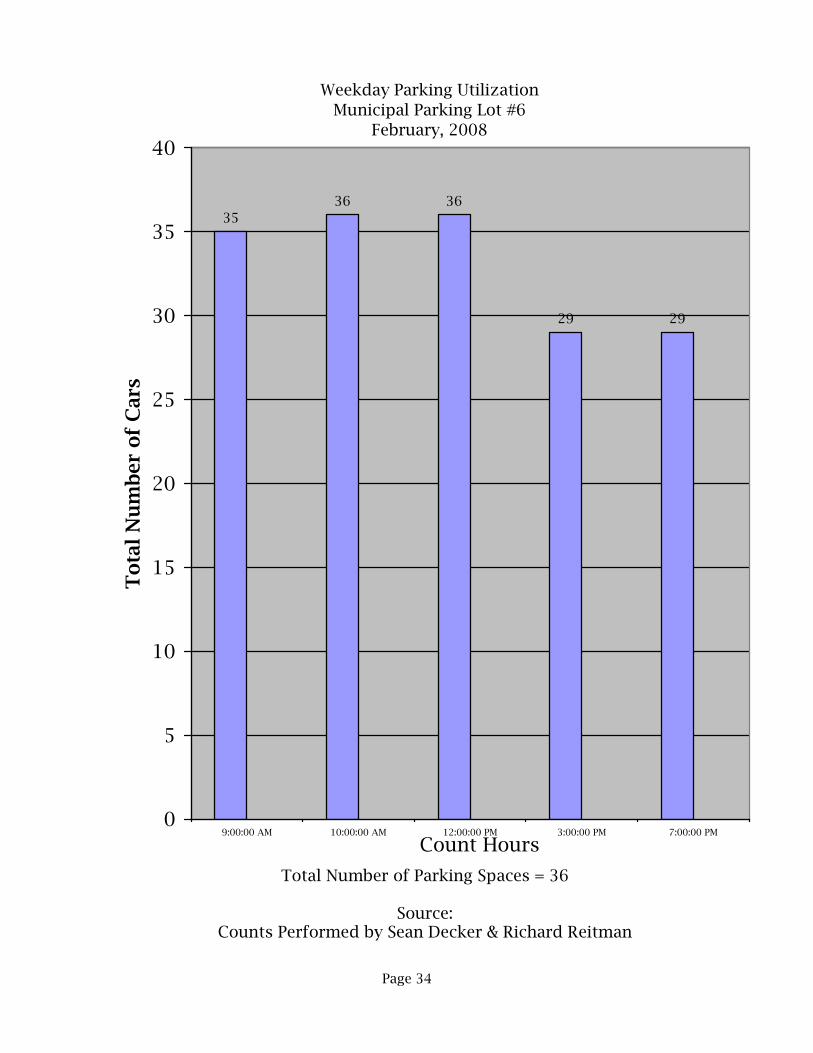
Weekday Parking Utilization Municipal Parking Lot #6
February, 2008
3536 36
29 29
0
5
10
15
20
25
30
35
40
9:00:00 AM 10:00:00 AM 12:00:00 PM 3:00:00 PM 7:00:00 PM
Count Hours
Tota
l N
um
ber
of
Car
s
Total Number of Parking Spaces = 36
Source:
Counts Performed by Sean Decker & Richard Reitman
Page 34

Weekday Parking Utilization Municipal Parking Lot #1
11/10 & 11/13/09
65
7772
59
71
108
57
90
73
56
76
141
0
20
40
60
80
100
120
140
160
180
10:00:00 AM 12:00:00 PM 2:00:00 PM 4:00:00 PM 6:00:00 PM 8:00:00 PM
Count Hours
Tota
l N
um
ber
of
Car
s
Tuesday, 11/10/09Friday, 11/13/09
Total Number of Parking Spaces = 174
Source:
Counts Performed by Cole & Associates, LLC
Page 35

Weekday Parking Utilization Municipal Parking Lot #2
11/10 & 11/13/09
55
73 73
64
39
74
53
77
54
42
49
80
0
10
20
30
40
50
60
70
80
90
100
110
120
130
10:00:00 AM 12:00:00 PM 2:00:00 PM 4:00:00 PM 6:00:00 PM 8:00:00 PM
Count Hours
Tota
l N
um
ber
of
Car
s
Tuesday, 11/10/09Friday, 11/13/09
Total Number of Parking Spaces = 130
Source:
Counts Performed by Cole & Associates, LLC
Page 36

Weekday Parking Utilization Municipal Parking Lot #4
11/10 & 11/13/09
40
101
52 53
6461
47
112
65 65
70
104
0
10
20
30
40
50
60
70
80
90
100
110
120
130
10:00:00 AM 12:00:00 PM 2:00:00 PM 4:00:00 PM 6:00:00 PM 8:00:00 PMCount Hours
Tota
l N
um
ber
of
Car
s
Tuesday, 11/10/09Friday, 11/13/09
Total Number of Parking Spaces = 113
Source:
Counts Performed by Cole & Associates, LLC
Page 37

Weekday Parking Utilization Municipal Parking Lot #6
11/10 & 11/13/09
33
26
35
26
12
14
3536
31
18
9
36
0
10
20
30
40
10:00:00 AM 12:00:00 PM 2:00:00 PM 4:00:00 PM 6:00:00 PM 8:00:00 PMCount Hours
Tota
l N
um
ber
of
Car
s
Tuesday, 11/10/09Friday, 11/13/09
Total Number of Parking Spaces = 36
Source:
Counts Performed by Cole & Associates, LLC
Page 38

Weekend Parking Utilization Municipal Parking Lot #1
11/7 & 11/14/09
63 65
79
59
133
105
79
53
159
137
0
20
40
60
80
100
120
140
160
180
10:00:00 AM 12:00:00 PM 2:00:00 PM 4:00:00 PM 7:00:00 PM 9:00:00 PMCount Hours
Tota
l N
um
ber
of
Car
s
Saturday, 11/7/09Satruday, 11/14/09
Total Number of Parking Spaces = 174
Source:
Counts Performed by Cole & Associates, LLC
Page 39

Weekend Parking Utilization Municipal Parking Lot #2
11/7 & 11/14/09
24
3027
32
99
109
25
39
99
104
0
10
20
30
40
50
60
70
80
90
100
110
120
130
10:00:00 AM 12:00:00 PM 2:00:00 PM 4:00:00 PM 7:00:00 PM 9:00:00 PMCount Hours
Tota
l N
um
ber
of
Car
s
Saturday, 11/7/09Satruday, 11/14/09
Total Number of Parking Spaces = 130
Source:
Counts Performed by Cole & Associates, LLC
Page 40

Weekend Parking Utilization Municipal Parking Lot #4
11/7 & 11/14/09
53
85
94
67
111
101
71
63
113
97
0
20
40
60
80
100
120
10:00:00 AM 12:00:00 PM 2:00:00 PM 4:00:00 PM 7:00:00 PM 9:00:00 PMCount Hours
Tota
l N
um
ber
of
Car
s
Saturday, 11/7/09Satruday, 11/14/09
Total Number of Parking Spaces = 113
Source:
Counts Performed by Cole & Associates, LLC
Page 41

Weekend Parking Utilization Municipal Parking Lot #6
11/7 & 11/14/09
6
3
5
3
29
19
9
4
35
29
0
10
20
30
40
10:00:00 AM 12:00:00 PM 2:00:00 PM 4:00:00 PM 7:00:00 PM 9:00:00 PMCount Hours
Tota
l N
um
ber
of
Car
s
Saturday, 11/7/09Satruday, 11/14/09
Total Number of Parking Spaces = 36
Source:
Counts Performed by Cole & Associates, LLC
Page 42