Cold Chain & Logistic Management for Agrifood Products in ...
44
4/6/2018 1 Cold Chain & Logistic Management for Agrifood Products in Indonesia International Conference on Cold Chain and Logistics Management for Agrifood Products in Indonesia 4–5 April 2018, Jakarta, Indonesia Adhi Lukman Chairman of Indonesian Food and Beverage Industry Association
Transcript of Cold Chain & Logistic Management for Agrifood Products in ...

4/6/2018 1
Cold Chain & Logistic Management for Agrifood Products in Indonesia
International Conference on Cold Chain and Logistics Management for Agrifood Products in Indonesia 4–5 April 2018, Jakarta, Indonesia
Adhi LukmanChairman of Indonesian Food and Beverage Industry Association

DEVELOPMENT OF FOOD INDUSTRYTowards GVC

The 4th largest population.
261.9 millions (June, 2017)
GDP 1.004 Trillions
USD (2017)*
GDP growth 5.07% (YoY-2017)
Inflation 3.61%
(YoY Dec 2017)
Indonesia
GDP per capita
3,605.1 USD
(2016)
The 2nd
longest Coastline
Lines 99,000 Kilometers
13,466 islands


Agro-Food in Master Plan of The National Industrial Development (RIPIN: 2015 – 2035)1. Fish & seafood
processing industry2. Refreshment industry3. Vegetable oil
processing industry4. Fruits and vegetables
processing industry5. Flour industry6. Cane-based sugar
industry
Upstream Agro Industry
FoodIndustry
Agro Upstream Industry

GDP Growth in 2012 – 2017 (YoY %)
INDICATOR 2012 2013 20142015 2016**
Q3-2017 ***
GDP Growth 6.03 5.56 5.02 4.79 5.02 5.06GDP Growth Non Oil Industry 6,98 5,45 5,61 5.04 4.42 5.49
F&B Growth base on 2010 10,33 4,07 9,49 7.54 8.46 9.46Contribution to GDP Non-Oil Industry Sector 29,52 29,01 29,74 30.86 32.84 34.67
**Temporary*** very temporary Source : BPS , calculated by MoI
0
2
4
6
8
10
12
2012 2013 2014 2015 2016** Q3-2017 ***
Chart Title
GDP Growth GDP Growth Non Oil Industry Contribution to GDP Non-Oil Industry Sector

CONTRIBUTION OF FOOD & BEVERAGE INDUSTRY IN THE NON OIL & GAS GDP IN 2016 AND Q3 2017
Source : Central Bureau of Statistic
Food and Beverage
33%
Tobacco5%
Textile and Garment
6%
Leather, Footwear
2%
Wood and Forest
Product 4%
Paper and Printing
4%
Chemical, Pharmaceutic
al and Traditional Medicine
10%
Rubber and Rubber Product
3%
Non-Metallic Minerals
4%
Iron and steel4%
Iron Product, electonic product
11%
Machine and Tools
2%
Transport Equipment
10%
Furniture1%
Others1%
2016
Food and Beverage
35%
Tobacco5%Textile and
Garment6%
Leather, Footwear
1%
Wood and Forest Product
3%
Paper and Printing
4%
Chemical, Pharmaceutica
l and Traditional Medicine
10%
Rubber and Rubber Product
3%
Non-Metallic Minerals
4%
Iron and steel4%
Iron Product, electonic product
11%
Machine and Tools
2%
Transport Equipment
10%
Furniture1%
Others1%
Q3 2017

Investment Performance: F&B Investment Realization
Source: BKPM
Investment in F&B industry sector 2017: DDI grow around 20% FDI grow minus 7%
INVESTMENT
2014 2015 2016 2017
P I P I P I P I
DDI 493 19,596.39 879 24,533.99 1,169 32,028.50 1,419 38,540.10
(Rp. Billions)
FDI 1,054 3,139.60 886 1,521.18 1,947 2,115.00 1,649 1,970.30
(USD million)
Total 1,547 1,765 3,116 3,068


4/6/2018 10
Ease Of Doing
Business Index 2018
# 72 of 190 (91 of 190) Countries
#6 in ASEAN
The Global Competitiveness Index
2017 –2018
36 of 137(41 of 138)Countries
#4 in ASEAN
LogisticPerformanc
e Index 2016
63 0f 160 (53 of 160)Countries
#4 in ASEAN
Labor Productivit
y per worker GDP
2012
#4 in ASEAN
Global Food Security
Index 2017
69 of 113 Countries
(71 of 113)#5 in
ASEAN
The Global Innovation Index 2017
87 of 127 Countries
#5 in ASEAN
INDONESIA in the World Rank

Trade Balance of Semi processed & Processed Food in 2014-2018 (Jan)In USD . Source: BPS/ Ministry of Trade
Export Import Balanced
2014 2015 2016 2017 2018 Jan 2014 2015 2016 2017 2018 Jan 2014 2015 2016 2017 2018
6,353,427,439 6,002,001,194 6,175,076,936 6,496,947,163 572,990,251 7,304,062,157 6,278,094,256 7,063,482,891 7,805,422,356 572,898,218 -950,634,718 -276,093,062-888,405,955 -1,308,475,193 92,033
(1.400.000.000)
(1.200.000.000)
(1.000.000.000)
(800.000.000)
(600.000.000)
(400.000.000)
(200.000.000)
0
200.000.000
400.000.000
600.000.000
800.000.000
USD
2014 2015 2016 2017 2018 Jan

(500.000.000)
(400.000.000)
(300.000.000)
(200.000.000)
(100.000.000)
0
100.000.000
200.000.000
300.000.000
USD
2014 2015 2016 2017 2018 Jan
Trade Balance of Semi processed & Processed Food in 2014-2018 (Jan)In USD . Source: BPS/ Ministry of Trade
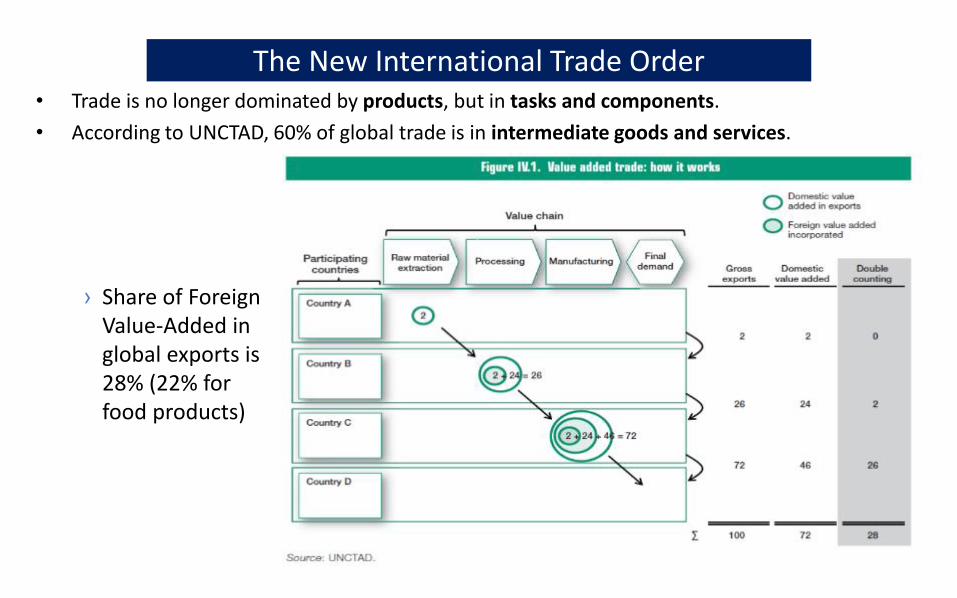
The New International Trade Order• Trade is no longer dominated by products, but in tasks and components.
• According to UNCTAD, 60% of global trade is in intermediate goods and services.
› Share of Foreign Value-Added in global exports is 28% (22% for food products)

Why are Global Value Chains (GVC) important?
• Industrial organisation (and economic opportunities for participation) is increasingly shaped by the actor practices of globally coordinated lead firms
• “There is a positive correlation between participation in GVCs and growth rates of GDP per capita. GVCs have a direct economic impact on value added, jobs and income.”
• “They can also be an important avenue for developing countries to build productive capacity, including through technology dissemination and skill building, thus opening up opportunities for longer-term industrial upgrading.”
(UNCTAD 2013 World Investment Report on Global Value Chains)

What is Indonesia’s involvement in GVCs?
Indonesia is not currently well integrated into GVCs as yet ......
CountryForeign value-added content of exports
Korea 44
Malaysia 42
Mexico 32
Thailand 30
China 30
Indonesia 9
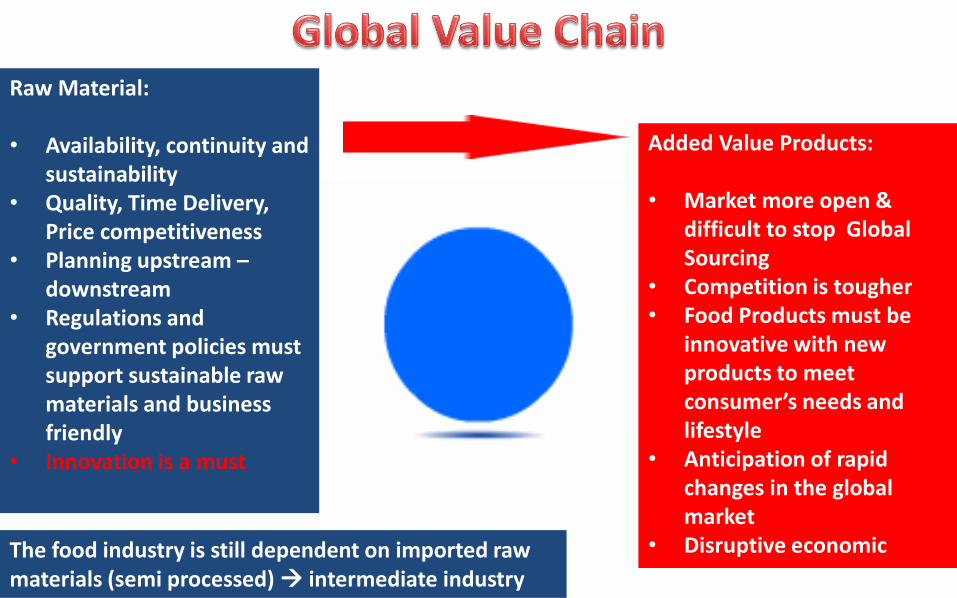
Raw Material:
• Availability, continuity and sustainability
• Quality, Time Delivery, Price competitiveness
• Planning upstream –downstream
• Regulations and government policies must support sustainable raw materials and business friendly
• Innovation is a must
Added Value Products:
• Market more open & difficult to stop Global Sourcing
• Competition is tougher• Food Products must be
innovative with new products to meet consumer’s needs and lifestyle
• Anticipation of rapid changes in the global market
• Disruptive economicThe food industry is still dependent on imported raw materials (semi processed) intermediate industry

Challenges Along the Food Supply Chain
Competitiveness
TariffQuality
Nutrition
Healthier Choice
HALAL
Standard
Label
Regulation & Govt Policy
Logistic
Time delivery
Ethnic &
Habits.
Resources
Innovation
Disruptive Economic
Big Data
Food loss
Food waste
Profitability
Added Value

Cold Chain & Logistic Management for Agrifood Products

• Rich in natural resources to support industrial raw materials• In fact, still have to import most of the raw materials of food industry
• Culture (consumption & habits)• Food losses during post harvest process
• How should think of extending the shelf life, reduce food losses, a better food security & nutrition, and availability for raw material of Food Industry
•Cold chain for:
Fruits & vegetables
Bakery & confectionery products
Dairy & frozen desserts
Fish, meat, and seafood products
Others

How to Reduce Food Loss & Food Waste
Many ways to reduce food losses along the supply chain, One of them by improving the distribution system through the cold chain
Food Regulation & System
Cold Chain:• Food safety
• Reducing food waste & food loss
• Products performance & nutrition
• Prolong shelf life• Market management
(stabilizing price, supply, etc)

Where in the supply chain does Food Wastage occurs?
Losses Losses Losses
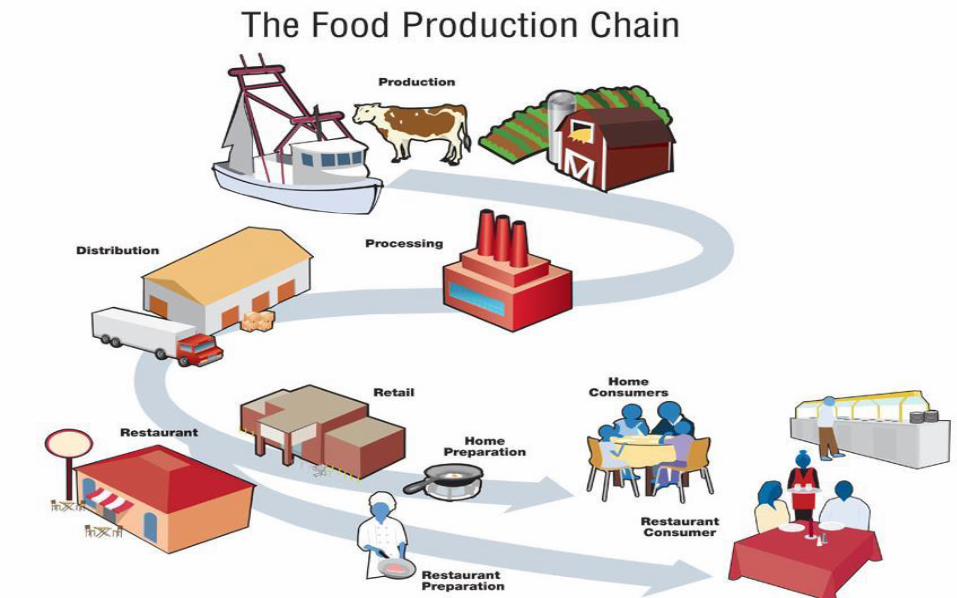

Cold Value Chain: an Opportunity for a Better Value Viable
FarmersManufacturer
Warehouse Distribution Retail Consumers

Cold Supply Chain To Improve The Quality And Availability
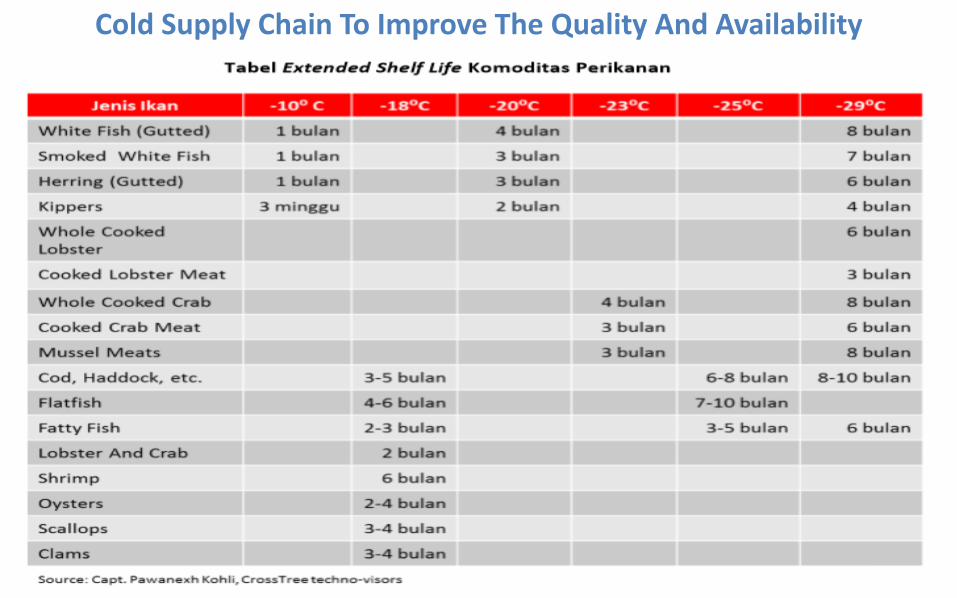
Cold Supply Chain To Improve The Quality And Availability

Source: Ahn, Hyung Jin, Cold chain system in marketing for poultry
Cold Supply Chain To Improve The Quality And Availability

Source: Denny Widaya Lukman, drh, MSi, Dr. med. vet.
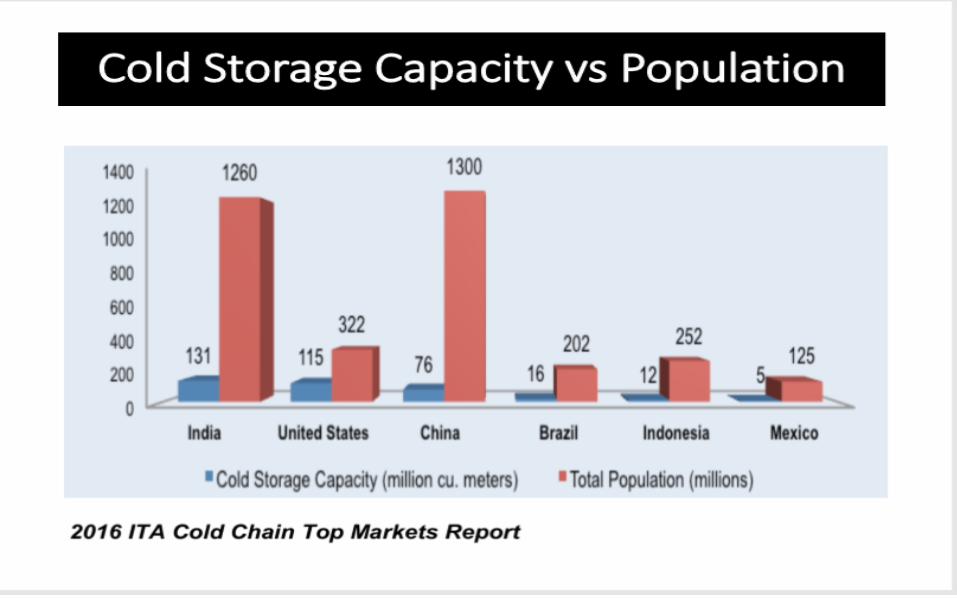
Cold Supply Chain To Improve The Quality And Availability


Demand and availability of cold storage

Source: KKP (2016)
Cold Storage Deployment Map in Indonesia for Fisheries Products
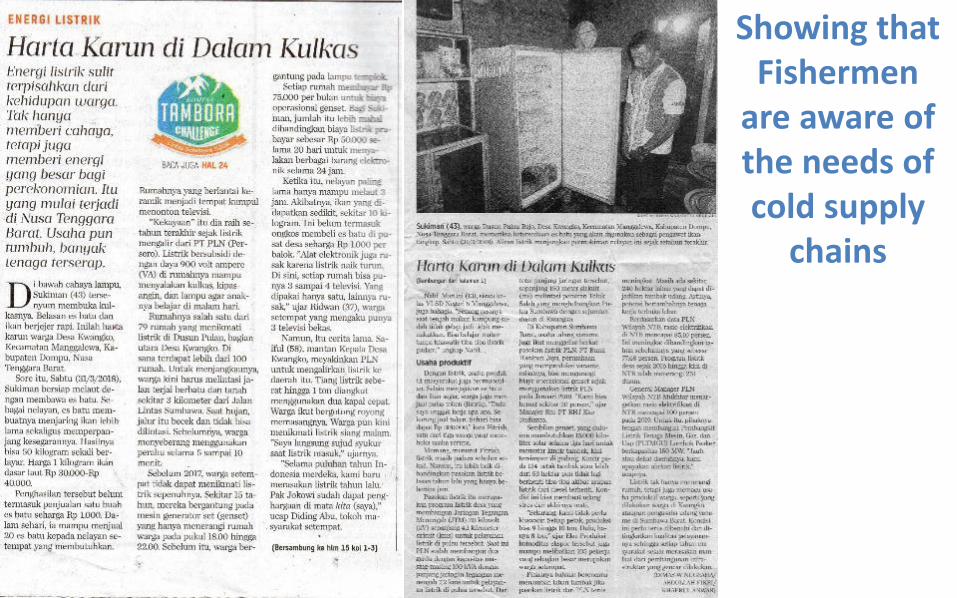
Showing that Fishermen
are aware of the needs of cold supply
chains

1. Cold chain development is an essential integral element of growth in the food sector and needs to be better integrated into agriculture and food policies, strategies and action plans.
2. Strategies for cold chain development should be adapted to specific commodity groups, and geographic and socioeconomic conditions.
3. Good management of the integrated steps, including maintenance, is needed, recognizing that collaboration among multiple stakeholders involved in the unbroken cold chain of a particular commodity is vital.
4. Governments can provide key services, such as public infrastructure and legislation, which can facilitate cold chain development.
5. Education, awareness and capacity building are also critical service which governments can provide it’s about an habits and culture
Key messages: Cold Chain
Indonesia towards Industry 4.0


Human Resources
Productivity, Skills & Competencies
are Essential & Important

Government’s SupportSustainable Agro Industry

Economic Policy Packages for Business & Investors Should be consistently executed and improved
Inpres 7/2017 PengendalianKebijakan di Lingkup K/L
Perpres91/2017Task Force

Copyright © 2017 Indonesia Investment Coordinating Board. All rights reserved.
42
Source: MOF, Bank Mandiri Workshop – 4 April 2017

4/6/2018 43
Natural
Resources
Gov. Policy & other
supporting
ADDED VALUE PRODUCT,
SAFE , Halal
COMPETITIVE
CONSUMERS
What industry need? Creating a Competitive Product to GVC
•Technology•Disruptive economic•Innovation•Consumer’s preference•Marketing
purpose

4/6/2018 44
Thank you