Cointegration Vector Estimation by Panel DOLS and Long-run...
26
Cointegration Vector Estimation by Panel DOLS and Long-run Money Demand* Nelson C. Mark ,à,§ and Donggyu Sul– Ohio State University (e-mail: [email protected]) àUniversity of Notre Dame §NBER –University of Auckland (e-mail: [email protected]) Abstract We study the panel dynamic ordinary least square (DOLS) estimator of a homogeneous cointegration vector for a balanced panel of N individuals observed over T time periods. Allowable heterogeneity across individuals include individual-specific time trends, individual-specific fixed effects and time-specific effects. The estimator is fully parametric, computationally convenient, and more precise than the single equation estimator. For fixed N as T fi 1, the estimator converges to a function of Brownian motions and the Wald statistic for testing a set of s linear constraints has a limiting v 2 (s) distribution. The estimator also has a Gaussian sequential limit distribution that is obtained first by letting T fi 1 and then letting N fi 1. In a series of Monte-Carlo experiments, we find that the asymptotic distribution theory provides a reasonably close approximation to the exact finite sample distribution. We use panel DOLS to estimate coefficients of the long-run money demand function from a panel of 19 countries with annual observations that span from 1957 to 1996. The estimated income elasticity is 1.08 (asymptotic s.e. ¼ 0.26) and the estimated interest rate semi-elasticity is )0.02 (asymptotic s.e. ¼ 0.01). *This paper was previously circulated under the title ‘A Computationally Simple Cointegration Vector Estimator for Panel Data’. For valuable comments on earlier drafts, we thank Ronald Bewley, Roger Moon, Peter Phillips, seminar participants at Georgetown University, Ohio State University, the 2001 New Zealand Econometric study group meeting, the University of California at Santa Barbara, the University of Southern California, and an anonymous referee. The usual disclaimer applies. OXFORD BULLETIN OF ECONOMICS AND STATISTICS, 65, 5 (2003) 0305-9049 655 ȑ Blackwell Publishing Ltd, 2003. Published by Blackwell Publishing Ltd, 9600 Garsington Road, Oxford OX4 2DQ, UK and 350 Main Street, Malden, MA 02148, USA.
Transcript of Cointegration Vector Estimation by Panel DOLS and Long-run...

Cointegration Vector Estimation by Panel
DOLS and Long-run Money Demand*
Nelson C. Mark�,�,§ and Donggyu Sul–
�Ohio State University (e-mail: [email protected])
�University of Notre Dame§NBER
–University of Auckland (e-mail: [email protected])
Abstract
We study the panel dynamic ordinary least square (DOLS) estimator of a
homogeneous cointegration vector for a balanced panel of N individuals
observed over T time periods. Allowable heterogeneity across individuals
include individual-specific time trends, individual-specific fixed effects and
time-specific effects. The estimator is fully parametric, computationally
convenient, and more precise than the single equation estimator. For fixed N
as T fi 1, the estimator converges to a function of Brownian motions and theWald statistic for testing a set of s linear constraints has a limiting v2(s)distribution. The estimator also has a Gaussian sequential limit distribution
that is obtained first by letting T fi 1 and then letting N fi 1. In a series ofMonte-Carlo experiments, we find that the asymptotic distribution theory
provides a reasonably close approximation to the exact finite sample
distribution. We use panel DOLS to estimate coefficients of the long-run
money demand function from a panel of 19 countries with annual
observations that span from 1957 to 1996. The estimated income elasticity
is 1.08 (asymptotic s.e. ¼ 0.26) and the estimated interest rate semi-elasticity
is )0.02 (asymptotic s.e. ¼ 0.01).
*This paper was previously circulated under the title ‘A Computationally Simple CointegrationVector Estimator for Panel Data’. For valuable comments on earlier drafts, we thank Ronald Bewley,Roger Moon, Peter Phillips, seminar participants at Georgetown University, Ohio State University,the 2001 New Zealand Econometric study group meeting, the University of California at SantaBarbara, the University of Southern California, and an anonymous referee. The usual disclaimerapplies.
OXFORD BULLETIN OF ECONOMICS AND STATISTICS, 65, 5 (2003) 0305-9049
655� Blackwell Publishing Ltd, 2003. Published by Blackwell Publishing Ltd, 9600 Garsington Road, Oxford OX4 2DQ, UK
and 350 Main Street, Malden, MA 02148, USA.

I. Introduction
This paper considers the extension of the single equation dynamic ordinary
least squares (DOLS) method of Saikkonen (1991) and Stock and Watson
(1993) for estimating and testing hypotheses about a cointegrating vector to
panel data. We call the estimator panel DOLS. We discuss its limit distribution
and apply it to estimate the long-run money demand function using a panel
data set of 19 countries with annual observations spanning from 1957 to 1996.
Panel DOLS is fully parametric and offers a computationally convenient
alternative to the panel ‘fully modified’ OLS estimator proposed by Pedroni
(1997) and Phillips and Moon (1999). Properties of panel DOLS, when there
are fixed effects in the cointegrating regression, have been discussed by Kao
and Chiang (2000). We take this to be the starting point for our analysis. In our
environment, the cointegrating vector is homogeneous across individuals but
we allow for individual heterogeneity through disparate short-run dynamics,
individual-specific fixed effects and individual-specific time trends. Moreover,
we permit a limited degree of cross-sectional dependence (CSD) through the
presence of time-specific effects.
We present two limit distributions for panel DOLS. The first limit
distribution is obtained for a fixed number of cross-sectional units N, letting
T fi 1. In this case, panel DOLS converges in distribution to a function ofBrownian motions and the Wald statistic for testing a set of s linear constraints
has a limiting v2(s) distribution. This limit theory seems well suited for manyapplied macroeconomic or international problems. Here, researchers often
have available panel data sets of moderate N but much larger T. With the
passage of time, these data sets will gain time-series observations but they are
unlikely to acquire many more cross-sectional units.1 We also obtain the
sequential limit distribution by first letting T fi 1 for fixed N, and then
letting N fi 1 as proposed by Phillips and Moon (1999). Here, panel DOLS
has a limiting Gaussian distribution and as in the fixed N case, the Wald
statistic has a limiting chi-square distribution. In the absence of linear trends in
the cointegrating regression, the sequential limiting normality of the estimator
is theoretically interesting but has less practical import because the limit
distribution of the test statistics is identical to the T fi 1 distribution with
fixed N. However, when linear trends are present, the sequential limit theory
produces considerable simplifications. Here, the estimator of the cointegration
1For example, if the observational unit is a national economy, the total number of countries mayfluctuate over time, but is unlikely to go to infinity. While the break-up of the Soviet Union createdseveral new economies, the opposite trend is at work in Europe where the EMU may eventuallycombine to form a single economic unit. But beyond this, researchers typically choose to groupcountries into classes that share common characteristics such as income levels, stages of developmentor geography which often result in panels with 5–20 individuals.
656 Bulletin
� Blackwell Publishing Ltd 2003

vector and the time-trend slope coefficients remain correlated for fixed N as
T fi 1 but are asymptotically uncorrelated when T fi 1 then N fi 1.As single equation cointegration vector estimators are super consistent, it is
natural to ask what is to be gained by using the panel estimator. The answer is
that super consistency means that convergence towards the asymptotic
distribution occurs at rate T but it says nothing about the sampling variability
of the estimator for a fixed value of T. In fact, the statistical properties of
single-equation cointegration-vector estimators can be quite poor when
applied to sample sizes associated with macroeconomic time series typically
available to researchers (e.g. Inder, 1993; Stock and Watson, 1993). Moreover,
even limited amounts of heterogeneity in the short-run dynamics across
individuals can generate considerable disparities in single-equation DOLS
estimates of the true homogeneous cointegration vector. In these situations,
combining cross-sectional and time-series information in the form of a panel
can provide much more precise point estimates of the cointegration vector
with reasonably accurate asymptotic approximations to the exact sampling
distribution. In a series of Monte-Carlo experiments, we study the small
sample performance of panel DOLS and compare it with single-equation
DOLS. Panel DOLS generally performs well under the short-run dynamic
designs that we consider and can attain a striking improvement in estimation
precision over that of single-equation DOLS with even a modest number of
cross-sectional units.
We then apply panel DOLS to estimate the long-run demand for M1
money. The countries in our study are Austria, Australia, Belgium, Canada,
Denmark, France, Finland, Germany, Iceland, Ireland, Japan, Norway, New
Zealand, the Netherlands, Portugal, Spain, Switzerland, the United Kingdom,
and the United States. Here, we build on the time-series contributions by
Baba, Hendry and Starr (1992), Ball (1998), Hoffman, Rasche, and Tieslau
(1995), Lucas (1988) and Stock and Watson (1993), and the cross-sectional
studies by Mulligan and Sala-i-Martin (1992), and Mulligan (1997), most of
which has focused on US data.2
The studies cited above report conflicting results along three dimensions.
First, point estimates from time-series studies exhibit substantial dependence on
the sample period of the data. Income elasticity estimates from post-WWII US
data typically lie well below 1 – which implies the existence of economies of
scale in money management – whereas estimates obtained from pre-WWII
observations or those that combine pre- and postwar observations are generally
close to 1. Using annual US data spanning from 1903 to 1987, Stock and
Watson’s (1993) DOLS estimate of the income elasticity is 0.97. When the
sample spans from 1903 to 1945, their estimate is 0.89 but drops to 0.27 when
2Less recent cross-sectional studies include Meltzer (1963) and Gandolfi and Lothian (1976).
657Cointegration vector estimation by panel DOLS and long-run money demand
� Blackwell Publishing Ltd 2003

the data span from 1946 to 1987. Ball (2001) extends these data and obtains an
estimate of 0.42 when the observations span from 1946 to 1996. Using annual
observations from 1900 to 1958, Lucas’s (1988) estimate of theM1 (permanent)
income elasticity is 1.06 and his estimate of the (short-term) interest rate semi-
elasticity is)0.07. Using data spanning from 1958 to 1985, his income elasticityestimate drops to 0.21 and his interest semi-elasticity estimate is )0.01.Secondly, there is tension generated by the large difference between the
estimates from time-series studies and those from postwar cross-section studies.
Mulligan and Sala-i-Martin’s (1992) estimates from a 1989 cross-sectional data
set from the Survey of Consumer Finances range between 0.82 and 1.37.
Mulligan (1997) runs OLS on for a panel of 12,000 firms observed from 1961 to
1992 and obtains an income-elasticity estimate of 0.83. Thirdly, there is
substantial cross-country variation even amongst economies of similar income
levels and financial market development. In our analysis, single-equationDOLS
with trend gives such disparate income elasticity estimates as )1.23 for NewZealand and 2.42 for Canada. The corresponding interest rate semi-elasticity
estimates range from 0.02 for Ireland (which has thewrong sign) to)0.09 for theUK. When trends are omitted, the income elasticity estimates range from 0.13
for Belgium to 2.64 for Norway and the interest semi-elasticity estimates range
from 0.02 for Ireland to )0.16 for Norway.With only 40 annual observations, the heterogeneity that we observe in the
point estimates may plausibly have been generated from an underlying data
generating process with a homogeneous cointegration vector and heterogeneous
short-run dynamics. When we include heterogeneous linear trends and estimate
the cointegrating vector by panel DOLS, we obtain a point estimate of the
income elasticity of 1.08 (asymptotic s.e. ¼ 0.26) and a point estimate of the
interest semi-elasticity of )0.02 (asymptotic s.e. ¼ 0.01). Moreover, these
estimates, which are more in line with those from cross-sectional studies on US
data, are stable as the span of the time-series dimension is varied and are
reasonably robust to the inclusion or omission of heterogeneous linear trends.
The remainder of the paper is organized as follows. The next section des-
cribes the representation of the non-stationary panel data and regularity con-
ditions assumed in the paper. Section III describes the panel DOLS estimator
and discusses its asymptotic properties. Section IV reports the results of a
Monte-Carlo experiment to examine the small sample performance of the panel
DOLSestimator and the accuracyof the asymptotic approximations. In sectionV
we present our long-run money demand study and section VI concludes the
paper. Proofs of propositions and supplementary results from themoney demand
study are given in an appendixwhich is available upon request from the authors.3
3Alternatively, the appendix can be downloaded from the http://www.wcon.ohio-state.edu/Mark/nmark.htm.
658 Bulletin
� Blackwell Publishing Ltd 2003

II. Representation of cointegrated observations in panel data
Consider a balanced panel of individuals indexed by i ¼ 1,…,N observed
over time periods t ¼ 1,…, T. Vectors are underlined and matrices appear inbold face. W(r) is a vector standard Brownian motion for 0 £ r £ 1, and [Tr]denotes the largest integer value of Tr for 0 £ r £ 1. As is standard in theliterature, we will drop the notational dependence on r and write
R 10W ðrÞdr asR
W andR 10W ðrÞdW ðrÞ0 as
RW dW 0. Scaled vector Brownian motions are
denoted by B ¼ KW where K is a scaling matrix. For any matrix A, ||A||
denotes the Euclidian norm, [Tr(A0A)]1/2.We will be working with double indexed sums. In some instances – to
deal with individual-specific fixed effects or common-time effects – these
sums will involve transformations of the original observations. To handle
such situations, we generically denote the sample cross-moment matrix
averaged over N and T2 as MNT and let the precise definition depend upon
the particular model under consideration. Also, we generically denote the
limit of the moment matrix as T fi 1 for any given N by MN. As N fi 1,MN need not converge to a constant and we denote this limit as MN .
Similarly, our generic notation for the sample cross-product vector between
the regressors and the equilibrium error is mNT, and the limit for fixed N as
T fi 1 is mN.
As the model we study allows for individual specific effects, perhaps
it would be more accurate to call the estimator dynamic least squares dummy
variable (LSDV). However, in the interests of simplicity, we will refer to the
estimator as panel DOLS.
(i) Triangular representation
Let fðyit; x0itÞ0g be a (k + 1) dimensional vector of observations where yit is a
scalar and xit is a k-dimensional vector. Observations on each individual i obey
the triangular representation
yit ¼ ai þ kit þ ht þ c0xit þ uyit; ð1Þ
Dxit ¼ vit; ð2Þ
where (1, )c0) is a cointegrating vector between yit and xit that is identicalacross individuals. The composite equilibrium error yit ) c0xit is potentiallycomprised of an individual-specific effect ai, an individual-specific lineartrend kit, and a common time-specific factor ht. The remaining idiosyncraticerror uyit is independent across i but possibly dependent across t. An alternativerepresentation for equation (2) allows xit to have an individual-specific vector
of drift terms and for the trend in equation (1) to be induced by this drift. With
659Cointegration vector estimation by panel DOLS and long-run money demand
� Blackwell Publishing Ltd 2003

some minor modifications, the results of this paper continue to hold in this
alternative environment.4
In addition to individual-specific fixed effects and linear trends, potentially
disparate short-run dynamics of the covariance stationary error process fwyitg ¼
fðuyit; v0itÞ0g introduces an additional source of heterogeneous behaviour across
individuals. The underlying error dynamics are given in Assumption 1.
Assumption 1. (Error Dynamics.) fwyitg is independent across i ¼ 1,…, N,
and has the moving average representation
wyit ¼ Wy
i ðLÞ�yit; ð3Þ
where f�yitg i:i:d: with Eð�yitÞ ¼ 0; Eð�yit�y0it Þ ¼ I, Ejj�yitjj
4 < 1, Wyi ðLÞ ¼P1
j¼0 WyijLj is a (k + 1) · (k + 1) dimensional matrix lag polynomial in the
lag operator L, whereP1j¼0 jjw
ymnij j < 1; and wymn
ij is the m,n-th element of
the matrix Wyij.
Our assumption that wyit is independent across individuals ðE½w
yitw
yjt k� ¼ 0;
i 6¼ j; 1 � k � 1) follows the recent econometrics literature on
non-stationary panel data (e.g. Phillips and Moon, 1999a,b; Kao and Chiang,
2000; Pedroni, 1997). Unlike these authors, we assume that the coefficients in
the Wyi ðLÞ polynomial are fixed for a given i although they can differ across
individuals.
Let Wi be a k + 1-dimensional standard Brownian motion. By Assumption
1, it follows that for each i ¼ 1,…,N, fwyitg obeys the functional central limit
theorem
1ffiffiffiffiT
pX½Tr�t¼1wyit!D
Wyi ð1ÞW i � B
yi ; ð4Þ
as T fi 1, where Byi ¼ ðByui;B0viÞ0is a scaled mixed Brownian motion and
Xyi ¼E½B
yi ð1ÞB
yi ð1Þ
0�¼ Xyuu;i Xy0
vu;i
Xyvu;i Xvv;i
" #¼Wy
i ð1ÞWy0i ð1Þ¼Cy
0;iþX1j¼1
ðCyj;iþCy0
j;iÞ;
Cyj;i ¼ Eðw
yitw
y0it jÞ ¼ E
uyituyit j uyitv
0it j
vituyit vitv
0it j
" #¼ Cy
uu;j;i Cy0vu;j;i
Cyvu;j;i Cvv;j;i
" #:
4The trend in equation (1) can be induced by a drift in {yit}. If instead, there is a drift in {xit} butnone in {yit}, where Dxit ¼ ai + vit with xi0 given, then repeated substitution gives xit ¼ xi0 + ait +nitwhere nit ¼
Ptj¼1 vit is a driftless vector I(1) process. The cointegrating regression becomes
yit ¼ c00xi0 þ c0
1ait þ c0
2nit þ u
yit . In this case, the ensuing analysis is to be performed using the
statistical properties of nit. In computations, one can follow the recommendations of Phillipsand Moon (2000) to obtain an estimate of nit first by estimating the drift aiT ¼1T
PTt¼1 Dxit ¼ 1
T ðxiT xi1Þ and then using nnit ¼ xit xi0 taiT .
660 Bulletin
� Blackwell Publishing Ltd 2003

The issues involved in panel cointegration vector estimation and testing
parallels that in the single equation environment. For a single equation, OLS
is a consistent estimator of the cointegrating vector but its asymptotic
distribution depends on the long-run covariance between uyit and vit. Thisnuisance parameter dependency invalidates standard hypothesis testing in the
OLS framework without modifications. DOLS, dynamic generalized least
square (GLS), and fully modified OLS are examples of such modifications.
Similarly, in panel data, Phillips and Moon (1999) and Pedroni (1997) show
that for fixed N, the pooled OLS estimator is a consistent estimator of the
cointegrating vector as T fi 1 and can be used in a first pass in getting
point estimates. In panel data, however, the problems of second-order
asymptotic bias and nuisance parameter dependence are compounded and
are potentially more serious in the sense that the bias accumulates with the
size of the cross-section. In particular, if cOLSNT
is the OLS estimator for the
pooled cross-section time-series data, one cannot rule out the possibility thatffiffiffiffiN
pT ðcOLS
NT cÞ diverges as T fi 1 and then N fi 1. It follows that the
distribution for a Wald statistic for testing linear restrictions becomes even
less useful as the cross-sectional dimension of the panel grows as it too can
diverge.
III. Panel DOLS
We consider the panel DOLS estimator of the vector of slope coefficients cand its limit distribution for various subcases of the model in equations (1) and
(2). We take the model with individual-specific effects as our starting point.5
Section (i) discusses the baseline fixed-effects model. Once we obtain the limit
distribution for this baseline case, the limit theory for more general versions of
the model with heterogeneous linear trends and common time effects follow in
an analogous manner. In section (ii) we add heterogeneous trends to the fixed-
effects model, and section (iii) considers the model with fixed-effects, trends,
and common-time effects.
(i) Fixed effects
In applied work, the researcher will almost always need to include
individual-specific constants in the regression. To handle this situation, we
5Kao and Chiang (2000) derive the sequential limit distribution (T fi 1, N fi 1) for panelDOLS in a model with individual-specific effects. They do not consider the fixed the T fi 1 limittheory with fixed N, nor do they allow for time trends or time-specific effects.
661Cointegration vector estimation by panel DOLS and long-run money demand
� Blackwell Publishing Ltd 2003

begin by setting ki ¼ 0, ht ¼ 0 for all i and t in equation (1), which we
write as
yit ¼ ai þ c0xit þ uyit: ð5Þ
Assume that uyit is correlated with at most pi leads and lags of vit ¼ Dxit. Tocontrol for this endogeneity, project uyit onto these pi leads and lags
uyit ¼Xpis¼ pi
d0i;svit s þ uit ¼Xpis¼ pi
d0i;sDxit s þ uit ¼ d0izit þ uit; ð6Þ
where di,s is a k · 1 vector of projection coefficients, di ¼ ðd0i; pi ; . . . ;d0i;0; . . . ; d
0i;piÞ
0is a (2pi + 1)k-dimensional vector and zit ¼ ðDx0it pi ; . . . ;
Dx0it; . . . ;Dx0itþpiÞ
0is a (2pi + 1)k-dimensional vector of leads and lags of the
first differences of the variables xit. The projection error uit is, by construction,
orthogonal to all leads and lags of vit. It follows from Assumption 1 that
because wyit is independent across i we project u
yit only onto leads and lags
of Dxit for individual i and not onto leads and lags of the other individuals(Dxjt, j „ i).
Substituting the projection representation for uit in equation (6) into
equation (5) yields
yit ¼ ai þ c0xit þ d0izit þ uit: ð7Þ
The projection defines the new covariance stationary vector process, wit ¼ðuit; v0itÞ
0where for each i,
wit ¼ WiðLÞ�it; WiðLÞ ¼Wuu;iðLÞ 00
0 Wvv;iðLÞ
� �;
and wit obeys the functional central limit theorem
1ffiffiffiffiT
pX½Tr�t¼1wit!
DBi ¼ Wið1ÞW i;
where Bi ¼ ðBui;B0viÞ0, Bui and Bvi are independent, and
Xi ¼ E½Bið1ÞBið1Þ0� ¼Wuu;ið1Þ2 00
0 Wvv;ið1ÞWvv;ið1Þ0� �
¼ Xuu;i 00
0 Xvv;i
� �:
Taking the time-series average of equation (7) gives
1
T
XTt¼1yit ¼ ai þ c0
1
T
XTt¼1xit þ d0i
1
T
XTt¼1zit þ
1
T
XTt¼1uit: ð8Þ
662 Bulletin
� Blackwell Publishing Ltd 2003

Subtracting equation (8) from equation (7) eliminates ai and gives
~yyit ¼ c0~xxit þ d0i~zzit þ ~uuit; ð9Þ
where a ‘tilde’ denotes the deviation of an observation from its time-series
average,
~yyit ¼ yit 1
T
XTt¼1yit;
~xxit ¼ xit 1
T
XTt¼1xit;
~zzit ¼ zit 1
T
XTt¼1zit;
~uuit ¼ uit 1
T
XTt¼1uit:
To set up the estimation problem, let ~qqitbe the 2kð1 þ
PNi¼1 piÞ
dimensional vector whose first k elements are ~xxit, elements kð1þPi 1j¼1ð2pj þ 1ÞÞ þ 1 to kð1 þ
Pij¼1ð2pj þ 1ÞÞ are ~zzit and 0s elsewhere.
That is,
~qq1t
¼ ð~xx01t ~zz01t 00 . . . 00Þ0
~qq2t
¼ ð~xx02t 00 ~zz02t . . . 00Þ0
..
. ...
~qqNt
¼ ð~xx0Nt 00 00 . . . ~zz0NtÞ0
:
Let the grand coefficient vector be b ¼ ðc0; d01; . . . ; d0N Þ0and the compact
form of the regression be ~yyit ¼ b0~qqitþ ~uuit. The panel DOLS estimator for the
fixed-effects model is bNT, where
ðbNT
bÞ ¼XNi¼1
XTt¼1
~qqit~qq0it
" # 1 XNi¼1
XTt¼1
~qqit~uuit
" #: ð10Þ
We exploit the fact that the limiting behaviour of the regression error ~uuit, isidentical to that of uit. Some algebra reveals that
1
T
XTt¼1
~xxit~uuit ¼1
T
XTt¼1
~xxituit!D ffiffiffiffiffiffiffiffiffi
Xuu;ip Z
~BBvidWui where ~BBvi ¼ Bvi ZBvi:
663Cointegration vector estimation by panel DOLS and long-run money demand
� Blackwell Publishing Ltd 2003

We also have
1ffiffiffiffiT
pXTt¼1
~uuit ¼1ffiffiffiffiT
pXTt¼1uit ð1=T Þ 1ffiffiffiffi
Tp
XTt¼1uit!
DBuið1Þ ¼
ffiffiffiffiffiffiffiffiffiXuu;i
pWuið1Þ;
so we are able to use estimated values of ~uuit to obtain a consistent estimate ofXuu,i. The T fi 1 limit theory with fixed N for panel DOLS with individual-
specific fixed effects is given in
Proposition 1. (Fixed N, T fi 1 with fixed effects.) Let ~BBvi ¼ Bvi RBvi.
For the panel DOLS estimator (10), for fixed N as T fi 1,
a. T(cNT ) c) andffiffiffiffiT
pðddi diÞ are independent for each i.
b.ffiffiffiffiN
pT ðc
NT cÞ!D M 1
N mN , where MN ¼ 1N
PNi¼1
R~BBvi~BB
0vi, and mN ¼
1N
PNi¼1
ffiffiffiffiffiffiffiffiffiXuu;i
p R~BBvidWui
� �.
c. ½ffiffiffiffiN
pTRðc
NT cÞ�0½RDNR0� 1½
ffiffiffiffiN
pTRðc
NT cÞ�!D v2ðsÞ, where R is an
s · k restriction matrix, DN ¼ M 1N VNM 1
N ; MN ¼ 1N
PNi¼1
R~BBvi~BB
0vi; and
VN ¼ 1N
PNi¼1 Xuu;i
R~BBvi~BB
0vi:
d. DDNT DN !p
0, where DDNT ¼ M 1NT VVNTM
1NT , MNT ¼
1N
PNi¼1
1T 2PTt¼1 ~xxit~xx
0it
�h i; VVNT ¼ 1
N
PNi¼1 XXuu;i 1
T 2PTt¼1 ~xxit~xx
0it
�, and XXuu;i
is a consistent estimator of Xuu,i.
The asymptotic independence of T(cNT ) c) andffiffiffiffiT
pðddi diÞ as T fi 1
follows for the same reasons as in the single-equation environment and
because T(cNT ) c) converges in distribution to a mixed normal randomvector, the limiting chi-square distribution of the quadratic form in part (c) of
the proposition also follows by the standard argument. The asymptotic
covariance matrix DN can be consistently estimated by DNT and it follows that
under the null hypotheses Rc ¼ r, the Wald statistic
½ffiffiffiffiN
pT ðRc
NT rÞ�0½RDDNTR
0� 1½ffiffiffiffiN
pT ðRc
NT rÞ�!D v2ðsÞ ð11Þ
as T fi 1 for any given N.
The sequential limit distribution of cNT is obtained by showing thatthe sequence f
R~BBvi~BB
0vig
1i¼1 obeys a law of large numbers for independent
but heterogeneously distributed observations and that the sequence
fffiffiffiffiffiffiffiffiXuui
p R~BBvi dWuig1i¼1 obeys a central limit theorem for independent but
heterogeneously distributed observations. The sequential limit theory for panel
DOLS is given in Proposition 2.
Proposition 2. (Sequential limit distribution, fixed effects.) For the panelDOLS estimator (10), as T fi 1 and then N fi 1,
664 Bulletin
� Blackwell Publishing Ltd 2003

a. C 1=2N
ffiffiffiffiN
pT ðc
NT cÞA Nð0; IkÞ; where CN ¼ ðC 1=2
N ÞðC 1=2N Þ0 ¼
M 1N VNM
1N ; MN ¼ 1
6N
PNi¼1 Xvv;i; and VN ¼ 1
6N
PNi¼1 Xuu;iXvv;i:
b. DDNT CN !p
0, where DDNT is defined in Proposition 1(d).
Controlling for fixed effects results in a shrinkage of the sequential limit
asymptotic variance, compared to when there are no fixed effects. In the case
without fixed effects where ai ¼ 0 for all i, MN ¼ 12N
PNi¼1Xvv;i and
VN ¼ 12N
PNi¼1 Xuu;iXvv;i.
(ii) Fixed effects and heterogeneous trends
We now admit both individual-specific fixed effects and heterogeneous time
trends into the specification. Upon substitution of the projection representation
for the equilibrium error (6) into (1) (with ht ¼ 0 for all t) we have,
yit ¼ ai þ kit þ c0xit þ dizit þ uit: ð12Þ
The time-series average of equation (12) yields
1
T
XTt¼1yit ¼ ai þ ki
T þ 12
� �þ c0
1
T
XTt¼1xit þ d0i
1
T
XTt¼1zit þ
1
T
XTt¼1uit; ð13Þ
where we use the fact that 1TPTt¼1 t ¼ ðT þ 1Þ=2. To control for the fixed-
effects subtract equation (13) from equation (12) to get
~yyit ¼ ki~tt þ c0~xxit þ d0i~zzit þ ~uuit; ð14Þ
where again we use a ‘tilde’ to denote the deviation of an observation from its
time-series average,
~yyit ¼ yit 1
T
XTt¼1yit;
~xxit ¼ xit 1
T
XTt¼1xit;
~zzit ¼ zit 1
T
XTt¼1zit;
~uuit ¼ uit 1
T
XTt¼1uit;
~tt ¼ t T þ 12
:
665Cointegration vector estimation by panel DOLS and long-run money demand
� Blackwell Publishing Ltd 2003
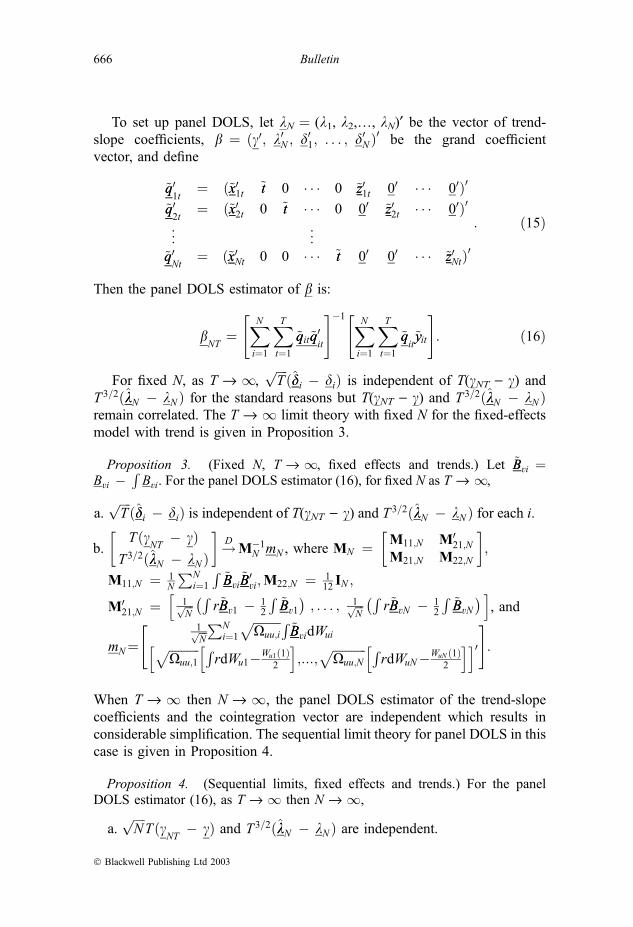
To set up panel DOLS, let kN ¼ (k1, k2,…, kN)¢ be the vector of trend-slope coefficients, b ¼ ðc0; k0N ; d01; . . . ; d0N Þ
0be the grand coefficient
vector, and define
~qq01t
¼ ð~xx01t ~tt 0 � � � 0 ~zz01t 00 � � � 00Þ0
~qq02t
¼ ð~xx02t 0 ~tt � � � 0 00 ~zz02t � � � 00Þ0
..
. ...
~qq0Nt
¼ ð~xx0Nt 0 0 � � � ~tt 00 00 � � � ~zz0NtÞ0
: ð15Þ
Then the panel DOLS estimator of b is:
bNT
¼XNi¼1
XTt¼1
~qqit~qq0it
" # 1 XNi¼1
XTt¼1
~qqit~yyit
" #: ð16Þ
For fixed N, as T fi 1,ffiffiffiffiT
pðddi diÞ is independent of T(cNT ) c) and
T 3=2ðkkN kN Þ for the standard reasons but T(cNT ) c) and T 3=2ðkkN kN Þremain correlated. The T fi 1 limit theory with fixed N for the fixed-effects
model with trend is given in Proposition 3.
Proposition 3. (Fixed N, T fi 1, fixed effects and trends.) Let ~BBvi ¼Bvi
RBvi. For the panel DOLS estimator (16), for fixed N as T fi 1,
a.ffiffiffiffiT
pðddi diÞ is independent of T(cNT ) c) and T 3=2ðkkN kN Þ for each i.
b.T ðc
NT cÞ
T 3=2ðkkN kN Þ
� �!D M 1
N mN , where MN ¼ M11;N M021;N
M21;N M22;N
� �;
M11;N ¼ 1N
PNi¼1
R~BBvi~BB
0vi;M22;N ¼ 1
12IN ;
M021;N ¼ 1ffiffiffi
Np
Rr~BBv1 1
2
R~BBv1
� �; . . . ; 1ffiffiffi
Np
Rr~BBvN 1
2
R~BBvN
� �h i, and
mN¼" 1ffiffiffi
Np
PNi¼1
ffiffiffiffiffiffiffiffiffiXuu;i
p R~BBvidWuih ffiffiffiffiffiffiffiffiffiffi
Xuu;1p R
rdWu1 Wu1ð1Þ2
h i;...;
ffiffiffiffiffiffiffiffiffiffiffiXuu;N
p RrdWuN WuN ð1Þ2
h ii0#:
When T fi 1 then N fi 1, the panel DOLS estimator of the trend-slopecoefficients and the cointegration vector are independent which results in
considerable simplification. The sequential limit theory for panel DOLS in this
case is given in Proposition 4.
Proposition 4. (Sequential limits, fixed effects and trends.) For the panelDOLS estimator (16), as T fi 1 then N fi 1,
a.ffiffiffiffiN
pT ðc
NT cÞ and T 3=2ðkkN kN Þ are independent.
666 Bulletin
� Blackwell Publishing Ltd 2003

b. C 1=2N
ffiffiffiffiN
pT ðc
NT cÞA Nð0; IkÞ, where CN ¼ ðC1=2
N ÞðC1=2N Þ0 ¼ M
111;N �
V11;NM 111;N , M11;N ¼ 1
6N
PNi¼1 Xvv;i; and V11;n ¼ 1
6N
PNi¼1 Xuu;iXvv;i:
c. DDNT CN !p
0, where DDNT ¼ M 1NT VVNTM
1NT , MNT ¼ 1
NT 2PNi¼1
PTt¼1 ~xxit~xx
0it; VVNT ¼ 1
NT 2PNi¼1
PTt¼1 XXuui~xxit~xx
0it; and XXuu;i is a consistent
estimator of Xuu,i
Notice that the sequential limit distribution forffiffiffiffiN
pT ðc
NT cÞ is
identical to that obtained in Proposition 2 in the absence of trends.
Construction of a Wald test under the sequential limit theory can proceed as
in section (i).
(iii) Fixed effects, heterogeneous trends, and common time effects
The asymptotic distribution theory that we employ requires that observations
are independent across individuals but in applications, one typically
encounters some degree of CSD. In this section we take up the complete
model (1) which allows us to model a limited form of CSD in which the
equilibrium error for each individual is driven in part by ht.Begin by substituting the projection representation for uyit into equation (1)
to get
yit ¼ ai þ kit þ ht þ c0xit þ d0izit þ uit: ð17Þ
Controlling for the common time effect requires an analysis of the cross-
sectional average of the observations. Because we admit heterogeneity in the
projection coefficients di across i, the resulting cross-sectional averages willinvolve sums such as
PNj¼1 d0jzjt which complicates estimation of the dj
coefficients. The estimation problem can be simplified by proceeding
sequentially and addressing the endogeneity correction separately from
cointegration vector estimation.
To do this, let yzit be the error from projecting each element of yit onto
nit ¼ ð1; t; z0itÞ0and xzit ¼ xit Uinit be the vector of projection errors from
projecting each element of xit onto nit, where Ui is a (k + 2) · pi matrix of
projection coefficients. Substituting the projection representations for yit and
xit into equation (17) gives
yzit ¼ c0xzit þ ht þ uit: ð18Þ
We now work with equation (18) as for the purposes of estimating and
drawing inference about c it is equivalent to equation (17). Now take the
cross-sectional average of equation (18) to get
667Cointegration vector estimation by panel DOLS and long-run money demand
� Blackwell Publishing Ltd 2003
1
N
XNj¼1yzjt ¼ c0
1
N
XNj¼1xzjt
" #þ ht þ
1
N
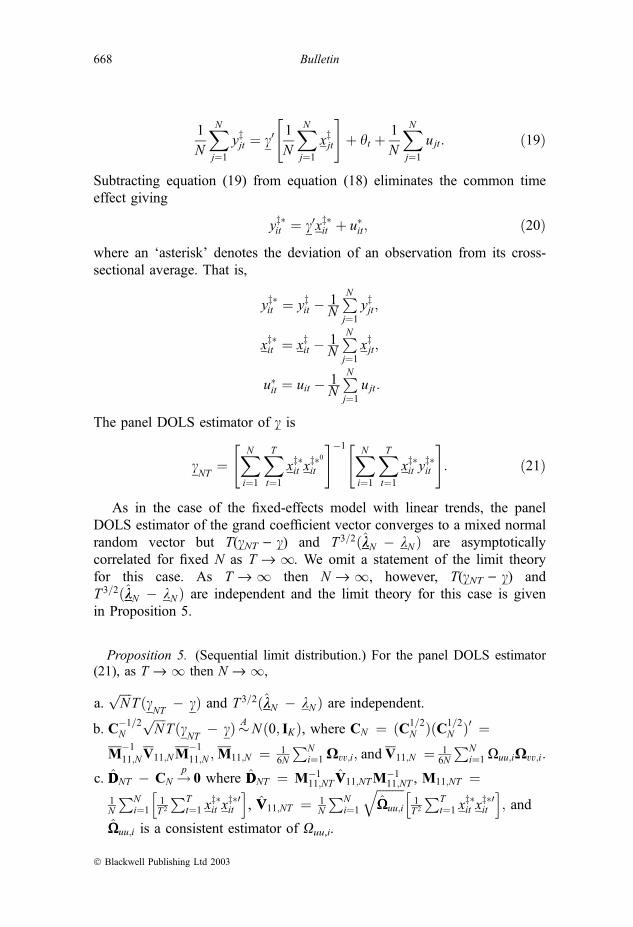
XNj¼1ujt: ð19Þ
Subtracting equation (19) from equation (18) eliminates the common time
effect giving
yz�it ¼ c0xz�it þ u�it; ð20Þ
where an ‘asterisk’ denotes the deviation of an observation from its cross-
sectional average. That is,
yz�it ¼ yzit 1NPNj¼1yzjt;
xz�it ¼ xzit 1NPNj¼1xzjt;
u�it ¼ uit 1NPNj¼1ujt:
The panel DOLS estimator of c is
cNT
¼XNi¼1
XTt¼1xz�it x
z�0it
" # 1 XNi¼1
XTt¼1xz�it y
z�it
" #: ð21Þ
As in the case of the fixed-effects model with linear trends, the panel
DOLS estimator of the grand coefficient vector converges to a mixed normal
random vector but T(cNT ) c) and T 3=2ðkkN kN Þ are asymptotically
correlated for fixed N as T fi 1. We omit a statement of the limit theoryfor this case. As T fi 1 then N fi 1, however, T(cNT ) c) and
T 3=2ðkkN kN Þ are independent and the limit theory for this case is givenin Proposition 5.
Proposition 5. (Sequential limit distribution.) For the panel DOLS estimator(21), as T fi 1 then N fi 1,
a.ffiffiffiffiN
pT ðc
NT cÞ and T 3=2ðkkN kN Þ are independent.
b. C 1=2N
ffiffiffiffiN
pT ðc
NT cÞA Nð0; IKÞ, where CN ¼ ðC1=2
N ÞðC1=2N Þ0 ¼
M 111;NV11;NM
111;N ; M11;N ¼ 1
6N
PNi¼1 Xvv;i; and V11;N ¼ 1
6N
PNi¼1Xuu;iXvv;i:
c. DDNT CN !p
0 where DDNT ¼ M 111;NT VV11;NTM
111;NT , M11;NT ¼
1N
PNi¼1
1T 2PTt¼1 x
z�it x
z�0it
h i, VV11;NT ¼ 1
N
PNi¼1
ffiffiffiffiffiffiffiffiffiXXuu;i
q1T 2PTt¼1 x
z�it x
z�0it
h i; and
XXuu;i is a consistent estimator of Xuu,i.
668 Bulletin
� Blackwell Publishing Ltd 2003
Notice that the limit distribution of Proposition 5 is identical to the
sequential limit distribution of Proposition 4. Controlling for fixed effects
again produces a shrinkage of the asymptotic variance, while controlling for
the common time effect requires taking the deviation from the cross-sectional
average. These cross-sectional transformations have no effect on the
sequential asymptotic variance of the estimator.
If the modifications to OLS are successful in removing the correlation
between the equilibrium error uyit and the leads and lags of Dxjt for j ¼ 1,…,Nbut the time-specific effects do not fully account for CSD, then the residual
cross-sectional correlation in the projection error uit changes only the formula
for the asymptotic standard errors.6 This is a feasible estimation strategy for a
small to moderate N. But if there remains a correlation between the
equilibrium error and the leads and lags of other equation Dxjt, i „ j, then
panel DOLS exhibits the same sort of second-order asymptotic bias as
pooled OLS as discussed in section II. For small to moderate N, a feasible
solution to this problem is to include leads and lags of Dxjt, j ¼ 1,…,N in theprojection (6).
We close this section by noting that for large N, modelling CSD in panel
data is itself an active area of research and one that has shown itself to be a
thorny problem. What one seeks in this case is a simple parametric structure
that does an adequate job of capturing the long-run covariance structure. Bai
and Ng (2001), Moon and Perron (2002), and Phillips and Sul (2002) study
models in which the error terms in dynamic panel data regressions have a
factor structure, but the implications for such factor models have not been
studied in the panel cointegration context.
IV. Monte-Carlo experiments
In this section, we present some Monte-Carlo experiments to investigate some
small sample properties of panel DOLS and to compare them with single-
equation DOLS in the presence of individual fixed effects and CSD.7 Our data
generating process (DGP) includes two regressors in the cointegrating relation
and is given by
6In this case, the asymptotic variance of panel DOLS is consistently estimated by�PTt¼1 XtX
0t
� 1�PTt¼1 XtXuu;TX
0��PTt¼1 XtX
0t
� 1where Xt ¼ (x1t,…, xNt) and Xuu,T is a consistent
estimator of the long-run covariance matrix of uit, i ¼ 1,…,N.7Kao and Chiang (2000) compared the small-sample performance of panel DOLS and panel fully
modified OLS with fixed effects in the case of a single regressor. They found that panel dynamic OLSperformed much better than panel fully modified OLS in removing finite sample bias so we do notinclude panel fully modified OLS in the comparison.
669Cointegration vector estimation by panel DOLS and long-run money demand
� Blackwell Publishing Ltd 2003

yit ¼ ai þ c1x1;it þ c2x2;it þ git;
Dx1;it ¼ ai þ v1;it;Dx2;it ¼ v2;it:
Letting wit ¼ (git, v1,it, v2,it)0, �it ¼ (�1,it, �2,it, �3,it)0, and eit ¼ (e1,it, e2,it, e3,it)
0,the short-run dynamics are given by
wit ¼ Aiwit 1 þ �it;
�it ¼ffiffiffiffi/
pht þ
ffiffiffiffiffiffiffiffiffiffiffiffi1 /
peit;
where for j ¼ 1, 2, 3, i ¼ 1,…,N, ej;it i:i:d:Nð0;r2jiÞ; ht ¼ ðh1t; h2t; h3tÞ0,hjt i:i:d:Nð0;r2hjÞ.We designed the DGP to provide a connection to the empirical work on
money demand of the next section, where the regressors are real income
(which has a drift), and the nominal interest rate (which does not).
Accordingly, we induce a trend into the cointegrating relation through the
drift term ai for the first regressor x1,it and specify the second regressor x2,it to
be a driftless I(1) process. In addition, we model the equilibrium error ai + git,to admit a more general form of CSD than the common time effect model
considered in the previous section.8 This single-factor model of the short-run
innovations is of the type considered by Phillips and Sul (2002). CSD in the
equilibrium errors is induced by h1t, while h2t and h3t induce cross-sectionalendogeneity between xj,kt and u
yit, j „ i, k ¼ 1, 2. These features were not
explicitly accounted for in the theoretical analysis, but may be encountered in
empirical work. In the presence of heterogeneous CSD, subtracting off the
cross-sectional average does not completely eliminate CSD. Our interest here
is in evaluating the seriousness of the resulting distortions. The degree of CSD
is modulated by the size of /.The true value of the cointegration vector is (c1, c2) ¼ (1.0, 0.1). For each
individual i, the values of ai, Ai, and rji are first obtained by a draw from
the uniform distribution then held fixed throughout the experiment. The
persistence in the short-run dynamics are controlled by varying the support of
the uniform distribution from which the elements of Ai are drawn. We
consider three levels of persistence and three alternative degrees of CSD.
Persistence levels can be low (A11,i U[0.3,0.5]), medium (A11,i U[0.5,0.7]), or
8In the common time effect specification, the cross-sectional correlation between individuals iand j is identical for all i, j. This homogeneous CSD is obtained here by setting A11,i to beidentical across i. That allowing for heterogeneity in A11,i results in heterogeneous CSD can beseen in the case of an AR(1) where A11,i ¼ qi and all other elements of Ai are set to 0. Then
it can be shown that Corrðgit; gjtÞ ¼ cij ¼ beij
ffiffiffiffiffiffiffiffiffi1 q2i
p ffiffiffiffiffiffiffiffiffi1 q2j
p1 qiqj
, where bij ¼E �1;it�1;jtð Þ
E �21;itð ÞE �2
1;jtð Þ� �1
2
¼/r2h1ffiffiffiffiffiffiffiffiffiffiffiffiffiffiffiffiffiffiffiffiffiffiffiffiffiffiffiffiffiffiffiffiffiffiffiffiffiffiffiffiffiffiffiffiffiffiffiffiffiffiffiffiffiffiffiffi
/r2h1 þð1 /Þr2ið Þ /r2h1 þð1 /Þr2jð Þp .
670 Bulletin
� Blackwell Publishing Ltd 2003

high (A11,i U[0.7,0.9]), and degrees of CSD are either none (/ ¼ 0), low
(/ ¼ 0.3) or high (/ ¼ 0.7). Assignment of the remaining parameter values are
determined by, A21,i U[)0.05,0.05], A12,i U[)0.05,0.05], A23,i U[)0.05,0.05],
A22,i U[0.0,0.4], A33,i U[0.0,0.04], ai U[23,53] · 10)3, r21i U½1;33� � 10 3,
r22i U½0:25;1:34� � 10 3, r23i U½2:3;57�, and r2hj ¼ ð1=NÞPNi¼1 r2ji. The
long-run variance Xuu,i is estimated by the prewhitened quadratic spectral
(QSPW) method suggested by Sul, Phillips and Choi (2002). Each experiment
consists of 5,000 random samples of T ¼ 40, 100, or 200 observations on
N ¼ 10 or 20 individuals. The number of leads and lags of Dxit included are2 (T ¼ 40), 3 (T ¼ 100), and 4 (T ¼ 200). We organize the experiments
according to the following three cases.
Case 1. (No CSD, Variable Persistence). Setting / ¼ 0 yields no CSD.Persistence levels are low, medium and high.
Case 2. (Homogeneous CSD and Persistence). Setting A11,i ¼ A11,j yields thehomogeneous CSD as in the common time effect specification. We consider highand low CSD and low, medium and high levels of persistence.
Case 3. (Heterogeneous CSD and Persistence). Allowing A11,i „ A11,j yieldsheterogeneous CSD. We consider high and low CSD and low, medium and highlevels of persistence.
We begin with the effective size of nominal 5% and 10% sized tests of the
hypothesis H0: c1 ¼ 1 and H0: c2 ¼ 0.1. To provide a point of comparison,
Table 1 displays the effective size of (single-equation) DOLS tests. Table 2
presents the panel DOLS size results for Case 1. Under low and medium
levels of persistence, the tests are reasonably sized. Size accuracy is seen to
TABLE 1
Effective size of DOLS tests
T Persistence
H0: c1 ¼ 1 H0: c2 ¼ 0.1
5% 10% 5% 10%
40 Low 0.097 0.152 0.093 0.148
Medium 0.118 0.179 0.114 0.174
High 0.179 0.241 0.175 0.239
100 Low 0.100 0.155 0.093 0.151
Medium 0.110 0.170 0.104 0.163
High 0.184 0.250 0.182 0.248
200 Low 0.067 0.128 0.067 0.124
Medium 0.071 0.132 0.074 0.127
High 0.117 0.181 0.114 0.180
671Cointegration vector estimation by panel DOLS and long-run money demand
� Blackwell Publishing Ltd 2003

improve with increasing sample size both in the time series as well as in the
cross-sectional dimensions. Under high levels of persistence, the test for c1remains reasonably sized but the test for c2 becomes slightly mis-sized. Thismis-sizing worsens somewhat as the cross-section increases (e.g. for T ¼ 100,
the 5% test has size of 16% for N ¼ 10 and 25% for N ¼ 20). In comparison
with DOLS, the test for c1 is better sized whereas the test for c2 is roughlyequivalent.
Table 3 reports the effective size of panel DOLS tests under Case 2. For a
low degree of CSD, the size of the test for c1 improves with persistence and isaccurate when the level of persistence is high.9 The length of the time series is
relatively unimportant. Similar results are obtained for the test on c2 under lowCSD. Under high CSD, there is some mis-sizing of the test on c1, which iscomparable with the size of the DOLS test. For the test on c2, size accuracyimproves with the size of the cross-section and overall size distortion is
modest.
Effective size performance of panel DOLS tests under Case 3, shown in
Table 4, is very similar to that under Case 2. Subtracting off the cross-sectional
average works reasonably well as a control for the heterogeneous CSD
considered here.
Table 5 reports quantiles of cc1 from DOLS and panel DOLS under Case 3.Here, it is seen that dramatic precision gains over single-equation DOLS can
be attained in small samples. For T ¼ 40, N ¼ 10 under high persistence and
high CSD, the inter-95 percentile range for DOLS is ()0.304; 2.495) while for
TABLE 2
Effective size of panel DOLS tests. Case 1: No CSD, variable persistence
T Persistence
H0: c1 ¼ 1 H0: c2 ¼ 0.1
N ¼ 10 N ¼ 20 N ¼ 10 N ¼ 20
5% 10% 5% 10% 5% 10% 5% 10%
40 Low 0.092 0.154 0.087 0.142 0.096 0.156 0.082 0.142
Medium 0.076 0.133 0.065 0.126 0.103 0.169 0.104 0.167
High 0.056 0.098 0.039 0.074 0.110 0.180 0.155 0.237
100 Low 0.072 0.122 0.059 0.109 0.071 0.126 0.064 0.118
Medium 0.062 0.111 0.054 0.106 0.080 0.136 0.072 0.127
High 0.051 0.093 0.042 0.091 0.113 0.184 0.159 0.250
200 Low 0.060 0.105 0.060 0.110 0.058 0.113 0.064 0.115
Medium 0.059 0.102 0.058 0.108 0.062 0.121 0.067 0.117
High 0.045 0.097 0.044 0.085 0.090 0.167 0.147 0.228
9This is largely a feature of Sul, Phillips and Choi’s (2002) QSPW estimator of the long-runvariance which works well under high persistence.
672 Bulletin
� Blackwell Publishing Ltd 2003

panel DOLS is (0.883; 1.152). Precision gains continue to accrue when
T ¼ 200. For N ¼ 10, under high persistence and high CSD, the panel DOLS
inter-95 percentile range of (0.979; 1.028) whereas for DOLS it is (0.89;
1.122). Precision advantages are also seen to accrue from enlarging the cross-
sectional dimension. Under high persistence and high CSD, T ¼ 40, the inter-
95 percentile range shrinks from (0.883; 1.152) for N ¼ 10 to (0.924; 1.102)
for N ¼ 20.
Table 6 displays analogous quantile information for cc2. Here, the benefitsfrom the cross-section dimension are largely obtained with N ¼ 10. For
T ¼ 40, under high persistence and CSD, the inter-95 percentile range of
panel DOLS is (0.096; 0.110), which is an improvement over the (0.054;
0.170) range for DOLS.
We summarize the Monte-Carlo results with four general observations.
First, for given T, the empirical size of the panel DOLS t-tests worsens slightly
when N is increased from 10 to 20. Secondly, size distortion, while not
particularly severe at T ¼ 40 is reasonably small at T ¼ 200. Thirdly,
subtracting the cross-sectional average to control for CSD works reasonably
TABLE 3
Effective size of panel DOLS tests. Case 2: homogeneous CSD
T CSD Persistence
H0: c1 ¼ 1 H0: c2 ¼ 0.1
N ¼ 10 N ¼ 20 N ¼ 10 N ¼ 20
5% 10% 5% 10% 5% 10% 5% 10%
40 Low Low 0.103 0.160 0.111 0.182 0.106 0.165 0.091 0.157
Medium 0.087 0.147 0.088 0.150 0.127 0.201 0.083 0.142
High 0.069 0.113 0.051 0.092 0.165 0.245 0.069 0.117
100 Low Low 0.067 0.128 0.079 0.136 0.073 0.129 0.065 0.117
Medium 0.063 0.118 0.073 0.124 0.084 0.143 0.059 0.113
High 0.050 0.094 0.053 0.098 0.140 0.227 0.067 0.129
200 Low Low 0.068 0.131 0.063 0.115 0.074 0.128 0.050 0.098
Medium 0.068 0.122 0.057 0.110 0.075 0.127 0.045 0.090
High 0.047 0.098 0.046 0.097 0.120 0.204 0.053 0.103
40 High Low 0.105 0.167 0.161 0.234 0.168 0.240 0.199 0.267
Medium 0.096 0.152 0.131 0.210 0.167 0.246 0.151 0.217
High 0.065 0.112 0.082 0.139 0.155 0.230 0.088 0.135
100 High Low 0.094 0.155 0.133 0.206 0.100 0.161 0.124 0.195
Medium 0.087 0.147 0.123 0.186 0.113 0.179 0.113 0.178
High 0.064 0.115 0.107 0.173 0.150 0.241 0.098 0.161
200 High Low 0.102 0.164 0.130 0.198 0.089 0.145 0.091 0.146
Medium 0.105 0.163 0.128 0.200 0.090 0.152 0.083 0.144
High 0.087 0.147 0.124 0.191 0.134 0.216 0.080 0.144
673Cointegration vector estimation by panel DOLS and long-run money demand
� Blackwell Publishing Ltd 2003

well even in the presence of heterogenous CSD. Fourthly, panel DOLS is
much more precise than single-equation DOLS.
V. Long-run money demand
We now employ panel DOLS to estimate coefficients of the long-run M1
demand function. Economists have long been interested in obtaining precise
estimates of money demand for at least two reasons. First, knowing the
income elasticity of money demand helps in determining the rate of
monetary expansion that is consistent with long-run price level stability.
Secondly, knowing the interest elasticity of money demand aids in calculating
the area under the demand curve and to assess the welfare costs of long-run
inflation (Baily, 1956). Additionally, because a stable money-demand func-
tion is a building block of the IS-LM model, economists have historically
been interested in knowing how well this particular aspect of the model
performed. While this motive has become less important in the era of
dynamic general equilibrium models, Lucas (1988) shows that such a
TABLE 4
Effective size of panel DOLS tests. Case 3: heterogeneous CSD
T CSD Persistence
H0: c1 ¼ 1 H0: c2 ¼ 0.1
N ¼ 10 N ¼ 20 N ¼ 10 N ¼ 20
5% 10% 5% 10% 5% 10% 5% 10%
40 Low Low 0.104 0.161 0.101 0.166 0.098 0.159 0.091 0.156
Medium 0.083 0.134 0.082 0.140 0.109 0.172 0.096 0.155
High 0.059 0.104 0.050 0.085 0.131 0.198 0.124 0.198
100 Low Low 0.075 0.134 0.082 0.140 0.071 0.128 0.068 0.123
Medium 0.069 0.121 0.076 0.131 0.085 0.144 0.077 0.132
High 0.051 0.099 0.051 0.099 0.112 0.187 0.138 0.229
200 Low Low 0.042 0.092 0.061 0.113 0.040 0.088 0.055 0.105
Medium 0.040 0.082 0.057 0.112 0.046 0.088 0.056 0.104
High 0.040 0.076 0.042 0.091 0.066 0.131 0.110 0.190
40 High Low 0.114 0.172 0.147 0.217 0.152 0.221 0.206 0.283
Medium 0.094 0.142 0.118 0.190 0.147 0.215 0.167 0.234
High 0.058 0.098 0.053 0.094 0.142 0.213 0.089 0.147
100 High Low 0.098 0.165 0.138 0.202 0.098 0.165 0.137 0.207
Medium 0.088 0.141 0.131 0.199 0.108 0.173 0.131 0.191
High 0.061 0.110 0.082 0.138 0.146 0.225 0.095 0.159
200 High Low 0.090 0.150 0.128 0.199 0.068 0.119 0.102 0.164
Medium 0.088 0.147 0.145 0.207 0.074 0.131 0.102 0.166
High 0.070 0.124 0.119 0.190 0.108 0.188 0.087 0.145
674 Bulletin
� Blackwell Publishing Ltd 2003

neoclassical model with a cash in advance constraint generates a standard
money demand function.
We follow Stock and Watson (1993), Ball (2001), and Hoffman et al.
(1995) and approach long-run money demand as a cointegrating relationship.
Our analysis suggests that instability exhibited by time-series estimates from
the literature do not reflect underlying shifts in behavioural relationships
but instead indicate inherent difficulties associated with estimation using
TABLE 5
Quantiles for first regressor slope (Case 3): panel DOLS and DOLS
CSD Persistence
DOLS (N ¼ 10) Panel DOLS (N ¼ 10) Panel DOLS (N ¼ 20)
2.5% 50% 97.5% 2.5% 50% 97.5% 2.5% 50% 97.5%
T ¼ 40
None Low 0.460 0.999 1.512 0.952 1.001 1.048 0.976 1.000 1.025
Med 0.225 0.999 1.769 0.934 1.001 1.070 0.967 1.002 1.038
High )0.192 1.010 2.420 0.890 1.007 1.137 0.937 1.008 1.078
Low Low 0.456 0.999 1.529 0.951 1.000 1.052 0.973 1.000 1.029
Med 0.206 0.996 1.782 0.931 1.001 1.075 0.963 1.003 1.044
High )0.259 1.006 2.435 0.882 1.010 1.150 0.936 1.011 1.090
High Low 0.432 0.999 1.536 0.956 1.000 1.047 0.971 1.000 1.031
Med 0.181 0.996 1.783 0.936 1.001 1.073 0.960 1.003 1.049
High )0.304 1.004 2.495 0.883 1.011 1.152 0.924 1.012 1.102
T ¼ 100
None Low 0.906 1.000 1.094 0.988 1.000 1.012 0.994 1.000 1.006
Med 0.852 1.000 1.146 0.982 1.000 1.018 0.991 1.000 1.010
High 0.692 1.002 1.347 0.966 1.003 1.039 0.981 1.002 1.022
Low Low 0.904 1.000 1.095 0.985 1.000 1.016 0.991 1.000 1.009
Med 0.850 1.000 1.150 0.978 1.000 1.023 0.988 1.001 1.014
High 0.682 1.001 1.369 0.961 1.005 1.052 0.978 1.004 1.030
High Low 0.901 1.000 1.099 0.986 1.000 1.014 0.991 1.000 1.009
Med 0.847 0.999 1.154 0.978 1.000 1.022 0.987 1.001 1.015
High 0.666 1.000 1.378 0.957 1.005 1.056 0.974 1.004 1.036
T ¼ 200
None Low 0.970 1.000 1.029 0.996 1.000 1.004 0.998 1.000 1.002
Med 0.955 1.000 1.045 0.994 1.000 1.006 0.997 1.000 1.004
High 0.898 1.000 1.107 0.987 1.001 1.014 0.993 1.000 1.008
Low Low 0.970 1.000 1.030 0.993 1.000 1.007 0.996 1.000 1.004
Med 0.955 1.000 1.047 0.990 1.000 1.010 0.995 1.000 1.006
High 0.895 1.000 1.117 0.983 1.002 1.024 0.991 1.001 1.012
High Low 0.969 1.000 1.031 0.994 1.000 1.006 0.996 1.000 1.004
Med 0.952 1.000 1.048 0.990 1.000 1.010 0.994 1.000 1.007
High 0.890 1.001 1.122 0.979 1.002 1.028 0.987 1.002 1.018
675Cointegration vector estimation by panel DOLS and long-run money demand
� Blackwell Publishing Ltd 2003

relatively short sample spans in environments with persistent short-run
dynamics. Combining observations across countries allows us to obtain
relatively sharp and stable estimates of money demand elasticities and the
panel cointegration approach seems well suited to take up King’s (1988)
suggestion to extend the money-demand analysis beyond the US. In his
words, ‘the results of such investigations would provide us with sharper
estimates of the long run values of Friedman’s (1956) ‘‘‘numerical constants
TABLE 6
Quantiles for second regressor slope (Case 3): panel DOLS and DOLS
CSD Persistence
DOLS (N ¼ 10) Panel DOLS (N ¼ 10) Panel DOLS (N ¼ 20)
2.5% 50% 97.5% 2.5% 50% 97.5% 2.5% 50% 97.5%
T ¼ 40
None Low 0.072 0.100 0.129 0.098 0.100 0.102 0.099 0.100 0.101
Med 0.065 0.101 0.142 0.098 0.100 0.103 0.098 0.100 0.101
High 0.050 0.105 0.172 0.097 0.102 0.107 0.094 0.098 0.101
Low Low 0.075 0.100 0.127 0.098 0.100 0.102 0.099 0.100 0.101
Med 0.068 0.101 0.140 0.098 0.101 0.103 0.098 0.100 0.102
High 0.052 0.105 0.172 0.097 0.102 0.108 0.094 0.098 0.102
High Low 0.076 0.100 0.126 0.098 0.100 0.102 0.098 0.100 0.102
Med 0.069 0.101 0.139 0.097 0.101 0.104 0.097 0.100 0.103
High 0.054 0.105 0.170 0.096 0.103 0.110 0.092 0.098 0.104
T ¼ 100
None Low 0.093 0.100 0.107 0.099 0.100 0.101 0.100 0.100 0.100
Med 0.091 0.100 0.111 0.099 0.100 0.101 0.099 0.100 0.100
High 0.085 0.102 0.128 0.099 0.101 0.102 0.098 0.099 0.101
Low Low 0.094 0.100 0.106 0.099 0.100 0.101 0.100 0.100 0.100
Med 0.092 0.100 0.110 0.099 0.100 0.101 0.099 0.100 0.101
High 0.086 0.102 0.125 0.099 0.101 0.103 0.098 0.099 0.101
High Low 0.094 0.100 0.106 0.099 0.100 0.101 0.099 0.100 0.101
Med 0.092 0.100 0.110 0.099 0.100 0.101 0.099 0.100 0.101
High 0.087 0.102 0.124 0.099 0.101 0.104 0.097 0.099 0.101
T ¼ 200
None Low 0.097 0.100 0.103 0.100 0.100 0.100 0.100 0.100 0.100
Med 0.096 0.100 0.105 0.100 0.100 0.100 0.100 0.100 0.100
High 0.094 0.101 0.113 0.100 0.100 0.101 0.099 0.100 0.100
Low Low 0.102 0.100 0.098 0.100 0.100 0.100 0.100 0.100 0.100
Med 0.103 0.100 0.096 0.100 0.100 0.100 0.100 0.100 0.100
High 0.105 0.099 0.089 0.100 0.100 0.099 0.101 0.100 0.100
High Low 0.102 0.100 0.098 0.100 0.100 0.100 0.100 0.100 0.100
Med 0.103 0.100 0.096 0.100 0.100 0.099 0.100 0.100 0.100
High 0.105 0.099 0.090 0.101 0.099 0.098 0.101 0.100 0.099
676 Bulletin
� Blackwell Publishing Ltd 2003

of monetary behavior’’’ when we approach the difficult problem of the short
run demand for money’’.
The equation that we estimate is,
lnMitPit
� �¼ ai þ kit þ ht þ cy ln Yit þ crRit þ u
yit ð22Þ
for i ¼ 1,… , 19, where Mit is an M1 measure of money, Pit is the price level,
Yit is real GDP, and Rit is a nominal short-term interest rate. Data definitions
and sources are available in the unpublished appendix. In addition to country
specific effects, ai, we allow for possibly heterogeneous linear trends and
common time effects. These trends are included to capture changes in the
financial technology that affects money demand independent of income and
the opportunity cost of holding money.
(i) Pre-testing: cointegration and homogeneity restrictions
Panel DOLS estimation of equation (22) requires that the equilibrium errors
are stationary and that the cointegrating vectors for each country must be
identical. To investigate the stationarity of the equilibrium errors, we employ
Pedroni’s (1999) panel-t test. This results in the rejection of the null
hypothesis of no cointegration at the 0.1% level whether heterogeneous linear
trends and common time effects are included or not.10
Next, we conduct a Wald test of the homogeneity restrictions on the
cointegrating vector. When trends are omitted from the regression, the evi-
dence against homogeneity is mixed. The asymptotic test rejects the restric-
tions in this case, but in some unreported Monte-Carlo experiments, we found
moderate size distortion in the Wald test for sample sizes of N ¼ 19 and
T ¼ 40. Using a size adjustment from these experiments, the homogeneity
restrictions on income is rejected at the 5% level but not for the interest rate
(P ¼ 0.30). However, when we impose homogeneity on the interest rate
slope, the test for slope homogeneity on income is not rejected (P ¼ 0.70).
When heterogeneous linear trends are included, the evidence supporting
homogeneity strengthens. Here, we obtain a P-value of 0.63 for the test of
homogeneity on the income coefficient and a P-value of 0.22 for the test
of homogeneity on the interest rate coefficient.
10We also confirmed these cointegration test results by using Im, Pesaran and Shin (1997) andMaddala and Wu (1999) panel unit root tests under the assumption that the cointegrating vector isknown to be (1, )1.0,0.05). The justification for using these values is that 1.0 is a typical value of theincome elasticity estimated in the literature while a common estimate of the interest rate semielasticity )0.05.
677Cointegration vector estimation by panel DOLS and long-run money demand
� Blackwell Publishing Ltd 2003

(ii) Comparison between single-equation and panel DOLS estimates
Our panel DOLS estimates use two leads and two lags of D ln Yit and DRit inthe regressions. Point estimates and asymptotic standard errors are reported in
Table 7.
Single-equation DOLS estimates are seen to display such cross-sectional
variability that they are difficult to interpret. In DOLS regressions without
trend, the income elasticities are all positive, ranging from 0.134 (Belgium) to
a whopping 2.64 (Norway), but the interest semi-elasticity has the wrong sign
for Belgium, France, Ireland, and Japan. When a trend is included in the
regression, income elasticity estimates are negative for Finland, Iceland,
Norway, and New Zealand, and interest semi-elasticity estimates are positive
for Finland, France, and Iceland. If we maintain an underlying belief that
the financial systems and transactions technologies across modern economies
are essentially similar, the cross-sectional variability in these estimates must
reflect the inherent difficulty of obtaining good estimates rather than evidence
of disparate economic behavior.
TABLE 7
Single-equation and panel dynamic OLS estimates of long-run money demand
Country
No trend With trend
ccy (s.e.) ccR (s.e.) ccy (s.e.) ccR (s.e.) Trend
Austria 0.901 (0.139) )0.009 (0.029) 1.552 (0.349) )0.037 (0.026) )0.001Belgium 0.134 (0.218) 0.009 (0.039) 1.183 (0.444) )0.033 (0.026) 0.002
Denmark 1.460 (0.170) )0.043 (0.009) 0.684 (0.321) )0.036 (0.006) 0.009
Finland 1.019 (0.634) )0.006 (0.114) )0.740 (0.881) 0.009 (0.011) )0.005France 0.677 (0.213) 0.010 (0.020) 0.842 (0.699) 0.004 (0.031) 0.003
Germany 1.548 (0.033) )0.019 (0.008) 1.691 (0.197) )0.023 (0.009) 0.003
Iceland 0.594 (0.161) )0.010 (0.005) )0.451 (1.093) )0.004 (0.008) 0.004
Ireland 0.507 (0.169) 0.022 (0.022) 1.670 (2.805) 0.015 (0.029) 0.005
Netherlands 1.112 (0.111) )0.045 (0.020) 0.309 (0.415) )0.011 (0.022) 0.003
Norway 2.641 (0.450) )0.160 (0.046) )0.676 (2.154) )0.092 (0.060) 0.013
Portugal 0.517 (0.136) )0.037 (0.017) 1.624 (0.379) )0.043 (0.011) 0.010
Spain 1.203 (0.091) )0.030 (0.008) 1.203 (0.190) )0.030 (0.009) 0.003
Switzerland 1.020 (0.208) )0.062 (0.021) 1.447 (0.482) )0.053 (0.021) 0.011
UK 1.738 (0.097) )0.089 (0.008) 2.128 (0.726) )0.089 (0.008) 0.016
Japan 0.889 (0.599) 0.009 (0.200) 1.798 (0.415) )0.076 (0.061) 0.016
Australia 0.926 (0.136) )0.043 (0.012) 0.068 (0.329) )0.048 (0.007) 0.002
New Zealand 1.349 (0.539) )0.076 (0.026) )1.233 (1.149) )0.084 (0.018) )0.001Canada 1.245 (0.219) )0.057 (0.024) 2.420 (0.903) )0.078 (0.024) )0.013US 0.428 (0.074) )0.035 (0.008) 1.022 (0.417) )0.039 (0.007) )0.001
Panel 0.860 (0.092) )0.020 (0.007) 1.079 (0.264) )0.022 (0.006) —
Panela 0.820 (0.105) )0.017 (0.005) 0.986 (0.336) )0.016 (0.005) —
Note: aControls for common time effect.
678 Bulletin
� Blackwell Publishing Ltd 2003

Panel DOLS estimates are shown at the bottom of Table 7. When the panel
regression omits trends, we estimate 0.86 (asymptotic s.e. ¼ 0.09) and the
interest semi-elasticity to be )0.02 (asymptotic s.e. ¼ 0.01). When we include
heterogeneous trends, we estimate the income elasticity to be 1.08 (asymptotic
s.e. ¼ 0.26) and the interest semi-elasticity to be )0.02 (asymptotic
s.e. ¼ 0.01). Results obtained from controlling for CSD are very similar.
To further illustrate the problem of estimation instability in the time
dimension, we constructed recursive single-equation DOLS coefficient
estimates for the US, UK, France, and Japan and panel DOLS for all 19
countries. Recursive DOLS estimates from 1979 to 1995 for both the income
elasticity and interest semi-elasticity exhibit substantially more variability than
the recursive panel DOLS estimates and in several instances even change sign.
These results are also contained in the unpublished appendix.
VI. Conclusions
Heterogeneity and persistence in short-run dynamics can create substantial
variability in single-equation cointegration vector point estimates. The result is
that these estimators can be quite sensitive to the particular time span of the
observations as well as to the particular individual being studied. This small
sample fragility can be encountered in spite of the superconsistency of these
estimators.
In these environments, panel DOLS can provide much more precise
estimates. Panel DOLS is straightforward to compute and relevant test
statistics have standard asymptotic distributions. The asymptotic distributions
were found to provide reasonably close approximations to the exact sampling
distributions in small samples.
We applied the panel DOLS method to estimate the long-run money
demand function using a panel of 19 countries with annual data from 1957 to
1996. The estimates in which we have the most confidence are an income
elasticity near 1 and an interest rate semi-elasticity of )0.02.
Final Manuscript received: April 2003
References
Baba, Y., Hendry, D. F. and Starr, R. M. (1992). ‘The demand for M1 in the U.S.A., 1960–
1988’, Review of Economic Studies, Vol. 59, pp. 25–61.
Bai, J. and Ng, S. (2001). ‘Determining the number of factors in approximate factor models’,
Econometrica, Vol. 70, pp. 191–221.
Bailey, M. J. (1956). ‘The welfare cost of inflationary finance’, Journal of Political Economy,
Vol. 64, pp. 93–110.
679Cointegration vector estimation by panel DOLS and long-run money demand
� Blackwell Publishing Ltd 2003

Ball, L. (2001). ‘Another look at long-run money demand’, Journal of Monetary Economics,
Vol. 47, pp. 37–44.
Friedman, M. (1956). ‘The quantity theory of money – a restatement’, in Friedman M. (ed.),
Studies in the Quantity Theory of Money, University of Chicago Press, Chicago.
Gandolfi, A. E. and Lothian, J. R. (1976). ‘The demand for money from the great depression to
the present’, American Economic Review, Vol. 66, pp. 46–51.
Hoffman, D. L., Rasche, R. H. and Tieslau, M. A. (1995). ‘The stability of long-run money
demand in five industrial countries’, Journal of Monetary Economics, Vol. 35, pp. 317–339.
Im, K. S., Pesaran, M. H. and Shin, Y. (1997). Testing for Unit Roots in Heterogeneous Panels,
Discussion Paper, University of Cambridge, Cambridge.
Inder, B. (1993). ‘Estimating long-run relationships in economics: a comparison of different
approaches’, Journal of Econometrics, Vol. 57, pp. 53–68.
Kao, C. and Chiang, M.-H. (2000). ‘On the estimation and inference of a cointegrated
regression in panel data’, in Baltagi B. H. (ed.), Advances in Econometrics: Nonstationary
Panels, Panel Cointegration and Dynamic Panels, Vol. 15, pp. 179–222.
King, R. G. (1988). Money Demand in the United States: A Quantitative Review: A Comment,
Carnegie-Rochester Conference Series on Public Policy, Vol. 29, pp. 169–172.
Lucas, R. E. Jr (1988). Money Demand in the United States: A Quantitative Review, Carnegie-
Rochester Conference Series on Public Policy, Vol. 29, pp. 137–168.
Maddala, G. S. and Wu, S. (1999). ‘A comparative study of unit root tests with panel data and a
new simple test’, Oxford Bulletin of Economics and Statistics, Vol. 61, pp. 631–652.
Meltzer, A. H. (1963). ‘The demand for money: a cross-section study of business firms’,
Quarterly Journal of Economics, Vol. 77, pp. 405–422.
Moon, H. R. and Perron, P. (2002). ‘Testing for a unit root in panels with dynamic factors’,
University of Southern California, mimeo.
Mulligan, C. B. (1997). ‘Scale economies, the value of time, and the demand for money:
longitudinal evidence from firms’, Journal of Political Economy, Vol. 105, pp. 1061–1079.
Mulligan, C. B. and Sala-i-Martin, X. (1992). ‘U.S. money demand: surprising cross-sectional
estimates’, Brookings Papers on Economic Activity, No. 2, pp. 285–329.
Pedroni, P. (1997). ‘Fully modified OLS for heterogeneous cointegrated panels and the case of
purchasing power parity’, Department of Economics, Indiana University, mimeo.
Pedroni, P. (1999). ‘Critical values for cointegration tests in heterogeneous panels with multiple
regressors’, Oxford Bulletin of Economics and Statistics, Vol. 61, pp. 653–670.
Phillips, P. C. B. and Moon, H. R. (1999). ‘Linear regression limit theory for nonstationary
panel data’, Econometrica, Vol. 67, pp. 1057–1111.
Phillips, P. C. B. and Moon, H. R. (2000). ‘Nonstationary panel data analysis: an overview of
some recent development’, Econometric Reviews, Vol. 19, pp. 263–286.
Phillips, P. C. B. and Sul, D. (2002). ‘Dynamic panel estimation and homogeneity testing under
cross section dependence’, Yale University, mimeo.
Saikkonen, P. (1991). ‘Asymptotically efficient estimation of cointegration regressions’,
Econometric Theory, Vol. 7, pp. 1–21.
Stock, J. H. and Watson, M. W. (1993). ‘A simple estimator of cointegrating vectors in higher
order integrated systems’, Econometrica, Vol. 61, pp. 783–820.
Sul, D., Phillips, P. C. B. and Choi, C.-Y. (2002). ‘Prewhitening Bias in HAC Estimation’, Yale
University, mimeo.
680 Bulletin
� Blackwell Publishing Ltd 2003